 Open Access Article
Fabrication of novel ternary g-C3N4/Zn0.5Ni0.5Fe1.8Mn0.2O4/rGO hybrid nanocomposites for humidity sensing†
Moksodur
Rahman
 a,
Md. Lutfor
Rahman
 *a,
Bristy
Biswas
a,
Md. Farid
Ahmed
a,
Md. Aftab
Ali Shaikh
ab,
Shirin Akter
Jahan
a and
Nahid
Sharmin
a
aInstitute of Glass and Ceramic Research and Testing (IGCRT), Bangladesh Council of Scientific and Industrial Research (BCSIR), Dhanmondi, Dhaka 1205, Bangladesh. E-mail: lutforrahman@bcsir.gov.bd; lutforju33@yahoo.com
bDepartment of Chemistry, University of Dhaka, Dhaka 1000, Bangladesh
First published on 4th February 2025
Abstract
This research focuses on the fabrication of novel ternary g-C3N4/Zn0.5Ni0.5Fe1.8Mn0.2O4/rGO hybrid nanocomposites (NCs) for humidity sensing applications. The integration of carbon based two dimensional (2D) materials—reduced graphene oxide (rGO) and graphitic carbon nitride (g-C3N4)—with spinel ferrite nanoparticles (Zn0.5Ni0.5Fe1.8Mn0.2O4) in a ternary configuration aims to exploit their distinct properties synergistically, enhancing humidity sensing capabilities. Zn0.5Ni0.5Fe1.8Mn0.2O4, Zn0.5Ni0.5Fe1.8Mn0.2O4/rGO, and g-C3N4/Zn0.5Ni0.5Fe1.8Mn0.2O4 have been synthesized for comparison. The study involves the synthesis process, structural characterization, and evaluation of humidity sensing performance. X-ray peak profiling reveals that the crystallite sizes of the composites are ∼10–14 nm, whereas the particle size range is 6–25 nm from transmission electron microscopy. The XPS survey of the NCs has shown good interaction with water molecules by adsorption processes, which indicates the suitability of the materials for humidity sensing. The dielectric and magnetic properties of the NCs were studied in detail. The fabricated nanocomposites exhibit promising results, showing sensitivity to varying humidity levels of 11–98% with good response and recovery characteristics. The investigation into the nanoscale interactions between different components seeks to elucidate the mechanisms underlying the enhanced sensing properties, with potential applications in environmental monitoring, healthcare, and consumer electronics.
1. Introduction
The growing demand for precise humidity sensing technology has surged across industries and scientific fields. Monitoring humidity is vital for applications like environmental issues, agriculture, food preservation, industry, and healthcare.1,2 Researchers are striving to create advanced humidity sensors with improved sensitivity, rapid response, low power usage, and stability.3,4 Ternary nanocomposites are particularly notable due to their synergistic effects, offering enhanced sensing performance and garnering significant interest in humidity sensing research.5As one of the major components of ternary nanocomposites, nanoferrites, specifically the MFe2O4 type (where M represents a bivalent transition metal cation), have garnered significant attention because of their multifunctional characteristics and potential in diverse fields. MFe2O4 type nanoferrites exhibit fascinating magnetic and electrical properties, chemical stability, and low bandgap energy, which make them suitable candidates for a wide range of applications such as magnetic materials,6–8 gas sensors,9 catalysts,10 photocatalysts,11–13 lithium battery materials,14–16 absorbent materials,17 and drug delivery.18 These materials possess a cubic spinel crystal structure, composed of two distinct interpenetrating sublattices (tetrahedral and octahedral sites), offering room for manipulation and enabling tailoring of their properties through compositional modifications.19,20
Among the carbon based two-dimensional materials; firstly, graphitic carbon nitride (g-C3N4) is a 2D material that has sparked significant interest in various scientific disciplines.21,22 As a derivative of organic compounds, g-C3N4 boasts a unique structure composed of nitrogen-rich aromatic rings, resembling a two-dimensional semiconductor.23 The potential of 2D metal-free materials, especially graphitic carbon nitride (g-C3N4), as efficient photocatalysts is notable due to their excellent optoelectronic properties, high thermal stability, and tunable bandgap. While incorporating magnetic materials and combining g-C3N4 with metal oxides in heterojunction structures enhance photocatalytic performance, their application in the sensing sector remains underexplored, requiring further research.24–27 For humidity sensors, g-C3N4 offers significant potential as well. Its high surface area, tunable energy bandgap, and stability in various media make it a suitable material for sensing applications. By incorporating g-C3N4 with metal oxides or other semiconductors, it is possible to enhance its sensitivity and selectivity towards humidity changes. Additionally, the tunable electronic properties and high conductivity of g-C3N4 enable faster response times in humidity sensing, making it an excellent candidate for the development of advanced humidity sensors that are efficient, stable, and cost-effective.
Secondly, reduced graphene oxide (rGO) is also a remarkable derivative of graphene, a single layer of carbon atoms arranged in a two-dimensional honeycomb lattice.28 With its unique combination of exceptional conductivity, surface area, and mechanical strength, rGO has gained attention across a spectrum of applications, from electronics and energy storage to sensors and composite materials.29–31
Hasan et al. investigated the humidity response of ZnFe2O4 and NiFe2O4 obtained by a sol–gel auto-combustion route.32 According to their findings, ZnFe2O4 nanoparticles are more sensitive to humidity and exhibit excellent stability for 90 days. Zhang et al. fabricated a ZnFe2O4/rGO gas sensor by a one-step microwave-assisted solvothermal technique. They reported that the ZnFe2O4/rGO sensor with a 4 h exposure time displayed a better sensing response at 210 °C with good stability, quick response, and recovery to ethanol due to its unique structure.33
In particular, the Zn0.5Ni0.5Fe2O4 ferrite compound stands out as a promising candidate due to its intricate combination of transition metals and its potential to exhibit remarkable electrical, magnetic, and catalytic attributes.18,34–36 Arjmand et al. investigated the multilayer structures of a Zn0.5Ni0.5Fe2O4/rGO/PVDF nanocomposite, proposing a novel electromagnetic interference (EMI) absorber utilizing a multilayer assembly of polyvinylidene fluoride sheets with rGO and ZnNiFe, demonstrating a record-high absorption coefficient of 0.91 and attributing the superior absorbance to multiple internal reflections and the supermagnetic properties of ZnNiFe nanoparticles.37
In this context, this research article delves into the fabrication and characterization of a unique class of nanocomposites, specifically focusing on the synthesis of ternary g-C3N4/Zn0.5Ni0.5Fe1.8Mn0.2O4/rGO structures for humidity sensing applications. The integration of graphene-based nanomaterials (rGO), metal oxide nanoparticles (Zn0.5Ni0.5Fe1.8Mn0.2O4), and carbon nitride (g-C3N4) in a ternary configuration holds the promise of combining their distinct properties to create a multifunctional material with improved humidity sensing capabilities.
This article aims to present a comprehensive exploration of the fabrication process, structural characterization, and humidity sensing performance of the hybrid nanocomposites. By investigating the interactions between the different components at the nanoscale level, the researchers seek to unravel the mechanisms underlying the enhanced sensing properties exhibited by these novel materials. The potential implications of these findings extend beyond humidity sensing, encompassing diverse fields such as environmental monitoring, healthcare, and consumer electronics.
2. Experimental
2.1. Chemicals and materials
All chemicals, including Zn(NO3)2·6H2O (Merck, Germany), Ni(NO3)2·6H2O (Merck, Germany), Mn(NO3)2·4H2O (Merck, Germany), Fe(NO3)3·9H2O (Merck, Germany), AgNO3 (Wako, China), graphite powder (BDH, UK), H2SO4 (Merck, Germany, 98%), KMnO4 (Merck, Germany), NaNO3 (Merck, Germany), melamine (Merck, Germany), and NH4OH (Merck, Germany) were purchased as analytical grade and used as received.2.2. Synthesis of graphitic carbon nitride (g-C3N4) and graphene oxide (GO)
Bulk graphitic carbon nitride (g-C3N4) was produced by the thermal polymerization of melamine. The melamine (6 g) was ground in a mortar and pestle for half an hour and transferred into a semi-closed alumina crucible that was annealed at 550 °C for 3 h under static air. Graphene oxide (GO) was synthesized by a “modified Hummer's method”.37 The detailed procedure is given in the ESI.†2.3. Synthesis of Zn0.5Ni0.5Fe1.8Mn0.2O4
The mixed spinel ferrite, Zn0.5Ni0.5Fe1.8Mn0.2O4, was synthesized by dissolving 0.5, 0.5, 0.2, and 1.8 mmol Zn(NO3)2·6H2O, Ni(NO3)2·6H2O, Mn(NO3)2·4H2O, and Fe(NO3)3·9H2O, respectively, in 30 mL of DI water. Meanwhile, 25% NH4OH solution was added to maintain the pH at ∼ 10. Then, the mixture was transferred into a polypropylene (PPL) autoclave (200 mL) and kept at 190 °C for 24 h. After that, the autoclave was left to cool to room temperature naturally. Then the precipitate was collected and washed with DI water and ethanol. The product was dried overnight at 70 °C to obtain Zn0.5Ni0.5Fe1.8Mn0.2O4 and marked as MF 1.2.4. Synthesis of g-C3N4/Zn0.5Ni0.5Fe1.8Mn0.2O4/rGO
In a typical procedure, 0.0302 g of rGO (10 wt% of ferrite) and 0.0906 g of g-C3N4 (30 wt% of ferrite) were dispersed in 80 mL of DI water and ultrasonicated for 90 min. Zn(NO3)2·6H2O (0.5 mmol), Ni(NO3)2·6H2O (0.5 mmol), Mn(NO3)2·4H2O (0.2 mmol), and Fe(NO3)3·9H2O (1.8 mmol) were dissolved in 30 mL of DI water. The solution was then added dropwise into the above-mentioned suspension under vigorous stirring. Then, 25% NH4OH solution was added to maintain the pH at ∼ 10. Then, the mixture was transferred into a PPL autoclave (200 mL) and kept at 190 °C for 24 h. After that, the autoclave was left to cool to room temperature naturally. The precipitate was collected and washed with DI water and ethanol. The product was dried overnight at 70 °C and marked as MF4. Zn0.5Ni0.5Fe1.8Mn0.2O4/rGO and g-C3N4/Zn0.5Ni0.5Fe1.8Mn0.2O4 were also synthesized using the above-mentioned procedure and marked as MF2 and MF3, respectively.2.5. Fabrication of the humidity sensor
To achieve the desired configuration, the copper tape underwent a masking process, resulting in the creation of an interdigitated finger electrode. In order to establish a consistent and uniform thick film, a diluted paste of the sample, mixed with ethanol, was uniformly spread onto the substrate. The prepared substrate was then subjected to a drying period of one hour in an oven set at 80 °C. The thickness of the fabricated films was measured using a profilometer (DektakXT, Bruker). This device utilizes a diamond-tipped stylus to physically trace the surface of the material. By scanning across a known step between the film and the substrate, the profilometer accurately determined the film thickness, which was found to be 123, 125, 122, and 127 μm for the sensors fabricated with MF1, MF2, MF3, and MF4 nanocomposites, respectively.To create controlled relative humidity (RH) conditions, specially designed airtight chambers were employed.38 These chambers were filled with saturated aqueous salt solutions, including LiCl, MgCl2·6H2O, MgNO3·4H2O, NH4NO3, NaCl, KCl, and K2SO4. Each solution maintained a specific RH level within the range of 11% to 98% at a constant temperature of 25 °C. The internal air of the closed system was allowed to equilibrate with the corresponding % RH by introducing the salt solutions into the chambers, and the equilibrium conditions were monitored using a hygrometer (as shown in Fig. S4†). To investigate the behavior of the thick film substrate in response to varying humidity levels, the substrate was successively placed within the airtight chambers. During this process, the uptake of water molecules by the substrate was measured, and impedance variations were recorded with an impedance analyzer (65120B, Wayne Kerr Electronics, UK) using a two-probe kelvin fixture.
2.6. Characterization
The phase analysis of the as-prepared nanocomposites was carried out with a powder X-ray diffractometer (SmartLab SE, Rigaku, Japan) using high-intensity Cu Kα radiation (λ = 1.5406 Å) in the range of 10–80° (2θ). The peak profile analysis procedure and equation are illustrated in the ESI.† The chemical composition and oxidation states of the synthesized nanocomposites were characterized using an X-ray photoelectron spectrometer (K-alpha, Thermo Scientific, Czech Republic) equipped with a monochromatic Al K-alpha X-ray source (1486.69 eV). Survey scans were conducted over a 400 μm2 spot size area with a pass energy of 200 eV, 5 scans and an energy step size of 1.0 eV. High-resolution scans for specific elemental analysis were performed with a pass energy of 50 eV, a step size of 0.10 eV, and 15 scans to obtain detailed spectral information. Fourier Transform Infrared (FTIR) spectra of the synthesized NCs were obtained in the range of 4000–400 cm−1 using a Fourier transform infrared spectrometer (Model: IRAffinity-1S, MIRacle 10, Shimadzu, Japan) in order to confirm the spinel structure by making pellets with the assistance of KBr. The microstructure and size distribution of the synthesized nanocomposites were examined using transmission electron microscopy (TEM, JEM-2100 Plus, JEOL, Japan). For TEM analysis, the nanocomposites were dispersed in ethanol with the assistance of ultrasonication (Model: LUH-105, Labocon, UK) for 30 minutes. The resulting dispersion was drop-cast onto carbon-coated copper grids and dried in a silica gel desiccator for 3 hours before imaging. The magnetic properties of the obtained samples were studied at room temperature (RT) using a Vibrating Sample Magnetometer (VSM-8600, Lakeshore, USA) at a maximum applied field of 15 kOe. The dielectric and electrical features of the obtained materials were explored with an impedance analyzer (65120B, Wayne Kerr Electronics, UK) in the frequency range from 100 Hz to 20 MHz at RT using a dielectric measurement fixture. The powder was homogenized using a mortar and pestle with 5% polyvinyl alcohol aqueous solution and the powder was pelletized at a 10 mm diameter using a press machine with 5 KN pressure. To evaporate the binder, the pellets were calcined at 300 °C.For complex impedance analysis, the following equations are utilized. Rg and Cg represent the resistances and capacitances of the grains, and the impedance Z# of this equivalent circuit is given by
| Z# = Z′ − jZ′′ | (1) |
 | (2) |
 | (3) |
For each sample, there is a notable concurrence between the computed and observed complex impedance values.
3. Results and discussion
3.1. X-ray diffraction (XRD) analysis
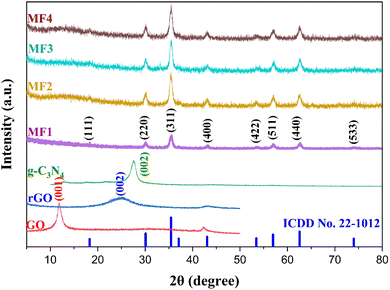
Powder X-ray diffraction (XRD) patterns of the as-prepared samples are depicted in Fig. 1. The presence of a diffraction pattern at an angle of 11.8° for the (001) diffraction plane confirms the creation of GO. However, following a hydrothermal treatment of the obtained GO, a new diffraction pattern emerges at an angle of 24.9° for the (002) diffraction plane, and the disappearance of the reflection at 11.8° provides clear evidence of the transformation of GO into rGO.39 The XRD peak of g-C3N4, observed at a 27.6° angle on the (002) diffraction plane, is attributed to the presence of an interlayer structure of aromatic rings within the graphite material. The assessment of the phase purity and crystallinity of the Zn0.5Ni0.5Fe1.8Mn0.2O4 nanocomposites was carried out using XRD patterns and the observed angles at 2θ values of approximately 30.04, 35.5, 43.01, 53.4, 57.01, 62.6, and 74.03° corresponded to the (220), (311), (400), (422), (511), (440), and (533) crystal planes of Zn0.5Ni0.5Fe1.8Mn0.2O4, respectively. These findings align with the standard data (ICDD No. 22-1012) for the face-centered cubic spinel ferrite structure, confirming the purity and crystalline nature of the nanocomposites.The XRD analysis also confirmed the successful synthesis of the ternary nanocomposites. The retention of diffraction peaks corresponding to the individual components suggests that the crystal phases remained intact during the fabrication process. The identification of the crystal phases provides a foundation for understanding the structural characteristics of the nanocomposites. The absence of any additional peak confirms that the samples possess a spinel structure characterized by a single phase.
The content of rGO and g-C3N4 in the composites is significantly lower compared to that in the predominant spinel ferrite Zn0.5Ni0.5Fe1.8Mn0.2O4. This low concentration results in weaker diffraction signals from rGO and g-C3N4, which may fall below the detection limit of the XRD instrument. Furthermore, the layered materials are highly dispersed within the ferrite matrix, leading to extensive exfoliation. This high degree of dispersion disrupts the long-range crystalline order required for sharp XRD peaks, causing the characteristic peaks of rGO and g-C3N4 to diminish or become undetectable.38,40 The XRD results are presented in Fig. 1, while the calculated lattice parameters are succinctly outlined in Table 1.
| Sample ID | Lattice parameter (Å) | C–S | M–S | SSP | H–W | ||
|---|---|---|---|---|---|---|---|
| D C–S | D M–S | D SSP | ε SSP × 10−5 | D H–W | ε H–W × 10−5 | ||
| MF1 | 8.41 | 10.3 | 14.0 | 13.7 | 4.8 | 13.6 | 8.4 |
| MF2 | 8.40 | 11.2 | 13.8 | 13.1 | 8.8 | 13.3 | 5.6 |
| MF3 | 8.38 | 12.1 | 11.0 | 12.2 | −3.5 | 13.2 | −5.8 |
| MF4 | 8.39 | 9.9 | 12.6 | 13.2 | 7.1 | 12.9 | 6.6 |
The crystallinity of the composite materials increases because the layered materials (rGO and g-C3N4) act as nucleation templates, promoting orderly crystal growth of the spinel ferrite nanoparticles. These materials provide enhanced nucleation sites and reduce lattice strain and defects, leading to larger and more uniform crystalline domains. They also prevent nanoparticle agglomeration by offering physical barriers, allowing individual particles to grow independently into well-crystallized grains. Strong interfacial interactions and controlled thermal conditions during synthesis further enhance crystallinity by facilitating stress relaxation and reducing imperfections.41–43 Evidence from characterization techniques like XRD and TEM, along with supporting literature, confirms that the incorporation of rGO and g-C3N4 results in composites with improved crystallinity compared to pure spinel ferrite.
X-ray peak analysis was carried out using the Classical Scherrer (C–S) equation, Modified Scherrer (M–S) equation, Size–Strain Plot (SSP), and Halder–Wagner (H–W) method and the results are depicted in Fig. S1–S3.† The crystalline size of all samples is recorded in Table 1 and the detailed X-ray peak analysis equation and methods are reported in our previous work.38
Further, the microstructural distortion that emerged in the samples throughout the synthesis procedure is assessed through SSP and H–W techniques. A negative strain value signifies a compressive attribute, whereas a positive value denotes a tensile characteristic of the strain.44
3.2. X-ray photoelectron spectroscopy (XPS) analysis
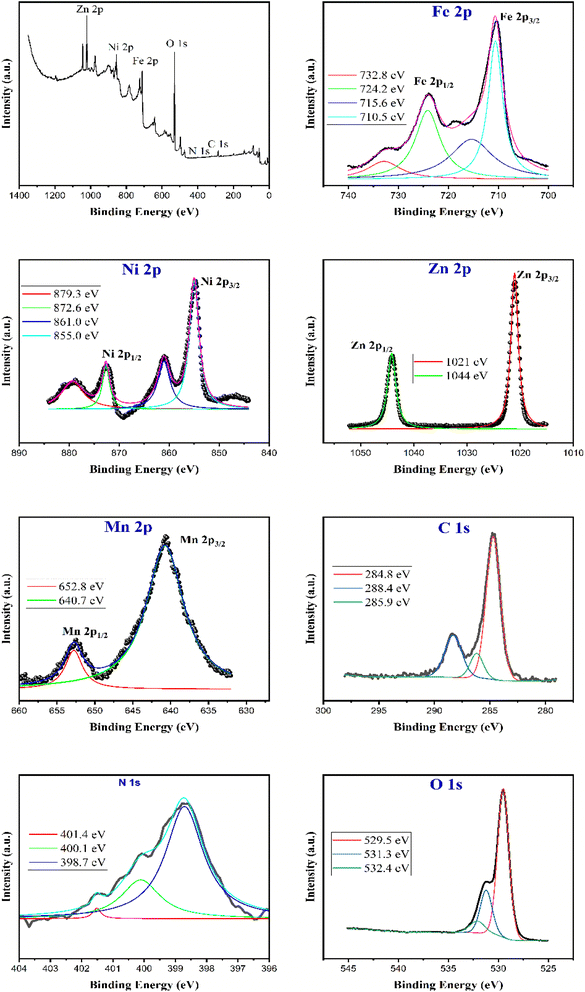
X-ray Photoelectron Spectroscopy (XPS) has demonstrated its effectiveness in determining the oxidation state of various elements. The XPS spectra depicted in Fig. 2 and S5† provide insights into the surface chemical composition and electronic state of the MF3 and MF4 nanocomposites. Examination of the survey spectra highlights the existence of energy regions corresponding to Zn 2p, Fe 2p, Ni 2p, Mn 2p, C 1s, O 1s, and N 1s. In Fig. 2, the high-resolution Zn 2p spectrum displayed two prominent fitting peaks with centers at 1044 and 1021 eV. These peaks were designated as Zn 2p1/2 and Zn 2p3/2, respectively, signifying the Zn2+ oxidation state in MF3.45 Regarding the Fe 2p spectrum, the binding energies observed for Fe 2p3/2 at 715.6 and 710.5 eV align with the tetrahedral and octahedral sites, respectively.46 Conversely, the presence of a peak at a binding energy of 724.2 eV corresponds to Fe 2p1/2. Additionally, the presence of shake-up satellite signals at 732.8 eV implies the exclusive existence of Fe3+ in the MF3 and MF4 nanocomposite samples.47,48 These assessments provide conclusive evidence of the Fe3+ oxidation state in the ferrite of MF3 and MF4 samples.The XPS analysis findings for Ni 2p are illustrated in Fig. 2, revealing two distinct peaks, Ni 2p1/2 and Ni 2p3/2, located at 872.6 eV and 855 eV, respectively. The observed variance in the valence states of nickel ions is primarily attributed to chemical interactions during the heating process, with Ni2+ and Ni3+ manifesting in the Ni 2p3/2 region. These outcomes align with earlier discussions on valence states and primary peaks, validating the consistency of the results.49,50
Fig. 2 and S5† illustrate the deconvoluted XPS spectra for the 2p region of Mn. The effective incorporation of Mn cations into MF3 and MF4 nanocomposites is substantiated by the distinctive XPS spectra of Mn, displaying core-level peaks at 641.5 and 652 eV, corresponding to the Mn 2p3/2 and Mn 2p1/2 states. This deconvolution outcome verifies the presence of Mn in two oxidation states, namely Mn2+ and Mn3+, across all Mn-doped samples.51–53 The existence of both nickel and manganese in two different oxidation states Ni2+ and Ni3+ and Mn2+ and Mn3+ may be due to the charge neutralization of the spinel crystal.
The O 1s spectrum (depicted in Fig. 2) can be resolved into three distinct peaks at 530.4, 531.8, and 532.8 eV. The O 1s binding energy at 530.4 eV is attributed to lattice oxygen binding with Fe and Zn, denoted as Fe–O and M2+–O.
Furthermore, the peaks at binding energies of 531.8 and 532.8 eV are assigned to surface-absorbed oxygen species, such as O2− ads and O− ads, and the presence of residual oxygen-containing groups bonded with C atoms in graphene (C–O and C![[double bond, length as m-dash]](https://www.rsc.org/images/entities/char_e001.gif) O) and C atoms in nitride (C–N and C
O) and C atoms in nitride (C–N and C![[double bond, length as m-dash]](https://www.rsc.org/images/entities/char_e001.gif) N), respectively.54–56 The chemisorbed oxygen on the MF NC surface represents the most active oxygen, playing a crucial role in the oxidation reaction.57
N), respectively.54–56 The chemisorbed oxygen on the MF NC surface represents the most active oxygen, playing a crucial role in the oxidation reaction.57
The XPS survey spectrum reveals two prominent peaks at binding energies of 398.7 and 284.8 eV, corresponding to the N 1s and C 1s spectra, respectively (refer to Fig. 2). The high-resolution C 1s spectrum was subjected to deconvolution, resulting in three Gaussian peaks at binding energy values of 284.8, 286.5, and 286.8 eV. The peaks for the C 1s signals of the original GO/g-C3N4 were deconvoluted into several signals, representing C–C and C![[double bond, length as m-dash]](https://www.rsc.org/images/entities/char_e001.gif) C (non-oxygenated) bonds at 284.7 eV, the C–O (epoxy and hydroxyl) bond at 285.6 eV, the C
C (non-oxygenated) bonds at 284.7 eV, the C–O (epoxy and hydroxyl) bond at 285.6 eV, the C![[double bond, length as m-dash]](https://www.rsc.org/images/entities/char_e001.gif) O bond at 287.4 eV, and the O–C
O bond at 287.4 eV, and the O–C![[double bond, length as m-dash]](https://www.rsc.org/images/entities/char_e001.gif) O (carboxylate) bond at 288.9 eV.58,59
O (carboxylate) bond at 288.9 eV.58,59
As depicted in Fig. 2, the XPS spectrum of N 1s could be separated into three peaks, centered at 401.5, 400.3 and 398.7 eV. These peaks can be ascribed to C–N–H, N–(C)3 and C–N–C groups in g-C3N4, respectively.60,61 The elemental compositions of MF3 and MF4 are listed in Table 2.
| Element | Atomic% | |
|---|---|---|
| MF3 | MF4 | |
| C 1s | 10.08 | 14.98 |
| N 1s | 0.94 | 1.17 |
| O 1s | 58.86 | 58.24 |
| Mn 2p3 | 3.79 | 2.61 |
| Fe 2p1 | 11.88 | 10.85 |
| Ni 2p3 | 4.49 | 3.95 |
| Zn 2p | 7.61 | 7.05 |
3.3. FTIR spectroscopy analysis
The FTIR spectra of g-C3N4, GO, and rGO are provided in Fig. S6 in the ESI section.† These spectra offer detailed insights into the vibrational modes and functional groups present in each material, allowing for a clear distinction between the structures of graphitic carbon nitride (g-C3N4), graphene oxide (GO), and reduced graphene oxide (rGO).
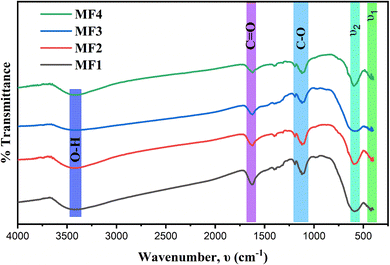
Fig. 3 depicts the FTIR spectra of the MF1, MF2, MF3, and MF4 powders within the range of 4000–400 cm−1. The presence of two prominent absorption bands in MF, labeled as ν1 (570–600 cm−1) and ν2 (420–480 cm−1), in all the examined samples is a shared characteristic of all spinel ferrites.36 These absorption bands can be attributed to the stretching vibration modes of the Fe3+–O2− complex, which occur in the tetrahedral and octahedral sites, respectively.62 Additionally, distinct peaks at 1170–1200, 1600–1680, 3350–3450, and 1400–1620 cm−1 are associated with the stretching vibrations of C–O, C![[double bond, length as m-dash]](https://www.rsc.org/images/entities/char_e001.gif) O, O–H, and C
O, O–H, and C![[double bond, length as m-dash]](https://www.rsc.org/images/entities/char_e001.gif) C, respectively.37
C, respectively.37
Furthermore, the FTIR spectra of the magnetic samples reveal vibration frequency peaks at 400–700, 1410, 1600–1700, and 3400–3800 cm−1.37 The presence of these characteristic peaks provides confirmation of the formation of a well-crystallized Zn0.5Ni0.5Fe1.8Mn0.2O4 spinel phase, which was previously verified through XRD analysis. However, following the incorporation of rGO or g-C3N4 onto ferrites, the distinct oxygen functional group peaks and certain other peaks become either undetectable or less pronounced. This suggests that hydrothermal synthesis has effectively resulted in the formation of composites with rGO or g-C3N4.56
3.4. TEM analysis
Transmission electron microscopy (TEM) analysis was conducted to enhance the understanding of the morphological and structural characteristics of the MF1, MF2, MF3 and MF4 nanocomposites, as shown in Fig. 4. Fig. 4(a and b) present two different magnified TEM images of the MF1 nanoparticles, revealing that the final product consisted of multiple nanospheres with diameters ranging from 6 to 24 nm. In contrast, Fig. 4(c and d) show TEM micrographs indicating that MF2 adhered densely to the surface of graphene sheets, with an average particle diameter of 6–26 nm. The morphology of the MF3 nanocomposite is shown in the Fig. 4(e and f) and MF4 nanocomposites in the Fig. 4(g and h). The diameters of the MF3 and MF4 nanocomposites ranged from 8 to 24 nm and 6 to 24 nm, respectively.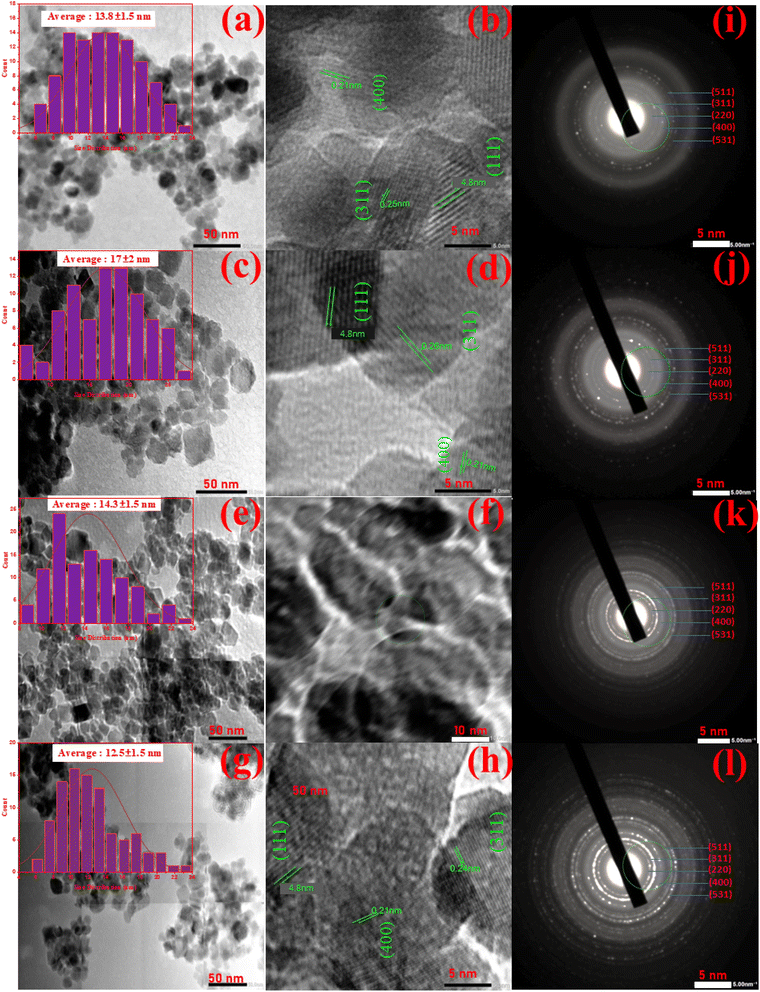 | ||
| Fig. 4 TEM images of MF1 (a and b), MF2 (c and d), MF3 (e and f), and MF4 (g and h) nanocomposites at different magnifications, along with the corresponding SAED patterns (i and l). | ||
These TEM images confirmed the tightly integrated structure of the nanocomposites, where Ni0.5Zn0.5Fe1.8Mn0.2O4 nanoparticles were positioned on top of large rGO and g-C3N4 sheets. This observation suggests that the aggregation of the crystalline Ni0.5Zn0.5Fe1.8Mn0.2O4 nanoparticles was restricted due to their direct interaction with the hierarchically stretchable rGO and g-C3N4 sheets. Notably, there was significant proximity between the Ni0.5Zn0.5Fe1.8Mn0.2O4 nanoparticles and the rGO sheets, indicating excellent adhesion even after using a sonochemical method to prepare the samples for TEM analysis.
Additionally, Fig. 4 shows a high-resolution TEM image of MF, which revealed that the spacings between the crystal lattice planes (111), (400), and (311) of MF crystals were 0.48, 0.21, and 0.25 nm, respectively. Fig. 4(i–l) show selected area electron diffraction (SAED) patterns. The well-resolved lattice fringes in these patterns indicated that the Ni0.5Zn0.5Fe1.8Mn0.2O4 nanospheres possessed a high degree of crystallinity.
Furthermore, the presence of Zn, Ni, Fe, Mn, C, and O elements in the nanocomposite was confirmed through energy dispersive X-ray spectroscopy (EDS) patterns, as shown in Fig. S6(a–c).†
3.5. Vibrating sample magnetometer (VSM) analysis
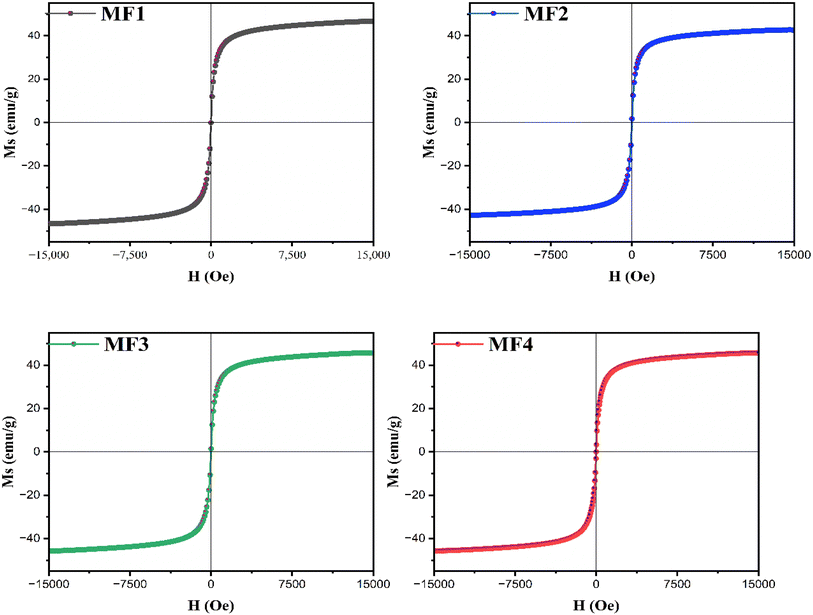
To confirm the magnetic properties, Vibrating Sample Magnetometer (VSM) analysis of the prepared NCs was performed. Fig. 5 displays the magnetic hysteresis patterns of the MF NP system at room temperature (RT). The saturation magnetization remains largely consistent across all NCs, except for MF2, which exhibits a variance due to rGO integration. The linear magnetization curves with an ‘S’ like shape of MF at 15 kOe with nearly zero coercivity and remanence indicates the superparamagnetic nature of all the samples. Saturation magnetization (Ms) is determined from the hysteresis curve at its maximum (Hmax), while remanent magnetization (Mr) is derived from the same curve at H = 0.00 Oe. The magnetic characteristics are summarized in Table 3. The ratio (Mr/Ms) serves as an indicator of the squareness of the hysteresis loop, reflecting the intricate behavior of the ferrites. In this investigation, the (Mr/Ms) ratio is notably low, suggesting that the materials analyzed are categorized as soft magnets. This ratio serves as a key parameter in identifying inter-grain exchange interactions among nanoparticles within magnetic materials. According to Stoner and Wolforth (1948), a (Mr/Ms) ratio of 0.5 signifies non-interacting randomly oriented nanoparticles, while values below 0.5 indicate magnetostatic interactions between particles. Analysis of Table 2 reveals that the (Mr/Ms) ratio is significantly below 0.5 for all samples. Coercivity diminishes with cobalt doping in the lattice, although no specific trend is observed, contrasting with the observations in Table 1 regarding crystallite size. Typically, the transition from a single domain to a multi-domain structure with an increasing particle size results in decreased coercivity.63| Sample ID | M s (emu g−1) | M r (emu g−1) | M r/Ms × 10−2 | H c (Oe) |
|---|---|---|---|---|
| MF1 | 49.9 | 0.048 | 0.0961924 | 0.389 |
| MF2 | 45.6 | 0.22 | 0.4824561 | 1.790 |
| MF3 | 48.9 | 0.16 | 0.3271984 | 1.348 |
| MF4 | 49.3 | 0.22 | 0.4462475 | 1.698 |
3.6. Dielectric properties
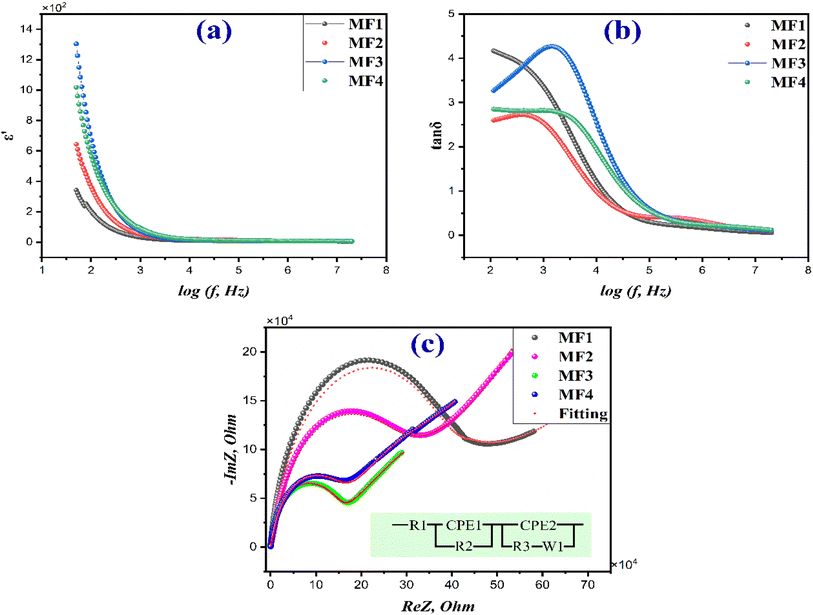
Fig. 6 illustrates the variation in the dielectric constant of the materials studied across a wide frequency range (20 Hz–20 MHz). The data show a rapid decrease in the dielectric constant up to 1 kHz, followed by a gradual decline as the frequency increases. At higher frequencies, around 10 kHz, the dielectric constant stabilizes, indicating a state of dielectric dispersion. The higher dielectric constant observed at lower frequencies is attributed to heterogeneous conduction in composite materials. The trend of decreasing dielectric constant with increasing frequency implies a similarity between the polarization behavior of ferrite and the conducting pathway. This phenomenon is connected to the local movement of electrons within the electric field's influence, facilitated by the exchange of electrons between Fe2+ and Fe3+ ions.64This motion governs the polarization of the ferrite material. It is widely acknowledged that polarization diminishes the strength of the electric field within the medium. It is possible that the inability of the electronic interaction between Fe2+ and Fe3+ ions to synchronize with the alternating field at different frequencies contributes to the decrease in polarization as the frequency rises.65
Consequently, there is a substantial decline in the dielectric constant as the frequency increases. This dispersion, in line with the Maxwell–Wagner model of interfacial polarization, can be conceptually explained by referencing Koop's phenomenological theory.66–68 This occurs due to the presence of free-charge carriers within the material. With increasing frequency, the polarization caused by space charge diminishes because these free charge carriers are unable to keep up with the changes in the electric field. As a result, only dipolar polarization remains, which explains the consistent value of the real component of the dielectric properties within the frequency range of 10 kHz to 20 MHz.69 The addition of rGO results in an increase in the dielectric constant, likely due to its superior conductivity. Similarly, the inclusion of g-C3N4 also leads to a significant rise in the dielectric constant. This could be due to enhanced polarization and conductivity within the MF3 nanocomposites, thereby improving their dielectric properties.70,71
Fig. 6(b) illustrates the frequency response of the dissipation factor or dielectric loss tangent (tan![[thin space (1/6-em)]](https://www.rsc.org/images/entities/char_2009.gif) δ) for the obtained materials under investigation. The behavior of tan
δ) for the obtained materials under investigation. The behavior of tan![[thin space (1/6-em)]](https://www.rsc.org/images/entities/char_2009.gif) δ closely resembles that of the dielectric constant, decreasing as the frequency increases due to reduced polarization at higher alternating current (ac) fields. The values of tan
δ closely resembles that of the dielectric constant, decreasing as the frequency increases due to reduced polarization at higher alternating current (ac) fields. The values of tan![[thin space (1/6-em)]](https://www.rsc.org/images/entities/char_2009.gif) δ stabilize at higher frequencies, particularly at 8 kHz. This change in tan
δ stabilize at higher frequencies, particularly at 8 kHz. This change in tan![[thin space (1/6-em)]](https://www.rsc.org/images/entities/char_2009.gif) δ with frequency is attributed to the conduction process in ferrites, which aligns with the empirical model proposed by Koop.72,73 The loss factor curve is believed to be influenced by domain wall resonance. When the motion of domain walls is suppressed in accordance with Rezlescu's model, losses are minimized at higher frequencies. At lower frequencies, a minor irregularity was noticed. According to Rezlescu's model, both positive (p) and negative (n) charge carriers could have independently influenced the relaxation peak. This phenomenon is also influenced by the electrical interactions between Fe2+ and Fe3+. Additionally, the dielectric loss tangent is contingent upon conductance, whereby higher conductance corresponds to increased dielectric losses.63,74 Furthermore, it is recognized that dielectric loss, which can result from grain boundaries, impurities, and defects in the crystal lattice, occurs when the polarization lags behind the applied alternating field.65,75
δ with frequency is attributed to the conduction process in ferrites, which aligns with the empirical model proposed by Koop.72,73 The loss factor curve is believed to be influenced by domain wall resonance. When the motion of domain walls is suppressed in accordance with Rezlescu's model, losses are minimized at higher frequencies. At lower frequencies, a minor irregularity was noticed. According to Rezlescu's model, both positive (p) and negative (n) charge carriers could have independently influenced the relaxation peak. This phenomenon is also influenced by the electrical interactions between Fe2+ and Fe3+. Additionally, the dielectric loss tangent is contingent upon conductance, whereby higher conductance corresponds to increased dielectric losses.63,74 Furthermore, it is recognized that dielectric loss, which can result from grain boundaries, impurities, and defects in the crystal lattice, occurs when the polarization lags behind the applied alternating field.65,75
Fig. 6(c) displays Nyquist impedance plots for MF1, MF2, MF3, and MF4. These plots illustrate the influence of ferrites' low conductivity on grain boundaries. This conductivity limitation hinders the movement of Fe2+ and Fe3+ ions at lower frequencies. As the applied field's frequency increases, conductive grains become more responsive, facilitating ion movement. Understanding this conduction process is vital for identifying its primary source, whether it originates from the grain itself, the grain boundary, or stray charges within the electrode. Impedance spectral analysis is a valuable tool for distinguishing between the contributions of the bulk (grain) and grain boundary to overall conductivity.
In the plots, a single semicircular arc in the high-to-medium frequency range and a slanted line in the low-frequency region can be noticed. These correspond to charge transfer resistance (Rct) and Warburg impedance (W), respectively.46 When examining ferrite impedance spectra, a trend emerges: semicircle diameters decrease with the introduction of rGO and g-C3N4. This decrease indicates an increase in conductivity upon incorporating these materials, aligning with our previous analysis. The semicircle size reflects interfacial charge transfer resistance. A smaller diameter suggests a faster charge transfer rate and reduced charge recombination, significantly enhancing catalytic activity.45,76
To assess the recorded impedance spectrum, the results are commonly replicated using an appropriate corresponding circuit composed of a resistor denoted as Rg and a capacitor denoted as Cg. The analysis and simulation of impedance spectra were performed using EIS Spectrum Analyzer software. As intergranular or grain-boundary impedances are commonly found in polycrystalline materials, they can be represented by the equivalent circuit shown in Fig. 6(c).
3.7. Humidity sensing
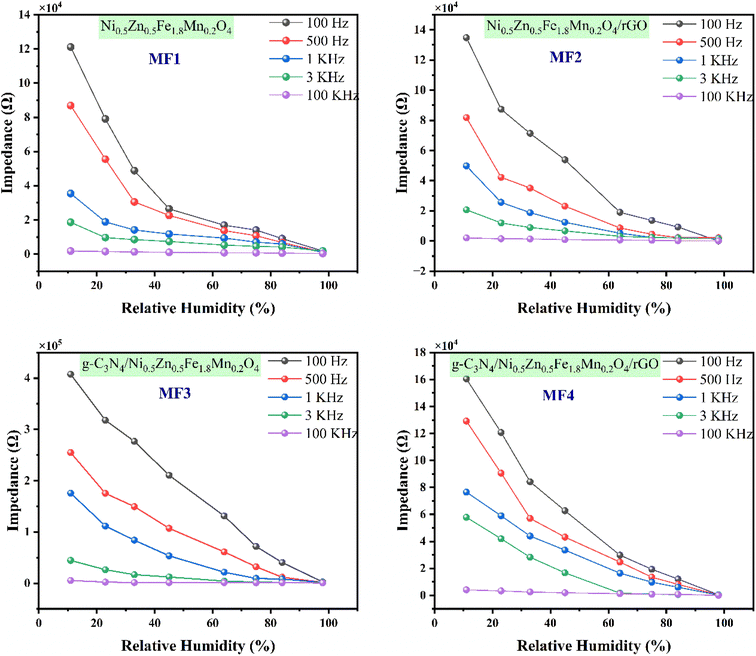
To explore the moisture-detecting capabilities of the fabricated sensors using MF1, MF2, MF3 and MF4 composites, tests by monitoring changes in electrical impedance were conducted. The thicknesses of the films were 123, 125, 122, and 127 μm for the sensors fabricated using MF1, MF2, MF3, and MF4 nanocomposites respectively used in the experimental section. The size of the films was 20 × 40 mm2. These tests involved subjecting the sensors to various levels of relative humidity (RH) ranging from 11% to 98% at different operating frequencies, as illustrated in Fig. 7.The impedance exhibited a gradual decrease as the RH level increased, but this trend was observed only when the operating frequency was less than 3 kHz. Among the tested frequencies, 100 Hz consistently demonstrated the most exceptional responsiveness to changes in humidity for all the sensor types. Specifically, at 100 Hz, as the humidity increased from 11% to 98% RH, the impedance dropped significantly. For the MF3 and MF4 sensors, the impedance decreased from 407.4 kΩ to 84.3 Ω and 160.3 kΩ to 110.4 Ω, respectively, under these conditions. The MF1 and MF2 sensors displayed similar RH response patterns, although their impedance changes were not as pronounced as those of the MF3 sensor.
The observed phenomenon can be attributed to the adsorption of water molecules on the sensitive materials' surface, which promotes a polarization effect and leads to an increase in the dielectric constant. Consequently, this causes a reduction in sensor impedance as the relative humidity levels rise. However, it is worth noting that the impedance curves began to level off beyond 10 kHz, suggesting that changes in relative humidity had a minimal impact on the sensors' performance at frequencies above this threshold. This behavior can be explained by the rapid change in the electrical field's orientation, which hinders the polarization of water molecules adsorbed on the sensitive materials' surface.
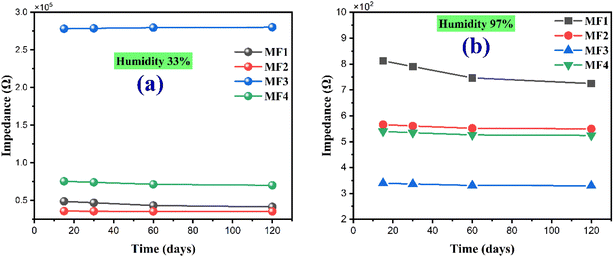
Following a 120 day exposure to ambient conditions at room temperature, no significant deviations were detected in impedance measurements. Fig. 8 illustrates the time-dependent evolution of impedance values for the MF sensors when measured at humidity levels of 33% and 98% RH. These results confirm the excellent long-term stability of the device for humidity detection, indicating its reliability and durability under extended operating conditions.
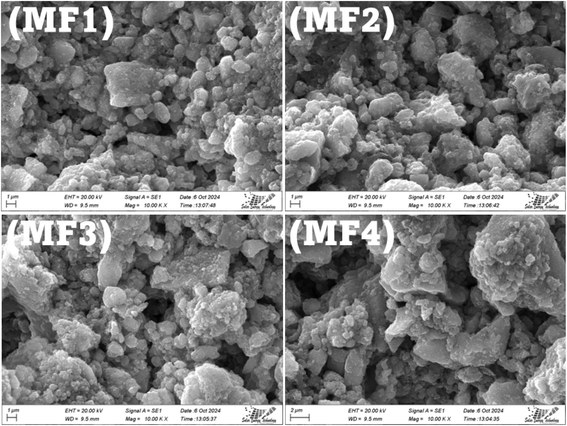
Fig. 9 shows the SEM images of the fabricated humidity sensor electrode. The SEM images (MF1 to MF4) reveal a homogeneous and dense distribution of ferrite particles across the electrode surface, indicating successful deposition via the dispersion method. Each image shows the granular nature of the ferrite, with micro-sized agglomerations that suggest strong adhesion to the interdigitated electrode structure. Visible cracks and pores, particularly in MF1 and MF3, likely result from drying processes and may influence the sensor's humidity sensitivity by affecting its surface area. The relatively rough surface morphology across all images could enhance the electrode's interaction with water molecules, improving the sensor's performance under humid conditions. Overall, the images demonstrate that the ferrite coating is uniform, with some textural variations that could contribute to sensor efficiency.
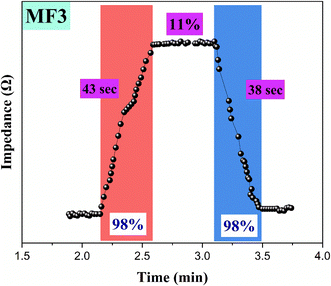
Fig. 10 illustrates the humidity sensor's response and recovery times using the MF3 ternary composite film. The sensor demonstrated response and recovery times of 43 and 38 seconds, respectively. The prolonged response and recovery times are likely attributed to the increased stable adsorption of water molecules due to the large pore volume in the MF3 ternary composite film. To improve the response and recovery kinetics in future studies, it is advisable to explore reducing the dimensions of structures in the MF3 ternary composite film. Comparative studies are given in Table 4.
While some binary composites in Table 4 exhibit faster response and recovery times, our MF3 material system offers a balanced combination of performance metrics that make it a strong candidate for practical humidity sensing applications. Its advantages in terms of environmental friendliness, cost-effectiveness, long-term stability, and ease of fabrication are significant factors that favor its use over materials with marginally better response times but potential drawbacks.
The selectivity of our sensor devices towards humidity is ensured by the hydrophilic nature of the nanocomposite materials, the specific adsorption mechanisms of water molecules, and the frequency-dependent impedance response. The combination of these factors minimizes the influence of other species or gases on the sensor's performance.
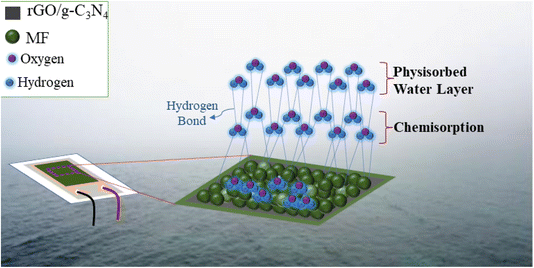
Conversely, as the RH increases, a shift occurs, where single hydrogen bonds start forming between the water molecules that have adsorbed in multiple layers. This results in the mechanism bearing a stronger resemblance to the bulk liquid phase of water.85 Furthermore, at elevated RH levels, the physisorbed water molecules acquire charges and generate hydronium ions (H3O+) when subjected to an electric field, which serve as charge carriers. Under high humidity conditions, protons are produced when these H3O+ ions undergo hydration (H3O+ → H2O + H+), making it easier for them to move within the proximity of adjacent water molecules.32,85
The high surface area and porous nature of the nanomaterials provide ample sites for water molecule adsorption. Analysis of the nanomaterials' surface functional groups revealed the presence of hydroxyl (–OH) groups, which are known to interact strongly with water molecules. This interaction influences the electrical and chemical properties of the nanomaterials. As water molecules are adsorbed onto the surface, they introduce additional charge carriers, leading to changes in electrical conductivity. This change in conductivity is utilized as the basis for humidity sensing. The possible mechanism of the fabricated sensor is shown in Fig. 11.
4. Conclusion
This study successfully fabricated and characterized novel ternary g-C3N4/Zn0.5Ni0.5Fe1.8Mn0.2O4/rGO hybrid NCs with a particle size range from 6 to 25 nm. The incorporation of graphene-based nanomaterials, spinel ferrite nanoparticles, and carbon nitride in a ternary configuration enabled enhanced humidity sensing capabilities. The fabricated nanocomposites exhibited very good sensitivity between RH 11 and 98% humidity levels, particularly notable at a frequency of 100 Hz. The investigation into the nanoscale interactions between different components provided insights into the mechanisms responsible for the enhanced sensing properties following chemisorption and physisorption of water. The long-term stability of the sensors over a 120 day exposure to ambient conditions further underscores their reliability for practical applications. The multifunctional nature of these nanocomposites opens avenues for diverse applications in environmental monitoring, healthcare, and consumer electronics. Overall, this research contributes to the advancement of humidity sensing technology through the development of innovative nanomaterials with improved performance and stability.Data availability
Data will be available on request.Conflicts of interest
The authors declare that they have no known competing financial interests or personal relationships that could have appeared to influence the work reported in this paper.References
- J. Zhao, Y. Liu, X. Li, G. Lu, L. You and X. Liang, et al., Highly sensitive humidity sensor based on high surface area mesoporous LaFeO3 prepared by a nanocasting route, Sens. Actuators, B, 2013, 181, 802–809 CrossRef.
- X. Xu, L. Xiao, N. O. Haugen, Z. Wu, Y. Jia and W. Zhong, et al., High humidity response property of sol–gel synthesized ZnFe2O4 films, Mater. Lett., 2018, 213, 266–268 CrossRef CAS.
- V. G. Hiremath, I. S. Yahia, H. Y. Zahran, B. Chethan, G. H. Malimath and Y. T. Ravikiran, et al., Humidity sensing behaviour of Rubidium-doped Magnesium ferrite for sensor applications, J. Mater. Sci.: Mater. Electron., 2022, 33(14), 11591–11600 CrossRef CAS.
- H. Farahani, R. Wagiran and M. N. Hamidon, Humidity sensors principle, mechanism, and fabrication technologies: A comprehensive review, Sensors, 2014, 14, 7881–7939 CrossRef PubMed.
- X. Guo, D. Kuang, Z. Zhu, Y. Ding, L. Ge and Z. Wu, et al., Humidity Sensing by Graphitic Carbon Nitride Nanosheet/TiO2Nanoparticle/Ti3C2TxNanosheet Composites for Monitoring Respiration and Evaluating the Waxing of Fruits, ACS Appl. Nano Mater., 2021, 4(10), 11159–11167 CrossRef CAS.
- C. Yao, Q. Zeng, G. F. Goya, T. Torres, J. Liu and H. Wu, et al., ZnFe2O4 nanocrystals: Synthesis and magnetic properties, J. Phys. Chem. C, 2007, 111(33), 12274–12278 CrossRef CAS.
- M. Bohra, V. Alman and R. Arras, Nanostructured znfe2o4: An exotic energy material, Nanomaterials, 2021, 11(5), 1286 CrossRef CAS PubMed.
- J. A. Gomes, G. M. Azevedo, J. Depeyrot, J. Mestnik-Filho, G. J. Da Silva and F. A. Tourinho, et al., ZnFe2O4 nanoparticles for ferrofluids: A combined XANES and XRD study, J. Magn. Magn. Mater., 2011, 1203–1206 CrossRef CAS.
- K. Wu, J. Li and C. Zhang, Zinc ferrite based gas sensors: A review, Ceram. Int., 2019, 45, 11143–11157 CrossRef CAS.
- J. Zhang, G. Yuan, H. Wang, J. Wu, G. Yang and Q. Jia, et al., Preparation of core/shell-structured ZnFe2O4@ZnIn2S4 catalysts and its ultrafast microwave catalytic reduction performance for aqueous Cr(VI), Chem. Eng. J., 2023, 451 Search PubMed.
- Y. Fu and X. Wang, Magnetically separable ZnFe2O4-graphene catalyst and its high photocatalytic performance under visible light irradiation, Ind. Eng. Chem. Res., 2011, 50(12), 7210–7218 CrossRef CAS.
- N. Nadeem, M. Zahid, A. Tabasum, A. Mansha, A. Jilani and I. A. Bhatti, et al., Degradation of reactive dye using heterogeneous photo-Fenton catalysts: ZnFe2O4 and GO-ZnFe2O4 composite, Mater. Res. Express, 2020, 7(1), 015519 CrossRef CAS.
- L. Liu, G. Zhang, L. Wang, T. Huang and L. Qin, Highly active S-modified ZnFe2O4 heterogeneous catalyst and its photo-Fenton behavior under UV-visible irradiation, Ind. Eng. Chem. Res., 2011, 50(12), 7219–7227 CrossRef CAS.
- Z. Xing, Z. Ju, J. Yang, H. Xu and Y. Qian, One-step hydrothermal synthesis of ZnFe2O4 nano-octahedrons as a high capacity anode material for Li-ion batteries, Nano Res., 2012, 5(7), 477–485 CrossRef CAS.
- D. Das, A. Mitra, S. Jena, S. B. Majumder and R. N. Basu, Electrophoretically Deposited ZnFe2O4-Carbon Black Porous Film as a Superior Negative Electrode for Lithium-Ion Battery, ACS Sustain. Chem. Eng., 2018, 6(12), 17000–17010 CrossRef CAS.
- Y. Ding, Y. Yang and H. Shao, High capacity ZnFe2O4 anode material for lithium ion batteries, Electrochim. Acta, 2011, 56(25), 9433–9438 CrossRef CAS.
- G. Wu, H. Zhang, X. Luo, L. Yang and H. Lv, Investigation and optimization of Fe/ZnFe2O4 as a Wide-band electromagnetic absorber, J. Colloid Interface Sci., 2019, 536, 548–555 CrossRef CAS PubMed.
- J. Widakdo, N. Istikhomah, A. Rifianto, E. Suharyadi, T. Kato and S. Iwata, Crystal Structures and Magnetic Properties of Polyethylene Glycol (PEG-4000) Encapsulated Zn0.5Ni0.5Fe2O4 Magnetic Nanoparticles, J. Phys.: Conf. Ser., 2018, 1011, 012068 CrossRef.
- Rachna, N. B. Singh and A. Agarwal, Preparation, Characterization, Properties and Applications of nano Zinc Ferrite, Mater. Today: Proc., 2018, 9148–9155 CAS.
- M. V. Nikolic, Z. Z. Vasiljevic, M. D. Lukovic, V. P. Pavlovic, J. B. Krstic and J. Vujancevic, et al., Investigation of ZnFe 2 O 4 spinel ferrite nanocrystalline screen-printed thick films for application in humidity sensing, Int. J. Appl. Ceram. Technol., 2019, 16(3), 981–993 CrossRef CAS.
- P. Srinivasan, S. Samanta, J. B. B. Rayappan and K. Kailasam, A metal-free mesoporous g-C3N4 nanosheets for selective and sensitive recognition of ethanol at room temperature, Sens. Actuators, B, 2021, 15, 349 Search PubMed.
- Y. Zhou, W. Lv, B. Zhu, F. Tong, J. Pan and J. Bai, et al., Template-Free One-Step Synthesis of g-C3N4 Nanosheets with Simultaneous Porous Network and S-Doping for Remarkable Visible-Light-Driven Hydrogen Evolution, ACS Sustain. Chem. Eng., 2019, 7(6), 5801–5807 CrossRef CAS.
- Z. Mo, X. Zhu, Z. Jiang, Y. Song, D. Liu and H. Li, et al., Porous nitrogen-rich g-C3N4 nanotubes for efficient photocatalytic CO2 reduction, Appl. Catal., B, 2019, 256 Search PubMed.
- S. Das, T. Deka, P. Ningthoukhangjam, A. Chowdhury and R. G. Nair, A critical review on prospects and challenges of metal-oxide embedded g-C3N4-based direct Z-scheme photocatalysts for water splitting and environmental remediation, Appl. Surf. Sci., 2022, 11, 100273 CrossRef.
- S. Das, S. Pramanik, R. G. Nair and A. Chowdhury, Unlocking the potential of thermally exfoliated ultrathin g-C3N4 nanosheets: abundant active sites for enhanced solar photocatalysis, New J. Chem., 2023, 47(26), 12418–12430 RSC.
- S. Das, S. Das, R. G. Nair and A. Chowdhury, Magnetically separable ZnFe2O4 grafted g-C3N4/rGO ternary nanocomposites for enhanced photo-Fenton catalytic activity under visible light, Mater. Today Sustain., 2023, 21 Search PubMed.
- S. Das and A. Chowdhury, Recent advancements of g-C3N4-based magnetic photocatalysts towards the degradation of organic pollutants: A review, Nanotechnology, 2022, 33, 072004 CrossRef CAS PubMed.
- Y. Mussa, F. Ahmed, M. Arsalan and E. Alsharaeh, Two dimensional (2D) reduced graphene oxide (RGO)/hexagonal boron nitride (h-BN) based nanocomposites as anodes for high temperature rechargeable lithium-ion batteries, Sci. Rep., 2020, 10(1), 1882 CrossRef CAS PubMed.
- S. S. Ashok Kumar, S. Bashir, K. Ramesh and S. Ramesh, A review on graphene and its derivatives as the forerunner of the two-dimensional material family for the future, J. Mater. Sci., 2022, 57, 12236–12278 CrossRef CAS.
- V. Sharma, Y. Jain, M. Kumari, R. Gupta, S. K. Sharma and K. Sachdev, Synthesis and Characterization of Graphene Oxide (GO) and Reduced Graphene Oxide (rGO) for Gas Sensing Application, Macromol. Symp., 2017, 376(1), 1700006 CrossRef.
- J. Wu, L. Jia, Y. Zhang, Y. Qu, B. Jia and D. J. Moss, Graphene Oxide for Integrated Photonics and Flat Optics, Adv. Mater., 2021, 33(3), e2006415 CrossRef PubMed.
- S. Hasan and B. Azhdar, NiFe2O4 and ZnFe2O4 nanoparticles synthesis by sol-gel auto-combustion for humidity sensor applications, J. Solgel Sci. Technol., 2023, 105(2), 416–429 CrossRef CAS.
- C. Zheng, C. Zhang, K. Zhang, J. Zhang, L. Jin and A. M. Asiri, et al., Growth of ZnFe2O4 nanosheets on reduced graphene oxide with enhanced ethanol sensing properties, Sens. Actuators, B, 2021, 330 Search PubMed.
- C. Wei, X. Shen, F. Song, Y. Zhu and Y. Wang, Double-layer microwave absorber based on nanocrystalline Zn0.5Ni0.5Fe2O4/α-Fe microfibers, Mater. Des., 2012, 35, 363–368 CrossRef CAS.
- E. Wolska, W. Wolski, P. Piszora, M. Pietrusik, J. Šubrt, T. Grygar and M. Nejezchleba, X-ray powder diffraction and Mössbauer studies on the formation of Cd0.5Ni0.5Fe2O4/Zn0.5Ni0.5Fe2O4 spinel solid solutions, Int. J. Inorg. Mater., 1999, 1(2), 187–192 CrossRef CAS.
- F. S. Mustafa, A. A. Oladipo and M. Gazi, Photocatalytic Degradation of Toxic Phenolic Compound and Bacterial Inactivation by Ternary Li doped Zn0.5Ni0.5Fe2O4, ChemistrySelect, 2022, 7(21), e202200727 CrossRef CAS.
- M. Amini, M. Kamkar, F. Rahmani, A. Ghaffarkhah, F. Ahmadijokani and M. Arjmand, Multilayer Structures of a Zn0.5Ni0.5Fe2O4-Reduced Graphene Oxide/PVDF Nanocomposite for Tunable and Highly Efficient Microwave Absorbers, ACS Appl. Electron. Mater., 2021, 3(12), 5514–5527 CrossRef CAS.
- M. Rahman, M. L. Rahman, B. Biswas, M. F. Ahmed, M. A. A. Shaikh and S. A. Jahan, et al., The X-ray peak profiling, optical and dielectric properties of Ag@ZnFe2O4/rGO ternary nanocomposites: LED assisted photocatalysis and humidity sensing, J. Alloys Compd., 2024, 15, 984 Search PubMed.
- W. Hong, L. Li, R. Xue, X. Xu, H. Wang and J. Zhou, et al., One-pot hydrothermal synthesis of Zinc ferrite/reduced graphene oxide as an efficient electrocatalyst for oxygen reduction reaction, J. Colloid Interface Sci., 2017, 485, 175–182 CrossRef CAS PubMed.
- W. Shen, B. Ren, S. Wu, W. Wang and X. Zhou, Facile synthesis of rGO/SmFe 5 O 12/CoFe 2 O 4 ternary nanocomposites: Composition control for superior broadband microwave absorption performance, Appl. Surf. Sci., 2018, 453, 464–476 CrossRef CAS.
- F. Tian, X. Wang, Z. Chen, Y. Guo, H. Liang and Z. Lu, et al., A facile post-process method to enhance crystallinity and electrochemical properties of SnO2/rGO composites with three-dimensional hierarchically porous structure, RSC Adv., 2016, 6(108), 106275–106284 RSC.
- N. Mahmood, C. Zhang, H. Yin and Y. Hou, Graphene-based nanocomposites for energy storage and conversion in lithium batteries, supercapacitors and fuel cells, J. Mater. Chem. A, 2014, 2, 14–32 Search PubMed.
- W. Peng, G. Han, Y. Huang, Y. Cao and S. Song, Insight the effect of crystallinity of natural graphite on the electrochemical performance of reduced graphene oxide, Results Phys., 2018, 11, 131–137 CrossRef.
- G. Datt, M. M. Raja and A. C. Abhyankar, Steering of Magnetic Interactions in Ni0.5Zn0.5Fe2- x(Mn) xO4Nanoferrites via Substitution-Induced Cationic Redistribution, J. Phys. Chem. C, 2021, 125(19), 10693–10707 CrossRef CAS.
- L. Sun, R. Shao, L. Tang and Z. Chen, Synthesis of ZnFe2O4/ZnO nanocomposites immobilized on graphene with enhanced photocatalytic activity under solar light irradiation, J. Alloys Compd., 2013, 564, 55–62 CrossRef CAS.
- X. Zhou, B. Wang, H. Sun, C. Wang, P. Sun and X. Li, et al., Template-free synthesis of hierarchical ZnFe2O4 yolk-shell microspheres for high-sensitivity acetone sensors, Nanoscale, 2016, 8(10), 5446–5453 RSC.
- L. Hou, L. Lian, L. Zhang, G. Pang, C. Yuan and X. Zhang, Self-sacrifice template fabrication of hierarchical mesoporous bi-component-active ZnO/ZnFe2O4 sub-microcubes as superior anode towards high-performance lithium-ion battery, Adv. Funct. Mater., 2015, 25(2), 238–246 CrossRef CAS.
- H. Lv, L. Ma, P. Zeng, D. Ke and T. Peng, Synthesis of floriated ZnFe2O4 with porous nanorod structures and its photocatalytic hydrogen production under visible light, J. Mater. Chem., 2010, 20(18), 3665–3672 RSC.
- J. Hu, Y. Ma, X. Kan, C. Liu, X. Zhang and R. Rao, et al., Investigations of Co substitution on the structural and magnetic properties of Ni-Zn spinel ferrite, J. Magn. Magn. Mater., 2020, 513 Search PubMed.
- W. D. Oh, J. Lei, A. Veksha, A. Giannis, W. P. Chan and G. Lisak, et al., Ni-Zn-based nanocomposite loaded on cordierite mullite ceramic for syngas desulfurization: Performance evaluation and regeneration studies, Chem. Eng. J., 2018, 351, 230–239 CrossRef CAS.
- Y. Xu, J. Sherwood, Y. Qin, R. A. Holler and Y. Bao, A general approach to the synthesis and detailed characterization of magnetic ferrite nanocubes, Nanoscale, 2015, 7(29), 12641–12649 RSC.
- H. W. Nesbitt and D. Banerjee, Interpretation of XPS Mn(2p) spectra of Mn oxyhydroxides and constraints on the mechanism of MnO 2 precipitation, Am. Mineral., 1998, 83, 305–315 CrossRef CAS.
- C. R. Brundle, T. J. Chuang and K. Wandelt, Core And Valence Level Photoemission Studies Of Iron Oxide Surfaces And The Oxidation Of Iron, Surf. Sci., 1977, 68, 459–468 CrossRef CAS.
- D. Andreeva, T. Tabakova, V. Idakiev, P. Christov and R. Giovanoli, Au/α-Fe2O3 catalyst for water–gas shift reaction prepared by deposition–precipitation, Appl. Catal., A, 1998, 9–14 CrossRef CAS.
- S. Wang, J. Zhang, J. Yang, X. Gao, H. Zhang and Y. Wang, et al., Spinel ZnFe2O4 nanoparticle-decorated rod-like ZnO nanoheterostructures for enhanced gas sensing performances, RSC Adv., 2015, 5(13), 10048–10057 RSC.
- A. H. Mady, M. L. Baynosa, D. Tuma and J. J. Shim, Facile microwave-assisted green synthesis of Ag-ZnFe2O4@rGO nanocomposites for efficient removal of organic dyes under UV- and visible-light irradiation, Appl. Catal., B, 2017, 203, 416–427 CrossRef CAS.
- L. Xu and J. Wang, Magnetic nanoscaled Fe3O4/CeO2 composite as an efficient fenton-like heterogeneous catalyst for degradation of 4-chlorophenol, Environ. Sci. Technol., 2012, 46(18), 10145–10153 CrossRef CAS PubMed.
- Y. Haldorai, A. Rengaraj, C. H. Kwak, Y. S. Huh and Y. K. Han, Fabrication of nano TiO2@graphene composite: Reusable photocatalyst for hydrogen production, degradation of organic and inorganic pollutants, Synth. Met., 2014, 198, 10–18 CrossRef CAS.
- T. Jiao, H. Guo, Q. Zhang, Q. Peng, Y. Tang and X. Yan, et al., Reduced Graphene Oxide-Based Silver Nanoparticle-Containing Composite Hydrogel as Highly Efficient Dye Catalysts for Wastewater Treatment, Sci. Rep., 2015, 5 Search PubMed.
- R. Belakehal, K. Atacan, N. Güy, A. Megriche and M. Özacar, Fabrication of heterostructured CdS/g-C3N4/ZnFe2O4 nanocomposite synthesized through ultrasonic-assisted method for efficient photocatalytic hydrogen production, Appl. Surf. Sci., 2022, 602 Search PubMed.
- P. Wang, Z. Guan, Q. Li and J. Yang, Efficient visible-light-driven photocatalytic hydrogen production from water by using Eosin Y-sensitized novel g-C3N4/Pt/GO composites, J. Mater. Sci., 2018, 53(1), 774–786 CrossRef CAS.
- W. A. A. Bayoumy, Synthesis and characterization of nano-crystalline Zn-substituted Mg-Ni-Fe-Cr ferrites via surfactant-assisted route, J. Mol. Struct., 2014, 1056–1057(1), 285–291 CrossRef CAS.
- M. L. Rahman, S. Rahman, B. Biswas, M. F. Ahmed, M. Rahman and N. Sharmin, Investigation of structural, morphological and magnetic properties of nanostructured strontium hexaferrite through co-precipitation technique: Impacts of annealing temperature and Fe/Sr ratio, Heliyon, 2023, 9(3), e14532 CrossRef CAS PubMed.
- R. Pandit, K. K. Sharma, P. Kaur and R. Kumar, Cation distribution controlled dielectric, electrical and magnetic behavior of In3+ substituted cobalt ferrites synthesized via solid-state reaction technique, Mater. Chem. Phys., 2014, 148(3), 988–999 CrossRef CAS.
- R. S. Devan and B. K. Chougule, Effect of composition on coupled electric, magnetic, and dielectric properties of two phase particulate magnetoelectric composite, J. Appl. Phys., 2007, 101(1) DOI:10.1063/1.2404773.
- P. N. Anantharamaiah, P. Rao, H. M. Shashanka, V. Khopkar, J. Arout Chelvane and B. Sahoo, et al., Tunable Dielectric Properties of Nickel Ferrite Derived via Crystallographic Site Preferential Cation Substitution, J. Phys. Chem. C, 2022, 126(21), 9123–9134 CrossRef CAS.
- C. G. Koops, On the Dispersion of Resistivity and Dielectric Constant of Some Semiconductors at Audiofrequencies, Phys. Rev., 1951, 83, 121 CrossRef CAS.
- P. Chavan, L. R. Naik, P. B. Belavi, G. Chavan, C. K. Ramesha and R. K. Kotnala, Studies on Electrical and Magnetic Properties of Mg-Substituted Nickel Ferrites, J. Electron. Mater., 2017, 46(1), 188–198 CrossRef CAS.
- R. C. Kambale, P. A. Shaikh, C. H. Bhosale, K. Y. Rajpure and Y. D. Kolekar, The effect of Mn substitution on the magnetic and dielectric properties of cobalt ferrite synthesized by an autocombustion route, Smart Mater. Struct., 2009, 18(11), 115028 CrossRef.
- A. Naz, I. Bibi, F. Majid, A. Dahshan, K. Jilani and B. Taj, et al., Cu and Fe doped NiCo2O4/g-C3N4 nanocomposite ferroelectric, magnetic, dielectric and optical properties: Visible light-driven photocatalytic degradation of RhB and CR dyes, Diam. Relat. Mater., 2024, 141, 110592 CrossRef CAS.
- S. Pareek and J. K. Quamara, Dielectric and optical properties of graphitic carbon nitride–titanium dioxide nanocomposite with enhanced charge separation, J. Mater. Sci., 2018, 53(1), 604–612 CrossRef CAS.
- P. A. Shaikh, R. C. Kambale, A. V. Rao and Y. D. Kolekar, Structural, magnetic and electrical properties of Co-Ni-Mn ferrites synthesized by co-precipitation method, J. Alloys Compd., 2010, 492(1–2), 590–596 CrossRef CAS.
- S. Mahalakshmi, K. SrinivasaManja and S. Nithiyanantham, Electrical Properties of Nanophase Ferrites Doped with Rare Earth Ions, J. Supercond. Novel Magn., 2014, 27(9), 2083–2088 CrossRef CAS.
- I. H. Gul and A. Maqsood, Structural, magnetic and electrical properties of cobalt ferrites prepared by the sol-gel route, J. Alloys Compd., 2008, 465, 227–231 CrossRef CAS.
- G. H. Jon-Ker, Analysis Of The Semiconducting Properties Of Cobalt Ferrite, J. Phys. Chem. Solids, 1959, 9(2), 165–175 CrossRef CAS.
- A. Kheradmand, A. Wainwright, L. Wang and Y. Jiang, Anchoring Iron Oxides on Carbon Nitride Nanotubes for Improved Photocatalytic Hydrogen Production, Energy Fuels, 2021, 35(1), 868–876 CrossRef CAS.
- P. B. Koli, M. D. Birari, S. A. Ahire, S. G. Shinde, R. S. Ingale and I. J. Patil, Ferroso-ferric oxide (Fe3O4) embedded g-C3N4 nanocomposite sensor fabricated by photolithographic technique for environmental pollutant gas sensing and relative humidity characteristics, Inorg. Chem. Commun., 2022, 146 Search PubMed.
- S. Y. Park, J. E. Lee, Y. H. Kim, J. J. Kim, Y. S. Shim and S. Y. Kim, et al., Room temperature humidity sensors based on rGO/MoS2 hybrid composites synthesized by hydrothermal method, Sens. Actuators, B, 2018, 258, 775–782 CrossRef CAS.
- M. Morsy, M. M. Mokhtar, S. H. Ismail, G. G. Mohamed and M. Ibrahim, Humidity Sensing Behaviour of Lyophilized rGO/Fe2O3 Nanocomposite, J. Inorg. Organomet. Polym. Mater., 2020, 30(10), 4180–4190 CrossRef.
- I. C. Sathisha, K. Manjunatha, A. Bajorek, B. Rajesh Babu, B. Chethan and T. Ranjeth Kumar Reddy, et al., Enhanced humidity sensing and magnetic properties of bismuth doped copper ferrites for humidity sensor applications, J. Alloys Compd., 2020, 25, 848 Search PubMed.
- M. P. Dojcinovic, Z. Z. Vasiljevic, L. Rakocevic, V. P. Pavlovic, S. Ammar-Merah and J. D. Vujancevic, et al., Humidity and Temperature Sensing of Mixed Nickel–Magnesium Spinel Ferrites, Chemosensors, 2023, 11(1), 34 CrossRef CAS.
- V. Jeseentharani, M. George, B. Jeyaraj, A. Dayalan and K. S. Nagaraja, Synthesis of metal ferrite (MFe2O4, M = Co, Cu, Mg, Ni, Zn) nanoparticles as humidity sensor materials, J. Exp. Nanosci., 2013, 8(3), 358–370 CrossRef CAS.
- S. S. Laxmeshwar, S. S. Kulkarni, S. Nadaf, K. M. Swathi, H. M. Savanur and B. Chethan, et al., Observation of enhanced sensing response and recovery time of lutetium-doped zinc ferrite ceramics for humidity sensor application, J. Mater. Sci.: Mater. Electron., 2023, 34(30), 2038 CrossRef CAS.
- Z. Wang, Y. Xiao, X. Cui, P. Cheng, B. Wang and Y. Gao, et al., Humidity-sensing properties of urchinlike CuO nanostructures modified by reduced graphene oxide, ACS Appl. Mater. Interfaces, 2014, 6(6), 3888–3895 CrossRef CAS PubMed.
- V. K. Tomer, N. Thangaraj, S. Gahlot and K. Kailasam, Cubic mesoporous Ag@CN: A high performance humidity sensor, Nanoscale, 2016, 8(47), 19794–19803 RSC.
Footnote |
| † Electronic supplementary information (ESI) available. See DOI: https://doi.org/10.1039/d4na00579a |
| This journal is © The Royal Society of Chemistry 2025 |

