 Open Access Article
Cuprous iodide implanted in hot-water-soluble-starch coating of ferrite nanoparticles: efficient catalysts for on-water click synthesis of 1,2,3-triazoles†
Seyyed Mohammad Rezapour Mousavia and
Kurosh Rad-Moghadam *ab
*ab
aDepartment of Organic Chemistry, University of Guilan, University Campus 2, Rasht, Iran
bFaculty of Chemistry, University of Guilan, Rasht 4193833697, Iran. E-mail: radmm@guilan.ac.ir
First published on 6th February 2025
Abstract
Conglomerates of CuI nanoparticles combined with ferrous ferrite (FF) and cobalt ferrite (CF) nanoparticles were obtained using hot-water-soluble starch (HWSS) as a green adhesive possessing a strong complexing affinity for both the ferrites and CuI nanoparticles. Our findings indicate that the size of the CuI nanoparticles is closely related to the size of the ferrite nanoparticles, suggesting that the CuI nanoparticles grafted from the HWSS coating of the ferrite nanoparticles. The TEM image, size histograms derived from FE-SEM images and XRD patterns of the resulting composites revealed that the growth of CuI nanoparticles led to formation of conglomerates and not encapsulation of the ferrite nanoparticles. More interestingly, HWSS impacts oppositely on coercivities of the ferrites. The catalytic efficacy of the resulting nano-composites, CuI@HWSS@CF and CuI@HWSS@FF, in the one-pot synthesis of 1,2,3-triazoles through the click reaction of alkyl halides, sodium azide, and phenylacetylene “on water” is described. The use of a biocompatible nano-catalyst, easy catalyst recycling and high yields of the triazoles within short reaction times are the significant advantages of the synthetic method presented here.
Introduction
Nanotechnology has been the primary driving force behind the recent advancements in green chemistry across different branches including catalysis, biomedicine, environmental protection and energy storage. The growing interest in the preparation of nanostructured materials stems from their economic and environmental impacts as well as the wide range of distinctive properties that these materials possess.1,2 Among the many fabricated nanomaterials those with magnetic characteristics have found more applications due to their ease of separation from mixtures. Ferrites have been by far the magnetic components most widely used for production of magnetic nano-composites.3 They are typically hybrids of Fe2O3 and one or more other metal oxides such as FeO, MnO, NiO, CoO etc. Ferrous ferrite (FF) with the formula Fe3O4 and cobalt ferrite (CF) with formula CoFe2O4 are two of the earliest known magnetic materials, which have been frequently used for preparation of magnetic nano-composites.4–6 Of these two magnetic materials, ferrous ferrite (FF), commonly known as magnetite, has significantly attracted more interest because of its easy availability and superparamagnetic properties at the nano-scale. Superparamagnets exhibit no net magnetization in the absence of an external magnetic field, allowing them to be uniformly dispersed in a suspension phase. When exposed to an external magnetic field, superparamagnets acquire a significant magnetic characteristic and are attracted by a permanent magnet, facilitating their separation from mixtures. They owe this excellent magnetic property to their minimal coercivity and slight magnetic remanence.7 Furthermore, FF is a readily available material that can be functionalized on its surface for use in various applications.8 It has been used widely as a nano-template for fabrication of many core–shell nano-magnetic catalysts by coating.9 However, despite these prominent advantages, FF nanoparticles (NPs) are susceptible to aerial oxidation at the surface. Upon oxidation, the stoichiometry of FF at the surface is altered by enrichment of Fe3+ atoms.10 Unfortunately, the spin exchange between the inner core and the outermost oxidized layer of FF NP results in an increase in its coercivity and magnetic remanence.11 On the other hand, CF is a valuable material owing to its prominent properties such as good saturation magnetization, high coercivity at room temperature, excellent chemical stability and mechanical hardness.12 Like other materials, ferrites exhibit a notable surface energy at the nano-scale, which leads to a tendency to aggregate or adsorb materials on their surface. For preventing NPs from these unwanted interactions, they are usually coated with appropriate protecting materials, which not only shield them from aerial oxidation but also impart specific functionalities such as catalysis ability or serve as linkers for loading active materials on them.13 However, many of these coatings are not cost-effective or form excessively thick shells that significantly reduce the mass magnetization of the nano-composite.14 Recently, we demonstrated that the robust interaction between hot-water-soluble starch (HWSS) and FF results in deaggregation, coating with thin HWSS films, and a reduction in coercivity of its NPs.15 Other researchers shared their findings on the adhesion tendency of cuprous iodide NPs to starch.16 Applying these experimental findings, our goal was to use HWSS as a binding agent to produce a bio-derived nano-composite consisting of cuprous iodide and ferrite NPs. It is known that, through the reaction with HWSS, the stoichiometry of the oxidized FF NPs at surface is corrected, as some excess Fe3+ cations on surface of the NPs are reduced to Fe2+ cations.10 This reaction leads to restoration of the inherent magnetic properties of FF. A part of the coordination bonds between the metal atoms (M) at surface of ferrite NPs and the hydroxyl groups of HWSS seems to be converted into C–O–M covalent bonds, leading to efficient encapsulation of the ferrite NPs by HWSS. The HWSS coating can also serve as a matrix for implantation of other reactive NPs.11 The hydroxyl groups of HWSS on the surface of the NPs are highly reactive for anchoring metal atoms because they are unable to form crystalline regions there by intermolecular hydrogen bonding. Here, we explain that HWSS plays as a powerful biomaterial for adhesion of CuI to surface of FF and CF NPs. The magnetic properties of the as-obtained nano-composites and their catalytic activities in the synthesis of triazoles is also described. Among the various methods for synthesizing triazoles, the copper-catalyzed production of 1,4-disubstituted 1,2,3-triazoles via cycloaddition of azide derivatives with terminal alkynes has garnered significant attention from medicinal and organic chemists.17–25 Triazoles are an important class of compounds found in fungicides, herbicides, and dyes26–28 and they exhibit intriguing biological properties such as anti-allergic,29 anti-tumor,30 anti-infective,31 anti-phlogistic,32 anti-HIV,33 and anti-bacterial34 activities. Typically, this route to synthesis of triazoles requires a cuprous salt as the actual catalyst to drive the transformation regioselectively.35 However, copper salts are known to be quite toxic, and separating them from the reaction mixture is challenging. To effectively tackle these challenges, it is important to immobilize CuI NPs by HWSS on ferrites. Only a thin layer of HWSS serves as a powerful adhesive for conglomeration of the ferrites and CuI NPs. It restores the intrinsic coercivity of the aerially oxidized FF, improves the ferromagnetic behaviour of CF, prevents the leaching of CuI from the magnetic composites and has less mass and thus less impact on the mass magnetization of the composites. The composites showed efficient catalytic activities in the synthesis of 1,2,3-triazoles and can be readily retrieved by magnetic separation method.Experimental
General
All the chemicals used in this investigation were purchased from Sigma-Aldrich and Merck companies and used without further purification. The products are known compounds and were characterized by comparison of their spectral data and physical properties with those of authentic samples. All the melting points (Mp) are uncorrected and were determined using a Buchi B-545 apparatus. FT-IR spectra were measured on a Shimadzu FT-IR 8300 spectrophotometer in KBr wafers. TGA (thermogravimetric analysis) and DTG (derivative thermogravimetric) curves were obtained under Ar (Argon) atmosphere on a STA 1500 thermal analyser by varying the temperature from 25 °C up to 600 °C with a heating rate of 20 °C min−1. Powder X-ray diffraction (XRD) was carried out on a Panalytical X'Pert Pro X-ray diffractometer using Cu-Kα radiation (λ = 0.154 Å). Magnetic properties of the samples were investigated using a BHV-55 vibrating sample magnetometer at room temperature. Analysis of the elemental composition of the samples was carried out on an energy dispersive X-ray (EDX) analyser (Kevex, Delta Class I). The particle morphology checks by transmission electron microscopy (TEM) was performed on a Zeiss-EM10C microscope at acceleration voltage of 100 kV. Inductive coupled plasma (ICP) analysis was conducted with an Agilent (5110 ICP-OES10) instrument.Typical procedure for the preparation of HWSS@CF
HWSS was prepared according to a previously reported method with some modifications.15,36 In brief, corn starch (0.5 g) was wetted with ethanol 95% (1 mL) and then mixed with double-distilled water (50 mL). The resulting slurry was heated at 50 °C for 30 min under constant stirring. Subsequently, it was centrifuged at 3000 rpm for 5 min to separate the hot-water-insoluble ingredient of starch (HWIS) from the HWSS solution. At the end, HWSS was obtained by concentrating the separated solution under reduced pressure by using a rotary evaporator, operating at 50 °C, and freeze-drying the resulting syrup at −30 °C for 24 hours.For preparation of HWSS@CF NPs, a solution of HWSS (0.1 g) in double-distilled water (30 mL) was added to an aqueous solution (50 mL) of FeCl3 (1.35 g) and CoCl2·6H2O (0.6 g). The mixture was stirred vigorously at room temperature for 2 h and then NaOH solution (3 mol l−1) was added with sonication at the same temperature until the pH of the resulting mixture reached to ∼11. Afterward, an additional portion of HWSS (0.1 g) was added and the solution stirred for 4 h at 90 °C under N2 gas. At the end, the flask of the suspension was cooled to room temperature, placed on a permanent magnet and the supernatant solution was decanted after about 20 min. The NPs of HWSS@CF, magnetically collected in the flask, were washed several times in situ with distilled water and then dried in an oven at 50 °C for 12 h.
Preparation of CuI@HWSS@CF
HWSS@CF (0.5 g) was added to a flask (50 mL) containing an aqueous solution (30 mL) of CuCl2·2H2O (0.25 g) and KI (0.47 g). The resulting mixture was allowed to stir at 40 °C for 24 h. Finally, the solid NPs were isolated by placing the flask on a permanent magnet for 15 min, decanting the supernatant solution, washing the NPs thoroughly with distilled water and drying them at 50 °C for 12 h. The Cu content of this composite was measured to be 3.76% by ICP analysis.Typical procedure for the preparation of HWSS@FF
The magnetic Fe3O4 NPs were prepared by co-precipitation of FeIII and FeII hydroxides. For this purpose, FeCl2·4H2O (2 g) and FeCl3·6H2O (5.2 g) were dissolved in deoxygenated distilled water (25 mL) followed by addition of concentrated hydrochloric acid (0.85 mL, 12 M). The resulting solution was dropped into a NaOH solution (250 mL, 1.5 M) at 80 °C under vigorous stirring and N2 protection. The obtained magnetic NPs were separated from the resulting suspension by placing the glass vessel onto a permanent magnet (0.7 tesla), decanting the supernatant solution after a rest-time of 20 min and rinsing the NPs with deionized water three times (totally 200 mL). Finally, the NPs were dried at 50 °C. The as-prepared Fe3O4 (1 g) was added to a solution of HWSS (0.2 g) in distilled water (30 mL) and the suspension was stirred at 90 °C for 4 hours. The glass vessel of the suspension was cooled to room temperature, placed on a permanent magnet (0.7 tesla) and decanted to separate the supernatant solution. The NPs of HWSS@FF were rinsed with distilled water three times (totally 200 mL) and then dried at 50 °C.Preparation of CuI@HWSS@FF
HWSS@FF NPs (0.5 g) were added to an aqueous solution (30 mL) of CuCl2·2H2O (0.25 g) and KI (0.47 g) in a flask (50 mL). The mixture was allowed to stir at 40 °C for 24 h. Finally, the resulting solid NPs were isolated by placing the flask on a permanent magnet, decanting the supernatant solution, washing the solid thoroughly with distilled water and drying it at 50 °C overnight. The Cu content of this composite was measured to be 3.17% by ICP analysis.General procedure for synthesis of 1,2,3-triazoles under catalysis of CuI@HWSS@CF or CuI@HWSS@FF
To a flask containing an aralkyl halide (1.1 mmol), NaN3 (1.1 mmol) and phenylacetylene (1 mmol) was added either a suspension of CuI@HWSS@CF or CuI@HWSS@FF (0.01 g) NPs in H2O (10 mL). The reaction mixture was stirred at 100 °C, and the progress of the reaction was monitored by TLC until total conversion of the starting materials occurred. After the reaction was completed, the flask was allowed to cool to room temperature, its solid content was washed with distilled water (10 mL), and then dried at 50 °C. The product was extracted from the solid by ethyl acetate (3 × 10 mL). For separation of the nano-catalyst from the extraction solution, the flask was placed on a permanent magnet (0.7 tesla) and the supernatant extraction solution was collected by decantation. The solid nano-catalyst, remained in the flask, was dried at 50 °C before use in the next run of the same reaction. The combined ethyl acetate extract was dried with anhydrous MgSO4 and then the solvent was removed by rotary evaporation. The crude product remained after evaporation of the solvent was recrystallized from ethanol.Results and discussion
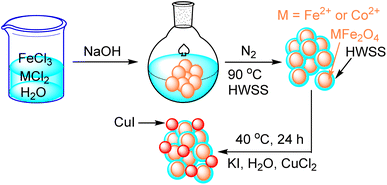
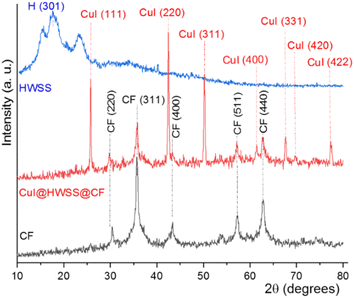
As depicted in Scheme 1, CuI@HWSS@MFe2O4 NPs, where M is Co2+ or Fe2+, were prepared in two steps. The first step entails the wet synthesis of MFe2O4 NPs through the co-precipitation of FeIII and MII oxides in a basic aqueous solution, followed by the coating with HWSS to yield HWSS@MFe2O4 NPs. The second step in delivering the desired nano-composite involves adding the as-prepared HWSS@MFe2O4 NPs to an aqueous solution of KI and CuCl2. This procedure gives a maximum loading of CuI onto HWSS@MFe2O4 NPs. Based on EDX analysis, the Cu loading is not as effective by other alternative procedures. For example, the loading is reduced when CuCl2\HWSS@MFe2O4 NPs, already obtained by immersing HWSS@MFe2O4 NPs in an aqueous CuCl2 solution, were added to a KI solution and the resulting suspension was stirred at 40 °C.Fig. 1 compares the XRD patterns of CF and CuI@HWSS@CF NPs. Two strong peaks are seen in the XRD pattern of CF NPs at 2θ = 35.79° and 62.86° along with three moderate peaks at 2θ = 30.37°, 43.36° and 57.27°, which can be readily assigned to Bragg-reflections from the (311), (440), (220), (400) and (511) Miller planes in its crystalline structure, respectively. The positions of these peaks are in pretty agreement with the spinel cubic structure of CF.37 All these characteristic peaks are also seen in the XRD pattern of CuI@HWSS@CF NPs, indicating that the crystal structure of CF has been substantially preserved in the nano-composite. The slight changes in intensity and width of these peaks, as compared to those of pristine CF, can be ascribed to coating with HWSS and dilution by CuI NPs. In addition, the XRD pattern of CuI@HWSS@CF displays diffraction peaks at 2θ = 25.75°, 42.46°, 50.19°, 61.43°, 67.63°, 69.73° and 77.33°, which can be indexed to diffractions from (111), (220), (311), (400), (331), (420) and (422) Miller planes of facial cubic cells of marshite CuI (γ-phase CuI) (JCPDS no. 06-0246). No additional peaks even due to HWSS component can be detected in the XRD-pattern of CuI@HWSS@CF, suggesting that HWSS is present as thin films in the composite and has not adopted a crystalline structure in it. The estimated average size of the NPs was calculated using the Scherrer equation “d = kλ/β(cos![[thin space (1/6-em)]](https://www.rsc.org/images/entities/char_2009.gif) θ)”, where k is a constant value of 0.98 specifically chosen for the spherical particles, λ refers to the wavelength of the X-ray beam, β stands for the full width at half maximum (FWHM) of the most intensive peak of CF component, and θ denotes the Bragg's reflection angle. Solving the equation individually for CF and CuI@HWSS@CF NPs yielded the values of 27.33 nm and 24.70 nm, respectively. It should be noted that these values indicate the crystalline domains of CF in the NPs. Given that the same CF sample was used for the production of CuI@HWSS@CF NPs, a decrease in the crystalline domain of the CF component is likely attributed to a structural alteration occurring at the surface of its NPs during the coating process with HWSS. Presumably, the structural change occurs due to the reduction of Fe3+ atoms to Fe2+ atoms within a certain depth on surface of CF NPs by HWSS and the strong coordination of the metal atoms with the hydroxyl groups of HWSS. The size of CuI NPs in CuI@HWSS@CF was estimated to be approximately 46 nm through the Scherrer calculation based on the (111) peak observed for CuI in the XRD pattern.
θ)”, where k is a constant value of 0.98 specifically chosen for the spherical particles, λ refers to the wavelength of the X-ray beam, β stands for the full width at half maximum (FWHM) of the most intensive peak of CF component, and θ denotes the Bragg's reflection angle. Solving the equation individually for CF and CuI@HWSS@CF NPs yielded the values of 27.33 nm and 24.70 nm, respectively. It should be noted that these values indicate the crystalline domains of CF in the NPs. Given that the same CF sample was used for the production of CuI@HWSS@CF NPs, a decrease in the crystalline domain of the CF component is likely attributed to a structural alteration occurring at the surface of its NPs during the coating process with HWSS. Presumably, the structural change occurs due to the reduction of Fe3+ atoms to Fe2+ atoms within a certain depth on surface of CF NPs by HWSS and the strong coordination of the metal atoms with the hydroxyl groups of HWSS. The size of CuI NPs in CuI@HWSS@CF was estimated to be approximately 46 nm through the Scherrer calculation based on the (111) peak observed for CuI in the XRD pattern.
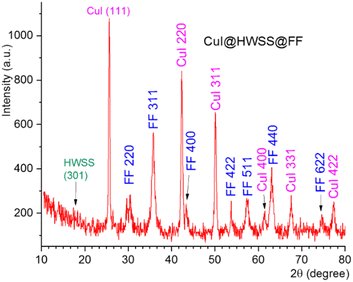
Using the slat of Fe2+ instead of Co2+ as the divalent metal ion in production of the ferrite yielded the nano-composite CuI@HWSS@FF. The XRD pattern of this nano-composite displayed peaks at 2θ values of 30.5°, 35.75°, 43.4°, 53.75°, 57.3°, 63.10° and 74.6°. These peaks are attributed to diffractions from the (220), (311), (400), (422), (511), (440) and (622) Miller planes of crystalline FF with a cubic inverse spinel structure, respectively, according to ICDD card number 19-0629 (Fig. 2). Additional peaks observed in this XRD pattern at 2θ values of 25.65°, 42.3°, 50.1°, 61.45°, 67.55° and 77.35° are associated with diffractions from (111), (220), (311), (400), (331) and (422) Miller planes of γ-CuI face-centred cubic crystal. Application of the Scherrer calculation to the peaks of this XRD pattern resulted in determination of the sizes 15.5 nm and 27.9 nm for FF and CuI NPs in this nano-composite, respectively. From these findings, it can be inferred that the size of CuI NPs decreased from 46 nm (in CuI@HWSS@CF) to 27.9 nm (in CuI@HWSS@CF) due to a reduction in the size of the ferrite NP from 27.3 nm to 15.5 nm. This observation can be reasonably explained as the CuI NPs should be formed by growing on the HWSS coating of ferrite NPs. A larger size ferrite NP provides a higher quantity of CuI seeding on its surface, leading to the growth of larger CuI NPs from these seeds.
It is worthy to note that no additional diffraction peaks corresponding to metallic Cu, cupric oxide (CuO), or cuprous oxide (Cu2O) were observed in the XRD patterns, suggesting the high phase purity of the prepared sample.
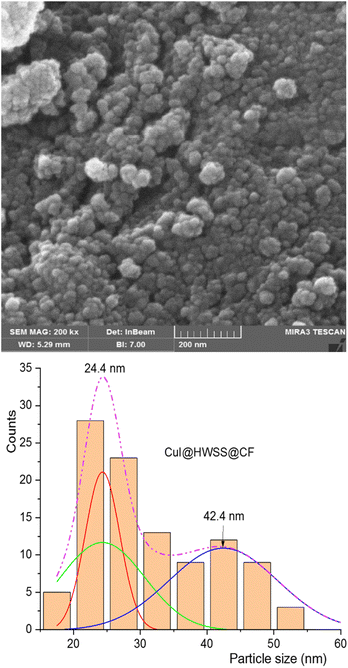
The morphology and size of NPs in the synthesized nano-composites were examined using FE-SEM imaging. As shown in Fig. 3, the NPs in CuI@HWSS@CF exhibit a predominantly spherical shape and their size dispersion histogram indicates a bimodal distribution, peaking at 24 and 42 nm. The histogram clearly demonstrates the presence of two distinct types of NPs in the nano-composite, each exhibiting a normal size distribution. There is an agreement between the average sizes of the two types of NPs and the average sizes estimated by the Scherrer's equation, suggesting that these are indeed CuI and CF NPs.
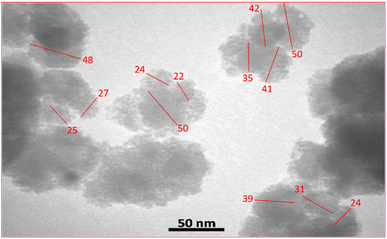
The transmission electron microscopy (TEM) image of CuI@HWSS@CF rules out the hypothesis of core–shell morphology for this nano-composite. It rather displays distinctly separated aggregates of roughly spherical NPs of sizes around or more less than 50 nm (Fig. 4).
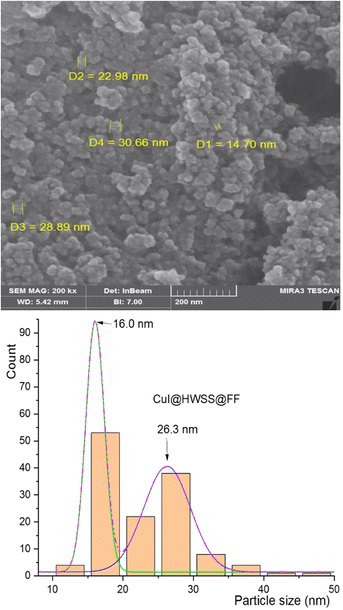
A similar morphology was observed for CuI@HWSS@FF nano-composite. As shown in Fig. 5, this nano-composite is composed of irregular conglomerates formed by adhesion of almost spherical NPs. The size-dispersion histogram of these NPs also reveals a bimodal distribution with peaks observed at the average sizes of 16 nm and 26 nm. These average sizes closely align with those calculated using the Sherrer's equation for FF and CuI NPs based on the XRD pattern of CuI@HWSS@FF (15.5 nm and 27.9 nm, respectively). Consequently, the presence of the two overlapping normal distributions in the histogram can be confidently attributed to the distinct size-dispersion of FF and CuI NPs within the composite. It is evident from the histograms of the two composites that the size of CuI NPs is influenced by the size of the ferrite NP. While the ferrites act as supports for the growth of CuI NPs, the resulting composites are actually conglomerates and lack a core–shell morphology.
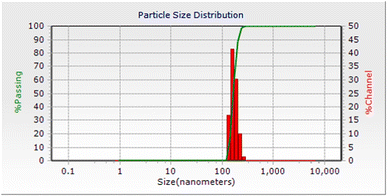
A dynamic light scattering (DLS) experiment displayed an average size of about 100 nm for the particles of CuI@HWSS@FF, showcasing that even the light NPs in this composite are indeed conglomerates of at least 4 NPs (Fig. 6). Furthermore, this observation highlights the robust adhesive properties of HWSS in cementing these conglomerates, as evidenced by the fact that the NPs within the conglomerates remain attached in bundles even after vigorous sonication in water during sample preparation for DLS analysis. Notably, the DLS analysis demonstrated a narrow size-distribution histogram for the CuI@HWSS@FF nano-conglomerates (Fig. 6).
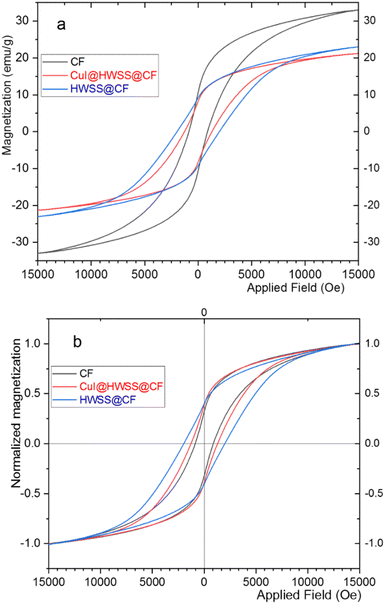
The magnetic behaviour of CF, HWSS@CF and CuI@HWSS@CF was studied by using a vibrating sample magnetometer (VSM) at room temperature. As illustrated in Fig. 7, the samples displayed hysteresis loops with considerable values of coercivity (Mc) and magnetic remanence (Mr) consistent with their dominant ferromagnetic characteristics. The maximum magnetic susceptibility (Mmax) was observed for CF (viz. 33 emu g−1) and it decreases in value in the order of CF > HWSS@CF > CuI@HWSS@CF as the mass of nonmagnetic components increases. Close inspection of the VSM curves reveals that the coercivity and the magnetic remanence of CF is altered by coating with HWSS and conglomeration with CuI NPs. To verify these effects, the VSM curves were normalized by plotting the relative magnetizations Ms/Mmax versus the applied field (Oe), where Ms stands for the mass magnetization of the sample at a given applied field. It is evident that the normalized curves are not superimposable due to their different coercivity and magnetic remanence values in the order of HWSS@CF > CuI@HWSS@CF > CF. It is well-known that the stability of Co2+ in the divalent state and Fe3+ in the trivalent state is suitably high, reducing the likelihood of their aerial oxidation. Of these metals, however, Fe3+ is susceptible of reduction by HWSS into Fe2+ atom. Likely, this conversion is mediated by coordination of the metal atoms on the surface of NP with the hydroxyl groups of HWSS, leading to formation of a yolk–shell of a Fe2+-containing mixed metal oxide encompassing the CF. Indeed, any alteration of concentration and distribution of cations in the structure of CF affects its magnetic properties.12,37 Spin exchange between the inner CF and the yolk–shell leads to an increase of coercivity. Nevertheless, the coercivity is decreased to a median value when the HWSS@CF NPs are used for production of CuI@HWSS@CF conglomerates. This change is due to reoxidation of some Fe2+ cations in the yolk–shell to Fe3+ cations and CuI NPs behave as the catalyst of this transformation.38
Although CuI@HWSS@CF has a lower saturation magnetization value than CF, it can be easily separated from suspensions by using a permanent magnet.
HWSS also impacts the magnetic properties of FF, but in a manner distinct from that observed for CF. As anticipated, the mass magnetization per gram of the sample is maximum for pristine FF NPs and it diminishes when the NPs are combined with the diamagnetic materials HWSS and CuI (Fig. 8). To ascertain the impact of composition with HWSS and CuI on magnetic property of FF, the VSM curves of FF, HWSS@FF and CuI@HWSS@FF were normalized based on their saturation magnetization maxima. Upon comparing these normalized curves, it was evident that the samples exhibit different coercivities, with the lowest value attributed to HWSS@FF and the median value observed for the CuI@HWSS@FF sample. Fresh FF NPs are prone to aerial oxidation at surface resulting in being covered with a yolk-like shell enriched of Fe3+ atoms. Spin exchange between this shell and the intact inner mass of FF NP leads to an increase in its coercivity. Refluxing FF with HWSS leads to the reduction of some Fe3+ atoms present in the outermost yolk shell of its NPs to Fe2+ atoms. Through this stoichiometry correction, the coercivity is increased to approximate the intrinsic value of the intact FF NPs.
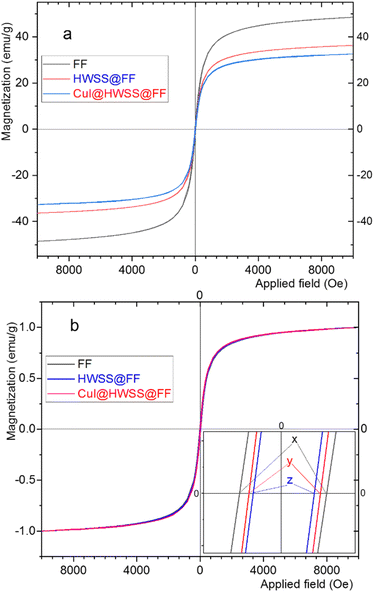 | ||
| Fig. 8 (a) VSM curves and (b) the normalized VSM curves of CuI@HWSS@FF, HWSS@FF, and FF. The inset displays the coercivities y = 56 Oe, z = 50 Oe and x = 72 Oe for the samples, respectively. | ||
It is well-known that for FF NPs smaller than approximately 46 nm, coercivity decreases as the size of the NPs decreases.39 Hence, it is likely that the crystallinity of the FF NPs at the surface is compromised during the (reduction and complexation) reaction with HWSS, entailing with a reduction of the crystalline domain within the FF core in an HWSS@FF NP. The slightly greater coercivity of CuI@HWSS@FF compared to that of HWSS@FF suggests that the stoichiometry of FF NPs at surface is altered during production of CuI@HWSS@FF. Through this production, some Fe2+ cations on surface of FF NPs are reoxidized to Fe3+ cations under aerial oxidation and CuI catalysis. Yet, the coercivity of CuI@HWSS@FF is significantly lower than that of the FF NPs from which it was produced. Interestingly, the coercivities of HWSS@FF and CuI@HWSS@FF remain preserved for a long period of time at room temperature, suggesting that the FF core in these composites is effectively shielded from aerial oxidation through complexation with HWSS.
The elemental constituents of the nano-composite Cu@HWSS@CF were determined through energy-dispersive X-ray (EDX) analysis, and the resulting spectrum is depicted in Fig. S1 (see the ESI).† This spectrum reveals the presence of C, O, Fe, Co, Cu, and I elements in the structure of the nano-composite. From this analysis, it was determined that the amount of Cl, attributed to the presence of unreduced CuCl2 in the composite, was as low as 0.18 weight percent. Similarly, the EDX spectrum of CuI@HWSS@FF displayed peaks characteristic to the presence of all its elements (C, O, Fe, Cu, and I). The percentage of chloride remains from the salts used in the production of this composite is insignificant and undetectable (Fig. S2†).
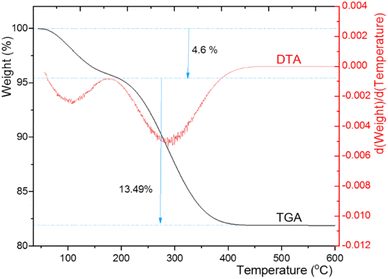
Thermogravimetric analysis (TGA) and differential thermal gravimetric analysis (DTG) of CuI@HWSS@CF delivered the curves depicted in Fig. 9. According to the TGA curve, the sample undergoes a total weight loss of 18% in two steps within the temperature range of 56–430 °C. The first step begins at the onset point of 56 °C and continues until the offset point of 192 °C, during which the sample experiences a weight loss of 4.6%. A significant portion of this mass loss is likely due to the evaporation of water sorbed by the sample (both physically and chemically) along with the release of water molecules through the condensation of the hydroxyl groups of CF and HWSS upon heating. Subsequent to this step, the TGA curve consistently descends to signify the second zone of mass loss, leading to an approximate 13.5% weight loss up to the offset point of 430 °C. This step of mass loss can be attributed to the complete fragmentation of HWSS, providing an estimate of its quantity (13.5%) in the composite. No significant mass loss is observed after the second zone in the TGA curve of the sample at temperatures exceeding 430 °C. According to this TGA curve, CuI@HWSS@CF maintains its chemical integrity up to 192 °C.
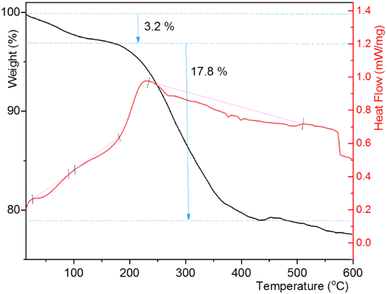
The TGA curve of CuI@HWSS@FF exhibited a total mass loss of approximately 23% within 25–600 °C (Fig. 10). The initial mass loss of 3.2% in this composite up to 155 °C is likely attributed to the evaporation of physically adsorbed water on its surface and the release of water molecules resulting from the condensation of the components HWSS and FF NPs. During this condensation process, some coordination bonds between the hydroxyl groups of HWSS and the surface iron atoms of FF NPs are transformed into covalent bonds. As the temperature rises, the TGA curve sharply declines to denote the initiation of the main degradation step of the composite at 176 °C. Within the temperature range of this degradation step (176–437 °C), approximately 17.8% mass loss is observed. Following this main degradation step, the TGA curve gradually descends due to the gradual evaporation of the CuI NPs. From these findings, it can be deduced that the integrity of CuI@HWSS@FF remains intact up to 176 °C. Two out of the three endothermic peaks, observed in the DSC curve of the composite up to 437 °C, occur within the temperature range of the predegradation step (40–155 °C), suggesting that the water molecules evaporated from the composite had two distinct sorption energies. These two initial endothermic peaks are followed by a broad and shallow endothermic trace that spans almost the entire temperature range of the main degradation step of the composite.
There are significant differences between the TGA curves of CuI@HWSS@FF and CuI@HWSS@CF. As Fig. 11 shows, the main degradation step for CuI@HWSS@FF entails with a greater percent of mass loss, indicating that the weight-percent of HWSS in this composite is higher than in CuI@HWSS@CF. This finding can be attributed to higher coating by HWSS due to smaller sizes of FF NPs and the facile complexation of HWSS and FF. For better comparison of these curves, the activation energies of water evaporation step (Ea1) and the main degradation step (Ea2) of the two composites were calculated by using a modified Coast–Redfern equation.
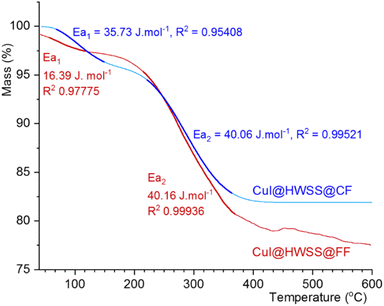 | ||
| Fig. 11 Comparison of the TGA curves of CuI@HWSS@FF and CuI@HWSS@CF and their activation energies in the water release and the main degradation steps (the bold traces). | ||
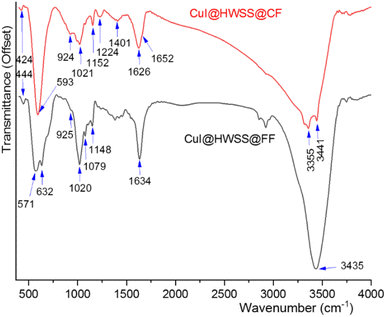
Valuable insights into the texture of the two composites were obtained by considering their FT-IR spectra. Both composites exhibited strong O–H stretching bands, attributed to the hydroxyl groups from the HWSS and those present on the surface of the ferrite NPs. In the case of CuI@HWSS@CF, this band is broad and notably drifts to lower wavenumbers, suggesting that a significant number of the hydroxyl groups on surface of CF have not been replaced through condensation with the hydroxyl groups of HWSS (Fig. 12). As a result, many of the HWSS hydroxyl groups exhibit a lower bond order and stretching wavenumber due to their coordination with metal atoms on the surface of the NPs. This seems to be also the fact making the O–H bending band of CuI@HWSS@CF at 1626 cm−1 slightly broader than the band of CuI@HWSS@FF at 1634 cm−1. HWSS displays a skeletal vibration band at 438 cm−1 and a band closely relating to the C–C and C–O stretching modes of the backbone of its macromolecules at 1155 cm−1. These and the other bands of HWSS at 1081, 1022, and 929 cm−1 due to the C–O–H and CH2 bending vibrations are very sensitive to the conformations of its polysaccharide molecules (see Fig. S3†). As is evident from the FT-IR spectra (Fig. 12), all these so-called “conformational bands” undergo significant changes in both wavenumber and intensity upon complexation of HWSS with the ferrite NPs. Following this complexation reaction, the skeletal band of HWSS at 438 cm−1 gains a notable intensity and shifts to 424 cm−1 and 444 cm−1 in the FT-IR spectra of CuI@HWSS@CF and CuI@HWSS@FF, respectively. This skeletal band is imperceptible for HWSS and virtually absent in the IR spectra of FF, CF and CuI (see Fig. S3 in ESI†). Therefore, it is characteristic of the formation of HWSS@FF and HWSS@CF complexes. It is important to note the relative intensity of the HWSS conformational bands at 924 cm−1 and 1020 cm−1 for the two composites, as this indicates the differing order of HWSS in these two cases.40 As another fact supporting the distinct morphology of the HWSS layer in the two composites, the broad band spanning from 1200 cm−1 to 1440 cm−1 in the FT-IR spectrum of CuI@HWSS@FF, due to CH2 deformation, C–H bending, CH2 twisting, and C–O–H bending vibrations, separates into two specific bands with peaks at 1224 cm−1 and 1401 cm−1 in the FT-IR spectrum of CuI@HWSS@CF. Two vibrational bands were observed for the Fe–O stretching in CuI@HWSS@FF. This observation is explained as either Fe2+ or Fe3+ atoms occupy the tetrahedral sites within the spinel structure of FF NPs. Consequently, two bands corresponding to the Fe–O stretching vibrations in CuI@HWSS@FF were identified at 632 cm−1 and 571 cm−1. For the case of CuI@HWSS@CF, however, only one metal–O vibration band was detected at 593 cm−1.
After characterization, the nano-composites CuI@HWSS@CF and CuI@HWSS@FF were examined as possible catalysts in the synthesis of 1,4-disubstituted 1,2,3-triazoles via the three-component reaction of aralkyl halides with sodium azide and phenylacetylene. To establish the optimum conditions, 3-chlorobenzylchloride 1, sodium azide 2 and phenylacetylene 3 were chosen as the model reactants (Table 1) and the effects of varying catalyst amounts, different solvents, and temperature conditions were systematically studied. As can be seen from Table 1, the best result in terms of yield and reaction time was obtained in distilled water using Cu@HWSS@FF as the catalyst at 100 °C (entry 10). In the absence of any catalyst the desired product is not formed sensibly even within a period of 60 min at 100 °C in distilled water (entry 1). It is also notable that HWSS@FF and HWSS@CF give low yields of the model product in the optimal conditions. This suggests that these NPs have minute contributions to the catalytic performance of the composites (entries 2, 3). Running the model reaction in solvent-free conditions even in the presence of either CuI@HWSS@FF or CuI@HWSS@CF led to low yields of the product (entries 16, 17). Other experiments revealed the crucial role of solvent in the trial reaction and the supremacy of distilled water (entries 18–21). Among the solvents tested for the model reaction, those of greater polarity and boiling points close to the optimum temperature gave higher yields of the product (entries 18, 21).
| Entrya | Catalyst | Charged (mol% Cu) | Solvent (4 mL) | Temp. (°C) | Time (min) | Yieldb (%) | TONe | TOFe (min−1) |
|---|---|---|---|---|---|---|---|---|
| a Reaction conditions: 3-chlorobenzylchloride (1.1 mmol), sodium azide (1.1 mmol), and phenylacetylene (1 mmol).b Yields of isolated products. Results are the average of duplicate experiments.c The bold entry shows the optimal conditions.d Dimethylformamide.e Turn-over numbers (TON) and turn-over frequencies (TOF) are per gram of Cu content (measured by ICP). | ||||||||
| 1 | None | — | H2O | 100 | 60 | Trace | — | — |
| 2 | HWSS@FF | 10 mg (0) | H2O | 100 | 60 | 37 | — | — |
| 3 | HWSS@CF | 10 mg (0) | H2O | 100 | 60 | 32 | — | — |
| 4 | CuCl2@HWSS@FF | 10 mg (0.18) | H2O | 100 | 20 | 81 | 7232 | 723 |
| 5 | CuCl2@HWSS@CF | 10 mg (0.15) | H2O | 100 | 20 | 77 | 7857 | 786 |
| 6 | CuI@HWSS@FF | 10 mg (0.5) | H2O | 25 | 20 | Trace | — | — |
| 7 | CuI@HWSS@CF | 10 mg (0.59) | H2O | 25 | 20 | Trace | — | — |
| 8 | CuI@HWSS@FF | 10 mg (0.5) | H2O | 90 | 10 | 93 | 2934 | 293 |
| 9 | CuI@HWSS@CF | 10 mg (0.59) | H2O | 90 | 10 | 88 | 2347 | 235 |
| 10 | CuI@HWSS@FF | 10 mg (0.5) | H2O | 100 | 10 | 94 | 2965 | 296 |
| 11 | CuI@HWSS@CF | 10 mg (0.59) | H2O | 100 | 10 | 90 | 2394 | 239 |
| 12 | CuI@HWSS@FF | 7 mg (0.35) | H2O | 100 | 10 | 82 | 3695 | 370 |
| 13 | CuI@HWSS@CF | 7 mg (0.41) | H2O | 100 | 10 | 78 | 2964 | 296 |
| 14 | CuI@HWSS@FF | 10 mg (0.5) | H2O | 110 | 10 | 94 | 2965 | 296 |
| 15 | CuI@HWSS@CF | 10 mg (0.59) | H2O | 110 | 10 | 91 | 2420 | 242 |
| 16 | CuI@HWSS@FF | 10 mg (0.5) | None | 100 | 20 | 45 | 1420 | 71 |
| 17 | CuI@HWSS@CF | 10 mg (0.59) | None | 100 | 20 | 43 | 1356 | 68 |
| 18 | CuI@HWSS@FF | 10 mg (0.5) | Ethanol | Reflux | 30 | 82 | 2587 | 86 |
| 19 | CuI@HWSS@FF | 10 mg (0.5) | CH3CN | Reflux | 30 | 27 | 852 | 28 |
| 20 | CuI@HWSS@FF | 10 mg (0.5) | CHCl3 | Reflux | 30 | 13 | 410 | 14 |
| 21 | CuI@HWSS@FF | 10 mg (0.5) | DMFd | 100 | 10 | 90 | 2839 | 284 |
After optimization of the reaction conditions, we set out to explore the substrate scope of the reaction by examining a variety of aralkyl halides 1a–j in the reaction with sodium azide 2 and phenylacetylene 3 to produce a library of 1,4-disubstituted-1,2,3-triazoles. It is worth nothing that in all of the tests, the desired products were obtained in fairly high yields within short reaction times that clearly shows the feasibility of this method (Table 2).
| Entry | R1 | X | Product | Time (min) | Yieldb (%) | Mp (°C) | |
|---|---|---|---|---|---|---|---|
| Found | Reported (ref.) | ||||||
| a Reaction condition: sodium azide (1.1 mmol), phenylacetylene (1 mmol), aralyl halide (1.1 mmol), CuI@HWSS@FF (10 mg), distilled water (4 mL) at 100 °C.b Isolated yields. | |||||||
| 1 | H | Cl | 4a | 10 | 94 | 123–125 | 126–128 (ref. 41) |
| 2 | 4-Br | Br | 4b | 18 | 93 | 148–151 | 151–152 (ref. 35b) |
| 3 | 4-Me | Cl | 4c | 10 | 92 | 100–102 | 90–92 (ref. 42) |
| 4 | 3-F | Cl | 4d | 15 | 92 | 102–104 | 102–105 (ref. 42) |
| 5 | 4-F | Cl | 4e | 12 | 91 | 124–126 | 125–127 (ref. 43) |
| 6 | 2-Cl | Cl | 4f | 19 | 90 | 75–78 | 77–80 (ref. 42) |
| 7 | 3-Cl | Cl | 4g | 10 | 94 | 107–108 | 106–108 (ref. 41) |
| 8 | 4-Cl | Cl | 4h | 8 | 93 | 139–141 | 140–142 (ref. 41) |
| 9 | 2,3-Cl2 | Cl | 4i | 18 | 88 | 108–112 | 113–117 (ref. 42) |
| 10 | 3,4-Cl2 | Cl | 4j | 20 | 89 | 136–138 | 137–141 (ref. 42) |
Although we have not experimentally verified the mechanism of catalysis, a plausible pathway for the synthesis of 1,4-disubstituted-1,2,3-triazoles catalyzed by CuI@HWSS@FF is proposed in Scheme 2. This mechanism aligns with those previously suggested for catalysis by other catalysts.44–46 The process likely begins with the coordination of CuI@HWSS@FF with the π-electrons of the terminal alkyne, resulting in the formation of a π-complex. This complex subsequently transforms into the σ-complex A through the liberation of an HI molecule. Coordination of the intermediate σ-complex A via its π-electrons with the catalyst leads to the formation of the mixed complex B. This key intermediate appears to be sufficiently active to undergo a facile 1,3-dipolar cycloaddition reaction with the aralkylazide generated in situ from aralkyl halide and sodium azide. It is likely that the cycloaddition reaction proceeds through the initial ligation of the π-complexed copper cation in the intermediate B with the azide. This leads to formation of the metallacycle C and follows by the nucleophilic attack of an iodide ion onto one of its identical copper cations, resulting in the release of CuI@HWSS@FF and delivery of the intermediate D. Finally, the copper triazolide D captures a proton from medium, leading to the formation of product 4 and release of another CuI@HWSS@FF.
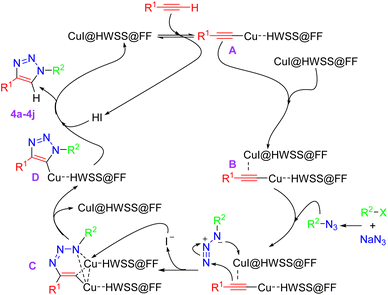 | ||
| Scheme 2 A plausible mechanism for formation of 1,4-disubstituted-1,2,3-triazoles under catalysis of CuI@HWSS@FF. | ||
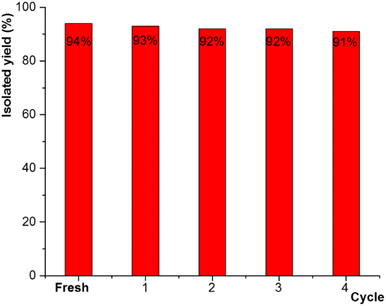
The recyclability and reusability of the catalyst was evaluated for the model reaction of 3-chlorobenzylchloride 1, sodium azide 2 and phenylacetylene 3. After completion of the reaction, the solid catalyst was separated simply from the reaction medium with the aid of a permanent magnet (0.7 tesla), washed with chloroform and ethanol, and dried at 50 °C before being reused in the next cycle of the same model reaction. As shown in Fig. 13, the catalyst significantly could be recovered and reused for four successive runs without any substantial loss in catalytic activity.
The applicability and efficiency of CuI@HWSS@FF as a catalyst for synthesizing the model product 4g were compared with other reported catalysts, as shown in Table 3. The table clearly demonstrates that CuI@HWSS@FF serves as an effective alternative to several efficient catalysts (entries 5–7). It provides a higher yield than some of the reported catalysts (entries 1–4) and operates more quickly than others (entries 1–3, 6, 8). Additionally, it is more cost-effective than certain catalytic protocols (entries 7–9) and does not require special techniques, such as sonication (entry 9) or microwave irradiation (entry 5).
| Entry | Catalyst | Conditions | Product 4j | Product 4a | Ref. | ||
|---|---|---|---|---|---|---|---|
| Time (min) | Yield (%) | Time (min) | Yield (%) | ||||
| a Carboxymethylcellulose.b Poly vinyl chloride/Ethylene diamine.c Reduced graphene oxide.d Graphene oxide carbonyl amide, isatoic anhydride/sonication.e Graphene oxide/microwave irradiation.f Layered double hydroxide.g Magnetite NPs encapsulated in poly(N-(dimethylaminoethyl)acrylamide).h Acetyl pyridine/3-aminopropyltriethoxysilane. | |||||||
| 1 | Cu(II)–CMC–Fe3O4a | t-BuOH![[thin space (1/6-em)]](https://www.rsc.org/images/entities/char_2009.gif) : :![[thin space (1/6-em)]](https://www.rsc.org/images/entities/char_2009.gif) H2O/sodium ascorbate/70 °C H2O/sodium ascorbate/70 °C |
240 | 87 | — | — | 45 |
| 2 | PVC–EDA–Cu(II)b | H2O/sodium ascorbate/70 °C | 155 | 85 | — | — | 46 |
| 3 | Cu–Cu2O@RGOc | H2O/25 °C | 135 | 89 | — | — | 18 |
| 4 | GO-CO-NH-IA–Cu(I)d | EtOH![[thin space (1/6-em)]](https://www.rsc.org/images/entities/char_2009.gif) : :![[thin space (1/6-em)]](https://www.rsc.org/images/entities/char_2009.gif) H2O, r.t. H2O, r.t. |
9 | 88 | — | — | 47 |
| 5 | GO/Fe3O4–CuBre | H2O/MWe/80 °C | — | — | 10 | 98 | 48 |
| 6 | Copper apatite | H2O/100 °C | — | — | 90 | 98 | 41 |
| 7 | Fe3O4@LDH@cysteine–Cu(I)f | Choline azide/75 °C | — | — | 20 | 96 | 44b |
| 8 | MNP@PDMA-Cug | H2O/50 °C/Na (ascorbate) | — | — | 150 | 90 | 49 |
| 9 | Cu/ACP/Am/Fe3O4@SiO2h | EtOH/80 °C | — | — | 20 | 91 | 50 |
| 10 | CuI@HWSS@FF | H2O/100 °C | 10 | 94 | 10 | 94 | This study |
Conclusions
Hot-water-soluble starch (HWSS) is prone to form stable complexes with both cobalt ferrite (CF) and ferrous ferrite (FF) NPs. The results of the XRD experiments, TEM imaging, and size histograms based on FE-SEM images of the as-prepared nano-composites suggest that CuI crystals graft from the HWSS coating of CF and FF NPs. Nevertheless, the nano-composites do not have a core–shell structure but are conglomerates of CuI NPs combined with CF or FF NPs. The VSM analysis displayed that HWSS impacts oppositely on coercivities of CF and FF NPs. As the result, HWSS@FF acquires a decreased coercivity than FF NP, but the coercivity of HWSS@CF is significantly greater than the CF NPs it was prepared from. These observations were interpreted as refluxing the NPs in aqueous HWSS solution entails with reduction of some Fe3+ cations in a depth on surface of the CF and FF NPs to Fe2+ cations. This reduction reaction leads to a stoichiometric correction on surface of FF, which is normally oxidized by air. In the case of CF NPs, the reduction reaction results in formation of a Fe2+-enriched yolk–shell on surface, which establishes a super spin-exchange with the inner zone of the NP. The increased coercivity makes HWSS@CF more suitable than pristine CF for application in fabrication of magnetic storage devices. On the other hand, the decreased coercivity of HWSS@FF makes it a more suitable nano-support than FF itself for better dispersion and separation of supported catalysts. HWSS also has a tendency to complex with CuI NPs and this led to formation of CuI@HWSS@FF and CuI@HWSS@CF nano-composites. Both of these nano-composites, with supremacy of CuI@HWSS@FF, efficiently catalyse the one-pot synthesis of 1,2,3-triazoles through the reaction of aralkyl halides, sodium azide, and phenylacetylene on water.Data availability
Almost all the experimental, analysis and spectroscopic data were included in the manuscript. The ESI† (available online) contains the NMR spectra of the 1,2,3-triazoles, the FT-IR spectra of CuI and HWSS, and the EDX spectra of the nano-composites.Author contributions
Professor Kurosh Rad-Moghadam: supervision, conceptualization, methodology, writing, review and editing. Seyyed Mohammad Rezapour Mousavi (PhD student): investigation, writing the original drafts, and data curation.Conflicts of interest
There are no conflicts to declare.Acknowledgements
The authors are grateful to the Research Council of University of Guilan and Iran Nanotechnology Initiative Council (INIC) for partial support of this work.Notes and references
- (a) R. Mout, D. F. Moyano, S. Rana and V. M. Rotello, Chem. Soc. Rev., 2012, 41, 2539, 10.1039/c2cs15294k; (b) B. C. Ranu, R. Dey, T. Chatterjee and S. Ahammed, ChemSusChem, 2012, 5, 22, DOI:10.1002/cssc2011.00348; (c) J. Mondal, T. Sen and A. Bhaumik, Dalton Trans., 2012, 41, 6173, 10.1039/c2dt30106g.
- C. Chen, X. Jiang, Y. V. Kaneti and A. Yu, Powder Technol., 2013, 236, 157, DOI:10.1016/j.powtec.2012.03.008.
- (a) S. G. Divakara and B. Mahesh, Results Eng., 2024, 21, 101702, DOI:10.1016/j.rineng.2023.101702; (b) S. Hanifi, M. G. Dekamin and M. Eslami, Sci. Rep., 2024, 14, 22201, DOI:10.1038/s41598-024-72407-x.
- R. Jasrotia, J. Prakash, Y. B. Saddeek, A. H. Alluhayb, A. M. Younis, N. Lakshmaiya, C. Prakash, K. A. Aly, M. Sillanpää, Y. A. M. Ismail, A. Kandwal and P. Sharma, Coord. Chem. Rev., 2025, 522, 216198, DOI:10.1016/j.ccr.2024.216198.
- M. D. Nguyen, H. V. Tran, S. Xu and T. R. Lee, Appl. Sci., 2021, 11, 11301, DOI:10.3390/app112311301.
- J. H. F. De Jesus, K. V. L. Lima and R. F. P. Nogueira, J. Environ. Chem. Eng., 2022, 10, 107765, DOI:10.1016/j.jece.2022.107765.
- (a) L. M. Rossi, N. J. S. Costa, F. P. Silva and R. Wojcieszak, Green Chem., 2014, 16, 2906, 10.1039/C4GC00164H; (b) P. R. S. Baabu, H. K. Kumar, M. B. Gumpu, J. Babu K, A. J. Kulandaisamy and J. B. B. Rayappan, Materials, 2023, 16, 59, DOI:10.3390/ma16010059.
- (a) A. Spoială, C. I. Ilie, L. N. Crăciun, D. Ficai, A. Ficai and E. Andronescu, Appl. Sci., 2021, 11, 11075, DOI:10.3390/app112211075; (b) D. Morán, G. Gutiérrez, R. Mendoza, M. Rayner, C. Blanco-López and M. Matos, Carbohydr. Polym., 2023, 299, 120223, DOI:10.1016/j.carbpol.2022.120223.
- (a) D. Tkachenko, V. Zheltova, K. Meshina, P. Vorontsov-Velyaminov, M. Emelianova, N. Bobrysheva, M. Osmolowsky, M. Voznesenskiy and O. Osmolovskaya, Appl. Surf. Sci., 2024, 672, 160873, DOI:10.1016/j.apsusc.2024.160873; (b) L. Xu, T. Yu, S. Li, J. Xu, B. Shen and Z. Zhang, Appl. Surf. Sci., 2024, 20, 161294, DOI:10.1016/j.apsusc.2024.161294; (c) M. G. Sibi, D. Verma and J. Kim, Catal. Rev. – Sci. Eng., 2020, 62, 163, DOI:10.1080/01614940.2019.1659555.
- H. Hosseinzadeh, K. Rad-Moghadam, M. Mehrdad and S. Rouhi, Sci. Rep., 2024, 14, 666, DOI:10.1038/s41598-023-51123-y.
- S. Azad-Poshtmakhi, K. Rad-Moghadam, H. Hosseinzadeh and S. Toorchi-Roudsari, ChemistrySelect, 2023, 8, e202300533, DOI:10.1002/slct.202300533.
- W. Tahir, T. Zeeshan, S. Waseem, M. D. Ali, Z. Kayani, Z. H. Aftab, S. M. T. Mehtab and S. Ezzine, Sci. Rep., 2023, 13, 15730, DOI:10.1038/s41598-023-41729-7.
- (a) S. Bikas, A. P. Marjani, S. Bibak and H. S. Aslaheh, Sci. Rep., 2023, 13, 2564, DOI:10.1038/s41598-023-29598-6; (b) F. Asghari-Haji, K. Rad-Moghadam, N. O. Mahmoodi, T. Tonekaboni and N. Rahimi, Appl. Organomet. Chem., 2017, 31, 3891, DOI:10.1016/j.molcata.2014.05.005; (c) S. Razikazemi, K. Rad-Moghadam and S. Toorchi-Roudsari, New J. Chem., 2018, 42, 12476–12485, 10.1039/C8NJ00718G; (d) K. Rad-Moghadam and N. Dehghan, J. Mol. Catal. A: Chem., 2014, 392, 97, DOI:10.1016/j.molcata.2014.05005; (e) L. Zhou, C. Gao and W. Xu, Langmuir, 2010, 26, 11217, DOI:10.1021/la100556p.
- P. Arévalo-Cid, J. Isasi, A. C. Caballero, F. Martín-Hernández and R. González-Rubio, Bol. Soc. Esp. Ceram. Vidr, Bol. Soc. Esp. Ceram. Vidr., 2022, 61, 300, DOI:10.1016/j.bsecv.2020.12.001.
- M. Ahmadian, K. Rad-Moghadam, A. Dehghanian and M. Jafari, New J. Chem., 2022, 46, 2940, 10.1039/D1NJ05341H.
- S. Mallick, P. Mukhi, P. Kumari, K. R. Mahato, S. K. Verma and D. Das, Catal. Lett., 2019, 149, 3501, DOI:10.1007/s10562-019-02909-1.
- N. Sun, Z. Yu, H. Yi, X. Zhu, L. Jin, B. Hu, Z. Shen and X. Hu, New J. Chem., 2018, 42, 1612, 10.1039/C7NJ04495J.
- Z. Li, H. Zhao, H. Han, J. Song, Y. Liu, W. Guo, Z. Sun and W. Chu, Appl. Organomet. Chem., 2018, 32, e4301, DOI:10.1002/aoc.4301.
- I. Santana-Martínez, J. M. Bautista-Renedo, S. V. Ayala-Bueno, N. Zavala-Segovia, N. González-Rivas, D. Corona-Becerril and E. Cuevas-Yañez, J. Mol. Struct., 2022, 1270, 1339690, DOI:10.1016/j.molstruc.2022.133969.
- A. Wiest and P. Kielkowski, J. Am. Chem. Soc., 2024, 146, 2151, DOI:10.1021/Jacs.3c11780.
- F. Ferrara, T. Beke-Somfai and N. Kann, Eur. J. Org Chem., 2024, 27, e202400113, DOI:10.1002/ejoc.202400113.
- M. Bonnard, S. Pinet, L. Chabaud and M. Pucheault, Eur. J. Org Chem., 2024, e202400580, DOI:10.1002/ejoc.202400580.
- R. P. Bunschoten, F. Peschke, A. Taladriz-Sender, E. Alexander, M. J. Andrews, A. R. Kennedy, N. J. Fazakerley, G. C. L. Jones, A. J. B. Watson and G. A. Burley, J. Am. Chem. Soc., 2024, 146, 13558, DOI:10.1021/jacs.4c03348.
- (a) M. Amini, A. Yousofvand, M. Hosseinifard, A. Bayrami and J. Janczak, Sci. Rep., 2024, 14, 653, DOI:10.1038/s41598-023-50624-0; (b) F. Salehzadeh, M. Esmkhani, M. Zallaghi, S. Javanshir and M. G. Dekamin, Sci. Rep., 2023, 13, 8675, DOI:10.1038/s41598-023-36012-8.
- Y. Jain, R. Gupta, P. Yadav and M. Kumari, Chemical waltz of organic molecules “on water”: saline-assisted sustainable regioselective synthesis of fluorogenic heterobioconjugates via click reaction, ACS Omega, 2019, 4, 3582, DOI:10.1021/acsomega.8b03167.
- W. Yan, X. Wang, K. Li, T. X. Li, J. J. Wang, K. C. Yao, L. L. Cao, S. S. Zhao and Y. H. Ye, Pestic. Biochem. Physiol., 2019, 156, 160, DOI:10.1016/j.pestbp.2019.02.017.
- A. B. Nejma, M. Znati, A. Daich, M. Othman, A. M. Lawson and H. B. Jannet, Steroids, 2018, 138, 102, DOI:10.1016/j.steroids.2018.07.004.
- D. Brunel and F. Dumur, New J. Chem., 2020, 44, 3546, 10.1039/c9nj06330g.
- D. R. Buckle, D. J. Outred, C. J. Rockell, H. Smith and B. A. Spicer, J. Med. Chem., 1983, 26, 251, DOI:10.1021/jm00356a025.
- Z. Liu, J. Liu, E. Gao, L. Mao, S. Hu and S. Li, Molecules, 2024, 29, 837, DOI:10.3390/molecules29040837.
- U. K. Purakkel, G. Praveena, V. Y. Madabhushi, S. S. Jadav, R. S. Prakasham, S. G. D. Varakala, D. Sriram, E. W. Blanch and S. Maniam, ACS Omega, 2024, 9, 8846, DOI:10.1021/acsomega.3c06324.
- P. D. Bangre, N. A. Karande, L. G. Rathi, D. J. Singhavi, R. O. Ganjiwale, A. Nagar, A. R. Bendale and K. R. Danao, Indian J. Heterocycl. Chem., 2024, 34, 1–6, DOI:10.59467/IJHC.2024.34.1.
- D. Carbone, M. F. Santos, D. Corbeil, G. Vistoli, B. Parrino, J. Karbanová, S. Cascioferro, C. Pecoraro, J. Bauson, W. Eliwat, F. Aalam, G. Cirrincione, A. Lorico and P. Diana, Bioorg. Chem., 2024, 150, 107589, DOI:10.1016/j.bioorg.2024.107589.
- R. Bouzammit, S. Belchkar, M. El-fadili, Y. Kanzouai, S. Mujwar, M. M. Alanazi, M. Chalkha, A. Nakkabi, M. Bakhouch, E. Gal, L. I. Gaina and G. Al-houari, Molecules, 2024, 29, 2510, DOI:10.3390/molecules29112510.
- (a) R. Eisavi and S. Ghadernejad, RSC Adv., 2023, 13, 27984, 10.1039/d3ra05433k; (b) Z. Gonda and Z. Novák, Dalton Trans., 2010, 39, 726, 10.1039/b920790m.
- R. M. Ward, Q. Gao, H. de Bruyn, R. G. Gilbert and M. A. Fitzgerald, Biomacromolecules, 2006, 7, 866, DOI:10.1021/bm050617e.
- L. Kumar, P. Kumar, A. Narayan and M. Kar, Int. Nano Lett., 2013, 3, 1–12, DOI:10.1186/2228-5326-3-8.
- Y. Chen, Y. Feng, H. Chu, D. Wu and Y. Zhang, Chemosphere, 2019, 221, 383, DOI:10.1016/j.chemosphere.2019.01.052.
- M. Ma, Y. Wu, J. Zhou, Y. Sun, Y. Zhang and N. Gu, J. Magn. Magn. Mater., 2004, 268, 33, DOI:10.1016/S0304-8853(03)00426-8.
- (a) O. Sevenou, S. Hill, I. Farhat and J. Mitchell, Int. J. Biol. Macromol., 2002, 31, 79, DOI:10.1016/S0141-8130(02)00067-3; (b) N. Santha, K. Sudha, K. Vijayakumari, V. Nayar and S. Moorthy, J. Chem. Sci., 1990, 102, 705, DOI:10.1007/BF03040801.
- S. Kale, S. Kahandal, S. Disale and R. Jayaram, Curr. Chem. Lett., 2012, 1, 69, DOI:10.5267/j.ccl.2012.3.002.
- Z. Hasanpour, A. Maleki, M. Hosseini, L. Gorgannezhad, V. Nejadshafiee and A. Ramazani, Turk. J. Chem., 2017, 41, 294, DOI:10.3906/kim-1607-40.
- Y. Kitamura, K. Taniguchi, T. Maegawa, Y. Monguchi, Y. Kitade and H. Sajiki, Heterocycles, 2009, 77, 521, DOI:10.3987/COM-08-S(F)56.
- (a) A. Pawar, S. Gajare, A. Jagdale, S. Patil, W. Chandane, G. Rashinkar and S. Patil, Catal. Lett., 2022, 152, 1854, DOI:10.1007/S10562-021-03772-9; (b) F. Pazoki, A. Salamatmanesh, S. Bagheri and A. Heydari, Catal. Lett., 2020, 150, 1186, DOI:10.1007/s10562-019-03011-2; (c) Y. Jain, M. Kumari and R. Gupta, Tetrahedron Lett., 2019, 60, 1215, DOI:10.1016/j.tetlet.2019.03.045.
- Z. Zhang, P. Song, J. Zhou, Y. Chen, B. Lin and Y. Li, Ind. Eng. Chem. Res., 2016, 55, 12301, DOI:10.1021/acs.iecr.6b03158.
- Y. Zhang, Z. Zhang, Y. Chen and Y. Li, Res. Chem. Intermed., 2017, 43, 7307, DOI:10.1007/s11164-017-3076-3.
- H. Naeimi and R. Shaabani, Ultrason. Sonochem., 2017, 34, 246, DOI:10.1016/j.ultsonch.2016.05.043.
- X. Xiong, H. Chen, Z. Tang and Y. Jiang, RSC Adv., 2014, 4, 9830, 10.1039/c3ra45994b.
- N. Zohreh, S. H. Hosseini, A. Pourjavadi and C. Bennett, Appl. Organomet. Chem., 2016, 30, 73–80, DOI:10.1002/aoc.3398.
- S. P. Vibhute, P. M. Mhaldar, S. N. Korade, D. S. Gaikwad, R. V. Shejawal and D. M. Pore, Tetrahedron Lett., 2018, 59, 41–3643, DOI:10.1016/j.tetlet.2018.08.045.
Footnote |
| † Electronic supplementary information (ESI) available. See DOI: https://doi.org/10.1039/d4na00883a |
| This journal is © The Royal Society of Chemistry 2025 |

