DOI:
10.1039/D4NJ05398B
(Communication)
New J. Chem., 2025, Advance Article
A large-Stokes shift styryl pyridinium derivative with a stable green-light emission for imaging mitochondria in live cells†
Received
18th December 2024
, Accepted 20th February 2025
First published on 21st February 2025
Abstract
A green-light-emitting styryl pyridinium probe (EPN) was developed for live-cell imaging applications. EPN exhibited a large Stokes shift (Δλ ≈ 150 nm), due to an efficient ICT across the π–acceptor system. The probe exhibited exceptional biocompatibility and excellent specificity for cellular mitochondria. EPN exhibited great photostability to continuous irradiation and exhibited stable emission in cells up to 5 hours post-staining.
Small-molecule fluorescent imaging dyes are versatile tools for visualizing complex biological environments.1–4 Recent advancements in fluorescence microscopy techniques that reach high spatial resolution (i.e., super-resolution) have unlocked the potential of biomedical imaging at the molecular level.5–7 Long-lasting, bright, and highly biocompatible imaging dyes are ideal for visualizing living systems. Probes with well-resolved excitation–emission profiles (i.e., large Stokes shifts) can effectively mitigate issues such as self-quenching of the fluorophore and bleed-through interferences that occur during imaging.4,8 Recently, several interesting large-Stokes shift (Δλ ≈ 100–200 nm) imaging dyes for the red to near-infrared emission region have been developed.9–12 Excited-state intra-molecular proton transfer (ESIPT) and intramolecular charge transfer (ICT) are two key photophysical phenomena that have been utilized to develop such large-Stokes shift imaging dyes.4,13,14 Undoubtedly, the development of red-light- and NIR-emitting probes has distinct advantages in biomedical imaging research due to their relatively high ability to penetrate biological tissues. However, many imaging experiments demand multi-color fluorescent labels to distinguish multiple components in complex biological environments. Therefore, the development imaging probes with favourable properties for imaging in the blue-green region is still critical for visualization purposes. Many available blue-green-light-emitting imaging dyes exhibit inherently narrow Stokes shifts (Δλ < 20 nm) and high cytotoxicity—as well as weak photostability, which limits their application in long-duration imaging sessions. Here, we report an interesting green-light-emitting π–acceptor (π–A)-type imaging probe (EPN) with a large Stokes shift (Δλ ≈100–150 nm) for imaging mitochondria in live cells. EPN exhibited excellent photostability and biocompatibility and may be considered as a promising imaging candidate.
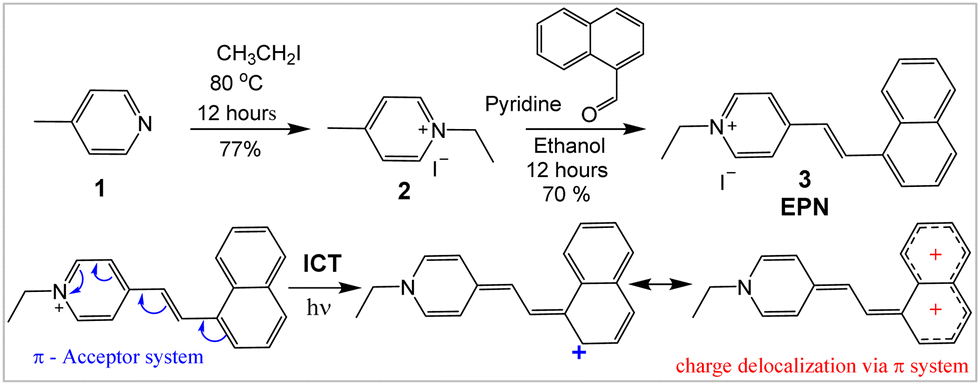
Synthesis
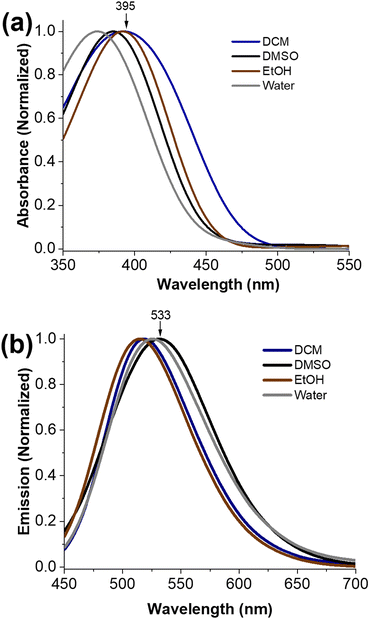
EPN (3) was synthesized in good yields by performing condensation of 1-napthaldehyde with pyridinium salt 2 as shown in Scheme 1. EPN was characterized using NMR spectroscopy and high-resolution mass spectrometry (Fig. S1, ESI†).
 |
| | Scheme 1 Synthesis and intramolecular charge transfer (ICT) in EPN. | |
Optical properties
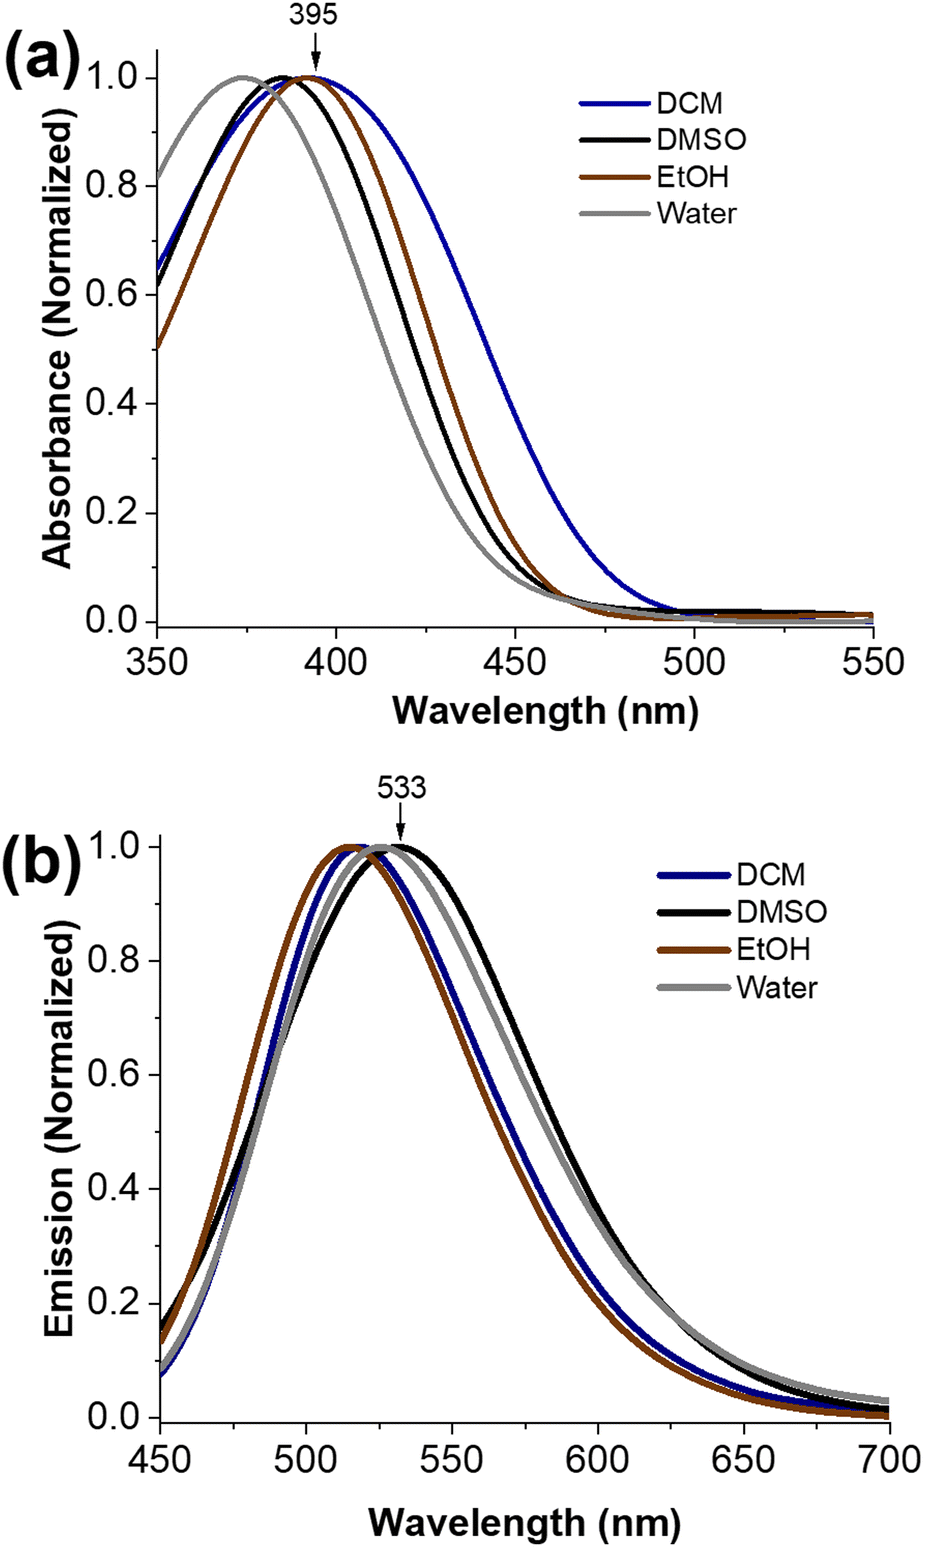
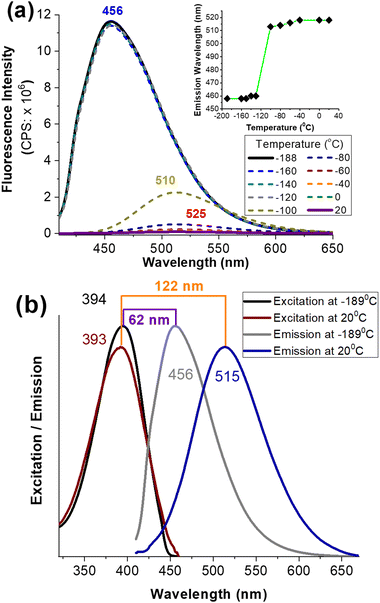
Photophysical properties of EPN in various solvents were studied and are summarized in Table 1 and Fig. 1. The absorbance spectra were acquired at λabs ≈ 370–395 nm (Table 1). The absorbance signal of EPN exhibited a moderate blue shift in polar solvents (i.e., λabs ≈ 370 in water) in comparison to non-polar solvents (i.e., λabs ≈ 395 in DCM), indicating a hypsochromic character (Fig. 1a). However, the emission of light from EPN did not exhibit such noticeable trend (Fig. 1b); this emission was found to be in the λem range 490–533 nm (i.e., blue-green region) with calculated fluorescent quantum yields (φfl) of 0.002–0.044 (Table 1). In comparison to the emission of light from EPN in other solvents, that in toluene was found to be significantly weaker (φfl ≈ 0.002), which can be explained by considering the characteristic “collisional quenching” properties of the solvent due to strong vibrational relaxations. The calculated Stokes shift (Δλ) values of EPN in environments ranging from non-polar to polar were determined to respectively range from ≈100 to 150 nm, indicative of a stronger ICT effect in the polar solvent environments that increased the Stokes shift.
Table 1 Photophysical properties of EPN
| Solvent |
Toluene |
DCM |
CHCl3 |
DMSO |
EtOH |
Water |
| λabs (nm) |
390 |
395 |
394 |
388 |
391 |
373 |
| λem (nm) |
490 |
518 |
507 |
533 |
514 |
525 |
| Δλ (nm) |
100 |
123 |
113 |
145 |
123 |
152 |
| ϕfl |
0.002 |
0.025 |
0.018 |
0.036 |
0.044 |
0.011 |
| ε(M−1 cm−1) |
8172 |
10![[thin space (1/6-em)]](https://www.rsc.org/images/entities/char_2009.gif) 458 458 |
10940 |
9888 |
10170 |
9426 |
 |
| | Fig. 1 (a) Absorbance and (b) emission spectra of EPN (1 × 10⁻⁵ M) in indicated solvent environments a 25 °C. EPN was excited with 390-nm-wavelength light and the emissions were collected from 420 nm to 700 nm. | |
Low-temperature studies
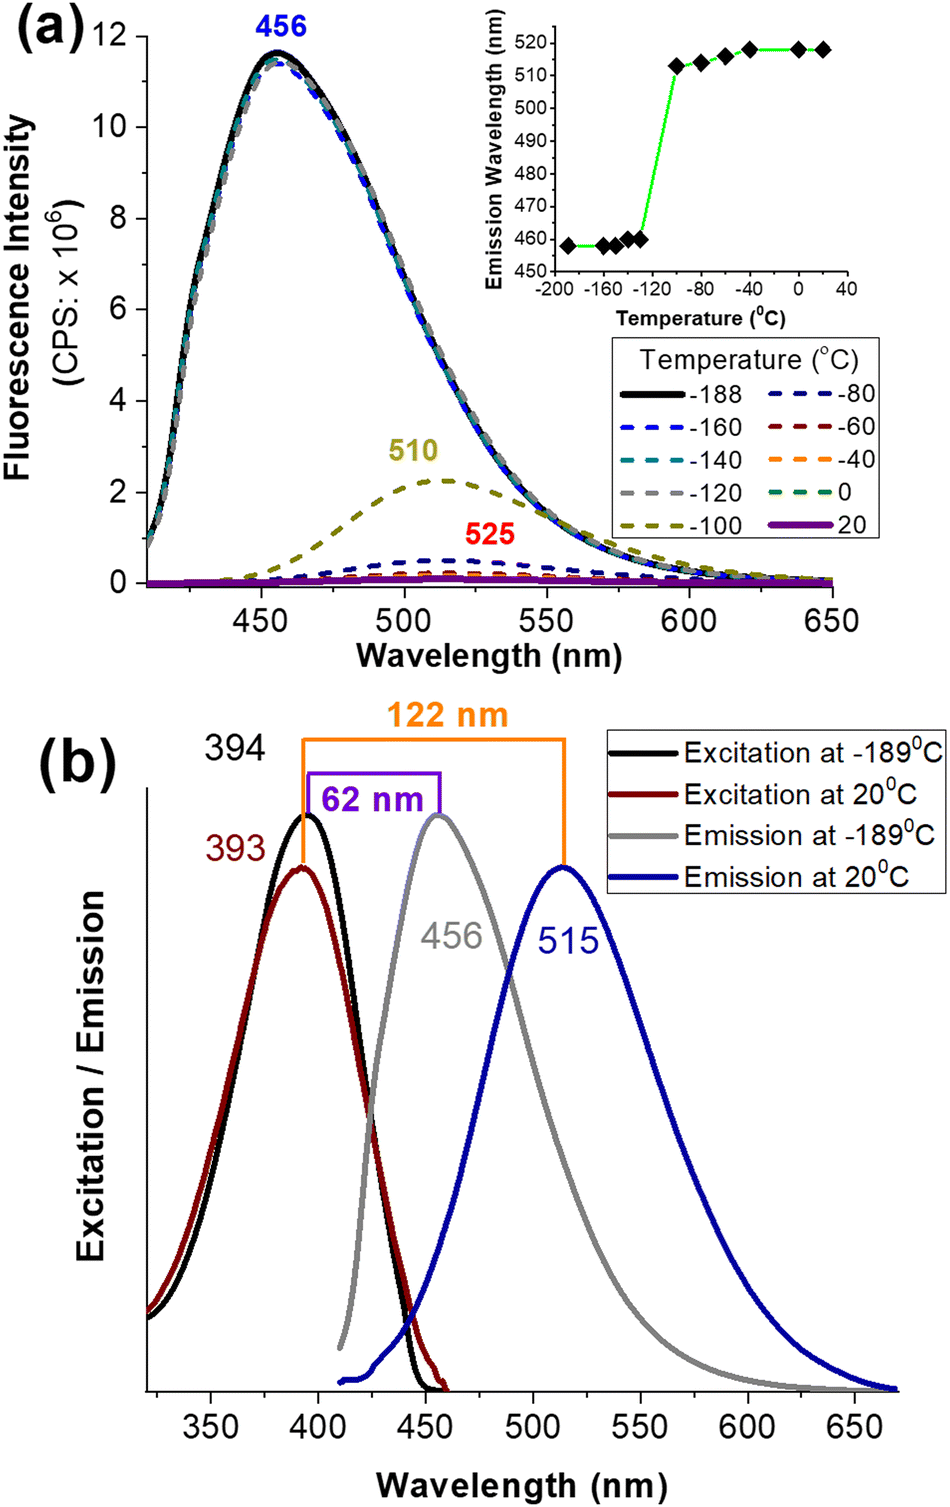
The large Stokes shift of EPN (Δλ ≈ 100–150 nm) can be attributed to the extended conjugation across naphthalene, which further stabilized strong intramolecular charge transfer (ICT) from naphthalene (π-system) to the styryl pyridinium acceptor group as shown in Scheme 1. To evaluate the impact of the ICT, an ethanolic solution of EPN was frozen in liquid nitrogen to limit the molecular motion and bond rearrangements associated with the ICT process. While EPN was frozen under the ethanol matrix at an ultra-low temperature (i.e., −188 °C), the probe exhibited an emission at λem ≈ 456 nm (Fig. 2). When the temperature was increased to room temperature (i.e., 25 °C), the emission peak was red-shifted to λem ≈ 514 nm (Fig. 2). The observed large spectral shift (Δλ ≈ 58 nm, from 456 nm to 514 nm) in response to the temperature change indicated the impact of a strong ICT interaction (Scheme 1).
 |
| | Fig. 2 (a) Fluorescence spectra of EPN (1 × 10⁻⁶ M) in EtOH at indicated temperatures. Inset at the top shows the emission of EPN as a function of temperature. EPN was excited at 390 nm to acquire the emission. (b) Normalized excitation and fluorescence spectra at indicated temperatures for EPN (1 × 10⁻⁶ M) in EtOH. | |
Live-cell imaging
The observed interesting photophysical properties encouraged us to investigate the potential of EPN to serve as a live-cell imaging probe. Thus, HepG2 cells (human hepatocellular carcinoma cell line) and A-172 cells (human glioblastoma cell line) were stained with EPN (2–4 μM) and visualized using fluorescence confocal microscopy (Fig. 3 and Fig. S6, S7, ESI†). Interestingly, cells stained with EPN exhibited a strong emission signal while exhibiting a non-uniform tubular network-like staining pattern, indicative of internalization into a specific cellular compartment. The resulting fluorescence confocal microscopy images did not exhibit a noticeable background signal, which suggested the suitability of the probe as a potential imaging dye. Based on our familiarity with the observed imaging pattern, we hypothesized that EPN became internalized into cellular mitochondria. The positively charged nature of EPN further supported our hypothesis, as many positively charged fluorescent dyes have exhibited the potential to localize into cellular mitochondria.
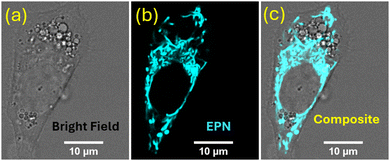 |
| | Fig. 3 Fluorescence confocal microscopy images of HepG2 cells stained with EPN (4 μM) for 30 minutes. Stained cells were excited with a 405-nm-wavelength laser line and the emissions with wavelengths from 480 nm to 560 nm were collected. | |
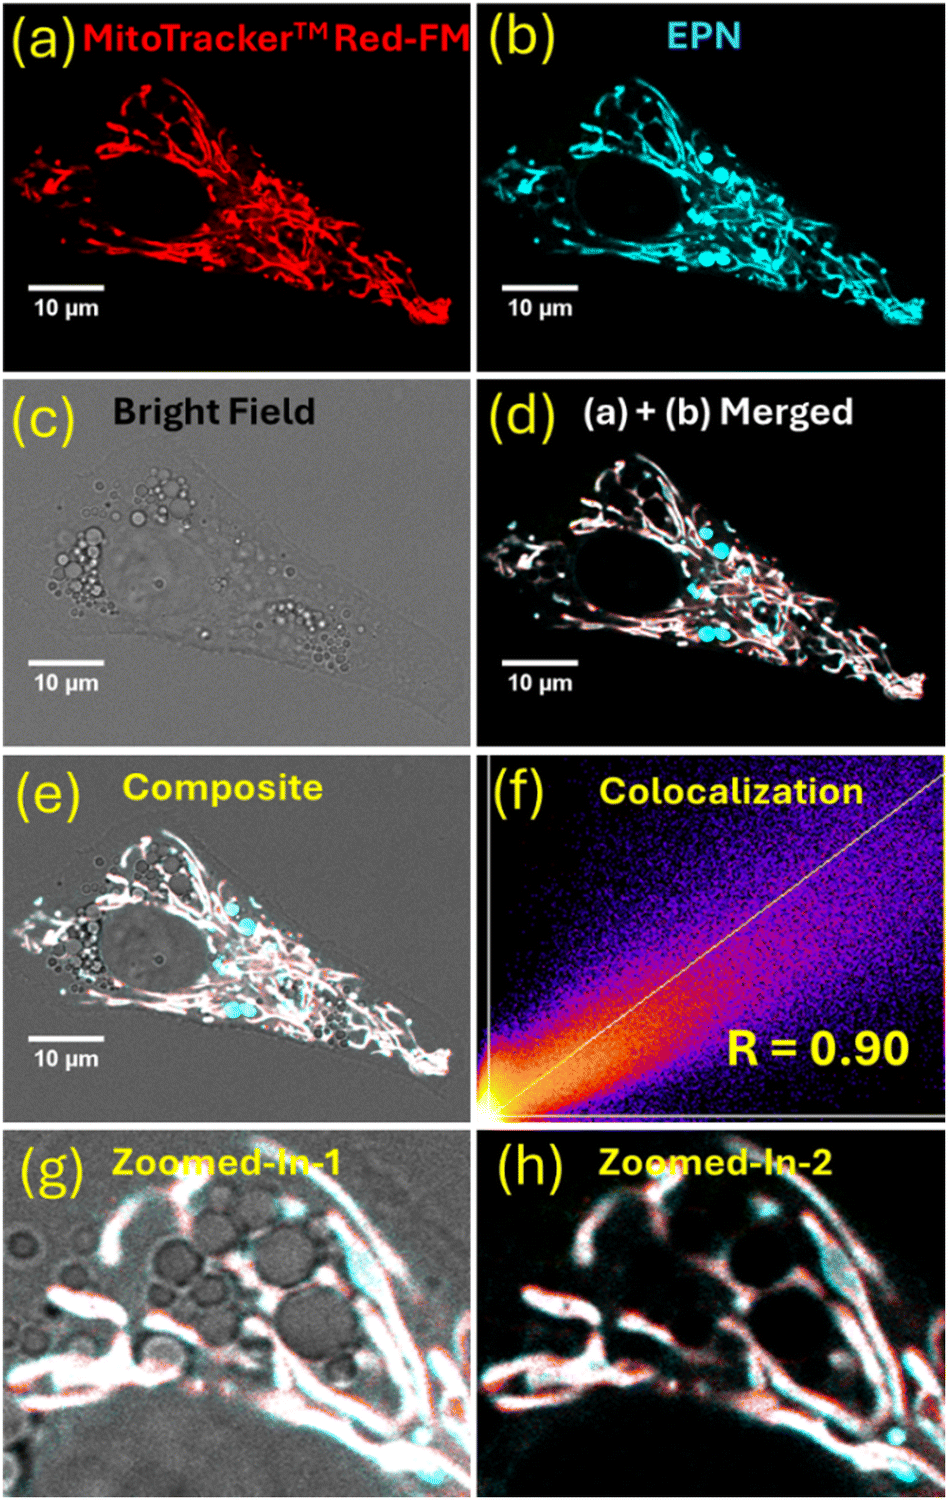
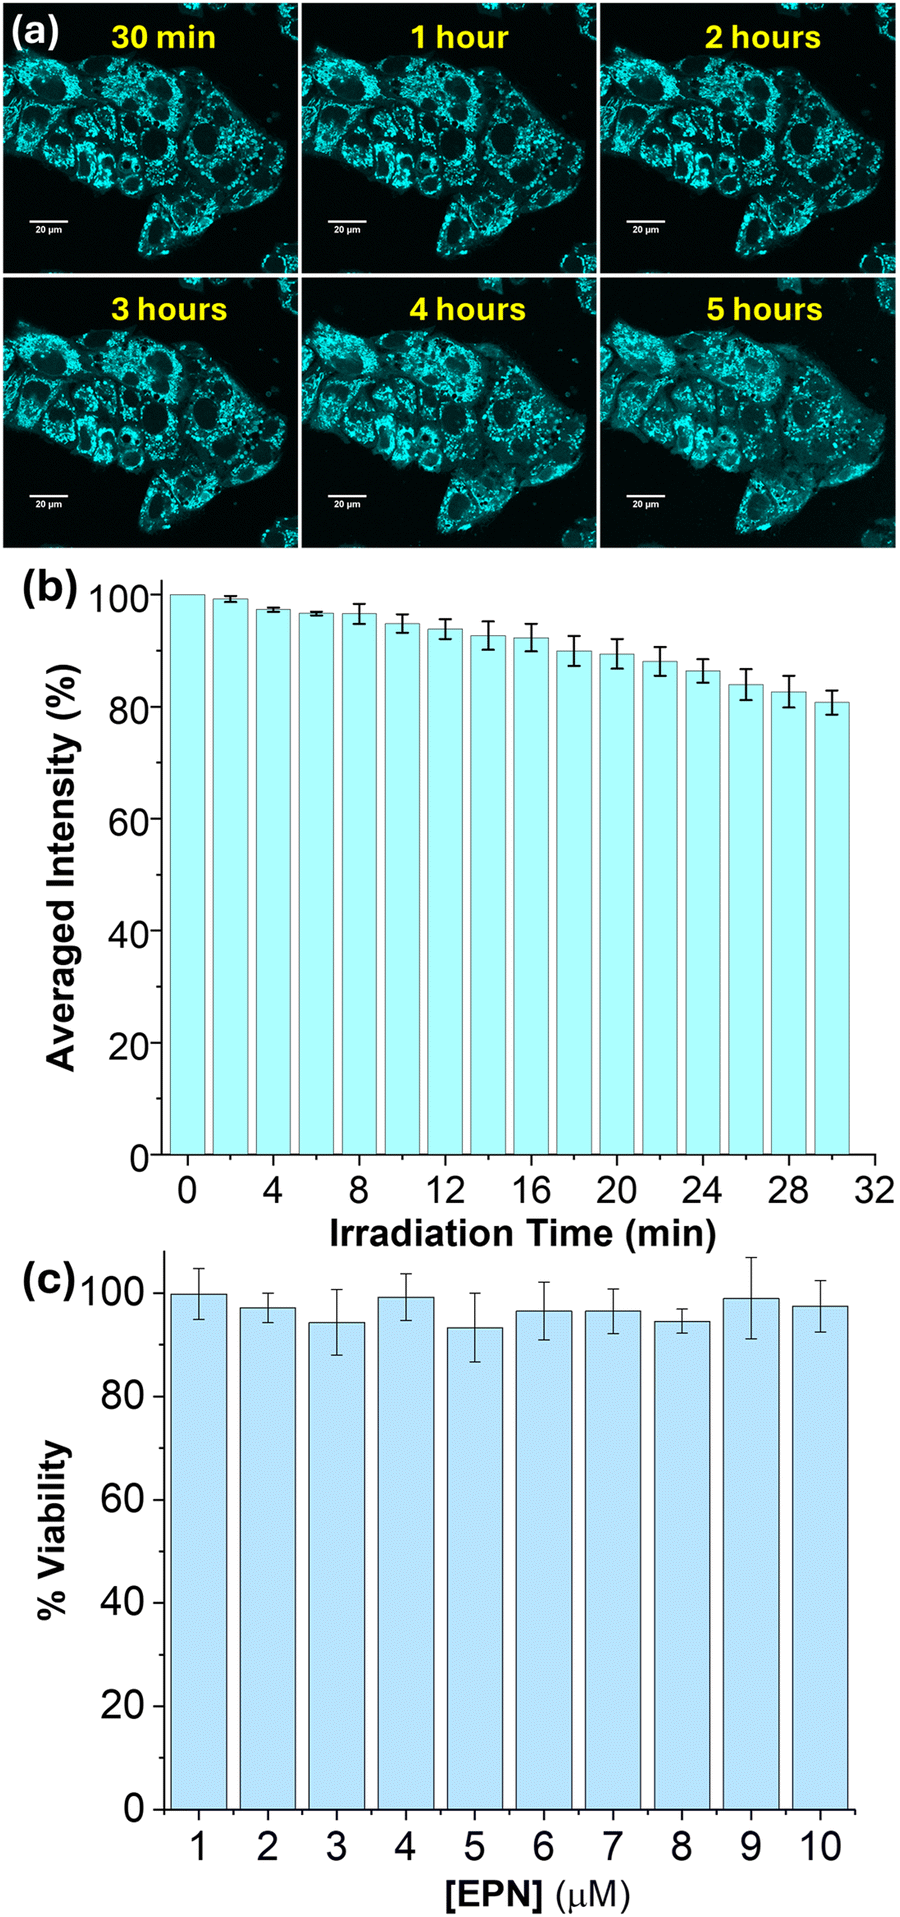
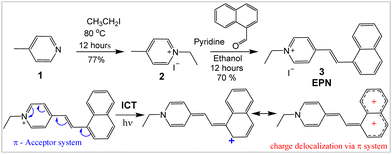
To confirm the subcellular specificity of EPN, fluorescence confocal microscopy colocalization imaging experiments were performed using HepG2 cells in the presence of a commercial mitochondrial marker (i.e., MitoTrackerTM Red FM: λex ≈ 579 nm, λem ≈ 579 nm). EPN exhibited an excellent colocalization (calculated Pearson's colocalization constant = 0.9) with MitoTrackerTM Red (Fig. 4), indicative of excellent specificity of the probe for mitochondria and hence providing compelling evidence to support its application as a versatile mitochondrial imaging probe. Considering the well-resolved excitation and emission spectral profiles (λex ≈ 400 nm, λem ≈ 520 nm) that produced a large Stokes shift (Δλ ≈ 100–150 nm) due to a strong ICT effect, EPN can be efficiently co-stained with any blue-green-light- to red-light-emissive fluorescent marker (λex ≈ range from 450 nm to 700 nm) without producing any signal interference (i.e., channel bleeding). EPN also exhibited exceptional stability in live-cell imaging where the probe was evaluated for imaging mitochondria in HepG2 cells for up to 5 hours (Fig. 5). The probe exhibited a stable emission from stained cells without any noticeable reduction in emission signal intensity (Fig. 5a). To further evaluate the photostability of the probe, HepG2 cells stained with EPN (4 μM) were continuously irradiated with a 405-nm-wavelength laser line (0.4 mW power) at 2-minute intervals for up to 30 minutes. Based on the collected fluorescence microscopy images, the percentage fluorescence recovered (average) was plotted as a function of the irradiation time (Fig. 5b). The calculated percentage recovery of the fluorescence was found to be over ∼85% for EPN after 16 irradiation cycles, which provided convincing evidence of its high photostability as a blue-green imaging dye. To further validate the suitability of EPN for live-cell imaging experiments, the biocompatibility of the probe was evaluated by taking cell viability measurements (Fig. 5c). Interestingly, based on the viability assessment, EPN did not exhibit any noticeable cytotoxicity at concentrations of up to 10 μM, confirming the suitability of the probe as a biocompatible mitochondrial marker. Also, the laser irradiation (405 nm) experiments performed using EPN-stained A-172 cells did not show any noticeable morphological changes in bright-field or dark-field confocal microscopy images, suggesting no potential phototoxicity effect at current staining concentrations (Fig. S8, ESI†).
 |
| | Fig. 4 Fluorescence confocal microscopy images of HepG2 cells stained with MitoTrackerTM Red FM (200 nM) and EPN (4 μM), specifically (a) MitoTrackerTM Red FM, (b) EPN, (c) bright field, (d) merging of two dyes, (e) composite image, (f) colocalization map, and (g)–(h) zoomed-in images of (d) and (e), respectively. MitoTrackerTM Red FM was excited with 570-nm-wavelength light and the emissions were collected from 580 nm to 700 nm. EPN was excited with a 405-nm-wavelength laser line and emissions were collected from 480 nm to 560 nm. | |
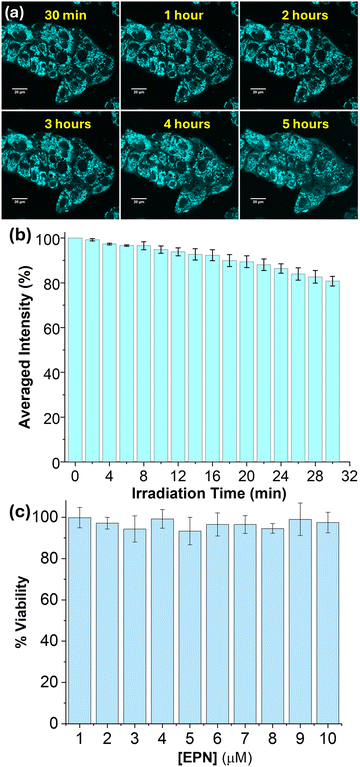 |
| | Fig. 5 (a) Fluorescenceconfocal microscopy images of HepG2 cells stained with EPN (4 μM). Images were obtained for experiments carried out for up to 5 hours. Scale bar denotes 10 μm. (b) Averaged fluorescence intensity (recovered) calculated after the continuous irradiation of EPN (4 μM)-stained cells for 30 minutes. (c) Cell viability data obtained for EPN using the CellTiter-Glo® Luminescent Cell Viability Assay. | |
Conclusions
In summary, a highly biocompatible blue-green-light-emitting pyridinium-based styryl dye (EPN) was synthesized in good yields for visualizing mitochondria in live cells. EPN exhibited a large Stokes shift (Δλ > 100 nm) due to strong ICT occurring via the π–acceptor system. The impact of the ICT was studied extensively by carrying out low-temperature fluorescence experiments, the results of which confirmed the contribution of ICT to the observed large Stokes shift. EPN was readily excitable with a commercially available laser line (i.e., 405 nm), which produced a blue-green visualization of stained HepG2 cells. The excellent specificity of EPN for mitochondria was confirmed by the results of fluorescence-microscopy-based colocalization studies (calculated Pearson's colocalization constant = 0.9). EPN also exhibited the ability to produce a stable fluorescence signal from stained cells for long time periods (i.e., up to 5 hours), confirming its suitability as a long-duration imaging probe. EPN was exposed to continuous laser irradiation (405 nm) to assess its photostability, and the probe exhibited over ∼85% fluorescence recovery after 30 minutes, indicative of excellent photostability. A cell viability assessment also provided supporting evidence to confirm the biocompatibility of EPN for live-cell imaging experiments. Due to its structural simplicity, well-resolved excitation/emission profiles, excellent photostability and biocompatibility, EPN may be considered a promising small-molecule imaging probe for biomedical imaging applications.
Author contributions
Conceptualization, C. S. A.; methodology, C. S. A., Y. P., R. V. S., K. J. W., and K. M. A.; validation, C. S. A., K. J. W., and K. M. A.; formal analysis, C. S. A.,K. M. A., and K. J. W.; investigation, C. S. A.,K. M. A., and K. J. W.; resources, C. S. A., Y. P., and R. V. S.; data curation, C. S. A., K. J. W., and K. M. A.; writing – original draft preparation, C. S. A, and K. J. W.; writing – review and editing, C. S. A., and K. J. W.; supervision, C. S. A., Y. P., R. V. S., and K. J. W.; project administration, C. S. A.; funding acquisition, C. S. A. All authors have read and agreed to the published version of the manuscript.
Data availability
The data supporting this article have been included as part of the ESI.†
Conflicts of interest
There are no conflicts to declare.
Acknowledgements
Authors sincerely thank Prof. Xiaobo Zhong from The Department of Pharmaceutical Sciences, University Connecticut for providing HepG2 cel line for this study.
Notes and references
- G. Y. Wiederschain, Biochemistry, 2011, 76, 1276–1277 CAS.
- J. Zhang, R. E. Campbell, A. Y. Ting and R. Y. Tsien, Nat. Rev. Mol. Cell Biol., 2002, 3, 906 CrossRef CAS PubMed.
- M. S. T. Gonçalves, Chem. Rev., 2008, 109, 190–212 CrossRef PubMed.
- C. S. Abeywickrama, Chem. Commun., 2022, 58, 9855–9869 RSC.
- G. Jacquemet, A. F. Carisey, H. Hamidi, R. Henriques and C. Leterrier, J. Cell Sci., 2020, 133, jcs240713 Search PubMed.
- M. Fernández-Suárez and A. Y. Ting, Nat. Rev. Mol. Cell Biol., 2008, 9, 929 CrossRef PubMed.
- M. V. Sednev, V. N. Belov and S. W. Hell, Methods Appl. Fluoresc., 2015, 3, 42004 CrossRef PubMed.
- Z. Zhang, G. Zhang, J. Wang, S. Sun and Z. Zhang, Comput. Theor. Chem., 2016, 1095, 44–53 CrossRef CAS.
- N. I. Wickramasinghe, B. Corbin, D. Y. Kanakarathna, Y. Pang, C. S. Abeywickrama and K. J. Wijesinghe, Biosensors, 2023, 13, 799 Search PubMed.
- L. Yuan, W. Lin and H. Chen, Biomaterials, 2013, 34, 9566–9571 CrossRef CAS PubMed.
- X. Peng, F. Song, E. Lu, Y. Wang, W. Zhou, J. Fan and Y. Gao, J. Am. Chem. Soc., 2005, 127, 4170–4171 Search PubMed.
- W. Zhang, X. Zhao, W. Gu, T. Cheng, B. Wang, Y. Jiang and J. Shen, New J. Chem., 2018, 42, 18109–18116 RSC.
- C. S. Abeywickrama and Y. Pang, Tetrahedron Lett., 2016, 57, 3518–3522 CrossRef CAS.
- V. S. Patil, V. S. Padalkar, K. R. Phatangare, V. D. Gupta, P. G. Umape and N. Sekar, J. Phys. Chem. A, 2011, 116, 536–545 CrossRef PubMed.
|
| This journal is © The Royal Society of Chemistry and the Centre National de la Recherche Scientifique 2025 |
Click here to see how this site uses Cookies. View our privacy policy here. 
 Open Access Article
 This Open Access Article is licensed under a Creative Commons Attribution-Non Commercial 3.0 Unported Licence
 *a,
Kavinda M. Arachchigea,
Kaveesha J. Wijesinghe
*a,
Kavinda M. Arachchigea,
Kaveesha J. Wijesinghe