 Open Access Article
Creative Commons Attribution 3.0 Unported Licence
Analyzing experimental UV–vis spectra of conjugated molecules in solution: Pekarian function fit†
Nina
Larina
a and
Vladimir
Khodorkovsky
 *b
*b
aThales DIS France SAS, Avenue du Pic de Bertagne, 13420, Gémenos, France
bAix-Marseille Université, CNRS, CINaM UMR 7325, 13288, Marseille, France. E-mail: vladimir.khodorkovsky@univ-amu.fr
First published on 3rd February 2025
Abstract
We present a modified version of the Pekarian function (PF) suitable for fitting of UV-vis absorption and fluorescence spectra. This function can be applied to fit organic conjugated compound spectra in solution with high accuracy and reproducibility, via optimization of five parameters that define the band shape for both vibronically resolved and unresolved bands. Three examples of spectra involving overlapping bands and requiring one to three PFs are presented in detail. Fitting of spectra can be performed using commercial PeakFit or Origin software (with user-defined functions provided) or through a homemade PekarFit Python script.
Introduction
Simulating the absorption and emission band shapes is a crucial aspect of interpreting experimental UV-vis spectra to study molecular electronic structures. Electronic spectral bands are broadened by vibronic effects and, depending on the nature of the absorbing or emitting species and their environment, the spectral appearance may vary from finely resolved multipeaked structures to completely unresolved broad bands. Given the current interest in organic donor–acceptor substituted dyes, which often show semiconducting properties, a nonlinear optical response, and potential for numerous practical applications,1–3 several examples of electronic spectra exhibiting varying degrees of resolution in the solid state and solution have been published. Such spectra are usually simulated by convolution using Gaussian or Lorentzian functions.‡4,5 However, this approach carries a significant risk of misinterpretation, as in reality even single absorption and emission bands are non-centrosymmetric at low temperatures (below approximately 150 °C). The properties of organic compounds usually satisfy the criteria of the ‘low’ temperature theory as the typical values of νvib for these molecules are in the range of 500 < νvib < 3000 cm−1.6 The approach to interpretation of the experimental absorption and fluorescence spectra is also crucial when comparing the derived band shapes and maxima to the results of quantum mechanical calculations. The electronic properties of conjugated organic derivatives, as well as their dipole moments, are highly temperature-dependent. Even at absolute zero, molecules possess vibrational energy that results in deviations from fully optimized coplanar geometries of molecules or interacting moieties.7 Studies of the temperature effects on the UV-vis spectra are relatively uncommon.8 Furthermore, some types of organic conjugated molecules, particularly polymethine dyes, undergo rapid internal rotation at room temperature or below, so that comparison of the experimental spectra to the ones calculated for usually planar optimized geometries of the same molecules is hardly possible.9,10 Internal rotation should be taken into account for interpretation of the UV-vis spectra, as we have demonstrated for a simple example of nitrobenzene.7 Another issue affecting the absorption and fluorescence spectra of conjugated molecules is the existence of moderate to strong solvatochromic shifts, which are often overlooked. In this study, we demonstrate the efficacy of employing the modified Pekarian function (PF) fitting approach to extract maximum quantitative information from the analysis of the experimental UV–visible spectra. Modifications of PF are needed to make it applicable for the experimental spectral fitting process and comparison of the fitting results with the results of quantum mechanical calculations, thus avoiding the errors related to determining the number of visible electron transitions while using the Gaussian or Lorentzian functions for spectral fitting.Results and discussion
Pekarian function (PF)
Quantitative theories that describe the shape of absorption bands associated with F-centers in crystals was independently and simultaneously proposed 75 years ago by Huang and Rhys11 and Pekar.12,13 Both theories incorporate two simplifications: (a) the lattice can be approximated as a dielectric continuum; (b) the effect of the JP-center can be considered as that of a static charge distribution.6,14More recently, the Huang–Rhys factor S, which represents the mean number of the phonons accompanying the optical transition, along with a Poisson progression with varying Gaussian broadening were used for fitting the experimental absorption spectrum of diindenoperylene in solution.15
The first simplification is essentially the same as the one applied to estimate solvent effects in quantum mechanical calculations of organic molecules in solution (in the absence of specific solute–solute and solute–solvent interactions). M. A. Krivoglaz and S. I. Pekar concluded that the analysis of the spectral shapes in crystals can be applied to liquids and, maybe, even gases involving large polyatomic molecules considering each molecule as a small crystal (see review 13b and ref. 4 therein). Therefore, we assumed that the function proposed by Pekar for the crystalline state (usually referred to as Pekarian function (PF))6,14 in the low-temperature approximation could also be applicable to the dilute solution case. To that extent, we have carried out numerous experiments over the past few decades on deconvolution and modeling of absorption and fluorescence band shapes of a whole range of organic derivatives – and the results have proven to be excellent. Some of our spectral deconvolution results were published earlier,16–19 but the practical implementation of this approach has not been previously disclosed since our first priority was verification of the reproducibility of fitting results. In this work, we describe in detail the realization of this deconvolution method.
The natural band shapes can be reproduced by PF with an approximate eqn (1):
 | (1) |
 is the overall band form function, corresponding to a single electronic transition consisting of multiple individual bands with form functions
  . S is approximately equal to the average number of the vibration quanta of energy dissipated into the surroundings by the molecule during its vibrational relaxation in the final state 2*.11–13 We make an assumption that there is only one vibrational mode of wavenumber νvib, which possesses one and the same value Ω in the states 1 and 2*: νvib(1) = νvib(2*) = Ω, interacting with the optical transition 1 → 2*. Then the index ‘k’ becomes an integer k = 0, 1, 2,…; and νk = ν0 + kΩ (absorption); νk = ν0 − kΩ (fluorescence). We find that this approximation works very well for analyzing the spectra in solution; however, for fitting the spectra with very narrow bands (as in the gas phase), two or even more vibrational modes are needed (see the ESI,† (formula (S1))). Limiting the analysis by molecules in solution justifies considering each of the individual bands as an almost undistorted Gaussian G(1, νk, σ0) centered at νk, whose contours are broader than the G12*(ν − νk) contours in the gas phase. The need for varying broadening parameters15 is removed and σ0 is characteristic for each spectrum.
The above simplification of PF leads to the expressions (2) and (3) that can be applied to fit experimental spectra using commercially available software such as PeakFit or Origin, or with our home-made fitting tool we wrote in Python. While our tool provides practically identical fitting results to those of the commercial software, our definition of more detailed outputs offers a deeper insight into the fitting process and outcomes.
PFa for absorption spectra:
 | (2) |
PFf for fluorescence spectra:
 | (3) |
It is worth noting in this context that in the special case of transitions involving charge transfer (CT) for both absorption and fluorescence, Marcus proposed expressions analogous to (2) and (3), where the parameters S, ν0, Ω and σ0 were presented as specific functions of the CT model.20
Experimental absorption spectra rarely involve one single electronic transition. In the presence of partially or fully overlapping bands, several PFa components must be used for fitting, each component with its own set of fitting parameters, as will be demonstrated below. Therefore, in parallel with fitting, it is recommended to carry out the corresponding quantum mechanical calculations on the molecules under investigation. The theoretical excitation energies (absorption maxima) calculated using time dependent (TD) DFT can be compared with the weighted averages 〈νge*〉 according to eqn (4).
| 〈νge*〉 = ν0 + Ω × S | (4) |
Rubrene (5,6,11,12-tetraphenyltetracene)
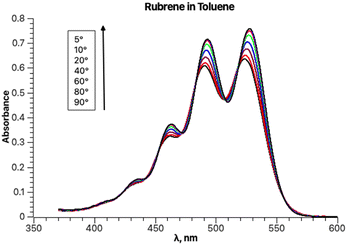
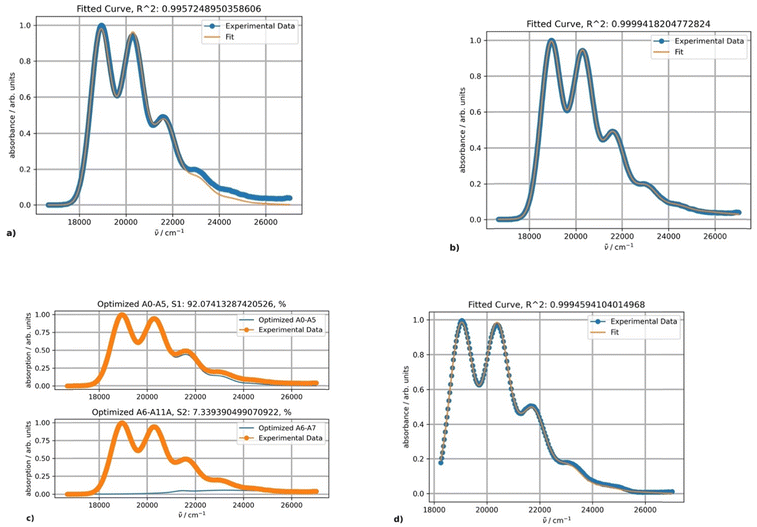
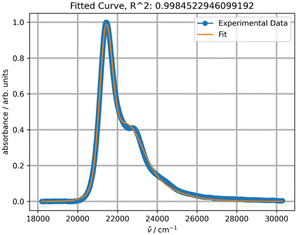
The experimental absorption spectra of rubrene in toluene at different temperatures are shown in Fig. 1.Lowering the temperature induces a systematic intensity increase, resulting in narrowing of the individual bands and a bathochromic shift of the overall band. The spectral data are truncated at approximately 370 nm to avoid interference with other absorption bands at lower wavelengths, including toluene absorption, rendering the spectra unsuitable for analysis. To avoid distortion of the absorption bands in the analyzed part of the spectrum, baseline correction is not performed prior to fitting. The fitting results for the experimental absorption and excitation spectra recorded at 20 °C are presented in Fig. 2.
The parameters S, ν0, Ω, σ0 and δ for the main absorption band (the major component, Fig. 2b) are 0.87, 18![[thin space (1/6-em)]](https://www.rsc.org/images/entities/char_2009.gif) 941, 1353.7, 448.3 and 15.1, respectively. The parameters of the minor second component lack physical significance, as it solely serves to separate the absorption tail from bands with maxima below 350 nm (corresponding to wavenumbers above 28
941, 1353.7, 448.3 and 15.1, respectively. The parameters of the minor second component lack physical significance, as it solely serves to separate the absorption tail from bands with maxima below 350 nm (corresponding to wavenumbers above 28![[thin space (1/6-em)]](https://www.rsc.org/images/entities/char_2009.gif) 570 cm−1). The origin of the second component can be confirmed by fitting the excitation band using only a single PF producing the same parameter values (Fig. 2d).
570 cm−1). The origin of the second component can be confirmed by fitting the excitation band using only a single PF producing the same parameter values (Fig. 2d).
Fitting the experimental absorption curves recorded at other temperatures showed that the parameter S is practically temperature-independent and has a value of 0.87. Parameter Ω exhibits weak temperature dependence, varying between 1352 cm−1 at 5 °C and 1365 cm−1 at 90 °C. As expected, stronger temperature dependence is detected for the parameter σ0 (the broadness of the Gaussian curves), which increases from 437 to 500 upon increasing the temperature from 5 to 90 °C, and for δ, which decreases from 20 to 0 for the same temperature change. The latter zero value of δ is predictable as it implies that the contribution of other vibrational modes does not influence the band shapes at 90 °C. Parameter ν0 within the same temperature range increases from 18![[thin space (1/6-em)]](https://www.rsc.org/images/entities/char_2009.gif) 923 to 19
923 to 19![[thin space (1/6-em)]](https://www.rsc.org/images/entities/char_2009.gif) 030 cm−1. Linear regression of ν0 at seven temperatures yielded r2 = 1 and extrapolation to −273.15 °C resulted in 18
030 cm−1. Linear regression of ν0 at seven temperatures yielded r2 = 1 and extrapolation to −273.15 °C resulted in 18![[thin space (1/6-em)]](https://www.rsc.org/images/entities/char_2009.gif) 573 cm−1 (538 nm). This value should normally be compared to the one calculated theoretically at 0 K. However, such a comparison will have to be addressed in a separate study, as the rubrene molecule is too complex for high-level quantum mechanical calculations. In particular, a DFT study on the electronic structure of rubrene using B3LYP/6-311(d,p) model chemistry showed that the optimized ground state of rubrene without a solvent involves the coplanar tetracene moiety.21 Our calculations showed that using B3LYP/Aug-CC-pVDZ model chemistry in toluene yields a twisted structure of the tetracene moiety, and the planar geometry is a transition state with a low barrier ΔG‡ of 7.1 kcal mol−1 (Fig. S1, ESI†), corresponding approximately to 135 K.22 Therefore, at room temperature both molecular conformations can coexist oscillating between the twisted conformers via the coplanar transition state, potentially explaining the existence of a variety of known rubrene polymorphs, planar and twisted.23 The average geometry from a prior frequency calculation with anharmonic correction should be used for TD calculations of the rubrene spectra for comparison with the experimental spectra. A full account of these results will be published elsewhere. Satisfactory fitting of the experimental fluorescence spectrum of rubrene using one PF (Fig. 3) confirms, in particular, the sample purity.
573 cm−1 (538 nm). This value should normally be compared to the one calculated theoretically at 0 K. However, such a comparison will have to be addressed in a separate study, as the rubrene molecule is too complex for high-level quantum mechanical calculations. In particular, a DFT study on the electronic structure of rubrene using B3LYP/6-311(d,p) model chemistry showed that the optimized ground state of rubrene without a solvent involves the coplanar tetracene moiety.21 Our calculations showed that using B3LYP/Aug-CC-pVDZ model chemistry in toluene yields a twisted structure of the tetracene moiety, and the planar geometry is a transition state with a low barrier ΔG‡ of 7.1 kcal mol−1 (Fig. S1, ESI†), corresponding approximately to 135 K.22 Therefore, at room temperature both molecular conformations can coexist oscillating between the twisted conformers via the coplanar transition state, potentially explaining the existence of a variety of known rubrene polymorphs, planar and twisted.23 The average geometry from a prior frequency calculation with anharmonic correction should be used for TD calculations of the rubrene spectra for comparison with the experimental spectra. A full account of these results will be published elsewhere. Satisfactory fitting of the experimental fluorescence spectrum of rubrene using one PF (Fig. 3) confirms, in particular, the sample purity.
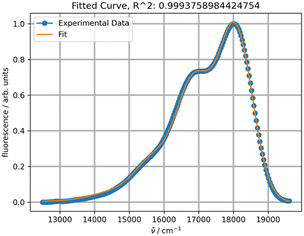 | ||
| Fig. 3 Fitting of the experimental fluorescence spectrum of rubrene in toluene at 20 °C with one PF. | ||
9,10-Diphenylanthracene (DPA)
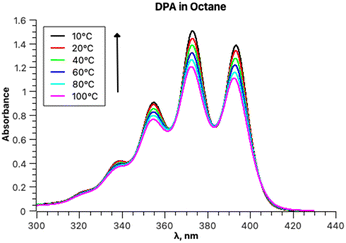
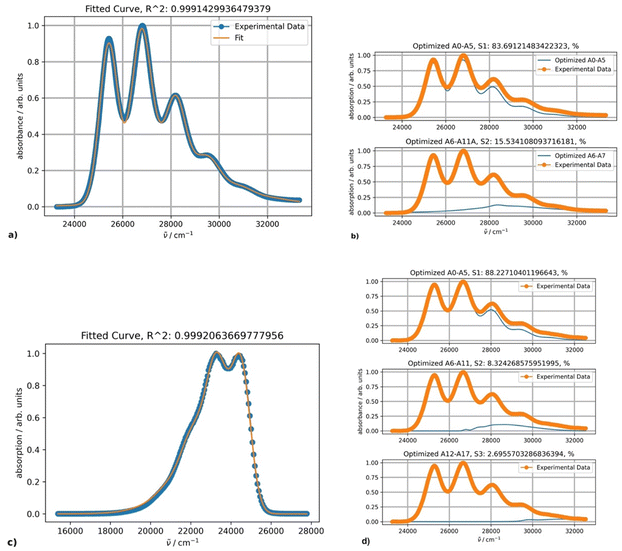
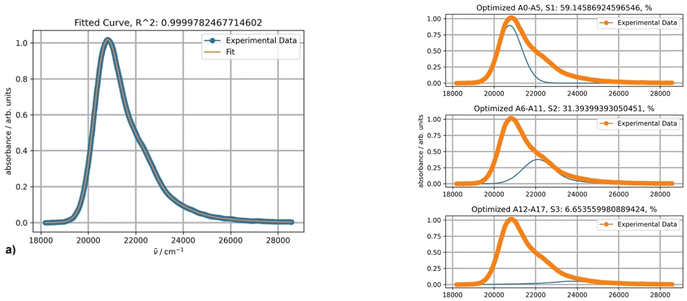
The experimental absorption spectra of DPA in octane at different temperatures are presented in Fig. 4.The absorption intensities also increase with lowering the temperature, whereas the bathochromic shifts are less pronounced. Fitting the absorption spectrum recorded at 20 °C using a single PF yields inconsistent results. Minimum two PFs are required for a satisfactory fit, as depicted in Fig. 5, in contrast to the case of rubrene. The second minor component of the fitting appears to belong to a broad low-intensity absorption band with a maximum at approximately 28![[thin space (1/6-em)]](https://www.rsc.org/images/entities/char_2009.gif) 500 cm−1; it could be partially mixed with the tail of a third higher energy electronic transition. Indeed, applying three-component fitting looks more consistent: it reveals the second broad absorption band about 28
500 cm−1; it could be partially mixed with the tail of a third higher energy electronic transition. Indeed, applying three-component fitting looks more consistent: it reveals the second broad absorption band about 28![[thin space (1/6-em)]](https://www.rsc.org/images/entities/char_2009.gif) 800 cm−1 (347 nm) (Fig. 5b). The third minor component is likely associated with the tail of the next higher-energy electronic transition.
800 cm−1 (347 nm) (Fig. 5b). The third minor component is likely associated with the tail of the next higher-energy electronic transition.
The parameters of the main vibronically split band remain essentially unchanged when two or three PFs are used and depend on the temperature as follows. Parameters S (1.0) and Ω (1360 cm−1) are temperature-independent, and parameter ν0 within the temperature range from 10 to 100 °C increases by 38 cm−1. Parameters σ0 and δ for the same temperature increase change from 376 to 421 and 41 to 27, respectively.
The geometry optimization of DPA was optimized using B3LYP/Aug-CC-pVDZ model chemistry in heptane yielding a planar anthracene moiety. The TD run produced two first excitation energies corresponding to 405 nm (f = 0.2) (HOMO → LUMO, the primary absorption band) and 330 nm (f = 0.004) (HOMO → LUMO+1).
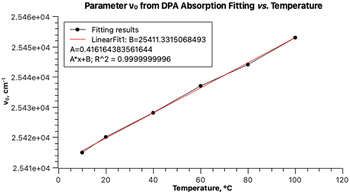
The values of the parameter ν0 of the main absorption band also linearly depend on the temperature (Fig. 6) and can be extrapolated to 0 K. The resulting transition energy of 25![[thin space (1/6-em)]](https://www.rsc.org/images/entities/char_2009.gif) 297 cm−1 (395 nm) is very close to the value calculated by TD DFT for the optimized ground state of DPA (405 nm). Of course, the two values are not fully comparable, because the former is obtained with taking into account the distortion of conjugation within the DPA molecule due to zero-point vibrations, whereas the calculated value is not linked to any temperature. Furthermore, the ratio of the areas under the main absorption band and under the secondary weaker broad band increases with decreasing temperature: 6.10 at 10 °C and 3.76 at 100 °C.
297 cm−1 (395 nm) is very close to the value calculated by TD DFT for the optimized ground state of DPA (405 nm). Of course, the two values are not fully comparable, because the former is obtained with taking into account the distortion of conjugation within the DPA molecule due to zero-point vibrations, whereas the calculated value is not linked to any temperature. Furthermore, the ratio of the areas under the main absorption band and under the secondary weaker broad band increases with decreasing temperature: 6.10 at 10 °C and 3.76 at 100 °C.
2-{[p-(Dimethylamino)phenyl]methylene}-1,3-indandione (DAPMI)
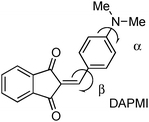
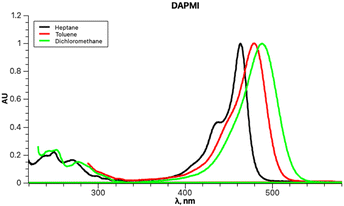
DAPMI, a typical electron donor–acceptor conjugated molecule, belongs to a series of 1,3-indandione derivatives that were recently investigated in detail.24 Both the electron donating –NMe2 group and electron accepting 2-methylene-1,3-indandione moiety undergo hindered rotation about C–N and C–C bonds at room temperature according to our previous dynamic 1H-NMR investigation.24 The coalescence temperature for the diethylamino derivative is 235 K for rotation about the C–C bond with a barrier to rotation of 10.2 kcal mol−1. The coalescence temperatures for the diisopropylamino derivative are 233 K for rotation about the C–C bond and 204 K for rotation about the C–N bond with the barriers of 10.1 and 9.4 kcal mol−1, respectively (all performed in CD2Cl2). Therefore, it is reasonable to assume that within the temperature range accessible in our experiments, both free rotations about C–C and C–N bonds occur. The experimental UV-vis spectra of DAPMI in three solvents of different polarity are shown in Fig. 7. The anticipated positive solvatochromism and broadening of the absorption band are readily discernible.
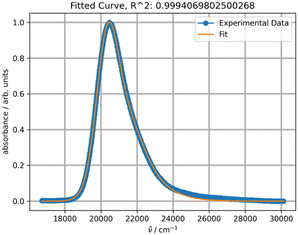
Upon initial inspection, the band shapes in all three solvents appear to resemble a typical one-transition spectrum. For instance, the spectrum in methylene chloride can be effectively fitted with a single peak function, as depicted in Fig. 8.
However, the spectra recorded in non-polar solvents, such as heptane, octane or cyclohexane, cannot be properly fitted using one PF. The shoulder shapes at about 22![[thin space (1/6-em)]](https://www.rsc.org/images/entities/char_2009.gif) 500 and 24
500 and 24![[thin space (1/6-em)]](https://www.rsc.org/images/entities/char_2009.gif) 000 cm−1 cannot be reproduced, although the R2 value is acceptable in principle (Fig. 9).
000 cm−1 cannot be reproduced, although the R2 value is acceptable in principle (Fig. 9).
Fitting a spectrum of DAPMI in methylene chloride using two PFs provided an excellent result, and a band centered about 22![[thin space (1/6-em)]](https://www.rsc.org/images/entities/char_2009.gif) 000 cm−1 was added (Fig. 10). This band completely overlaps with the first more intense band as the absorbance above 30
000 cm−1 was added (Fig. 10). This band completely overlaps with the first more intense band as the absorbance above 30![[thin space (1/6-em)]](https://www.rsc.org/images/entities/char_2009.gif) 000 cm−1 reaches zero. The values of parameters S (0.40) and Ω (809 cm−1) are typical for spectra with this band shape. The values of σ0 (595) and δ (174) are relatively high.
000 cm−1 reaches zero. The values of parameters S (0.40) and Ω (809 cm−1) are typical for spectra with this band shape. The values of σ0 (595) and δ (174) are relatively high.
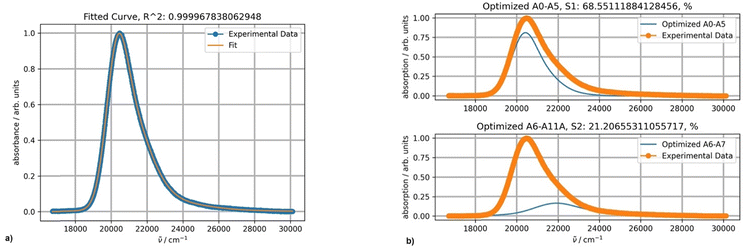 | ||
| Fig. 10 (a) Fitting a normalized spectrum of DAPMI in methylene chloride at 20 °C using two PFs; (b) the band shapes and contribution of each component (blue curves) for two-component fitting. | ||
The optimal results of the fitting spectra of DAPMI in nonpolar solvents can be achieved with three PFs (Fig. 11). The third component is minor, but still improves the fitting accuracy.
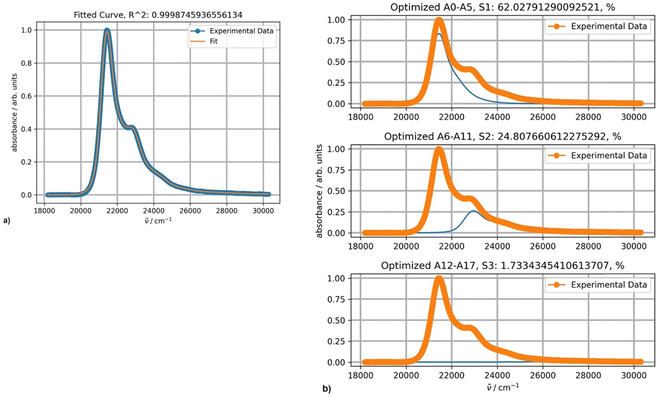 | ||
| Fig. 11 (a) Fitting a spectrum of DAPMI in cyclohexane at 20 °C with three PFs; (b) the band shapes and contribution of each component (blue curves) for three-component fitting. | ||
The temperature dependence of the band shapes of DAPMI solutions in toluene and cyclohexane (Fig. 12) is comparable to that in the case of rubrene (Fig. 1). The primary distinction lies in the fact that all the parameters except Ω (818–815 cm−1 in toluene) are sensitive to temperature decrease. Thus, in toluene parameter S decreases from 0.59 (100 °C) to 0.48 (at 0 °C), parameter ν0 from 20![[thin space (1/6-em)]](https://www.rsc.org/images/entities/char_2009.gif) 888 to 20
888 to 20![[thin space (1/6-em)]](https://www.rsc.org/images/entities/char_2009.gif) 608 cm−1, parameter σ0 from 526 to 479, and parameter δ from 335 to 230. All the parameters including Ω (510–464 cm−1) undergo changes for the spectra recorded in cyclohexane.
608 cm−1, parameter σ0 from 526 to 479, and parameter δ from 335 to 230. All the parameters including Ω (510–464 cm−1) undergo changes for the spectra recorded in cyclohexane.
 | ||
| Fig. 12 (a) Absorption spectra of DAPMI in toluene between 0 and 80 °C; (b) absorption spectra of DAPMI in cyclohexane between 10 and 80 °C. | ||
The fitting results obtained by using three PFs in toluene at 20 °C are presented in Fig. 13. The first two absorption bands correspond to absorption maxima at 469 and 450 nm as calculated by expression (4).
It is instructive to compare these results with the TD calculations in toluene. The optimized structure of DAPMI is planar. The first three calculated excited states are: 441 nm (f = 1.2, HOMO → LUMO), 412 nm (f = 0.06) and 397 nm (f = 0). This does not correspond to the fitted experimental spectrum. Rotation about the C–N (a) and C–C (b) bonds should be considered. Optimization of the DAPMI structure with a fixed C–N bond dihedral angle α at 20° showed that the intensity of the charge transfer transition that remains at 441 nm is expectedly lower, and at 90° (the TSN) the band practically disappears (f = 0). Otherwise, rotation about the C–N bond does not affect the visible range. In contrast, rotation about the C–C bond affects the visible range strongly. The intensity of HOMO → LUMO charge transfer transition is also reduced, but a considerable red shift occurs. Optimization of the DAPMI structure with a fixed C–C bond dihedral angle β at 26.5° shifts the absorption band from 441 nm to 474 nm, and further rotation also gives rise to disappearance of this band at 90° (the TSC) about 622 nm (f = 0) as shown in Fig. 14. The green curve with the calculated maximum at 474 nm at β = 26.5° is a good approximation of the experimental maximum at 469 nm. From the fitting results in Fig. 14, it can be inferred that the three-component fitting of the experimental spectrum can be interpreted as follows: the band at 469 nm corresponds to the calculated transition at 474 nm, the band at 450 nm corresponds to the calculated transition at 449 nm, and the third component, the broad weak band about 416 nm may correspond to the calculated transitions at 412 and 397 nm. Still, we cannot exclude that the third broad very weak band at 416 nm may be an artifact arising from the low sensitivity of the spectrophotometer. Rotation could be detected by the analysis of the absorption spectra at room temperature as the signatures of all species produced by rotation are present.
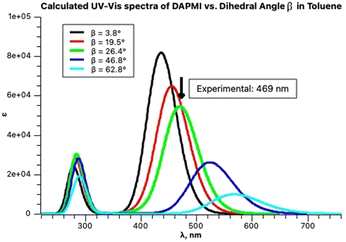 | ||
| Fig. 14 Calculated spectra of DAPMI in toluene at increasing C–C dihedral angle β presented by Gaussian functions. | ||
Experimental section
Ocean Optics USB4000 and USB2000+ spectrophotometers and a StellarNet CUV-Temp cuvette holder were utilized for the spectroscopic measurements. All calculations were carried out using Gaussian 16 software25 at the B3LYP/Aug-CC-pVDZ model chemistry for both geometry optimization and TD calculations (nstates = 12). This model chemistry was previously found as acceptable.7 The spectra were recorded at concentrations about 10−4 M in a 10 mm quartz cell and the concentration independence of the band shapes was verified by dilution to about 10−5 M in a 100 mm quartz cell. The experimental spectra were converted from wavelengths (nm) to wavenumbers (cm−1) and the fluorescence spectra were corrected according to the conversion rules. The spectra were normalized for convenience (although it is not mandatory).Rubrene and DPA were from Sigma-Aldrich while DAPMI was prepared according to the established procedure.24 We failed to fit the fluorescence spectrum of a commercial sample of DPA using one PF until double recrystallization from xylene was done.
The fitting procedure can be executed using PeakFit or Origin programs with the respective user-defined functions (udf) provided in the ESI.† In this study, we developed a custom script (PekarFit) coded in Python and based on the scipy.optimize (curve_fit) and matplotlib libraries. An example of the output generated by PekarFit is provided in the ESI.† PekarFit script is freely available upon request from the authors.
Conclusions
Using PF for fitting experimental UV-vis spectra provides a wealth of numerically reproducible information that in combination with the quantum mechanical calculations can deepen our understanding of the variation in the spectral band shapes. In particular, PF fitting offers a quantitative measure of the broadening of bands attributed to variations in solvents and temperature. Furthermore, it enables a detailed analysis of spectra with unresolved broad bands, and identification of optimal irradiation wavelengths for photochemical experiments based on the expression (4). PF fluorescence spectral fitting could be potentially beneficial for purity control as well.Comprehensive characterization of conjugated organic compounds using UV-vis spectra is advantageous for the accurate benchmarking of quantum-mechanical calculations. However, this characterization should encompass spectral recording in solvents of varying polarity and at different temperatures, followed by experimental spectral fitting. Prior to the final benchmarking, preliminary time-dependent density functional theory (TD) calculations at moderate model chemistries are necessary to ascertain the potential number of electronic transitions within the relevant range. The final benchmarking should be conducted using the molecular geometry corresponding to the spectral recording temperature(s).
In our opinion, the most significant next step is to validate the feasibility of determining the barriers to internal rotation, which are currently estimated solely through dynamic NMR measurements. Fitting the UV-vis spectra recorded above and below the NMR coalescence temperature could substantially simplify these experiments.
Author contributions
The authors equally contributed to the content of this manuscript: V. Kh.: conceptualization and writing – original draft; N. L.: writing – review and editing; and V. Kh. and N. L.: methodology, software, and investigation.Data availability
The Python ‘PekarFit’ script is available from the authors upon request.Conflicts of interest
The authors declare that there are no known conflicts to declare.Acknowledgements
We gratefully acknowledge the contribution of the late Dr Lev Shapiro at the beginning of this research between 1999–2004. This work was supported by the Centre National de la Recherche Scientifique and the computing facilities of CRCMM, ‘Centre Régional de Compétences en Modélisation Moléculaire de Marseille’.Notes and references
- R. Misra and S. P. Bhattacharyya, Intramolecular Charge Transfer, Wiley-VCH: 2018; pp 243 DOI:10.1002/9783527801916.
- Molecular Photoswitches, ed. Z. Pianowsky, Wiley, 2022, vol. 1, 2 DOI:10.1002/9783527827626.
- Nonlinear Optical Properties of Organic Molecules and Crystals, ed. D. S. Chemla and J. Zyss, Academic Press, N. Y., 1987, vol. 1, p. 2, ISBN 9780121706128 Search PubMed.
- T. J. Zuehlsdorff and C. M. Isborn, Int. J. Quantum Chem., 2019, 119, 1–18 CrossRef.
- J. A. Joens, J. Phys. Chem., 1993, 97, 2527–2534 CrossRef; J. A. Joens, J. Phys. Chem., 1994, 98, 1394–1397 CrossRef.
- J. J. Markham, Rev. Mod. Phys., 1959, 31, 956–989 CrossRef.
- V. Lokshin, M. Sigalov, N. Larina and V. Khodorkovsky, RSC Adv., 2021, 11, 934–945 RSC.
- Š. Sršeň, J. Sita, P. Slavíček, V. Ladányi and D. Heger, J. Chem. Theory Comput., 2020, 16, 6428–6438 CrossRef PubMed.
- J. Fabian, Dyes Pigm., 2010, 84, 36–53 CrossRef.
- D. Jacquemin and C. Adamo, Top. Curr. Chem., 2016, 368, 347–375 CrossRef PubMed.
- K. Huang and A. Rhys, Proc. R. Soc. London, Ser. A, 1950, 204, 406–423 Search PubMed.
- S. I. Pekar, Zh. Eksp. Teor. Fiz., 1950, 20, 510 Search PubMed.
- (a) S. I. Pekar, Untersuchungen uber die Elektronentheorie der Kristalle, Akademische-Verlagsgesellschaft, Berlin, 1954 DOI:10.1515/9783112649305; (b) M. A. Krivoglaz, Zero-Phonon Lines, in Homogeneous Broadening of Zero-Phonon Lines in the Impurity Spectra of Crystals and Glasses, ed. O. Sild and K. Haller, Springer, Berlin, Heidelberg, 1988 DOI:10.1007/978-3-642-73638-4_2.
- A. M. Stoneham, Theory of Defects in Solids, Oxford University Press, 2001, ch. 10, pp. 271–341 Search PubMed.
- U. Heinemeyer, R. Scholz, L. Gisslén, M. I. Alonso, J. O. Ossó, M. Garriga, A. Hinderhofer, M. Kytka, S. Kowarik, A. Gerlach and F. Schreiber, Phys. Rev. B: Condens. Matter Mater. Phys., 2008, 78, 085210 CrossRef.
- C. Niebel, V. Lokshin and V. Khodorkovsky, Tetrahedron Lett., 2008, 49, 5551–5552 CrossRef CAS.
- V. Lokshin, N. Larina, O. A. Fedorova, A. Metelitsa and V. Khodorkovsky, J. Photochem. Photobiol., A, 2009, 201, 8–14 CrossRef CAS.
- C. Niebel, V. Lokshin, A. Ben-Asuly, W. Marine, A. Karapetyan and V. Khodorkovsky, New J. Chem., 2010, 34, 1243–1246 RSC.
- A. Heynderickx, S. Nénon, O. Siri, V. Lokshin and V. Khodorkovsky, Beilstein J. Org. Chem., 2019, 15, 2059–2068 CrossRef CAS PubMed.
- R. A. Marcus, J. Phys. Chem., 1989, 93, 3078–3086 CrossRef CAS.
- H. Ma, N. Liu and J. D. Huang, Sci. Rep., 2017, 7, 331–342 CrossRef PubMed.
- M. Sigalov, V. Lokshin, N. Larina and V. Khodorkovsky, Phys. Chem. Chem. Phys., 2020, 22, 1214–1221 RSC.
- M. Moret and A. Gavezzotti, New J. Chem., 2022, 46, 7626–7637 RSC.
- M. Sigalov, R. Mazor, A. Ellern, N. Larina, V. Lokshin and V. Khodorkovsky, RSC Adv., 2022, 27766–27774 RSC.
- M. J. Frisch, G. W. Trucks, H. B. Schlegel, G. E. Scuseria, M. A. Robb, J. R. Cheeseman, G. Scalmani, V. Barone, G. A. Petersson, H. Nakatsuji, X. Li, M. Caricato, A. V. Marenich, J. Bloino, B. G. Janesko, R. Gomperts, B. Mennucci, H. P. Hratchian, J. V. Ortiz, A. F. Izmaylov, J. L. Sonnenberg, D. Williams-Young, F. Ding, F. Lipparini, F. Egidi, J. Goings, B. Peng, A. Petrone, T. Henderson, D. Ranasinghe, V. G. Zakrzewski, J. Gao, N. Rega, G. Zheng, W. Liang, M. Hada, M. Ehara, K. Toyota, R. Fukuda, J. Hasegawa, M. Ishida, T. Nakajima, Y. Honda, O. Kitao, H. Nakai, T. Vreven, K. Throssell, J. A. Montgomery Jr, J. E. Peralta, F. Ogliaro, M. J. Bearpark, J. J. Heyd, E. N. Brothers, K. N. Kudin, V. N. Staroverov, T. A. Keith, R. Kobayashi, J. Normand, K. Raghavachari, A. P. Rendell, J. C. Burant, S. S. Iyengar, J. Tomasi, M. Cossi, J. M. Millam, M. Klene, C. Adamo, R. Cammi, J. W. Ochterski, R. L. Martin, K. Morokuma, O. Farkas, J. B. Foresman and D. J. Fox, Gaussian 16, Revision A.02, Gaussian, Inc., Wallingford CT, 2016 Search PubMed.
Footnotes |
| † Electronic supplementary information (ESI) available: Generalization of PF, rubrene GS and TS calculations, example of PekarFit outputs, and UDFs for Origin and PeakFit programs. See DOI: https://doi.org/10.1039/d4nj05537c |
| ‡ We do not provide references to the papers utilizing Gaussian or Lorentzian functions for convolution of the experimental spectra because there are an excessive number of references. |
| This journal is © The Royal Society of Chemistry and the Centre National de la Recherche Scientifique 2025 |

