 Open Access Article
Creative Commons Attribution 3.0 Unported Licence
Mesoporous SiO2 based nanocomplex enzymes for enhanced chemodynamic therapy of pancreatic tumors†
Yue
Fan
ab,
Shulin
Yu
ab,
Zhaoshuo
Yang
ab and
Dingfang
Cai
 *ab
*ab
aDepartment of Integrative Medicine, Zhongshan Hospital, Fudan University, Shanghai, China. E-mail: cai.dingfang@zs-hospital.sh.cn
bLaboratory of Neurology, Institute of Integrative Medicine, Fudan University, Shanghai, China
First published on 14th February 2025
Abstract
Chemodynamic therapy (CDT) is a therapeutic method that uses a Fenton/Fenton-like reaction to convert intracellular H2O2 into highly cytotoxic ˙OH to effectively kill cancer cells. This method is adapted to the specific characteristics of the tumor microenvironment, boasting high selectivity and strong specificity among other advantages. However, CDT still faces challenges. Glutathione (GSH), which is present in high levels in the tumor microenvironment, can consume a large amount of ˙OH, significantly limiting the effectiveness of CDT. In this study, we synthesized a core–shell nanozyme (mSiO2@MnO2) with a composite structure comprising a mesoporous silica core and a manganese dioxide (MnO2) shell. The mesoporous structure was loaded with the chemotherapeutic drug genistein (Gen) and surface-modified with polyethylene glycol (PEG) to enhance its effectiveness in treating pancreatic cancer. This formulation, denoted as the Gen@mSiO2@MnO2-PEG nanocomplex enzyme, exhibits a dual action mechanism. Firstly, upon reaching tumor cells, it releases genistein for kinetic therapy and degrades the MnO2 shell. Secondly, GSH consumption triggers Fenton-like reactions to generate ˙OH, thereby enhancing CDT. At the cellular level, the Gen@mSiO2@MnO2-PEG nanocomplex enzyme demonstrates excellent biocompatibility. It induces the production of reactive oxygen species in the pancreatic cancer cell line PANC-1, disrupting the redox balance within tumor cells, and ultimately killing them. In vivo, the Gen@mSiO2@MnO2-PEG nanocomplex enzyme selectively accumulates at the tumor sites in PANC-1 tumor-bearing mice, resulting in the inhibition of tumor growth and metastasis. This study demonstrates that core–shell nanozymes serve as an effective platform for cancer therapy, enhancing the efficacy of combined chemotherapy and CDT for pancreatic cancer.
1. Introduction
Pancreatic cancer is characterized by its aggressive nature, rapid progression, and generally poor prognosis,1,2 with only 15% to 20% of patients being candidates for resection (surgical removal).3 Following surgery and adjuvant chemotherapy, the five-year survival rate sees only a modest improvement, ranging from 16.3% to 28.9%.4 The early symptoms of pancreatic cancer often present atypically, which can lead to missed or incorrect diagnosis. Consequently, by the time of diagnosis, the tumor is usually in an advanced stage. Rapid metastasis and chemotherapy resistance further contribute to the poor prognosis associated with pancreatic cancer.5 Currently, surgery is the only effective means to manage the progression of the disease; however, the opportunity for surgery is often missed due to diagnostic inaccuracies. Other common clinical treatments for pancreatic cancer include radiotherapy,6 chemotherapy,7 and biological agents,8 but these approaches are associated with significant side effects, such as alopecia and gastrointestinal symptoms. Therefore, there is an unmet need for more effective strategies to combat pancreatic cancer.Genistein is an isoflavone compound primarily derived from legumes and dentigerous plants. The chemical name of genistein is 5,7,4′-trihydroxyisoflavone, which is the main active ingredient of isoflavones.9 Recent research indicated that genistein shows promise as an anti-tumor agent, demonstrating inhibitory effects on various cancer cell lines, including those associated with breast cancer,10 colorectal cancer,11 gastric cancer,12 prostate cancer,13 and others14 in in vitro studies. In addition, genistein is a well-known inhibitor of the GLUT-1 protein, a regulator of signaling pathways that promote tumor development and progression.15 It is also associated with the induction of ROS production and the activation of the AMPK signaling pathway.16 Genistein has a powerful antioxidant effect, which is one of the anti-tumor mechanisms. The antioxidant effect was reflected in the following aspects: suppression of the induction of ROS production, suppression of the induction of H2O2 production, the activation of NF-kB and the induced activation of antioxidant enzymes. While genistein holds promise as a novel cancer chemotherapy agent, its low water solubility poses a challenge for intravenous administration. Moreover, oral administration leads to poor bioavailability. Therefore, addressing the dissolution of the drug in body fluids and its effective transport to tumor tissue remain an urgent issue.
The advancement of nanomaterials and associated technologies has led to the exploration and application of multifunctional nanomaterials in tumor diagnosis and treatment because of their excellent physical and chemical properties. The exceptional optical, acoustic, and magnetic properties of nanomaterials enable precise tumor imaging, offering crucial guidance for early tumor diagnosis and treatment.17 Additionally, nanomaterials can take advantage of the irregular vascular structure of tumors for passive targeting and accumulation at the tumor site through the enhanced permeability and retention (EPR) effect,18 thereby improving the effectiveness of tumor therapy while mitigating toxic side effects.
Manganese (Mn2+)-based nanomaterials are a class of nanocarriers that have attracted significant attention in recent years for their application in magnetic resonance imaging (MRI).19–21 Functionalized nanomaterials offer the potential to create an integrated platform for both tumor diagnosis and treatment. Recently, manganese dioxide (MnO2) nanomaterials have gained particular attention for use in various biological applications.22–25 For example, MnO2 has been employed as a carrier for cancer therapeutics, due to its unique acid sensitivity. In the mildly acidic tumor environment, MnO2 nanostructures will rapidly disintegrate, improving the drug release rate.24 The underlying mechanism of MnO2 as a smart chemodynamic agent in enhancing tumor chemodynamic therapy (CDT) has been detailed in recent research.26 After endocytosis, MnO2 can react with intracellular glutathione (GSH) to form oxidized GSH (GSSG) and Mn. This newly formed complex exhibits Fenton-like activity, generating highly reactive hydroxyl radicals (˙OH) from endogenous hydrogen peroxide (H2O2) in the presence of physiological bicarbonate (HCO3). The depletion of GSH, leading to an impaired antioxidant defense system, renders cancer cells more susceptible to the ˙OH formed in Mn-mediated Fenton-like processes, thereby enhancing CDT.27,28
Mesoporous silica nanoparticles (MSNs) are nanoscale silica-based particles with a porous structure, which exhibit high drug loading capacity and time-dependent drug release. Meanwhile, they have unique advantages such as a large surface area, a large pore volume, an adjustable pore size, abundant surface chemical properties, and wide biocompatibility, which are considered as an ideal choice for drug delivery in cancer therapy. Many previous studies pointed out that MSNs could serve as a delivery system for enhanced drug solubility of hydrophobic anticancer drugs and as a vehicle to overcome the insolubility problem of many anticancer drugs, which could be achieved by increasing the surface area of drugs in contact with the dissolution media. MSNs may overcome the low water solubility of genistein, which enhances the efficiency of the therapy. This study aims to develop a functional MnO2-based nanodrug carrier (mSiO2@MnO2) incorporating genistein, with the goal of enhancing chemotherapy and chemokinetic synergy therapy.
MnO2 nanodrug carriers have distinct GSH activation and release characteristics, enabling the direct delivery of genistein to its pharmacologically functional site. Upon the cleavage of MnO2, genistein is released from the mSiO2 mesopores, enhancing the drug efficacy and achieving precise and targeted tumor treatment. Simultaneously, Mn2+ can be used as a Fenton-like reagent for CDT.
2. Materials and methods
2.1. Materials
Hexadecyltrimethylammonium bromide (CTAB), sodium hydroxide (NaOH), tetraethyl orthosilicate (TEOS), potassium permanganate (KMnO4), polycyclic aromatic hydrocarbon (PAH), acrylic acid polymers (PAA), N-(3-dimethylaminopropyl)-N′-ethylcarbodiimide hydrochloride (EDC), methoxy polyethylene glycol amine (mPEG-NH2), and dimethyl sulfoxide (DMSO) were obtained from Sigma-Aldrich (St Louis, MO, USA). Phosphate buffer (PBS), fluorescein (FITC), and 4′,6-diamidino-2-phenylindole (DAPI) were purchased from Thermo Fisher Scientific (Waltham, MA, USA). Cell Counting Kit-8 was purchased from MedChem Express (Monmouth Junction, NJ, USA).2.2. Synthesis of mSiO2 nanoparticles
In a round-bottomed flask, 0.4 g of CTAB, 0.117 g of NaOH, and 200 mL of deionized water were combined and stirred thoroughly. The mixture was heated to 80 °C, then, 2 mL of TEOS was added and stirred for another 2 hours. The mixture was centrifuged, then, 80 mL of ethanol and 1.6 mL of concentrated hydrochloric acid were added to the products, and refluxed at 50 °C for 24 hours. After centrifugation, the resultant mSiO2 nanoparticles were washed with ethanol.2.3. Synthesis of Gen@mSiO2 nanoparticles
To incorporate genistein into the particles, 5.0 mg of genistein was dissolved in 2.0 mL of DMSO, then 5.0 mg of mSiO2 were added to the solution and stirred at room temperature for 24 hours.2.4. Synthesis of Gen@mSiO2@MnO2 nanoparticles
To synthesize Gen@mSiO2@MnO2 nanoparticles, Gen@mSiO2 and KMnO4 (20 mg) were dissolved in 10 mL of ultra-pure water. The mixture was stirred for 10 minutes and then centrifuged to collect the resultant Gen@mSiO2@MnO2 nanoparticles.2.5. Synthesis of Gen@mSiO2@MnO2-PEG nanoparticles
To synthesize Gen@mSiO2@MnO2-PEG nanoparticles, 10 mg of Gen@mSiO2@MnO2 was dispersed in 10 mL of deionized water, then 40 mL of a 10 mg mL−1 PAH solution was added and stirred for 20 minutes. After centrifugation, Gen@mSiO2@MnO2-PAH nanoparticles were obtained which were then redispersed in 10 mL of deionized water, then 40 mL of a 10 mg mL−1 PAA solution was added and stirred for 20 minutes. After centrifugation, Gen@mSiO2@MnO2-PAH/PAA nanoparticles were obtained which were then redispersed in 10 mL of PBS (pH 7.4), then 40 mg of EDC was added and stirred for 60 minutes. Finally, 200 mg of mPEG-NH2 and 80 mg of EDC were added and stirred for 24 hours. After centrifugation, Gen@mSiO2@MnO2-PEG nanoparticles were obtained, which were then washed in deionized water.2.6. Nanoparticle characterization
The structural shape and size of the mSiO2 and mSiO2@MnO2 nanoparticles were determined using scanning electron microscopy (SEM, JSM-IT200, Japan) at 20 kV and transmission electron microscopy (TEM, JEOL JEM-2100F, Japan) at 200 kV.The zeta potential of the mSiO2, mSiO2@MnO2, mSiO2@MnO2-PAH, mSiO2@MnO2-PAH/PAA, and mSiO2@MnO2-PEG nanoparticles was measured by dynamic light scattering (DLS) using a Zetasizer Nano-ZS (ZetaAPS, MAS, USA).
2.7. Genistein loading and release profile
To incorporate genistein into the particles, 5.0 mg of genistein was dissolved in 2.0 mL of DMSO, then 5.0 mg of mSiO2 and mSiO2@MnO2-PEG nanoparticles were added to the solution and stirred at room temperature for 24 hours. The nanoparticles loaded with genistein were collected by centrifugation to obtain Gen@mSiO2@MnO2-PEG nanoparticles. The UV absorbance was measured at 270 nm, and the genistein content in the supernatant was determined based on a standard curve. The loading capacity was calculated as the difference between the quantity of genistein in the supernatant and the initial amount.To determine the release profile of the incorporated genistein, Gen@mSiO2@MnO2-PEG nanoparticles were treated with different concentrations of GSH. Gen@mSiO2@MnO2-PEG nanoparticles (10 mg) were dispersed in 2 ml of PBS (pH 7.4) and placed into a dialysis bag (Spectra/Por, molecular weight 12–14 kDa). The dialysis bag was immersed in 48 mL of PBS and incubated at 37 °C while oscillating. At 0, 1, 2, 4, 8, 12, 16 and 24 hours, 1 mL of the dialysate was extracted, and an equal volume of PBS was replenished. The absorbance was measured at 270 nm by ultraviolet spectrophotometry (Multiskan SkyHigh, Thermo Fisher Scientific, Waltham, MA, USA), and the content was calculated based on a standard curve.
2.8. ˙OH generation by an Mn2+-mediated Fenton-like reaction
mSiO2@MnO2-PEG was thoroughly mixed with 25 mM NaHCO3/5% CO2 and GSH solutions of different concentrations for 15 minutes. After centrifugation, the supernatant was collected and combined with 5 μg mL−1 methylene blue (MB) and a 50 μM H2O2 solution. After a 30-minute reaction at 37 °C, the absorbance was measured at 650 nm.2.9. Cell viability assay
The viability of CP-H025 and PANC-1 cells was analyzed using a Cell Counting Kit-8. Cells were seeded into 96-well plates (1 × 10⁴ cells per well) and incubated overnight at 37 °C and 5% CO2. Subsequently, different concentrations of mSiO2@MnO2-PEG nanoparticles were added and incubated for 24 hours. Following this, 10 μL CCK-8 reagent was added to each well for 2 hours. Finally, the absorbance was measured at 450 nm using an enzyme marker (SpectraMax i3x, Molecular Devices, USA).CCK-8 was also used to assess the synergistic cytotoxic effects on PANC-1 cells. Different concentrations of genistein, Gen@mSiO2, and Gen@mSiO2@MnO2-PEG nanocomplex enzymes were added for an additional 24-hour culture period. Then 10 μL CCK-8 reagent was added to each well for 2 hours and the absorbance was measured at 450 nm using an enzyme marker.
2.10. In vitro cellular uptake assay
To assess cellular uptake, 5 × 10⁵ CP-H025 and PANC-1 cells per well were seeded into 12-well plates and incubated overnight at 37 °C and 5% CO2. FITC-labeled mSiO2@MnO2-PEG nanoparticles were added for a further 6-hour culture period. Following PBS washes, DAPI was then added for 5 minutes. The cells were observed and images were acquired using confocal laser scanning microscopy (CLSM, STELLARIS 5, Leica, Wetzlar, Germany).2.11. Detection of intracellular ROS levels
To assess the intracellular ROS levels in PANC-1 cells, 1 × 10⁵ cells in the logarithmic growth stage were seeded into each well of a 24-well plate and cultured overnight. Subsequently, mSiO2@MnO2-PEG nanoparticles were introduced for co-incubation for 6 hours. Following this, the medium was removed, and the fluorescent probe DCFH-DA (100 mM) was added and incubated for 25 minutes. Finally, the staining solution was removed, and the fluorescence signal of the sample was observed by CLSM.2.12. Detection of GSH levels
To assess GSH levels, 1 × 10⁵ PANC-1 cells in the logarithmic growth stage were seeded into each well of a 24-well plate and cultured overnight. Subsequently mSiO2 and mSiO2@MnO2 nanoparticles were introduced for co-incubation for 24 hours. Finally, Ellman's reagent was used to detect the GSH level.2.13. Analysis of in vivo treatment
Healthy female nude mice aged between four and six weeks were purchased from the Shanghai Laboratory Animal Center (Shanghai, China). Female nude mice (4–6 weeks old; Shanghai Laboratory Animal Center, China) were housed four per cage with food and water available ad libitum and maintained on a 12 h light/dark cycle under standard and specific pathogen-free conditions. A total of 20 mice were used in this experiment. Mice were acclimatized for 1 week before receiving injection of cancer cells. Animals were individually identified using numbered ear tags. All in vivo experiments were approved by the Animal Ethics Committee of Zhongshan Hospital, Fudan University. The study was conducted in accordance with the local legislation and institutional requirements.PANC-1 tumor-bearing mice were established through subcutaneous injection of 5 × 10⁶ PANC-1 cells into the axilla of the upper limb. Once the tumor reached a volume of 100 mm3, the mice were divided into five groups, each consisting of four mice. They were individually injected with either PBS, mSiO2@MnO2, free genistein, Gen@mSiO2, or Gen@mSiO2@MnO2-PEG nanocomplex enzymes. The materials were injected every three days, and the body weight and tumor volume of the mice were monitored every other day for a total duration of 15 days. Following treatment, the mice were sacrificed. The tumor tissues were carefully dissected, weighed, and photographed. The tumor tissues were then fixed in 4% paraformaldehyde and stained using hematoxylin and eosin (H&E) and terminal deoxynucleotidyl transferase dUTP nick end labeling (TUNEL).
2.14. Metabolic distribution of ICG-Gen@mSiO2@MnO2-PEG in PANC-1 tumor-bearing mice
Indocyanine green (ICG) was mixed with Gen@mSiO2@MnO2-PEG nanoparticles and incubated for 6 hours to obtain ICG-Gen@mSiO2@MnO2-PEG nanoparticles. This complex was then injected into PANC-1 tumor-bearing mice via the caudal vein and imaged using a small animal imaging system at 0.25, 0.5, 1, 2, 4, 8, and 24 hours. ICG-Gen@mSiO2@MnO2-PEG nanoparticles were also injected into PANC-1 tumor-bearing mice through the tail vein. After 24 hours, the mice were sacrificed, and the heart, liver, spleen, lungs, intestine, kidneys, pancreas, stomach, muscle, bone, and tumors were collected. The in vivo drug metabolism was observed using small animal imaging technology.2.15. Flow cytometry apoptosis experiments
Flow cytometry was performed with the Annexin V-FITC/PI apoptosis detection kit (abs50001, Absin, Shanghai, China). The group of control, mSiO2@MnO2, free Gen, Gen@mSiO2, and Gen@mSiO2@MnO2-PEG nanocomplex enzymes were added to PANC-1 cells and incubated for 48 h, respectively. The cells were transferred to flow special collection tubes and centrifuged at room temperature at 3000 rpm for 5 min, and the supernatant was discarded. 500 μL 1× binding buffer was added to the suspension of cells, then 5 μL Annexin V-FITC and 10 μL propyl iodide were added, and the cells were placed in a laser 8-color flow cytometer (FACSCalibur, BD Biosciences, San Jose, CA, USA) at room temperature for 5 min, away from light to detect apoptosis. FlowJo 7.6 Software was used for quantification.2.16. ROS levels as detected by MitoSOX (MCE 1003197-00-9)
(1) Preparation of storage solution: A 5 mM storage solution was prepared by diluting 50 μg MitoSOX Red with 13 μL anhydrous DMSO. (2) Preparation of working solution: 1–10 μM MitoSOX Red working solution was prepared by diluting the storage solution with preheated serum-free cell medium or PBS. The concentration of MitoSOX Red working liquid was adjusted according to the actual situation, and the current mix was used. (3) 100 μL dye working solution was added, shaken gently to completely cover the cells, and incubated for 5–30 minutes. (4) The dye working liquid was blotted, the medium was washed 2–3 times, 5 minutes each time, and the levels of ROS were tested.2.17. JC-1 staining experiments
The mitochondrial membrane potential was measured by the JC-1 method (T3168, Thermo Fisher). According to the manufacturer's instructions, the cells were washed with PBS and then stained with a JC-1 probe for 30 minutes under dark conditions at 37 °C/5% CO2. Subsequently, the free probe was removed with PBS and images were captured using confocal microscopy (Leica TCS SP8). The changes of mitochondrial membrane potential were evaluated from the red–green fluorescence ratio. To determine immunofluorescence, the red/green immune signal was converted to average gray intensity and subsequently analyzed using Image-Pro Plus 6.0 software (Media Cybernetics).2.18. Biological safety analysis
Healthy male Babl/c mice, aged between six and eight weeks, were injected with Gen@mSiO2@MnO2-PEG nanoparticles for three days and 30 days. Blood samples were collected from the ocular vein for routine blood tests and biochemical analysis. The heart, liver, spleen, lungs, and kidneys were extracted and subjected to H&E staining.2.19. Statistical analysis
Data are presented as mean ± SEM from a minimum of three independent experiments. Statistical analysis was performed using the GraphPad Prism software. The significance of differences among groups was evaluated using one-way ANOVA with a multiple comparisons test. A p-value less than 0.05 was considered statistically significant.2.20. Live subject statement
All experiments were approved by the Ethics Committee of Zhongshan Hospital, Fudan University and carried out in strict compliance with the relevant laws and institutional guidelines of Zhongshan Hospital, Fudan University, Shanghai, China.3. Results and discussion
3.1. Characterization of mSiO2@MnO2 nanocomposites
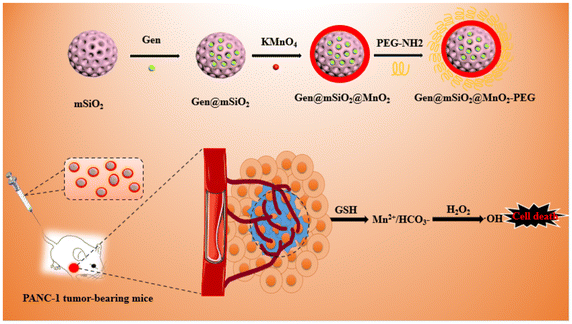
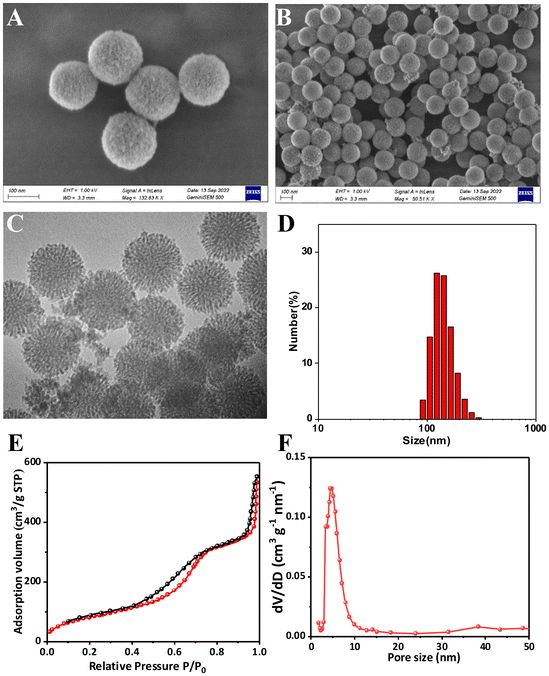
The Gen@mSiO2@MnO2-PEG nanocomplex enzyme was engineered with the MnO2 shell uniformly encapsulating the mesoporous silica nanospheres (Fig. 1). Both TEM and SEM confirmed that mSiO2 had a spherical shape with a well-defined surface pore size distribution. The particle size (diameter) ranged from 120 to 140 nm, and the dispersion was uniform (Fig. 2A and C). Additionally, DLS analysis confirmed the mSiO2 particle size (Fig. S1†). Genistein was loaded onto the mesopores of mSiO2 by physical adsorption, and TEM and SEM images demonstrated that this did not alter the morphology or size of the mSiO2 (Fig. 2B and D). The loading rate of genistein was quantified as 13.6% using UV spectrophotometry. To obtain mSiO2@MnO2, in situ crystallization was employed to grow a layer of MnO2 on the surface of mSiO2. TEM and SEM images revealed the presence of an MnO2 shell, resulting in a notable change in morphology, with the original mesoporous mSiO2 structure becoming less discernible (Fig. 3A–C). The hydrated particle size of mSiO2@MnO2 was approximately 200 nm, as measured by DLS, indicating that the MnO2 shell was successfully coated onto the mSiO2 surface (Fig. 3D). Finally, mSiO2@MnO2 was surface-modified with polyethylene glycol (PEG). The sequential modifications of MnO2, MnO2-PAH, MnO2-PAH/PAA, and MnO2-PEG resulted in changes in the zeta potential of mSiO2 (Fig. S2†). Fig. S3† shows TEM observation results of the morphology changes of the material when it was incubated with tumor tissue lysate for 1–12 h. It can be seen that the MSN surface began to degrade (white arrow) at 1 h of incubation. With the increase of incubation time, the rough structure of the particle surface was degraded, and the internal structure began to collapse, and most of the structure was finally dissociated. The results showed that the particles could be biodegraded in the tumor tissue environment. Meanwhile, the strong oxidizing property of potassium permanganate did not affect the drug activity of genistein during the preparation of nanoparticles. We have demonstrated the result by the CCK8 assay and there was no significant difference between the two groups (WT genistein vs. KMnO4 treated genistein) (Fig. S4†). The Brunauer–Emmett–Teller (BET) test was employed to assess the structure, surface area, and pore size of mSiO2@MnO2. The mSiO2@MnO2 nanomaterial exhibited an adsorption isotherm of a typical type IV mesoporous material, featuring a distinct H1-type hysteresis loop, confirming its mesoporous structure (Fig. 3E). The surface area of the mSiO2@MnO2 nanomaterial was calculated to be 318 m2 g−1 and the pore size distribution (Fig. 3F), indicates a pore size of 4.4 nm. These results confirm the successful synthesis of mesoporous mSiO2@MnO2 nanomaterials and that the presence of mesopores facilitates the loading of genistein. Taken together, these findings validate the successful synthesis of the Gen@mSiO2@MnO2-PEG nanocomplex enzyme.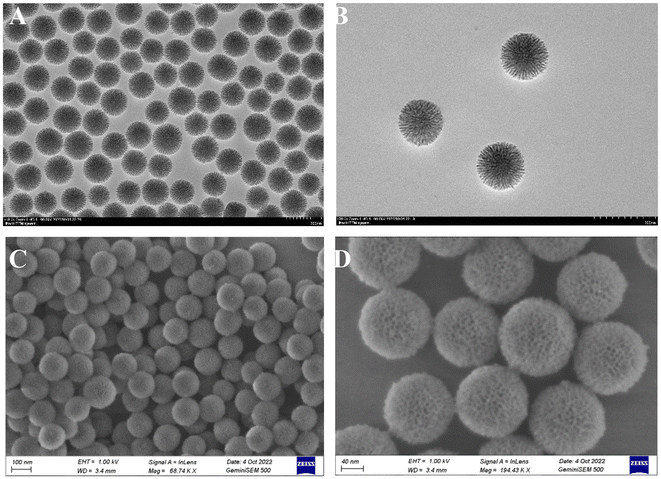 | ||
| Fig. 2 Synthesis and characterization of Gen@mSiO2 nanozymes. TEM image of mSiO2 (A) and Gen@mSiO2 (B). SEM image of mSiO2 (C) and Gen@mSiO2 (D). | ||
In this study, mesoporous silica nanospheres were synthesized by the sol–gel method. TEM, SEM, and DLS analyses revealed a consistent circular mesoporous structure of the silica nanospheres with a uniform size, measuring approximately 120–140 nm in diameter. This size range is optimal for cancer targeting due to the high surface area and loading capacity of the particle. Additionally, previous studies have shown that 100 nm particles have a high rate of uptake by cancer cells.29 The N2 adsorption/desorption test established that the specific surface area of the nanomaterial was 318 m2 g−1. The pore size was determined to be 4.4 nm and the mesoporous structure remained intact after genistein loading.
3.2. mSiO2@MnO2-PEG nanozymes catalyze ROS generation from GSH in vitro
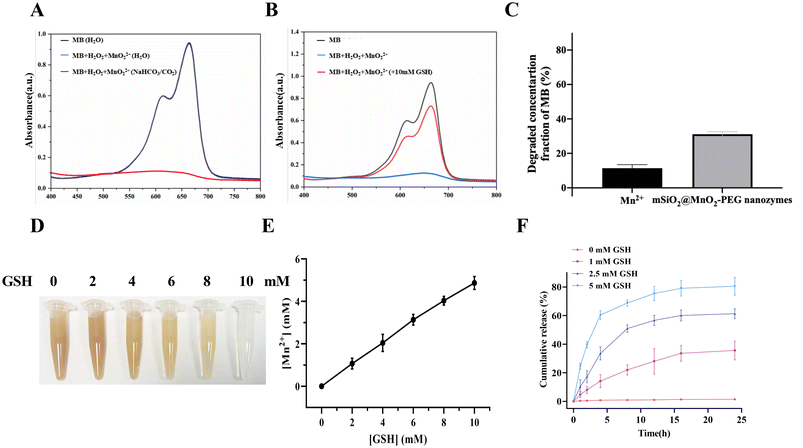
We initially assessed the Fenton-like reaction of mSiO2@MnO2-PEG nanozymes by monitoring the absorption peak at 652 nm, using MB as an indicator.30 The Fenton-like reaction of mSiO2@MnO2-PEG nanozymes is pH-sensitive (Fig. 4A). In a neutral environment (H2O) and in the presence of H2O2, the absorbance of the solution at 650 nm does not change significantly. These results suggest that mSiO2@MnO2-PEG nanozymes do not generate ˙OH under neutral conditions, thereby preventing damage to normal cells. In the presence of H2O2 and a slightly acidic environment (NaHCO3/CO2 buffer), the absorbance decreased significantly after one hour reaction. This indicates that mSiO2@MnO2-PEG nanozymes generated ˙OH through a Fenton-like reaction, resulting in the degradation of MB. The degradation of MB induced by ˙OH was greatly inhibited in the presence of GSH (Fig. 4B), indicating that GSH can effectively neutralize the generated ˙OH, thereby limiting the efficiency of CDT. Furthermore, the mSiO2@MnO2-PEG nanocomplex enzyme had a higher capacity for catalyzing the production of H2O2 and ˙OH compared to Mn2+ alone, resulting in a higher level of MB degradation (Fig. 4C).Due to the ability of MnO2 to consume GSH,31 the color of mSiO2@MnO2-PEG nanozymes became progressively lighter after incubation with increasing GSH concentrations (Fig. 4D). Additionally, the Mn2+ produced in this process was also concentration-dependent (Fig. 4E). The shell of MnO2 on mSiO2@MnO2-PEG nanozymes self-degraded with GSH depletion, facilitating the release of genistein from the mesopores, enabling responsive drug release in the tumor environment. The release rate of genistein was dependent on the concentration of GSH, with increased release with higher GSH concentrations (Fig. 4F).
In contrast to normal tissues, the tumor microenvironment has distinct physiological characteristics, including a mildly acidic pH, reduced oxygen levels, higher ROS levels, and elevated GSH content. These conditions serve as triggers for inducing specific changes in the structure of nanocarriers.32 CDT is an emerging treatment modality based on nano-catalyst Fenton or Fenton-like reactions, and has received increasing attention over the past five years.33–35 In the CDT process, endogenous H2O2 is converted to highly reactive hydroxyl radicals (˙OH), a class of ROS with high toxicity, facilitated by Fenton or Fenton-like catalysts. Due to the overexpression of H2O2 in tumor cells, the CDT process produces highly toxic ˙OH, initiating a series of oxidation reactions in the surrounding organic molecules, leading to irreversible damage to DNA, lipids, and proteins.36,37 It has been reported that transition metal ions, such as Cu+, Mn2+, Co2+, V2+, Ag+, and Cr3+ can catalyze H2O2 to produce ˙OH through Fenton-like reactions.38,39 Chen and Yang et al.40 reported a nanoreagent with a self-enhancing chemokinetic therapeutic effect based on MnO2, which generates Mn2+ ions while consuming GSH. In scenarios where the physiological medium contains a high concentration of HCO3− ions, Mn2+ can catalyze H2O2 to produce ˙OH in a Fenton-like reaction. Upon uptake by tumor cells, MnO2-coated mesoporous silica nanoparticles engage in a redox reaction with GSH, generating oxidized GSH and Mn2+. This process leads to GSH depletion and the regulation of the tumor microenvironment, thereby enhancing the efficacy of the chemokinetic therapy. Furthermore, the dissociation of MnO2 induced by GSH enhances the MRI contrast effect, enabling the monitoring of chemokinetic therapy with MRI. Based on this principle, a MnO2 shell was applied to the surface of mesoporous silica (mSiO2@MnO2), which was effective in consuming GSH to produce Mn2+ ions within the tumor microenvironment. It facilitated the catalysis of H2O2 into highly reactive ˙OH in a Fenton-like reaction. Ultimately, the MnO2 shell decomposition led to the release of genistein, enhancing its efficacy in killing pancreatic cancer tumor cells. Therefore, this strategy effectively combines chemotherapy and chemokinetic therapy.
3.3. The in vitro anti-tumor effect of the Gen@MnO2-PEG nanocomplex enzymes
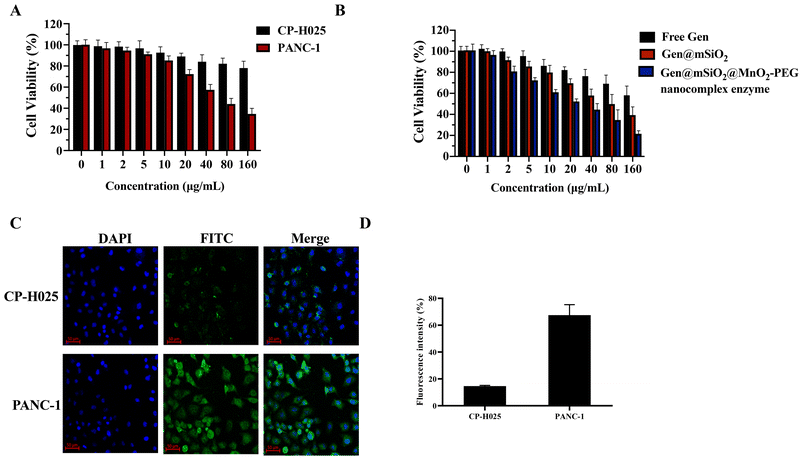
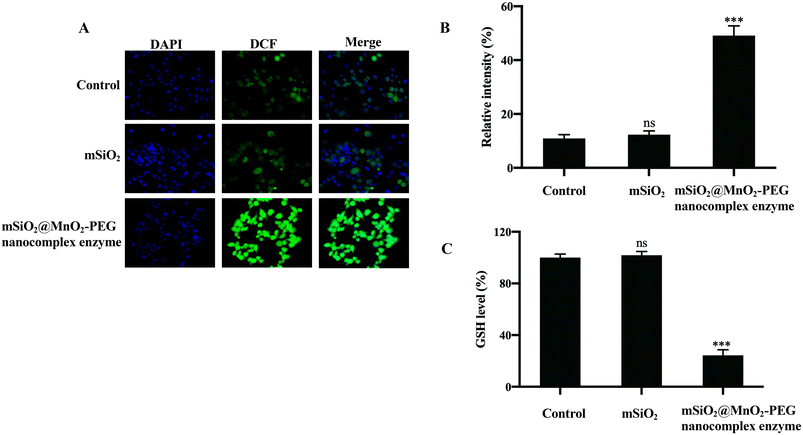
The cytotoxicity of the mSiO2@MnO2-PEG nanocomplex enzyme to the human pancreatic epithelial cell line CP-H025 and the human pancreatic cancer cell line PANC-1 was evaluated using a CCK-8 assay. Following a 24-hour incubation of the CP-H025 cells with the mSiO2@MnO2-PEG nanocomplex enzyme, the cells maintained a high survival rate of 90% even at a concentration of 160 μg mL−1, indicating the favorable biological safety of the mSiO2@MnO2-PEG nanocomplex enzyme. However, the cytotoxic effect of the mSiO2@MnO2-PEG nanocomplex enzyme on PANC-1 cells was concentration-dependent, which may be attributed to the potent Fenton-like Mn2+ delivery and GSH depletion capacity of the MnO2 shell (Fig. 5A). We also used the CCK-8 assay to assess the synergistic cytotoxic effect of the Gen@mSiO2@MnO2-PEG nanocomplex enzyme on PANC-1 cells, which was significantly higher than that of the free genistein group or the free material group (Fig. 5B). Additionally, CLSM was employed to observe the uptake of the mSiO2@MnO2-PEG nanocomplex enzyme by CP-H025 and PANC-1 cells. CP-H025 cells exhibited lower uptake of the mSiO2@MnO2-PEG nanocomplex enzyme compared to PANC-1 cells, with localization observed only in the cytoplasm (Fig. 5C and D).ROS levels in PANC-1 cells after mSiO2@MnO2-PEG nanocomplex enzyme treatment were measured using the DCFH-DA probe. The mSiO2 group exhibited a weak green fluorescence signal compared to the control group, while the mSiO2@MnO2-PEG nanocomplex enzyme group exhibited a strong signal (Fig. 6A and B). This can be attributed to the Fenton-like reaction between Mn2+ and the trace amount of H2O2 present in the cells, resulting in the production of ˙OH and the inhibition of GSH production, which indirectly enhanced ROS levels. As expected, mSiO2@MnO2-PEG nanocomplex enzyme led to a decrease in cellular GSH levels (Fig. 6C).
The viability of PANC-1 cells treated with the Gen@mSiO2@MnO2-PEG nanocomplex enzyme was significantly lower compared to those treated with free genistein and mSiO2@MnO2-PEG. Additionally, the quantity of nanomaterials in the cytoplasm of PANC-1 cells was significantly higher compared to normal tissue cells (CP-H025), which may be attributed to the microenvironment with high GSH, excessive production of H2O2, mild acidity and hypoxia of tumor. MnO2 had its unique acid sensitivity, and in the above microenvironments, Gen@mSiO2@MnO2-PEG nanocomplex enzymes were enriched and disintegrated, which played a role based on the potent Fenton-like Mn2+ delivery and GSH depletion capacity of the MnO2 shell.
To verify the excellent therapeutic effect of Gen@mSiO2@MnO2-PEG nanocomplex enzymes, we further conducted the flow cytometry apoptosis experiments and JC-1 staining experiments (Fig. S5 and S6†). The cell apoptosis rate in the control group was low, while the mSiO2@MnO2-PEG nanocomplex enzyme group exhibited a higher rate. The difference among the five groups was statistically significant. The decrease in cell membrane potential can be detected by the transition of JC-1 from red to green fluorescence, which is a signature event in the early stage of apoptosis. In the control group, JC-1 accumulates and aggregates in the mitochondria to form bright red fluorescent clumps. In the mSiO2@MnO2-PEG nanocomplex enzyme group, JC-1 is released from the mitochondria to form green fluorescence. In total, the mSiO2@MnO2-PEG nanocomplex enzyme group exhibited decreased red fluorescence and increased green fluorescence, indicating that the nanocomplex enzyme has a therapeutic effect, which leads to a decrease in the mitochondrial membrane potential and cell apoptosis. The results showed that the mSiO2@MnO2-PEG nanocomplex enzyme could lead to the apoptosis of the tumor cells. We further evaluated the ROS level in different groups (Fig. S7†). The ROS level revealed that the tumor cells in the control group had a relatively high expression. In contrast, the Gen@mSiO2@MnO2-PEG nanocomplex enzyme group showed a relatively low expression. The difference among the five groups was statistically significant.
3.4. The in vivo anti-tumor therapeutic effect of the Gen@ mSiO2@MnO2-PEG nanocomplex enzyme
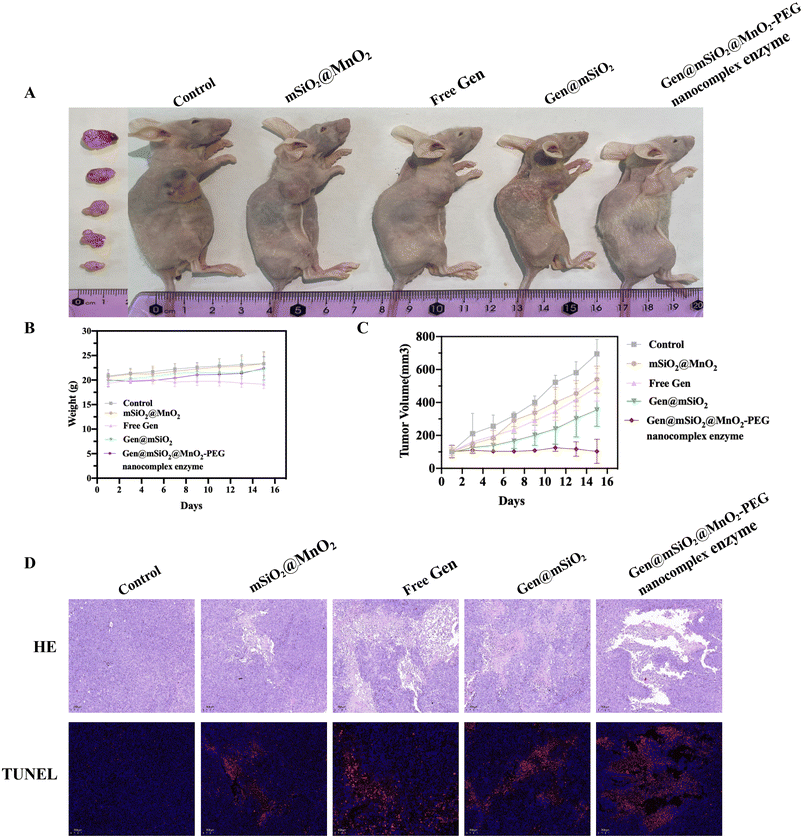
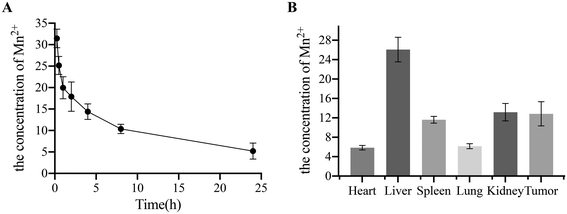
To assess the in vivo anti-tumor effect of the Gen@mSiO2@MnO2-PEG nanocomplex enzyme, PANC-1 tumor-bearing mouse models (five groups, four mice per group) were established. Treatment commenced when tumors reached approximately 100 mm3. The materials were injected every three days, with body weight and tumor volume monitored every other day for a total of 15 days. There was no significant weight loss or mortality among the treated mice within a 15-day period (Fig. 7B), indicating that the material had a favorable safety profile. After 15 days, the tumor volume in the control group increased 6.83-fold (from 102 ± 35 to 695 ± 77 mm3). The Gen and mSiO2@MnO2-PEG groups had similar therapeutic effects, with increases of 4.85-fold (from 102 ± 7 to 493 ± 73 mm3) and 5.36-fold (from 101 ± 21 to 540 ± 70 mm3), respectively. The latter effect was attributed to the chemical kinetics of endogenous H2O2, indicating that chemotherapy alone or CDT has a limited effect. However, tail vein injection of the Gen@mSiO2@MnO2-PEG nanocomplex enzyme had a significant inhibitory effect on the tumor volume, with no observed change in the tumor size (1.01-fold change over a 15-day period compared to the initial volume) (Fig. 7A and C). The images of all tumor tissues are shown in Fig. S8.†H&E and TUNEL staining were used to observe the effects of the Gen@mSiO2@MnO2-PEG nanocomplex enzyme on cell morphology and apoptosis (Fig. 7D). H&E staining revealed that the tumor tissue in the control group had an ordered and intact structure. In contrast, the tumor sections from the tail vein injection group treated with the Gen@mSiO2@MnO2-PEG nanocomplex enzyme showed signs of nuclear shrinkage and enlarged intercellular spaces, indicating substantial damage to the cancer cells. Tumor cell apoptosis was assessed by labeling fragmented DNA using TUNEL staining. In the control group, the nuclei remained intact, indicating that the cells were in a healthy state. In the Gen group and the mSiO2@MnO2-PEG group, the majority of cells had intact nuclei with a small amount of red fluorescence observed, indicating a certain level of damage to the cancer cells. The injection of the Gen@mSiO2@MnO2-PEG nanocomplex enzyme into the tail vein resulted in pronounced red fluorescence, and intact nuclei could not be observed. This suggests that a significant portion of the DNA was fragmented, indicating that there was substantial damage to the cancer cells. Following the tail vein injection of the Gen@mSiO2@MnO2-PEG nanocomplex enzyme, high concentrations of Mn2+ were observed in the tumor tissue, suggesting a high uptake of the MnO2-based nanosystem by the tumor (Fig. 8A and B).
Using a PANC-1 tumor-bearing mouse model, the in vivo anti-tumor efficacy of the Gen@mSiO2@MnO2-PEG nanocomplex enzyme was assessed by monitoring the tumor volume, tumor size, and body weight, and examining fresh whole tumor tissue. Our findings suggest that the Gen@mSiO2@MnO2-PEG group has the most potent anti-tumor effect.
3.5. Biological safety
Mice injected with the Gen@mSiO2@MnO2-PEG nanocomplex enzyme for both short and extended periods exhibited no discernible tissue damage or lesions in the main organs (Fig. 9A). This suggests that the prepared Gen@mSiO2@MnO2-PEG nanocomplex enzyme demonstrated favorable in vivo biosafety. Blood samples from the mice were collected for routine blood tests and biochemical analysis to further evaluate the biological safety of the materials. Liver function indicators such as alanine aminotransferase (ALT), aspartate aminotransferase (AST), and alkaline phosphatase (ALP), as well as renal function indicators such as UREA were measured. All blood and liver and kidney parameters of the mice fell within the normal range (Fig. 9B–G), affirming the favorable biological safety of the Gen@mSiO2@MnO2-PEG nanocomplex enzyme and its potential for application in tumor therapy.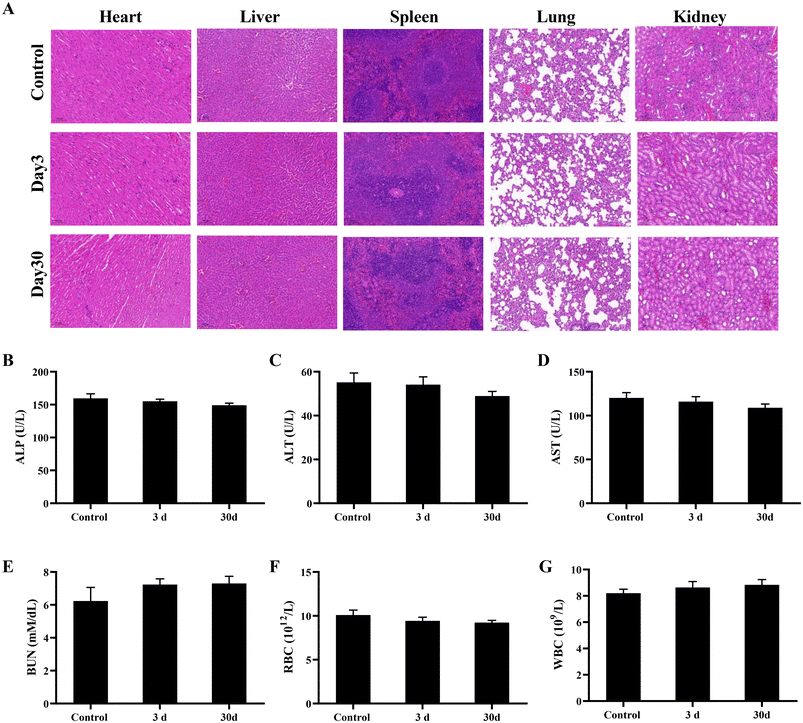 | ||
| Fig. 9 H&E staining of major organs, scale bar: 100 μm (A). Blood analysis of the liver and kidney indicators (B–G). | ||
Generally, the combinative approach of anti-tumor drugs and chemokinetic therapy employs the hydroxyl radical generated by chemokinetic therapy in tandem with genistein to collectively target tumor cells. This method concurrently reduces the levels of GSH and H2O2 in the body, mitigating the potential side effects of genistein and facilitating a more favorable tumor microenvironment. This study introduces a pancreatic cancer intervention strategy that utilizes a combined chemical-chemokinetic therapy. The nanocomplex enzyme developed in this study, mSiO2@MnO2-PEG, loaded with the anti-tumor drug genistein, effectively killed pancreatic tumor cells in vitro and in vivo. Genistein activates tumor suppressor genes by regulating chromatin configuration and DNA methylation, thereby affecting the survival of cancer cells.41 Research indicates that genistein exerts anticancer activity through the induction of ROS-mediated mitochondrial apoptosis, cell cycle arrest, and the modulation of STAT3. These findings suggest that it may have potential benefits in the treatment of pancreatic cancer.42 However, being an anti-tumor drug, it has the potential to affect both tumor cells and normal cells, causing serious toxic side effects. By harnessing the passive tumor-targeting potential of nanomaterials, improved efficiency and greater specificity can be achieved. Furthermore, the incorporation of tumor-specific ligands onto functionalized nanoparticles can enhance their delivery and accumulation within tumor tissues and increase their uptake by cancer cells.43,44 MSNs have a unique surface structure and are a promising material for targeted drug delivery in cancer therapy. The outer surface of MSNs offers a significant capacity for functional modification, which can improve targeting efficiency and tumor specificity. Additionally, the mesoporous structure enables the encapsulation of various anti-cancer drugs, thereby increasing drug concentration within tumor tissues. This versatile system also holds the potential for multi-mode cancer therapy.45–47
There are several limitations in the present study. Firstly, we have not conducted an exhaustive exploration of potential material optimizations. Secondly, we did not confirm if MnO2 dissociation indeed enhanced the effect of MRI. Lastly, we did not monitor the specific dissociation period of the material. In the future, we plan to address these gaps through further optimization and additional data collection.
4. Conclusion
In summary, we have successfully synthesized a Fenton-like responsive core–shell Gen@mSiO2@MnO2-PEG nanozyme, designed to enhance ROS-mediated tumor therapy. It has been demonstrated that the core–shell Gen@mSiO2@MnO2-PEG nanozymes not only release their encapsulated therapeutic drug (genistein) in response to GSH, but also undergo degradation to Mn2+ upon GSH conversion to GSSG, catalyzing H2O2 to produce cytotoxic ˙OH. In vitro, mSiO2@MnO2-PEG nanozymes demonstrated excellent biocompatibility while effectively inducing ROS production in PANC-1 tumor cells, leading to targeted tumor cell apoptosis. In vivo, the Gen@mSiO2@MnO2-PEG nanocomplex enzyme selectively accumulated at the tumor sites in PANC-1 tumor-bearing mice, effectively inhibiting tumor growth and metastasis. This study demonstrates that Gen@mSiO2@MnO2-PEG nanozymes can serve as an effective platform for ROS-mediated tumor therapy, combining the strengths of CDT and drug therapy in the treatment of pancreatic cancer.Data availability
The data (figures) used to support the results of this study can be obtained from the first author upon request.Conflicts of interest
The authors declare no conflict of interest.Acknowledgements
This study was supported by the construction of Tertiary Laboratory of Neurophysiology and Pathology & Institute of Internal Medicine, National Administration of Traditional Chinese Medicine (2024XKPT05). We deeply acknowledge professor Xiaomin Li for the support and encouragement.References
- J. Cai, H. Chen, M. Lu, Y. Zhang, B. Lu, L. You, T. Zhang, M. Dai and Y. Zhao, Cancer Lett., 2021, 520, 1–11 CrossRef PubMed.
- H. Chen, Q. Zhuo, Z. Ye, X. Xu and S. Ji, Biochim. Biophys. Acta, Rev. Cancer, 2021, 1875, 188466 CrossRef PubMed.
- E. Khanlarzadeh, S. Nazari, M. Ghobakhlou, H. Ranjbar and S. Nazari, J. Gastrointest. Cancer, 2021, 53, 725–729 CrossRef.
- Z. Xu, L. Wang, S. Dai, M. Chen, F. Li, J. Sun and F. Luo, JAMA Netw. Open, 2021, 4, e2124750 CrossRef PubMed.
- X. Zhang, S. Liu, Y. Cai, E. Changyong and J. Sheng, Pathol. Oncol. Res., 2021, 27, 1609868 CrossRef PubMed.
- Z. Zhao and W. Liu, Technol. Cancer Res. Treat., 2020, 19, 1–13 Search PubMed.
- C. Springfeld, D. Jäger, M. W. Büchler, O. Strobel, T. Hackert, D. H. Palmer and J. P. Neoptolemos, Presse Med., 2019, 48, e159–e174 CrossRef PubMed.
- D. Schizas, N. Charalampakis, C. Kole, P. Economopoulou, E. Koustas, E. Gkotsis, D. Ziogas, A. Psyrri and M. V. Karamouzis, Cancer Treat. Rev., 2020, 86, 102016 CrossRef PubMed.
- S. Rasheed, K. Rehman, M. Shahid, S. Suhail and M. S. H. Akash, J. Food Biochem., 2022, 46, e14228 CrossRef.
- S. S. Bhat, S. K. Prasad, C. Shivamallu, K. S. Prasad, A. Syed, P. Reddy, C. A. Cull and R. G. Amachawadi, Curr. Issues Mol. Biol., 2021, 43, 1502–1517 CrossRef.
- J. P. Rendón, A. I. Cañas, E. Correa, V. Bedoya-Betancur, M. Osorio, C. Castro and T. W. Naranjo, Molecules, 2022, 27, 7042 CrossRef PubMed.
- D. Deng, Z. Lang, C. Xing and S. Li, J. Biol. Regul. Homeost. Agents, 2020, 34, 669–674 CAS.
- X. Ji, K. Liu, Q. Li, Q. Shen, F. Han, Q. Ye and C. Zheng, Front. Pharmacol., 2022, 13, 851589 CrossRef CAS PubMed.
- M. Imai-Sumida, P. Dasgupta, P. Kulkarni, M. Shiina, Y. Hashimoto, V. Shahryari, S. Majid, Y. Tanaka, R. Dahiya and S. Yamamura, Cell. Physiol. Biochem., 2020, 54, 53 CrossRef CAS.
- Y. Y. Song, Y. Yuan, X. Shi and Y. Y. Che, Colloids Surf., B, 2020, 190, 110966 CrossRef CAS PubMed.
- H. Zhang, X. Yang, X. Pang, Z. Zhao, H. Yu and H. Zhou, Mol. Cell. Biochem., 2019, 455, 127–134 CrossRef CAS PubMed.
- L. E. Low, J. Wu, J. Lee, B. T. Tey, B. H. Goh, J. Gao, F. Li and D. Ling, J. Controlled Release, 2020, 324, 69–103 CrossRef CAS PubMed.
- J. Park, Y. Choi, H. Chang, W. Um, J. H. Ryu and I. C. Kwon, Theranostics, 2019, 9, 8073–8090 CrossRef CAS PubMed.
- R. Zheng, J. Guo, X. Cai, L. Bin, C. Lu, A. Singh, M. Trivedi, A. Kumar and J. Liu, Colloids Surf., B, 2022, 213, 112432 CrossRef CAS.
- X. Cai, Q. Zhu, Y. Zeng, Q. Zeng, X. Chen and Y. Zhan, Int. J. Nanomed., 2019, 14, 8321–8344 CrossRef PubMed.
- C. Zhu, Q. Ma, L. Gong, S. Di, J. Gong, Y. Wang, S. Xiao, L. Zhang, Q. Zhang, J. Fu, D. Lu and Z. Lin, Acta Biomater., 2022, 141, 429–439 CrossRef.
- D. Zhu, X. H. Zhu, S. Z. Ren, Y. D. Lu and H. L. Zhu, J. Drug Targeting, 2021, 29, 911–924 CrossRef.
- S. Kumar, I. M. Adjei, S. B. Brown, O. Liseth and B. Sharma, Biomaterials, 2019, 224, 119467 CrossRef.
- S. Jiang, X. Li, F. Zhang, J. Mao, M. Cao, X. Zhang, S. Huang, X. Duan and J. Shen, Small Methods, 2022, 6, 2101531 CrossRef PubMed.
- Z. Zhang and Y. Ji, Nanoscale, 2020, 12, 17982–18003 RSC.
- T. Xiao, M. He, F. Xu, Y. Fan, B. Jia, M. Shen, H. Wang and X. Shi, ACS Nano, 2021, 15, 20377–20390 CrossRef.
- W. Ma, H. Zhang, S. Li, Z. Wang, X. Wu, R. Yan, F. Geng, W. Mu and Y. Jin, ACS Biomater. Sci. Eng., 2022, 8, 1354–1366 CrossRef PubMed.
- Z. Tang, Y. Liu, M. He and W. Bu, Angew. Chem., 2019, 131, 958–968 CrossRef.
- S. Rahmani, J. Budimir, M. Sejalon, M. Daurat, D. Aggad, E. Vives, L. Raehm, M. Garcia, L. Lichon, M. Gary-Bobo, J. O. Durand and C. Charnay, Molecules, 2019, 24, 332 CrossRef.
- X. Zhu, Y. Liu, G. Yuan, X. Guo, J. Cen, Y. Gong, J. Liu and Y. Gang, Nanoscale, 2020, 12, 22317–22329 RSC.
- H. Hu, X. Deng, Q. Song, W. Yang, Y. Zhang, W. Liu, S. Wang, Z. Liang, X. Xing, J. Zhu, J. Zhang, Z. Shao, B. Wang and Y. Zhang, J. Nanobiotechnol., 2021, 19, 1–20 CrossRef.
- F. Zhang, H. Liu, M. Duan, G. Wang, Z. Zhang, Y. Wang, Y. Qian, Z. Yang and X. Jiang, J. Hematol. Oncol., 2022, 15, 1–38 CrossRef PubMed.
- Y. Sun, X. Ma and H. Hu, Int. J. Mol. Sci., 2021, 22, 5698 CrossRef PubMed.
- Z. Liu, Z. Liu, Z. Zhao, D. Li, P. Zhang, Y. Zhang, X. Liu, X. Ding and Y. Xu, Nanomaterials, 2022, 12, 2469 CrossRef.
- Q. Huang, M. Lyu, W. Tang, P. Qi and H. Hu, Front. Bioeng. Biotechnol., 2022, 10, 1024089 CrossRef PubMed.
- X. Guo, Q. Cai, X. Lian, S. Fan, W. Hu, W. Cui, X. Zhao, Y. Wu, H. Wang, Y. Wu, Z. Li and Z. Zhang, Eur. J. Pharm. Biopharm., 2021, 165, 174–184 CrossRef.
- Z. Lan, X. Tan, C. Chen, Y. Cao, Y. Wan and S. Feng, J. Biomater. Sci., Polym. Ed., 2023, 34, 1–19 CrossRef.
- S. Resende, B. Oliveira and R. Augusti, J. Mass Spectrom., 2018, 53, 717–724 CrossRef.
- L. Xin, J. Hu, Y. Xiang, C. Li, L. Fu, Q. Li and X. Wei, Materials, 2021, 14, 2643 CrossRef.
- L. S. Lin, J. Song, L. Song, K. Ke, Y. Liu, Z. Zhou, Z. Shen, J. Li, Z. Yang, W. Tang, G. Niu, H. H. Yang and X. Chen, Angew. Chem., 2018, 130, 4996–5000 CrossRef.
- Y. Zhang and H. Chen, Epigenetics, 2011, 6, 888–891 CrossRef.
- Y. L. Bi, M. Min, W. Shen and Y. Liu, Phytomedicine, 2018, 39, 10–16 CrossRef PubMed.
- N. Kong, R. Zhang, G. Wu, X. Sui, J. Wang, N. Y. Kim, S. Blake, D. De, T. Xie, Y. Cao and W. Tao, Proc. Natl. Acad. Sci. U. S. A., 2022, 119, e2112696119 CrossRef PubMed.
- K. Upadhyay, R. K. Tamrakar, S. Thomas and M. Kumar, Chem.-Biol. Interact., 2023, 380, 110537 CrossRef.
- S. Shah, P. Famta, D. Bagasariya, K. Charankumar, A. Sikder, R. Kashikar, A. K. Kotha, M. B. Chougule, D. K. Khatri, A. Asthana, R. S. Raghuvanshi, S. B. Singh and S. Srivastava, Mol. Pharm., 2022, 19, 4428–4452 CrossRef PubMed.
- B. Küçüktürkmen and J. M. Rosenholm, Adv. Exp. Med. Biol., 2021, 1295, 99–120 CrossRef PubMed.
- T. Li, S. Shi, S. Goel, X. Shen, X. Xie, Z. Chen, H. Zhang, S. Li, X. Qin, H. Yang, C. Wu and Y. Liu, Acta Biomater., 2019, 89, 1–13 CrossRef.
Footnote |
| † Electronic supplementary information (ESI) available. See DOI: https://doi.org/10.1039/d4nr02406k |
| This journal is © The Royal Society of Chemistry 2025 |

