DOI:
10.1039/D4NR02458C
(Paper)
Nanoscale, 2025,
17, 877-887
Ab initio calculations of vibrational fingerprints in the photoluminescence of graphene quantum dots†
Received
14th June 2024
, Accepted 4th November 2024
First published on 7th November 2024
Abstract
We used a computational method based on ab initio (constrained) density functional theory to obtain the photoluminescence spectrum of graphene quantum dots with up to 240 carbon atoms, including the effect of multiphonons. We found that only a few phonon modes couple effectively to the excitons, namely one size- and shape-dependent global mode and two high frequency local modes. The exciton–phonon coupling decreases with increasing size for all structures and has a magnitude in the mid-range, leading to only relatively small multiphonon effects. We suggest that the photoluminescence sidebands can be used as fingerprints for the determination of the size and shape of graphene quantum dots. Our results are in very good agreement with the results from a recent experiment and reveal that a two-phonon replica (with n = 2) is clearly visible in the spectrum.
1 Introduction
Owing to their exceptional properties, such as low toxicity and biocompatibility, high chemical and physical stability, and size tunability of light emission within a large spectral range from ultraviolet to infrared,1–3 graphene quantum dots (GQDs) are important in a wide range of applications, such as bioimaging,4,5 biosensors,6 sensitive sensors for metallic ions,7 photocatalysis,8,9 solar cell materials,10 molecular-scale electronic devices11,12 and photovoltaics.13 To produce these lateral nanostructures of graphene, two methods of fabrication are employed: a top-down technique and a bottom-up approach. The top-down approaches start from extended graphene, breaking down the structure to small pieces using, e.g., hydrothermal cutting, lithography or sonification.14–21 These methods have the advantage of relative simplicity and have already produced promising GQDs. However, size and shape discrepancies among the GQDs in a single sample have to be expected. On the other hand, bottom-up approaches from organic chemistry, based on laterally extended polycyclic aromatic hydrocarbons, can deliver atomically precise GQDs. Indeed, a real library of “nanographenes” has been developed in the last few years and keeps on growing.22–28 The availability of an ensemble of identical GQD emitters where the shape, including the edge structure, can be tailor-made confers significant potential for application in further fields of research such as quantum information and topology. The study of topological effects was especially successful using graphene nanostructures with specific (zigzag) edges and morphologies (triangles and ribbons). These selected structures exhibit a very peculiar electronic structure with a set of nearly-degenerate mid-gap states that are partially occupied and fully spin-polarized.29,30 These structures have triggered a large number of theoretical31,32 and experimental33–37 studies focussed on correlation and topological effects. Since our work focusses on the optical properties and is based on a low correlation density functional theory approach, we explicitly excluded triangular structures with zigzag edges (with imbalance in the number of A/B sublattice sites) since they are highly correlated semi-metals.29
A large body of theoretical work on GQD exists, spanning approaches ranging from effective Hamiltonian derived from single-layer graphene,31,32 tight binding,38,39 and time-dependent density functional theory40 all the way to Green's function approaches (GW).41 The main focus has been on the electronic and excitonic properties, including correlation effects. Significantly less attention42 has been paid to vibronic effects that are, however, known to shift the optical transition energy,42–44 open up non-radiative channels of recombination45 and reduce the coherence time,46 among others.
In this work, we calculated the Huang–Rhys (HR) factors, which correspond most closely to the measured exciton phonon coupling (EXPC) strength (which differs significantly from the EXPC matrix elements, as emphasized recently47) of GQDs using first-principles density functional theory (DFT) and constrained density functional theory (CDFT). Our theoretical approach where the vector between the atomic positions of the excited state and the ground state is projected onto the normalized phonon eigenmodes47,48 is computationally very advantageous and allows us to treat rather large structures, as encountered in experimental settings. Generally, we find a significant decrease in HR factors with increasing GQD size, for example, the HR value decreases from 1.33 to 0.67 with the dot size increasing from 12.5 Å to 25.1 Å in the case of armchair-edged triangular GQDs. Our results show larger HR factors for armchair-terminated structures than for zigzag-terminated structures (by roughly a factor of two) while the global shape has a smaller effect on total HR factors. We observed larger HR factors in triangular structures than in hexagonal structures by about 30%. Specifically, we found that for each of the GQDs investigated, only three vibrational modes couple effectively to the excitons. One has a global character (the entire structure vibrates coherently) with a size-dependent frequency and two are local modes with a size-independent frequency. These EXPCs lead to significant phonon sidebands in photoluminescence (PL) grouped around optical phonons (the two local modes) and acoustic phonon (global modes) frequencies. Based on the size-dependent frequency shift of the acoustic global modes, we suggest that the size of GQDs can be estimated from the measured Stokes shifts of these modes. Furthermore, the size dependence of the HR factor (and hence sideband intensity) of the acoustic global model exhibits an increasing trend with changes in geometry and edge structures, increasing from triangular GQDs with armchair edges to hexagonal GQDs with armchair edges, and finally to hexagonal GQDs with zigzag edges. Both trends offer the potential to determine the size, shape and edge structures of GQDs by examining the frequency and intensity of phonon sidebands as a function of size. Multiphonon effects are of intermediate magnitude (total HR factors up to 1.3 and up to 0.4 for individual vibrations) and lead to significant two-phonon processes. Higher class transitions can be important for the smaller structures, with 42 or less carbon atoms. A direct comparison with a recent experiment28 shows excellent agreement and allows for an interpretation of the obtained signal, highlighting the usefulness of the present theoretical approach and the great potential of the experimental technique.
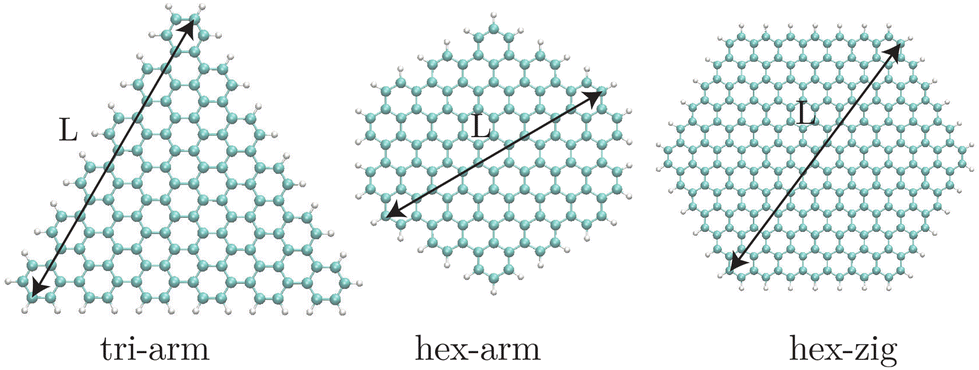
2 Structures under investigation
The different types of GQDs investigated in this work are illustrated in Fig. 1. We studied triangular structures with armchair edges and hexagonal structures with either armchair or zigzag edges. The structures are passivated by hydrogen atoms. These structures are all balanced in terms of the two sublattices so that according to Lieb's theorem49 (and our calculations), the total spin is a closed-shell singlet. Triangular structures with zigzag edges are not reported in this work, as they exhibit the well-known edge states in the “middle of the gap”,29 and have a fully spin polarized ground state and non-trivial multiplet excited states. Treating these structures appropriately would require a multi-reference approach.31
 |
| | Fig. 1 Example of the hexagonal (armchair C122H30 and zigzag C240H38) and triangular (armchair C126H36) GQDs studied in this work. The size of the GQDs (L) is defined as the maximum distance between two carbon atoms and is reported in Table 1. The names given under the structures are used as keywords throughout the paper. | |
The size of the GQDs L is defined as the largest separation between carbon atoms and is shown in the figure and reported numerically in Table 1. We computed several sizes per structure (see Table 1). The names given under the structures are used as keywords in the remaining document. The variation in size goes along with a slight variation in geometry (see the ESI†![[thin space (1/6-em)]](https://www.rsc.org/images/entities/char_2009.gif) 50 for all the structures used in this work). This flexibility in the shapes allows for obtaining a denser set of sizes. If we would restrict shapes to identical symmetry, only very few sizes could be handled by DFT.
50 for all the structures used in this work). This flexibility in the shapes allows for obtaining a denser set of sizes. If we would restrict shapes to identical symmetry, only very few sizes could be handled by DFT.
Table 1 Size, chemical composition, ratio of the number of edge atoms to the total number of atoms (edge/total), and the point group symmetry of the GQDs we studied in this work. Our naming convention uses “hex” for the hexagonal overall shape, “tri” for the triangular overall shape, “arm” for the armchair edges, and “zig” for the zigzag edges (see also Fig. 1)
| GQDs |
Size (Å) |
Structure |
Edge/total |
Symmetry |
| Hex-zig |
11.5 |
C42H16 |
0.38 |
D
2h
|
| 17.1 |
C78H22 |
0.28 |
D
2h
|
| 19.6 |
C112H26 |
0.23 |
D
2h
|
| 26.9 |
C190H34 |
0.18 |
D
2h
|
| 29.4 |
C240H38 |
0.16 |
D
2h
|
| Hex-arm |
12.8 |
C42H18 |
0.42 |
D
6h
|
| 17.9 |
C84H24 |
0.29 |
D
6h
|
| 22.5 |
C122H30 |
0.25 |
D
2h
|
| Tri-arm |
12.5 |
C36H18 |
0.50 |
D
3h
|
| 21.0 |
C90H30 |
0.33 |
D
3h
|
| 25.1 |
C126H36 |
0.29 |
D
3h
|
3 Theoretical methods
3.1 Calculation of HR factors
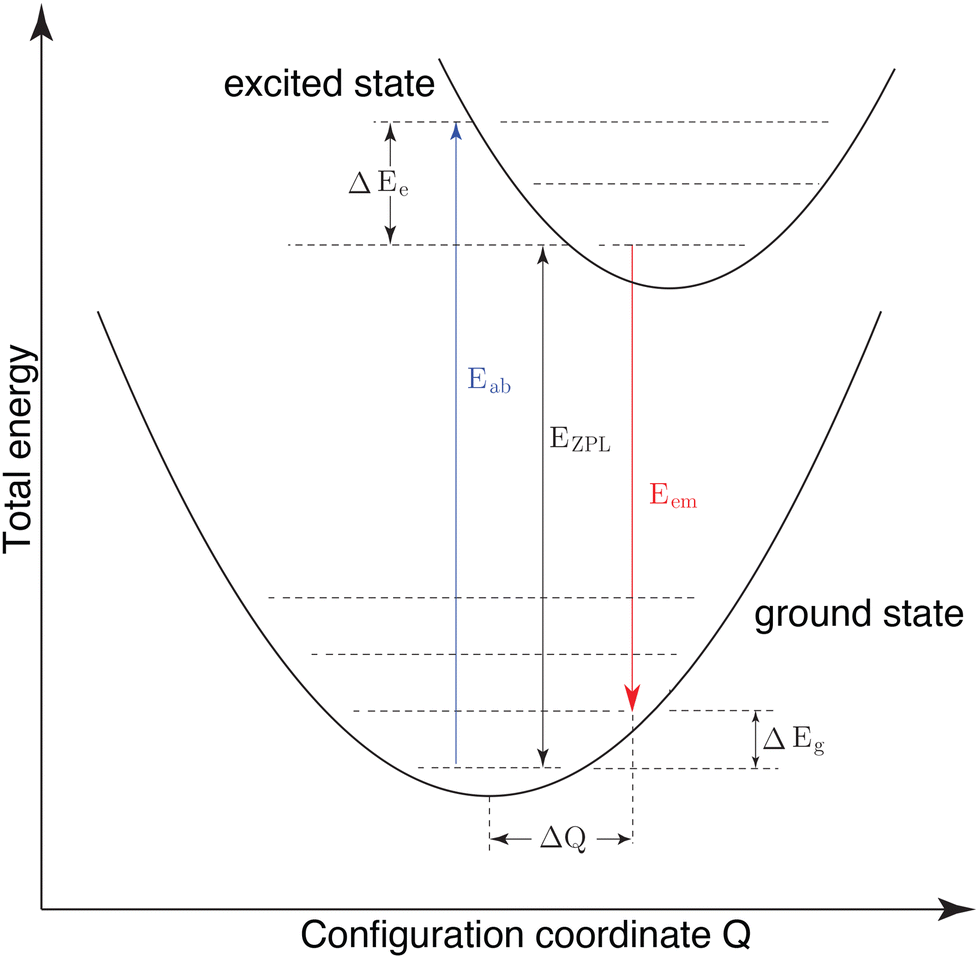
The decoupling of the fast electronic transition (order of 10−15 s) from the comparatively slow nuclear dynamics (order of 10−13 s) is known as adiabatic approximation, and leads to vertical optical transitions in the Franck–Condon configuration diagram,51 as depicted in Fig. 2. In this figure, the lower and upper parabolas describe the adiabatic potential energy surfaces for the ground and the excited states, respectively, as a function of the configuration coordinate Q. In the Franck–Condon model, the light absorption Eab (light emission Eem) process occurs without changes in the position of the nuclei (constant Q). After the vertical optical transition, the system relaxes to the equilibrium position of the nucleus configuration and releases the so-called reorganization energy ΔEe(g)via emission of one or several phonons (or vibrons).
 |
| | Fig. 2 Schematic illustration of the configuration coordinate Franck–Condon diagram for the optical absorption and emission processes. | |
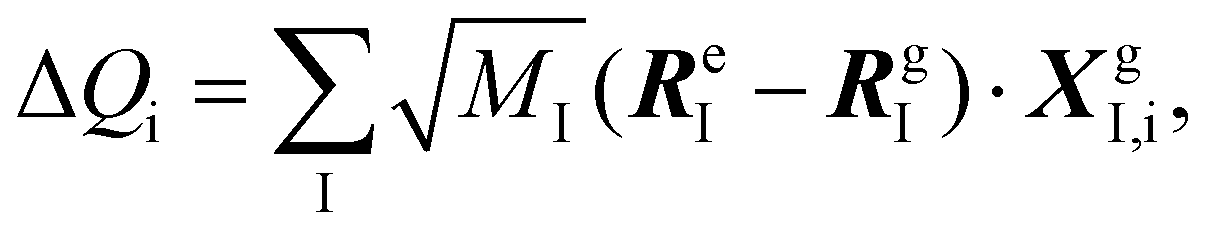
Within the framework of the Franck–Condon principle, the change of the nucleus position of a specific vibrational mode i for a nanosystem with N atoms can be written in the configuration coordinate space as,47,48,52
| | 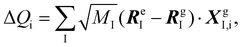 | (1) |
where
MI is the mass of atom I, the displacement of atom I between the excited and the ground states
ReI −
RgI denotes the lattice displacement induced by the formation of the “excitons”, and
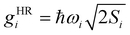
XgI,i is the normalized unit vector in the direction of the vibrational mode i for atom I obtained in the ground electronic state. The ground and excited state geometries are shifted, such that the center of masses of both structures coincides. The partial HR factor for the vibration mode
i,
Si, is thereafter calculated as,
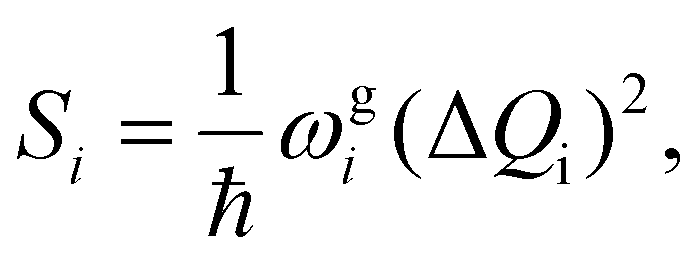
| | 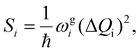 | (2) |
with vibrational frequency
ωgi. The HR factor is a dimensionless parameter which characterizes the spatial shift between a shifted and a non-shifted harmonic oscillator. The EXPC coupling matrix element that can be extracted from the HR factor
47 is
, and differs from the EXPC matrix elements calculated from electron and hole wavefunctions directly (see ref.
47).
3.2 Calculation of the PL spectrum including vibrations
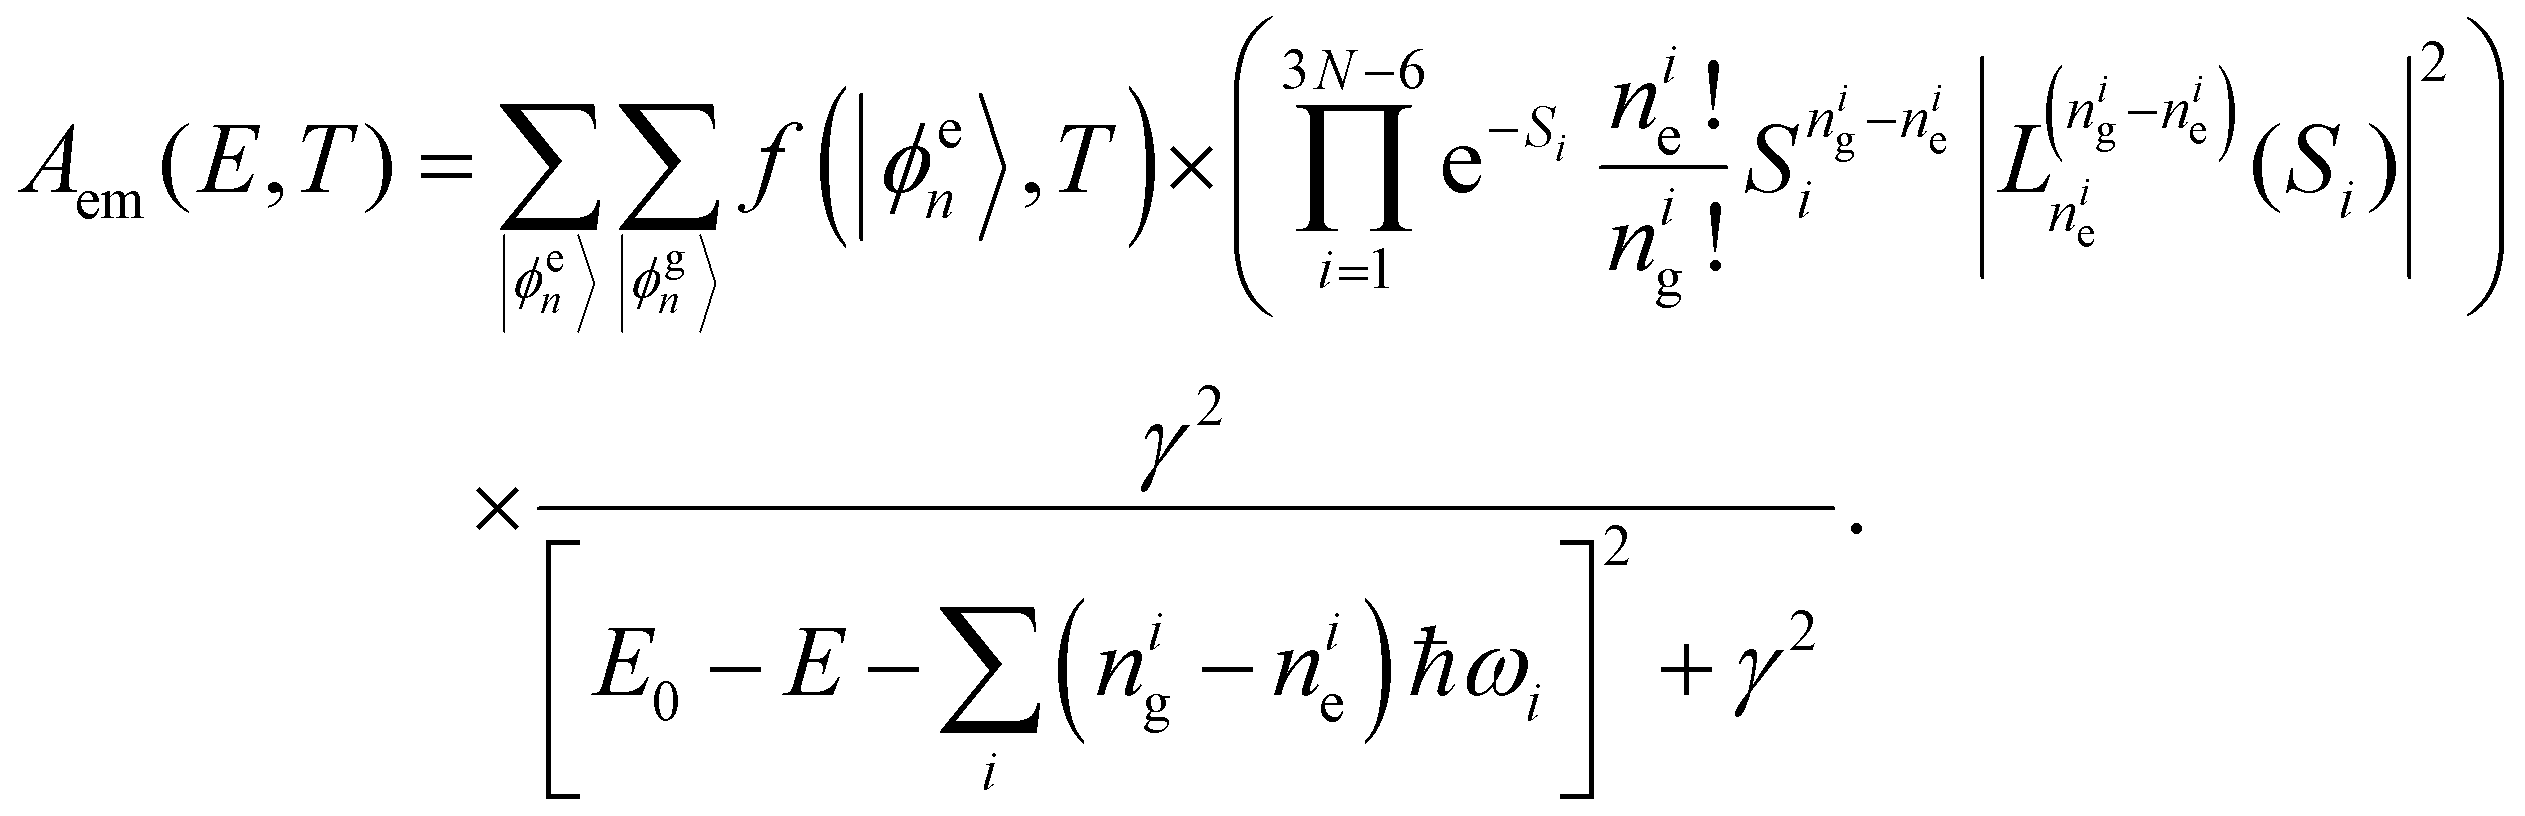
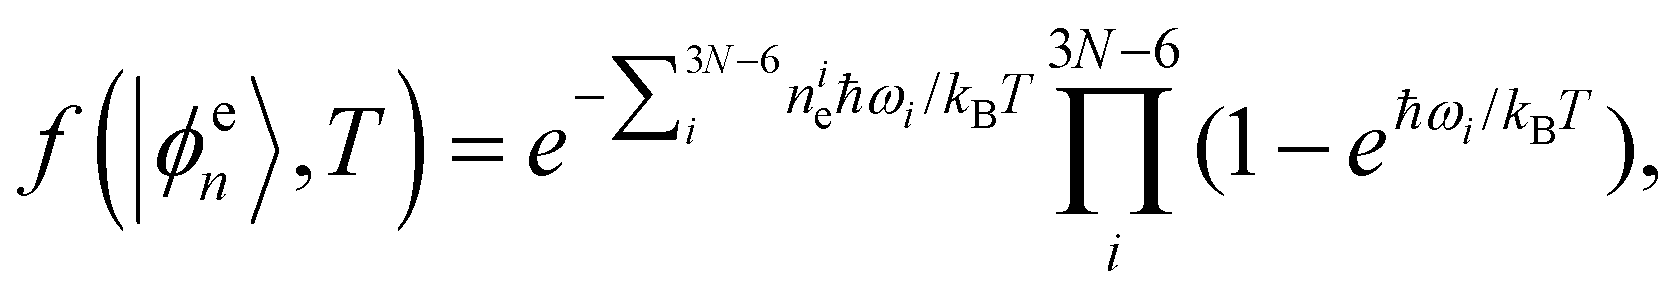
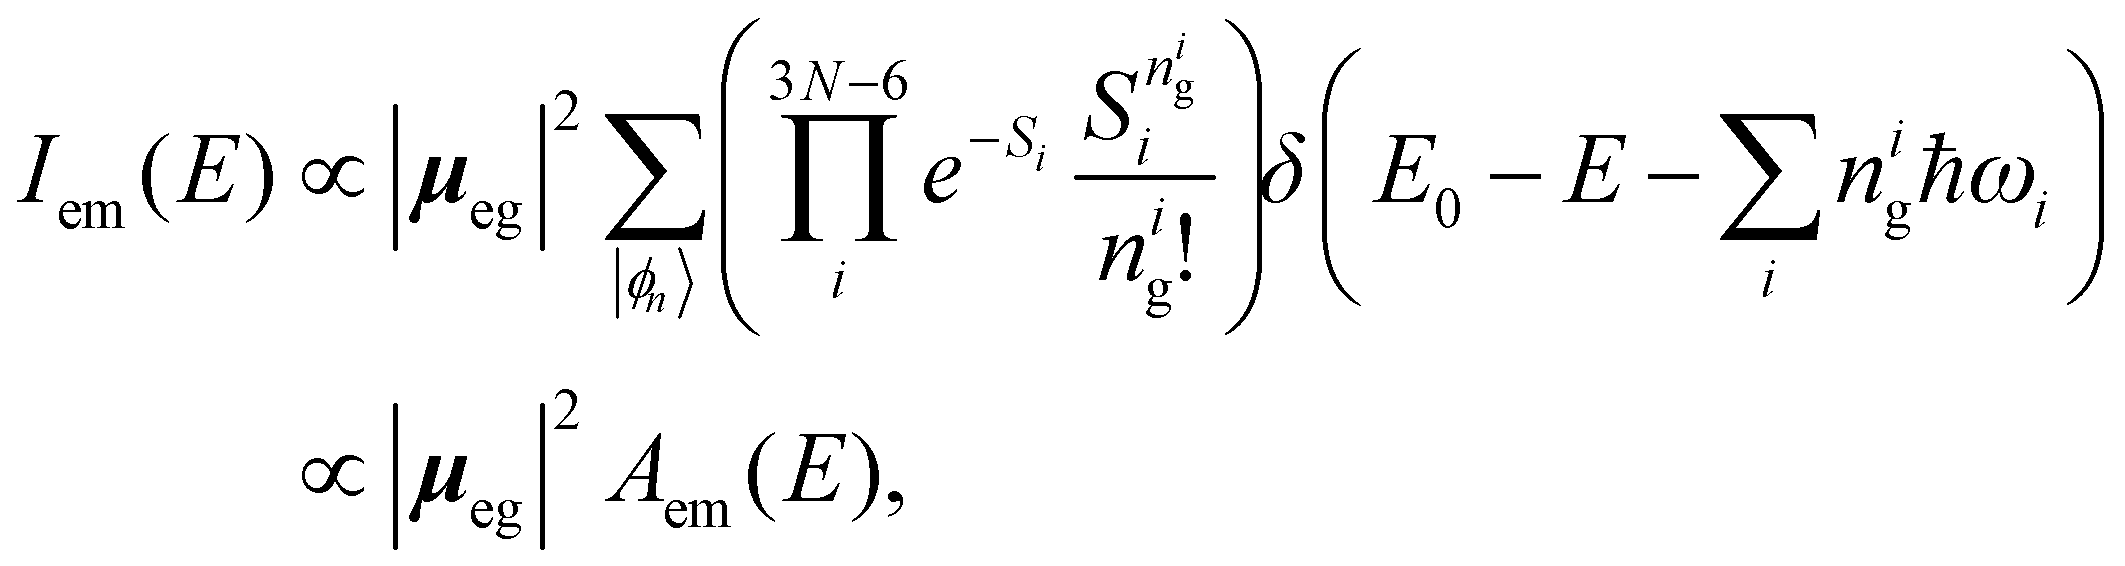
PL spectroscopy is a sensitive tool for probing the interaction of excitons with vibrations. This mutual interaction leads to the appearance of phonon sidebands in the PL spectrum. As more detailed in ref. 53, we calculated the PL spectrum at zero temperature from the HR factors using the Franck–Condon theorem where electronic and ionic degrees of freedom are separated:54| | 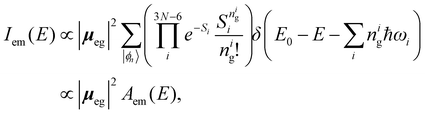 | (3) |
where μeg is the dipole matrix element between the ground and excited electronic states, N is the number of atoms of the GQDs, E0 is the electronic gap, nig is the number of i-mode vibrons in the ground electronic state with phonon energy ħωi (the vibrational frequencies are assumed to be equal in the ground and excited states), and |ϕn〉 = |n1g,n2g,n3g,…nig,…n3N−6g〉|. The ket |ϕn〉 under the sum sign means a summation over all possible state vectors |ϕn〉, i.e., all possible combinations of nig (see ref. 53). It should be pointed out that the prefactor of Iem(E) (omitted in eqn (3), since we give only a proportionality) is energy dependent with a prefactor that is either E or E3 depending on the definition of μeg (using the momentum operator or the position operator55,56). This energy term is given by the optical transition energies neglecting phonons and is therefore identical for all vibronic transitions considered here (where only one electronic ground state and one electronic excited state are considered). In principle, an energy dependence of the prefactor, including energy renormalization by phonons, should be present, but is beyond the Frank–Condon approximation.
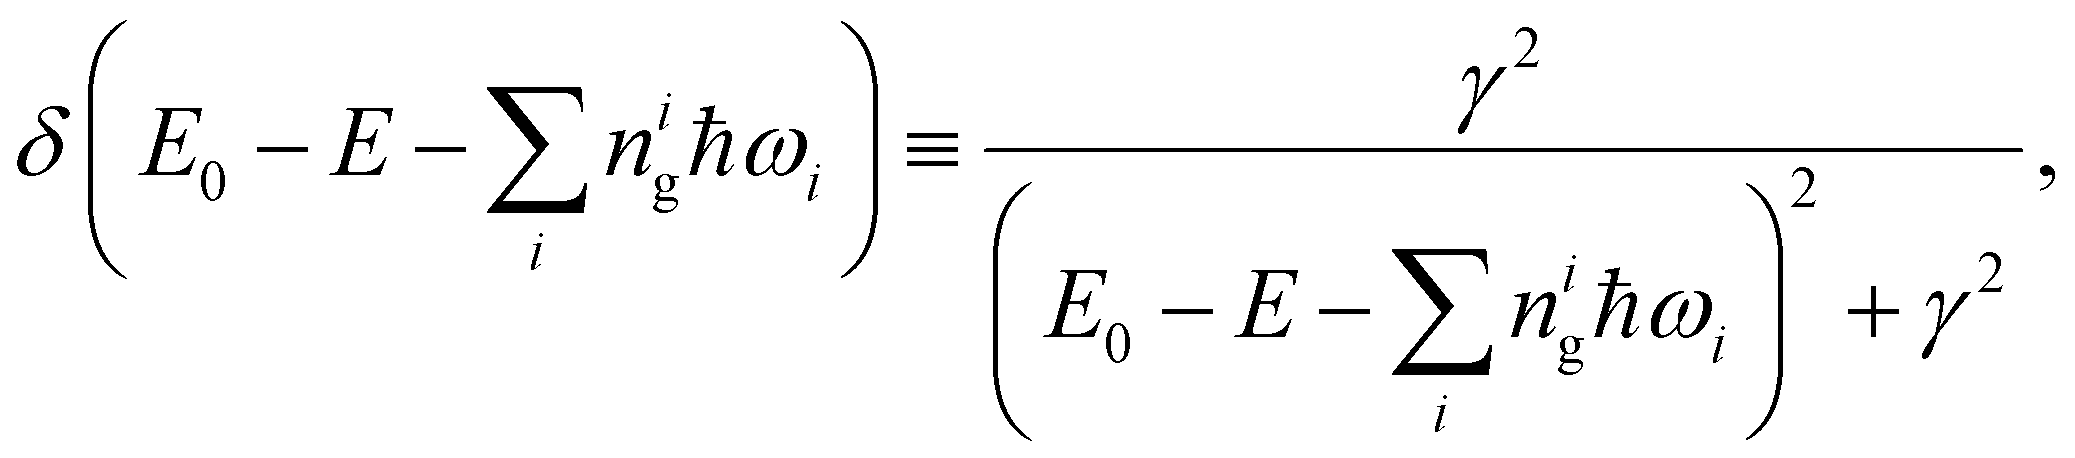
For the calculation of the PL spectrum, we used a Lorentz function:
with a broadening
γ instead of the
δ function given in
eqn (3). To analyze the results, and also for computational reasons,
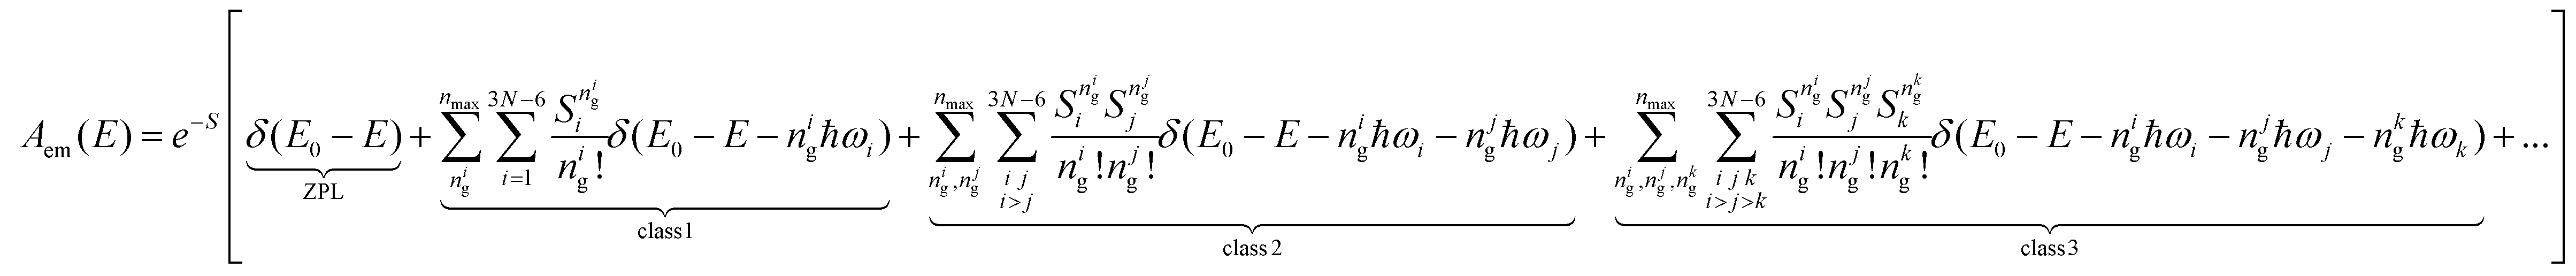
53 we divided the multi-vibrational states into classes. The term “class” (1, 2, 3,…) describes the number of different vibrational modes simultaneously excited in the vibronic transition
53,57 and we rewrite as:
| | 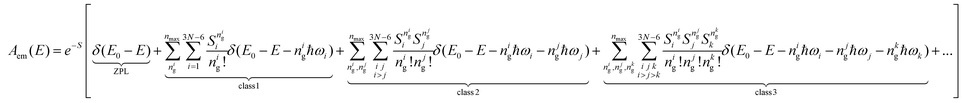 | (4) |
where  is the total HR factor, i, j, and k denote different vibrational modes and nig, njg, and nkg denote the corresponding phonon (vibron) quantum numbers. For practical purposes, the sums will be truncated at the certain maximum number of vibrons nmax.
3.3 Computational details
The geometries of the GQDs in the ground and excited states were optimized until the forces were reduced to less than 3 × 10⁻⁶ Hartree per Bohr under constrained symmetry via ab initio DFT and CDFT calculations. The vibrational frequencies ωig along with the corresponding eigenvectors Uig of the ground state were obtained via finite difference as implemented in the CPMD code package.58 Both the DFT and CDFT calculations were performed within the framework of the local density approximation (LDA59) and Trouiller–Martin norm-conserving pseudopotentials.60 The energy cutoff was set to 30 Ry. To avoid interactions between adjacent images, supercells with a vacuum of 15 Å between the outermost atoms in the lateral direction and a vacuum of 40 Å in the vertical direction were used in the ab initio calculations.
4 Results
4.1 Dominant vibrational modes, Huang–Rhys factors
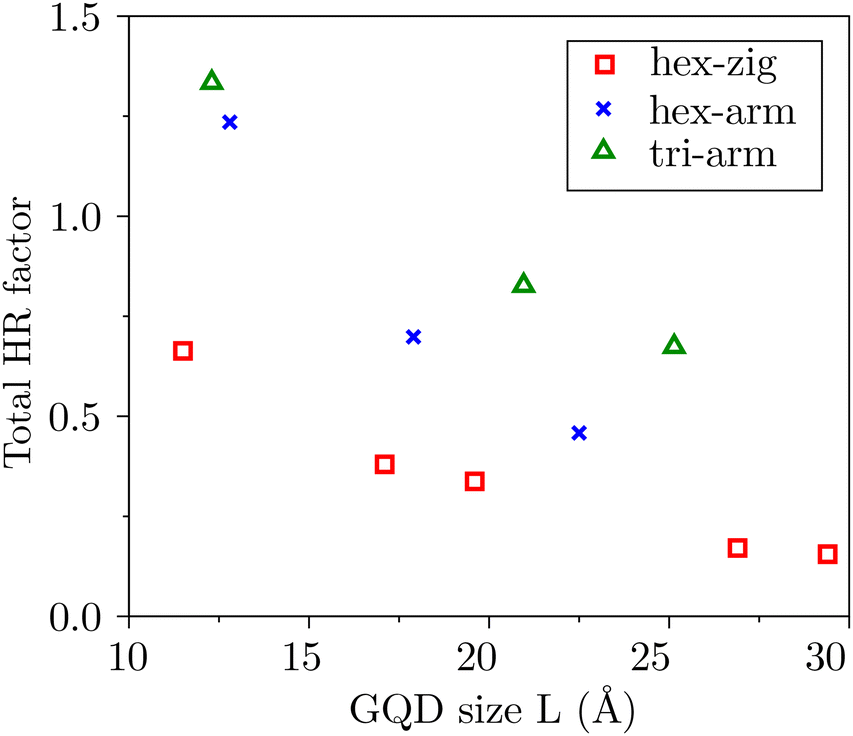
Fig. 3 shows the calculated total HR factors S for different types of GQDs as a function of size L (see Fig. 1 for the structures and size definition). The general trend of decreasing S with size is fulfilled by all the different structures. Generally we see that the armchair structures tend to have a larger S than the zigzag structures. The relatively small HR factors of hexagonal GQDs with zigzag edges are attributed to the distribution of electronic wavefunctions, i.e. both the highest occupied molecular orbital (HOMO) state and the lowest unoccupied molecular orbital (LUMO) state wavefunctions tend to distributed at the dot edges. The relevant vibrations are, however, vibrational modes distributed over the entire structure. This will be further discussed later in this section.
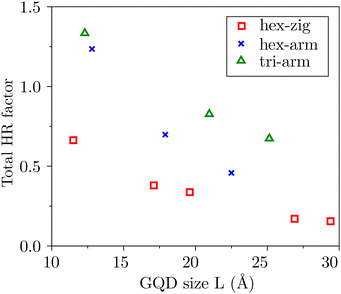 |
| | Fig. 3 Total HR factors S as a function of GQD size L (defined in Fig. 1). | |
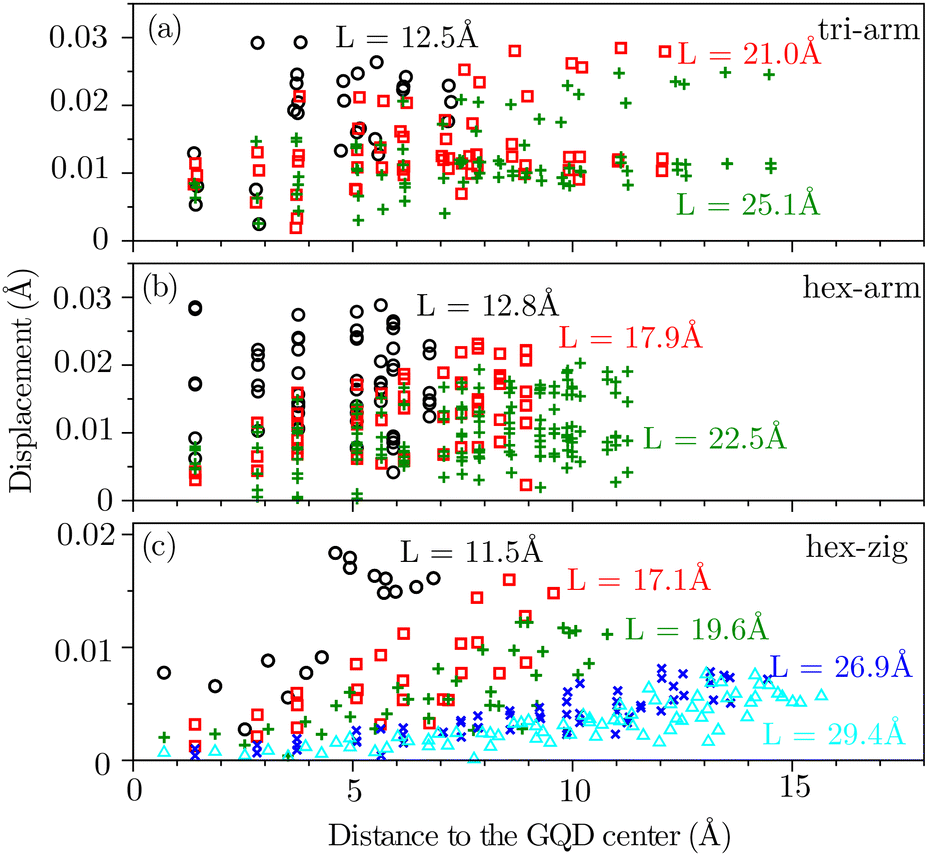
To investigate the lattice distortion induced by the excitons, we plotted in Fig. 4(a)–(c) the atomic displacements |ReI − RgI| as a function of the distance between the atom and the GQD center. Generally we notice that the displacements are larger for smaller GQDs, and we can relate larger HR factors (Fig. 3) to larger displacements, as expected.
 |
| | Fig. 4 Exciton-induced atomic displacements as a function of distance to the GQD center. GQDs of different sizes are indicated with different colors and symbols for (a) tri-arm, (b) hex-arm, and (c) hex-zig structures. | |
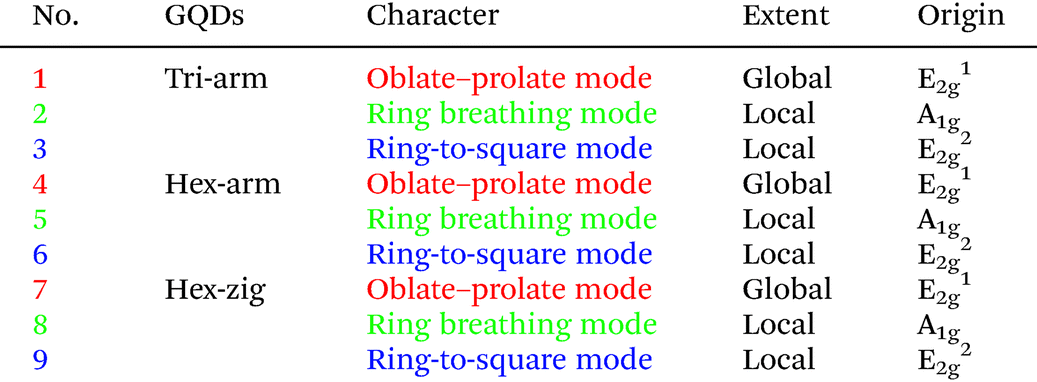
Fig. 5 presents the calculated vibrational density of states (VDOS), where we separated contributions from the core (red) and edges (green) along with the HR factors Si of each individual mode for all our structures. We notice generally that only a few vibrational modes contribute a very large fraction of the total S. These modes with large HR parameters are numbered 1–9 in Fig. 5 and reported in Table 2 along with an interpretation the observed results.
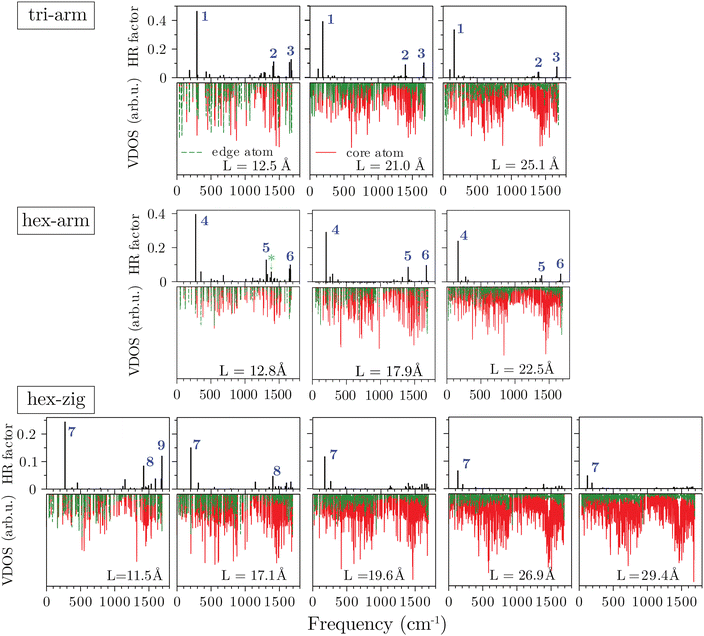 |
| | Fig. 5 Frequency-dependent partial HR factors Si (upper panels) and the VDOSs (lower panels) of the GQDs. From top to bottom shows the triangular GQDs with armchair edges, the hexagonal GQDs with armchair edges, and the hexagonal GQDs with zigzag edges. The numbers above the dominant peaks refer to the numbers in Table 2. | |
Table 2 Dominant HR active vibrational modes shown in Fig. 5. The extent of the modes is given as global or local (see the text). The denominations E2g1, A1g and E2g2 denote the vibrational modes of benzene.61 Movies of the different modes are given in the ESI†50
In Table 2, we have attempted to sort the vibrational modes of the different structures. The “character” describes, in a few words, the type of mode. The “extent” discriminates modes that are global, i.e., the entire structure changes shape. For instance, a breathing mode. Other modes are given as local, where the carbon rings deform but no appreciable change of the entire structure is seen. For instance, a “ring breathing mode” describes a mode where the carbon C6 rings expand and shrink but out-of-phase with its neighbors: one ring shrinks while the other expands. Movies of the different modes are given in the ESI.†50 Attempts were made to relate the vibrational modes and symmetries of C6H6 as shown in the last column of Table 2.61 The E2g1, A1g and E2g2 modes in C6H6 have frequencies of 648 cm−1, 1276 cm−1, and 1767 cm−1, respectively.61,62
From Fig. 5, we see strong coupling to either global low frequency modes (Nr. 1, 4, and 7) or to local high frequency modes (Nr. 2, 3, 5, 6, 8, and 9), with an intermediate frequency range where none of the modes show large HR values. GQDs with armchair edges but different geometries (triangular and hexagonal) look qualitatively very similar: one oblate–prolate global mode (Nr. 1 and 4) strongly dominates the low frequency regime and the local ring breathing (Nr. 2 and 5) and ring-to-square modes (Nr. 3 and 6) are the strongest in the high frequency regime. Also, the hex-zig structure shows a similar behavior: a low-frequency acoustic oblate–prolate mode (Nr. 7) and two higher frequency optical ring breathing (Nr. 8) and ring-to-square modes (Nr. 9), but with lower magnitude of the HR parameters.
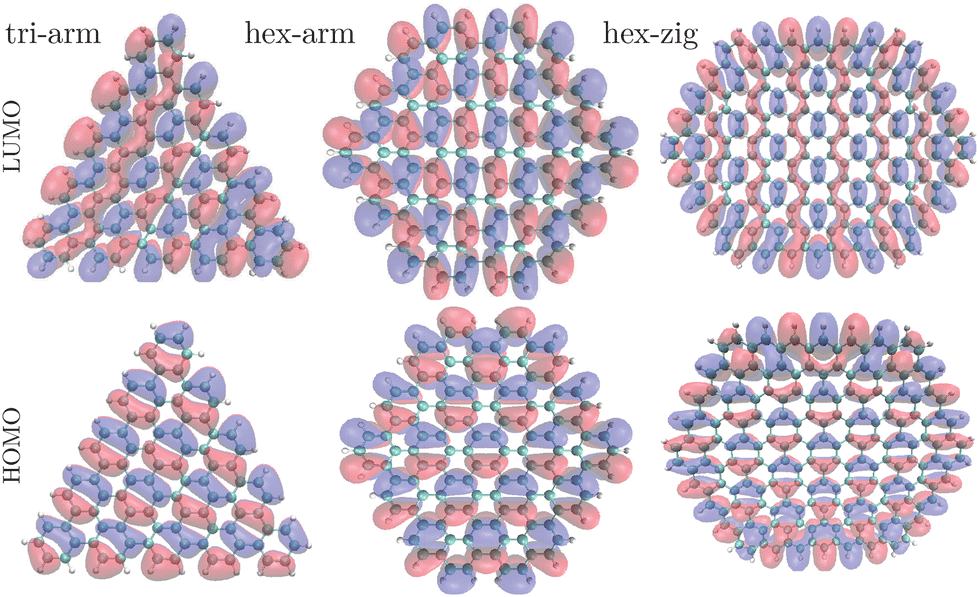
These lower HR values for hex-zig can be explained by the different localizations of the HOMO and LUMO wavefunctions. In Fig. 6, we show the corresponding isosurface plots and see that the HOMO and LUMO are localized homogeneously throughout the structure for tri-arm and hex-arm, but not for hex-zig. For the zigzag-edged structure, the states tend to be localized on the edges. Since the vibrations are delocalized over the structure, the coupling to the edge-localized HOMO and LUMO in hex-zig is weaker and the HR value is smaller. Note that although this description sounds reasonable and fits our results well, it is only part of the story. Indeed, we do not calculate the HR factors Si from single-particle wavefunctions directly, but from the atomic relaxation of the excited (constrained) state. This atomic relaxation, and hence Si, is a consequence of the redistribution of wavefunctions upon excitation, i.e., it represents the response of the lattice to charge transfer from the HOMO to the LUMO. The calculation includes, through the self-consistent cycle, the coupling between the rearrangement of the charge and the lattice, hence it goes beyond the simple single-particle treatment. Nevertheless, a look at the HOMO and LUMO wavefunctions can help to elucidate qualitatively the underlying physics behind the strong EXPC of certain modes.
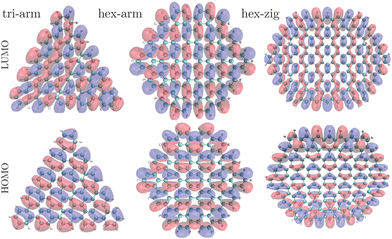 |
| | Fig. 6 LUMO and HOMO wavefunctions for tri-arm (C90H30), hex-arm (C122H30), and hex-zig (C190H34) with isosurfaces enclosing 75% of the total wavefunctions. The cyan and white spheres indicate carbon and hydrogen atoms, respectively. | |
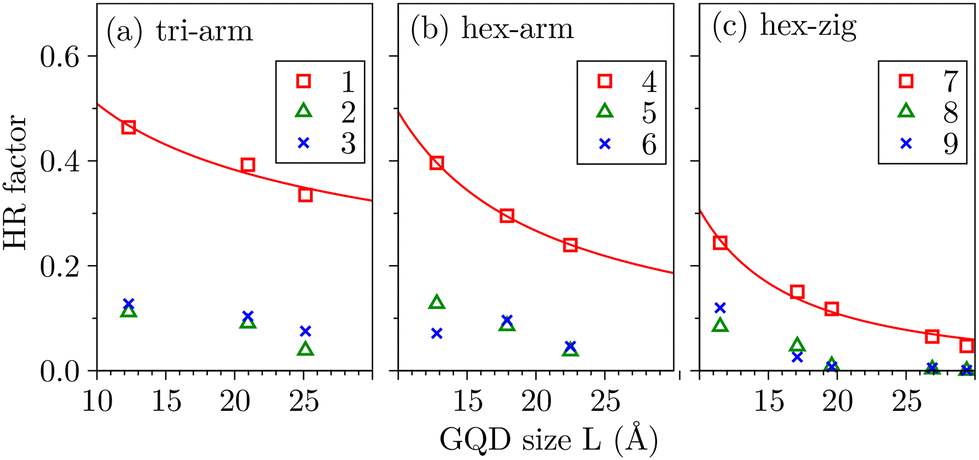
In Fig. 7, we show quantitatively the size dependence of the HR factors for the different structures for the nine dominant modes. We see a decrease of the HR factors with increasing size for all modes and structures. The HR factors of the primary global modes 1, 4, and 7 are fitted using S = γL−η and the parameters are given in Table 3. As shown in Table 3, the value of η significantly increases from 0.41 (tri-arm) to 0.89 (hex-arm) and to 1.49 (hex-zig), highlighting the weaker size dependence of tri-arm.
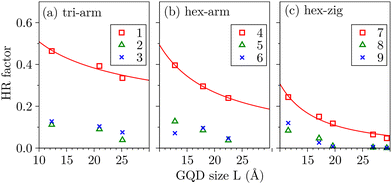 |
| | Fig. 7 HR factors of the nine dominant modes for (a) tri-arm, (b) hex-arm, and (c) hex-zig GQDs with different geometries and edge structures as a function of size. The solid lines for the global modes 1, 4, and 7 are drawn according to S = γL−η. The fitting parameters are given in Table 3. | |
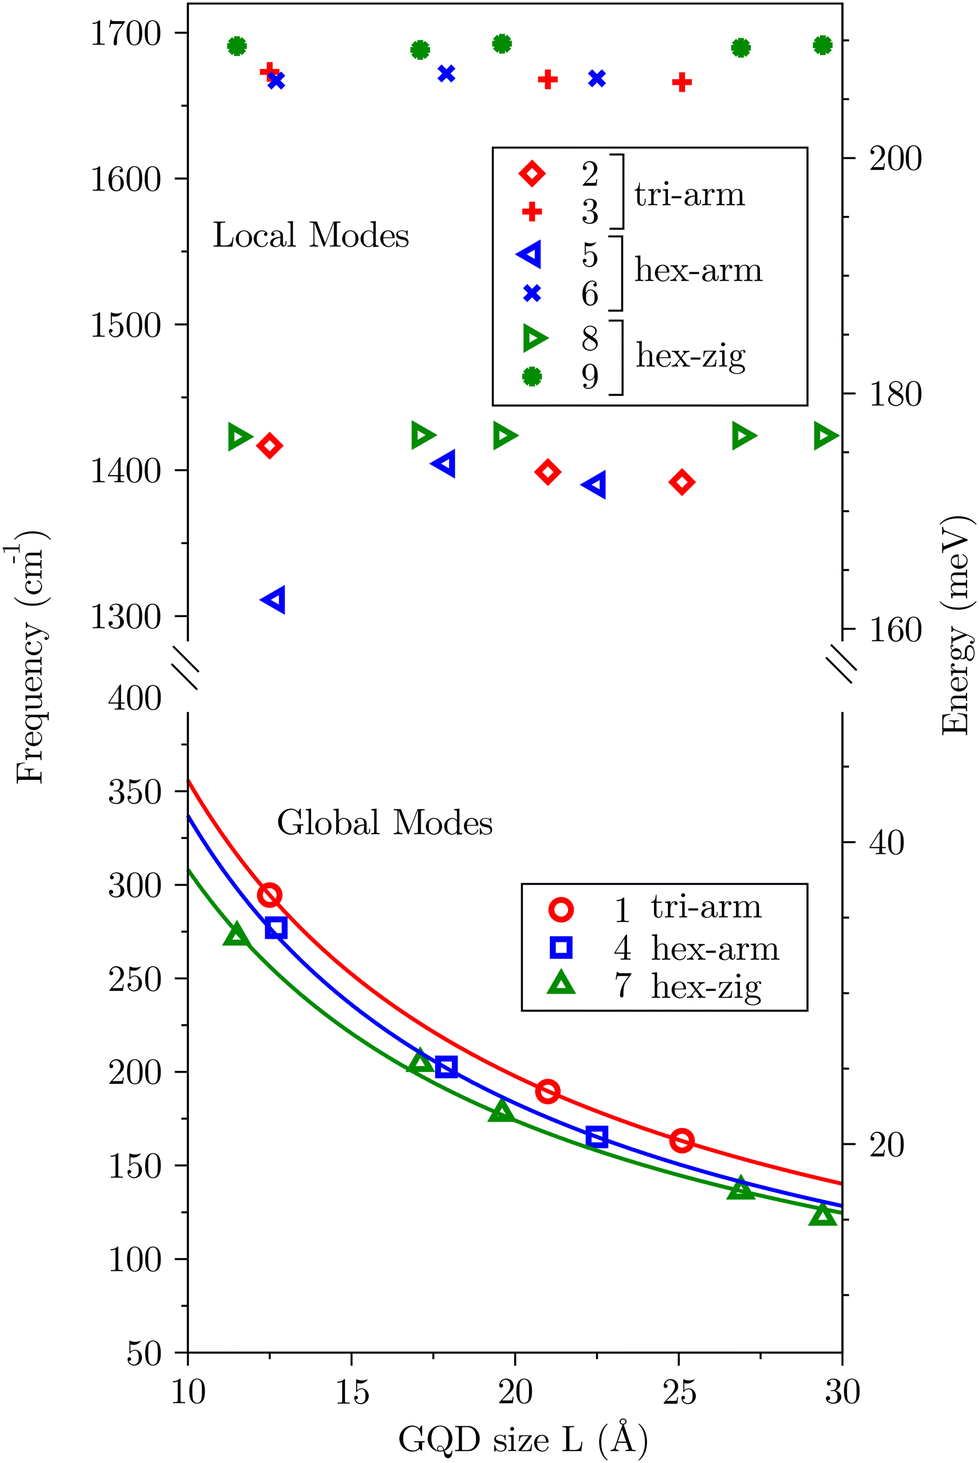
Table 3 Fitting parameters obtained for the size dependence of the vibrational mode frequency ω = αL−β and the HR parameters S = γL−η. These parameters are used to plot the solid lines in Fig. 7 and 8
| Parameters |
Vibrational mode number |
| 1 |
4 |
7 |
|
α (cm−1) |
2505 |
2545 |
2054 |
|
β
|
0.85 |
0.88 |
0.82 |
|
γ
|
1.31 |
3.81 |
9.69 |
|
η
|
0.41 |
0.89 |
1.49 |
In Fig. 8, we show the size dependence of mode frequency. While the global modes shift to lower frequency with the size of the GQDs, the local modes do not shift. This is expected that since the global modes (Nr. 1, 4, and 7) correspond to vibrations of the entire structure and are of lower frequency for larger structures (confinement effect), the local modes (Nr. 2, 3, 5, 6, 8, and 9) are nearly unaffected by the dimension of the GQDs. We fitted the frequencies of the dominant global modes using the functional dependence ω = αL−β (parameters given in Table 3) and plotted the corresponding fitting curves in the figure. Using this function and the fitting parameters should allow for an estimation of the GQD size from the measured phonon frequency of the acoustic global mode.
 |
| | Fig. 8 Vibrational frequencies of the dominant nine modes as a function of the size of the GQDs. The high frequency region shows local vibrations while the global vibrations are at lower frequencies. The solid lines are plotted according to ω = αL−β for which the parameters are given in Table 3. The red, blue and green symbols show the tri-arm, hex-arm and hex-zig structures, respectively. The lower frequency local modes are ring breathing modes (around 1400 cm−1) while the higher frequency modes (around 1700 cm−1) are ring-to-square modes. | |
4.2 Photoluminescence spectra
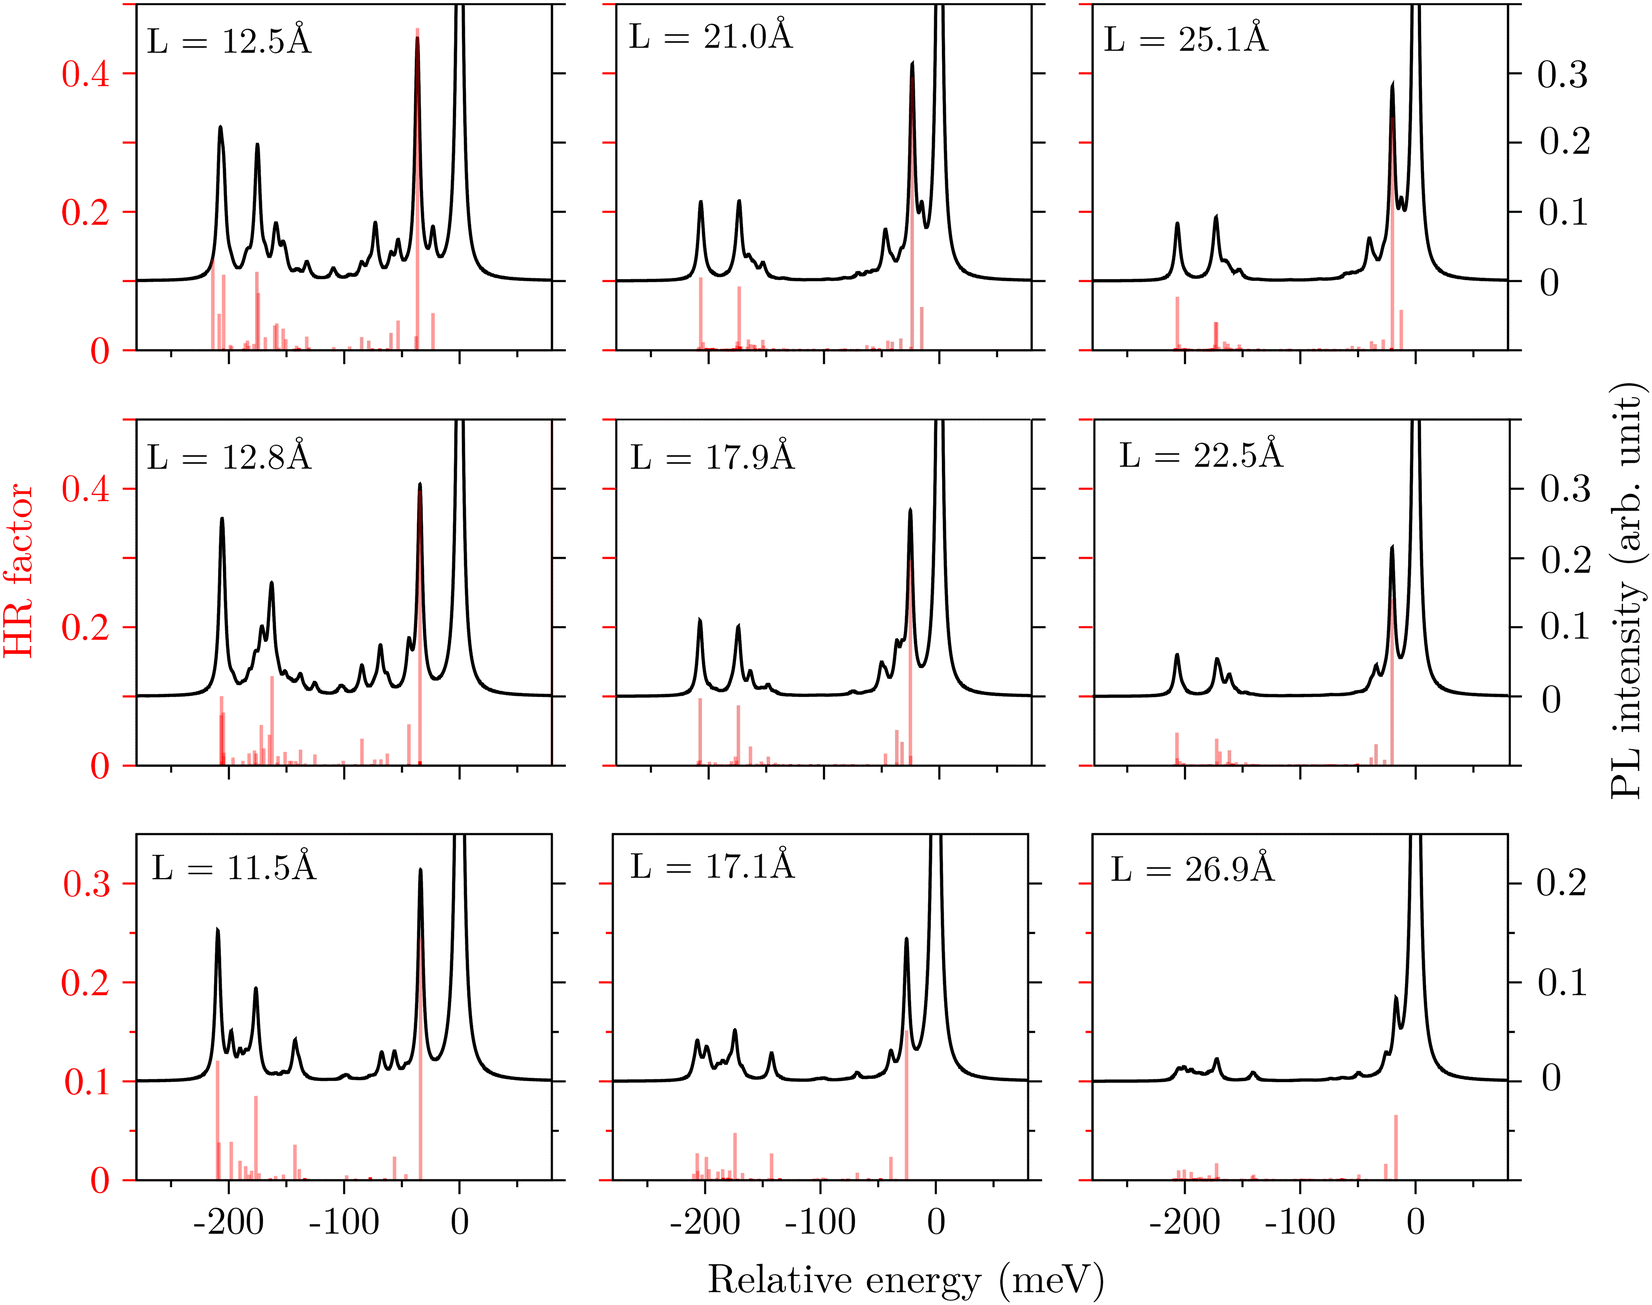
In Fig. 9, we plot the calculated PL spectra, using a broadening of 2 meV (solid black lines) of the triangular (the top line) and hexagonal GQDs with armchair edges (the middle line) and with zigzag edges (the bottom lines) using eqn (3) and (5). The PL spectra of the hex-zig GQDs with sizes of L = 19.6 Å and 29.4 Å are given in the ESI.†50 In this work, we do not focus on the calculation of optical band gaps, which is beyond the framework of DFT-LDA, and we plotted the calculated PL spectrum as a function of the relative energy to the zero phonon line (ZPL) and normalized the ZPL intensity to one. In Fig. 9, we also plotted the HR factors as solid red bars. We see a strongly dominant ZPL and significantly weaker phonon sidebands that, however, constitute a relatively rich low-temperature PL signal. As we already described based on the HR factors (section 4.1), we obtained two regions of large phonon sidebands. One close to the ZPL, in the energy range between 20 and 50 meV, originating from global vibrations (such as oblate–prolate modes) with frequencies depending on the confinement (QD size). The other is due to local (such as ring breathing modes), size independent, vibrations between 140 and 210 meV.
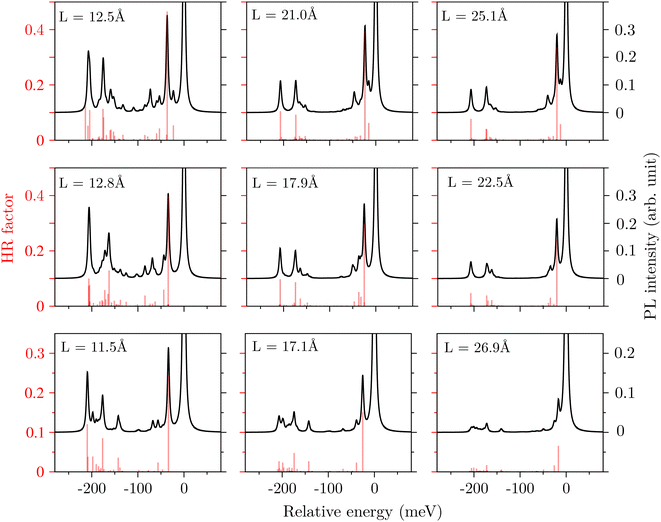 |
| | Fig. 9 Calculated PL intensity (black lines) including only class 1 transitions and HR factors (red bars) for all the tri-arm and hex-arm GQDs considered (see Table 1) and the hex-zig GQDs with sizes of L = 11.5 Å, 17.1 Å and 26.9 Å. The ZPL is shifted to zero relative energy and is normalized to one. | |
4.3 The effect of temperature
With increasing temperature, the initial vibronic state becomes thermally excited, which leads to non-zero phonon occupation numbers (nie > 0) and the number of possible transitions increases significantly. Following our previous work,53 we calculated the temperature-dependent PL spectra as:63| | 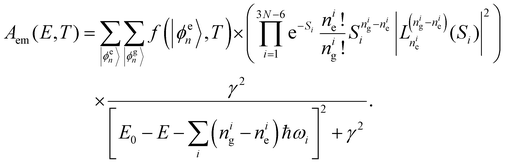 | (5) |
with the Boltzmann probability for the occupation of the excited state |ϕen〉 calculated as:| | 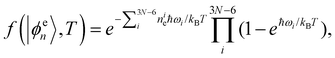 | (6) |
and the generalized Laguerre polynomials L(α)n(x). In eqn (6) the product term is the inverse of the partition function which provides a normalization of the probability.
Using eqn (5) and (6), we calculated the PL spectra of a tri-arm GQD with a size of L = 21.0 Å (C90H30) at temperatures of T = 0, 50, 100, 150, 200, 250, and 300 K and plotted the calculated PL spectra in Fig. 10 with a Lorentz broadening of 5 meV. It should be pointed out that the ZPL exhibits a red shift with increasing temperature in reality, as the results of both the electron–phonon coupling-induced zero-point motion effect43 and the thermal expansion of the lattice. However, these effects are excluded in this work and the energetic position of the ZPL remains unchanged. From Fig. 10, we see an obvious anti-Stokes peak starting at a temperature of 100 K and reaching a significant intensity of around 25% of the ZPL intensity at room temperature. Moreover, we notice that the intensity of the Stokes peak also increases with temperature compared to that of the ZPL. This can be explained as the results of the appearance of vibronic transitions between the exited nie = 1 states and the nig = 2 states in addition to the original transitions between the nie = 0 states and the nig = 1 states at low temperature.
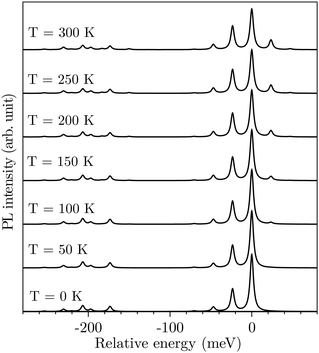 |
| | Fig. 10 Calculated PL spectra of a tri-arm GQD with a size of L = 21.0 Å (C90H30) at different temperatures. A Lorentz broadening of 5 meV was used and the temperature effect on the energetic position of the ZPL (mainly due to lattice expansion), which will lead to a red shift with increasing temperature, was neglected. | |
4.4 The effect of multi-phonon and high class transitions
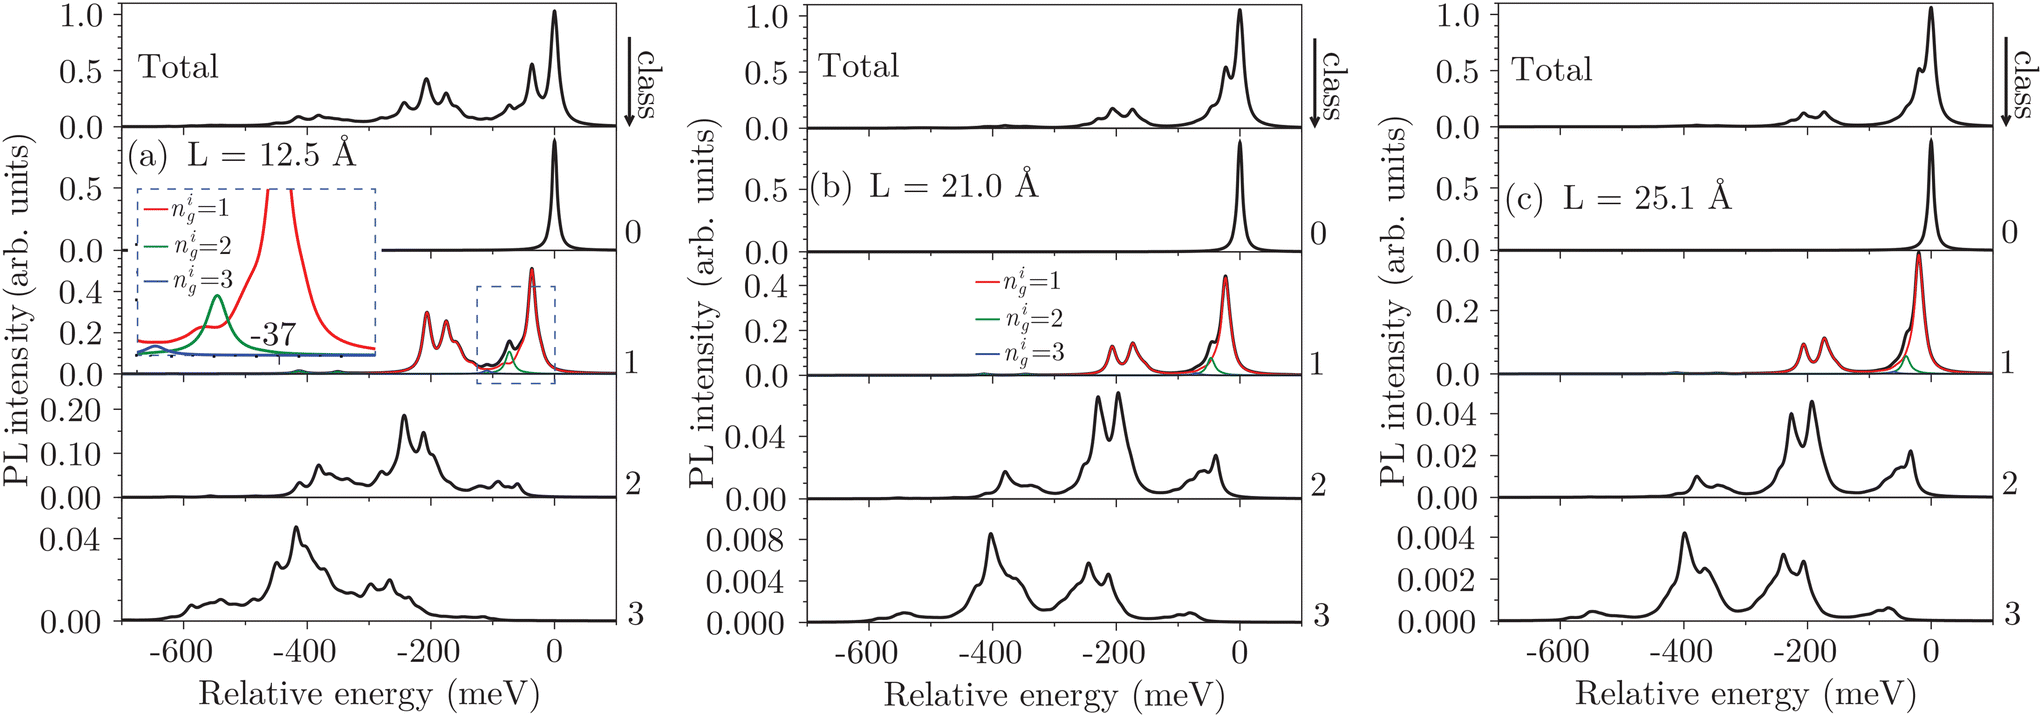
As can be deduced from eqn (4), the intensity of phonon sidebands decreases rapidly with increasing phonon number nig in the case of small HR factors. This is the case for hexagonal GQDs where we have HR factors mostly significantly below 0.4, and hence very weak multiphonon processes. In this section, we focus on tri-arm which has HR factors as large as 0.5 where multiphonon processes become experimentally observable.
In Fig. 11, we presented the calculated PL spectra of the tri-arm GQDs, showing the individual contributions of the different classes [see eqn (4)], using a broadening γ of 10 meV. For class 1 transition (involving only one type of phonon, third row in the figure), we show the contributions of transitions between nie = 0 and nig = 1, 2, and 3 as red, green and blue lines, respectively. For a size of L = 12.5 Å (Fig. 11(a)), we have inserted a magnification of the region within the dashed box. The strong peak at 37 meV corresponds to mode 1, a global oblate–prolate mode with a frequency of about 300 cm−1 (see Fig. 8). The peaks for nig = 2 and 3 correspond to phonon replicas and have accordingly energies of 2 × 37 meV and 3 × 37 meV, respectively. The two strong peaks at 180 and 210 meV correspond to the modes 2 and 3 given in Table 2 and shown in Fig. 5; their replicas are very weak and play no significant role in the PL spectrum. Interestingly, the third peak recognizable in the total PL in the region at around 200 meV originates from a class 2 transition. With increasing size, the importance of higher class transitions (classes 2 and 3) diminishes, as expected from decreasing HR factors.
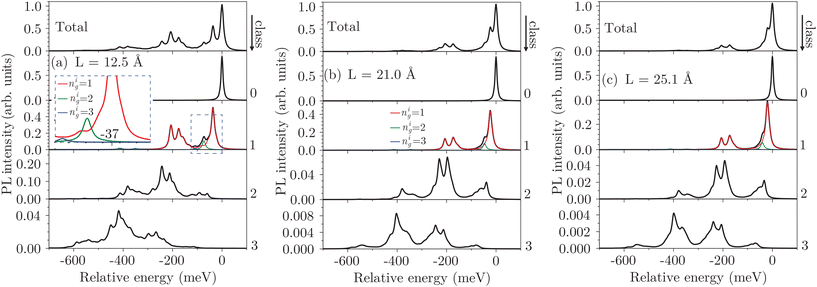 |
| | Fig. 11 Calculated PL spectra at zero temperature for the tri-arm structures. The results are decomposed into contributions from different classes (from class 0 until class 3). A further decomposition of PL into phonon numbers nig = 1 (red), 2 (green), and 3 (blue) is shown for class one transitions. The inset in (a) shows a magnification of the region marked by the blue dashed box. | |
5 Comparison with experimental results
Recently, Liu et al. reported low-temperature single-molecule PL measurements27,28 of C96H24(C12H25)6 GQDs, which are reproduced in Fig. 12(a). The exact experimental structure is given as an inset and shows six alkyl chains (C12H25)6 that have been introduced to enhance the solubility. The PL shows four phonon related peaks. The two peaks at lower frequency were attributed to global vibrations of the GQDs while the two peaks at higher frequency were associated with C![[double bond, length as m-dash]](https://www.rsc.org/images/entities/char_e001.gif) C bond stretching modes.28
C bond stretching modes.28
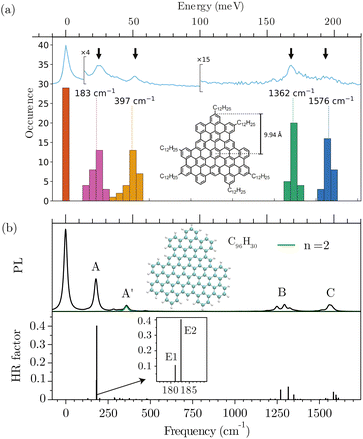 |
| | Fig. 12 (a) Measured PL spectrum of C96H24(C12H25)6 GQDs along with the histograms of the energies of the different vibronic replicas taken from ref. 28. Inset: the atomic structure of C96H24(C12H25)6 GQDs. (b) (Top) calculated PL spectrum of C96H30 GQDs along with (bottom) the corresponding HR factors. The structure used in the calculations, C96H30, is shown in the lower panel. | |
To calculate the HR factors and the PL spectrum of the experimentally synthesized GQDs, we used six hydrogen atoms to replace the alkyl chains at the edges. The calculated PL spectrum of C96H30 is shown in the top of Fig. 12(b) using a Lorentzian broadening γ of 5 meV to fit with the experiment. The distinct phonon replicas A, A′, B, and C are in very good agreement with the experiment (upper blue line curve) in terms of their frequencies and intensities. The corresponding HR factors Si are given in the bottom panel of Fig. 12(b). The dominant HR factor at around 180 cm−1 corresponds to two vibrations at 181.2 cm−1 (labeled E1 with global oblate–prolate character) and 182.8 cm−1 (labeled E2 with global shear mode character, a movie of these modes is available in the ESI†50). Mode E1 is qualitatively very similar to the mode obtained for the L = 21.0 Å tri-arm structure which has also a very similar frequency of 189.5 cm−1 and a similar HR factor of Si = 0.4.
Peak A′ is not due to the emission of phonons with frequencies at around 360 cm−1 but is a phonon replica of peak A (both, modes E1 and E2). Peak B corresponds to a local ring breathing mode, such as modes 2, 5, and 8, and peak C corresponds to the local ring-to-square mode, such as modes 3, 6, and 9.
6 Conclusions
We studied the exciton–phonon coupling of triangular and hexagonal GQDs of experimentally relevant sizes with zigzag and armchair edges using ab initio DFT and CDFT. The HR factors of these structures, which correspond most closely to the measured exciton–phonon coupling strength, were calculated using a projection of the excitation-induced lattice distortion on the vibrational eigenvectors. Our calculations show that only relatively few vibrational modes effectively couple to the excitons and the strength of the coupling decreases with size. The important modes are mainly two local high-frequency modes we call ring breathing and ring-to-square modes and one global low frequency mode we call oblate–prolate mode. The vibrational frequencies of the global modes are affected by the confinement effect and show a red shift with increasing GQD size, while the frequencies of the local modes are nearly size and structure independent. Moreover, we found significantly different size dependencies of the HR factors of the global modes for the GQDs with different geometries and edge structures. Since both the vibrational frequencies and HR factors (from the intensity of the phonon sidebands) can be obtained from PL measurements, we suggest these features as fingerprints of the size, shape and edge structure of the GQDs. We calculated the PL spectrum of a GQD directly inspired from a recent low-temperature single-particle PL experiment (C96H30) and found excellent agreement between the calculated and measured PL spectra. The theoretical calculation allows for an interpretation of the observed signal, indicating, e.g., that one peak corresponds to a two-phonon replica. Our approach—capable of addressing multiphonon processes in relatively large nanostructures—facilitates the interpretation of vibrational signatures in photoluminescence measurements, extending beyond graphene quantum dots to include nanostructures containing hundreds to thousands of atoms that can be accommodated by DFT and constrained DFT calculations, yet remain prohibitively expensive for advanced ab initio techniques.
Data availability
The data supporting this article have been included as part of the ESI.†
Conflicts of interest
There are no conflicts to declare.
Acknowledgements
We thank Jean-Sébastien Lauret for helpful discussion pertinent to the comparison with the experiment. P. H. acknowledges financial support from the National Natural Science Foundation of China under Grant No. 12174270 and 11774243. This work was supported by the Cluster of Excellence “Advanced Imaging of Matter” of the Deutsche Forschungsgemeinschaft (DFG) – EXC 2056 – project ID 390715994. T. D. acknowledges funding by the Deutsche Forschungsgesellschaft (DFG) via GRK 2536 NANOHYBRID-project ID 408076438. P. H., Y. Z. and G. B. acknowledge financial support by the Chinesisch-Deutsches Mobilitätsprogramm from Chinesisch-Deutsches Zentrum für Wissenschaftsförderung under Grant M-0225. The work was carried out at the National Supercomputer Center in Tianjin, and the calculations were performed on a Tianhe new generation supercomputer.
References
- J. Wu, W. Pisula and K. Müllen, Chem. Rev., 2007, 107, 718–747 CrossRef CAS PubMed.
- K. Müllen, ACS Nano, 2014, 8, 6531–6541 CrossRef PubMed.
- A. Ghaffarkhah, E. Hosseini, M. Kamkar, A. A. Sehat, S. Dordanihaghighi, A. Allahbakhsh, C. van der Kuur and M. Arjmand, Small, 2022, 18, 2102683 CrossRef CAS.
- S. Chung, R. A. Revia and M. Zhang, Adv. Mater., 2021, 33, 1904362 CrossRef CAS.
- W. Fu, J. Yin, H. Cao, Z. Zhou, J. Zhang, J. Fu, J. H. Warner, C. Wang, X. Jia, G. N. Greaves and A. K. Cheetham, Adv. Mater., 2023, 35, 2304074 CrossRef CAS.
- H. A. Kermani, M. Hosseini, M. Dadmehr, S. Hosseinkhani and M. R. Ganjali, Sens. Actuators, B, 2017, 241, 217–223 CrossRef CAS.
- A. Abbas, T. A. Tabish, S. J. Bull, T. M. Lim and A. N. Phan, Sci. Rep., 2020, 10, 21262 CrossRef CAS PubMed.
- Y. Yan, J. Chen, N. Li, J. Tian, K. Li, J. Jiang, J. Liu, Q. Tian and P. Chen, ACS Nano, 2018, 12, 3523–3532 CrossRef CAS PubMed.
- P. Ding, J. Di, X. Chen, M. Ji, K. Gu, S. Yin, G. Liu, F. Zhang, J. Xia and H. Li, ACS Sustainable Chem. Eng., 2018, 6, 10229–10240 CrossRef CAS.
- C. Geng, X. Chen, S. Li, Z. Ding, W. Ma, J. Qiu, Q. Wang, C. Yan and H.-j. Fan, Energy Mater. Adv., 2021, 2021, 8481915 Search PubMed.
- L. A. Ponomarenko, F. Schedin, M. I. Katsnelson, R. Yang, E. W. Hill, K. S. Novoselov and A. K. Geim, Science, 2008, 320, 356–358 CrossRef CAS.
-
L. F. E. F. Torres, S. Roche and J.-C. Charlier, in Introduction to Graphene-Based Nanomaterials: From Electronic Structure to Quantum Transport, Cambridge University Press, Cambridge, 2014 Search PubMed.
- X. Yan, X. Cui, B. Li and L.-s. Li, Nano Lett., 2010, 10, 1869–1873 CrossRef CAS.
- D. Pan, J. Zhang, Z. Li and M. Wu, Adv. Mater., 2010, 22, 734 CrossRef CAS PubMed.
- V. Gupta, N. Chaudhary, R. Srivastava, G. D. Sharma, R. Bhardwaj and S. Chand, J. Am. Chem. Soc., 2011, 133, 9960–9963 CrossRef CAS.
- J. Peng, W. Gao, B. K. Gupta, Z. Liu, R. Romero-Aburto, L. Ge, L. Song, L. B. Alemany, X. Zhan, G. Gao, S. A. Vithayathil, B. A. Kaipparettu, A. A. Marti, T. Hayashi, J.-J. Zhu and P. M. Ajayan, Nano Lett., 2012, 12, 844–849 CrossRef CAS PubMed.
- S. Kim, S. W. Hwang, M.-K. Kim, D. Y. Shin, D. H. Shin, C. O. Kim, S. B. Yang, J. H. Park, E. Hwang, S.-H. Choi, G. Ko, S. Sim, C. Sone, H. J. Choi, S. Bae and B. H. Hong, ACS Nano, 2012, 6, 8203–8208 CrossRef CAS.
- W. Kwon, Y.-H. Kim, C.-L. Lee, M. Lee, H. C. Choi, T.-W. Lee and S.-W. Rhee, Nano Lett., 2014, 14, 1306–1311 CrossRef CAS PubMed.
- W.-S. Kuo, X.-C. Shen, C.-Y. Chang, H.-F. Kao, S.-H. Lin, J.-Y. Wang and P.-C. Wu, ACS Nano, 2020, 14, 11502–11509 CrossRef CAS.
- Q. Zhang, J. Jie, S. Diao, Z. Shao, Q. Zhang, L. Wang, W. Deng, W. Hu, H. Xia, X. Yuan and S.-T. Lee, ACS Nano, 2015, 9, 1561–1570 CrossRef CAS.
- C. Xia, Y. Qiu, Y. Xia, P. Zhu, G. King, X. Zhang, Z. Wu, J. Y. Kim, D. A. Cullen, D. Zheng, P. Li, M. Shakouri, E. Heredia, P. Cui, H. N. Alshareef, Y. Hu and H. Wang, Nat. Chem., 2021, 13, 887–894 CrossRef CAS.
- R. Liu, D. Wu, X. Feng and K. Müllen, J. Am. Chem. Soc., 2011, 133, 15221–15223 CrossRef CAS PubMed.
- A. Narita, X.-Y. Wang, X. Feng and K. Müllen, Chem. Soc. Rev., 2015, 44, 6616–6643 RSC.
- X.-Y. Wang, A. Narita and K. Müllen, Nat. Rev. Chem., 2017, 2, 0100 CrossRef.
- X.-Y. Wang, X. Yao, A. Narita and K. Müllen, Acc. Chem. Res., 2019, 52, 2491–2505 CrossRef CAS PubMed.
- J. Su, M. Telychko, P. Hu, G. Macam, P. Mutombo, H. Zhang, Y. Bao, F. Cheng, Z.-Q. Huang, Z. Qiu, S. J. R. Tan, H. Lin, P. Jelinek, F.-C. Chuang, J. Wu and J. Lu, Sci. Adv., 2019, 5, eaav7717 CrossRef CAS PubMed.
- T. Liu, C. Tonnele, S. Zhao, L. Rondin, C. Elias, D. Medina-Lopez, H. Okuno, A. Narita, Y. Chassagneux, C. Voisin, S. Campidelli, D. Beljonne and J.-S. Lauret, Nanoscale, 2022, 14, 3826–3833 RSC.
- T. Liu, B. Carles, C. Elias, C. Tonnele, D. Medina-Lopez, A. Narita, Y. Chassagneux, C. Voisin, D. Beljonne, S. Campidelli, L. Rondin and J.-S. Lauret, J. Chem. Phys., 2022, 156, 104302 CrossRef CAS PubMed.
- J. Fernández-Rossier and J. J. Palacios, Phys. Rev. Lett., 2007, 99, 177204 CrossRef PubMed.
- K. A. Ritter and J. W. Lyding, Nat. Mater., 2009, 8, 235–242 CrossRef CAS PubMed.
- A. D. Güçlü, P. Potasz, O. Voznyy, M. Korkusinski and P. Hawrylak, Phys. Rev. Lett., 2009, 103, 246805 CrossRef PubMed.
- L. L. Li, M. Zarenia, W. Xu, H. M. Dong and F. M. Peeters, Phys. Rev. B, 2017, 95, 045409 CrossRef.
- P. Ruffieux, S. Wang, B. Yang, C. Sánchez-Sánchez, J. Liu, T. Dienel, L. Talirz, P. Shinde, C. A. Pignedoli, D. Passerone, T. Dumslaff, X. Feng, K. Müllen and R. Fasel, Nature, 2016, 531, 489–492 CrossRef CAS PubMed.
- O. Gröning, S. Wang, X. Yao, C. A. Pignedoli, G. B. Barin, C. Daniels, A. Cupo, V. Meunier, X. Feng, A. Narita, K. Müllen, P. Ruffieux and R. Fasel, Nature, 2018, 560, 209–213 CrossRef.
- D. J. Rizzo, J. Jiang, D. Joshi, G. Veber, C. Bronner, R. A. Durr, P. H. Jacobse, T. Cao, A. Kalayjian, H. Rodriguez, P. Butler, T. Chen, S. G. Louie, F. R. Fischer and M. F. Crommie, ACS Nano, 2021, 15, 20633–20642 CrossRef CAS PubMed.
- N. Pavlicek, A. Mistry, Z. Majzik, N. Moll, G. Meyer, D. J. Fox and L. Gross, Nat. Nanotechnol., 2017, 12, 308–312 CrossRef CAS PubMed.
- S. Mishra, G. Catarina, F. Wu, R. Ortiz, D. Jacob, K. Eimre, J. Ma, C. A. Pignedoli, X. Feng, P. Ruffieux, J. Fernández-Rossier and R. Fasel, Nature, 2021, 598, 287–292 CrossRef CAS PubMed.
- C. Sun, F. Figge, I. Ozfidan, M. Korkusinski, X. Yan, L.-S. Li, P. Hawrylak and J. A. McGuire, Nano Lett., 2015, 15, 5472–5476 CrossRef CAS.
- I. Ozfidan, M. Korkusinski and P. Hawrylak, Phys. Rev. B: Condens. Matter Mater. Phys., 2015, 91, 115314 CrossRef.
- Y. Saleem, L. Najera Baldo, A. Delgado, L. Szulakowska and P. Hawrylak, J. Phys.: Condens. Matter, 2019, 31, 305503 CrossRef CAS.
- Y. Li, H. Shu, S. Wang and J. Wang, J. Phys. Chem. C, 2015, 119, 4983–4989 CrossRef CAS.
- M. Zacharias and P. C. Kelires, J. Phys. Chem. Lett., 2021, 12, 9940–9946 CrossRef CAS PubMed.
- P. Han and G. Bester, Phys. Rev. B: Condens. Matter Mater. Phys., 2013, 88, 165311 CrossRef.
- P. Han and G. Bester, New J. Phys., 2016, 18, 113052 CrossRef.
- M. L. Mueller, X. Yan, J. A. McGuire and L.-S. Li, Nano Lett., 2010, 10, 2679–2682 CrossRef CAS PubMed.
- V. Singh, M. R. Zoric, G. N. Hargenrader, A. J. S. Valentine, O. Zivojinovic, D. R. Milic, X. Li and K. D. Glusac, J. Phys. Chem. Lett., 2020, 11, 210 CrossRef CAS PubMed.
- P. Han and G. Bester, Phys. Rev. B, 2019, 99, 100302 CrossRef CAS.
- A. Alkauskas, J. L. Lyons, D. Steiauf and C. G. Van de Walle, Phys. Rev. Lett., 2012, 109, 267401 CrossRef PubMed.
- E. H. Lieb, Phys. Rev. Lett., 1989, 62, 1201–1204 CrossRef.
- supplemental/XXX/YYY for details on the HR factors of unpassivated GQDs, the characters of eleven dominant HR active modes, the contributions from the core and edge atoms to the HR factor, the calculated PL intensity along with the corresponding HR factors for hex-zig GQDs with sizes of L = 19.6 Å and 29.4 Å, separately plotted exciton-induced atomic displacement as a function of the distance to the GQD center, and the visualization of HR active vibrational modes in GQDs.
- M. Lax, J. Chem. Phys., 1952, 20, 1752 CrossRef CAS.
- L. Razinkovas, M. W. Doherty, N. B. Manson, C. G. Van de Walle and A. Alkauskas, Phys. Rev. B, 2021, 104, 045303 CrossRef CAS.
- P. Han and G. Bester, Phys. Rev. B, 2022, 106, 245404 CrossRef CAS.
-
G. Grosso and G. P. Parravicini, in Solid State Physics, Elservier (Singapore) Pte Ltd, Singapore, 2nd edn, 2015 Search PubMed.
- M. Califano, A. Franceschetti and A. Zunger, Nano Lett., 2005, 5, 2360–2364 CrossRef CAS.
- A. van Driel, G. Allan, C. Delerue, P. Lodahl, W. Vos and D. Vanmaekelbergh, Phys. Rev. Lett., 2005, 95, 236804 CrossRef CAS PubMed.
- R. Richter, M. I. S. Röhr, T. Zimmermann, J. Petersen, C. Heidrich, R. Rahner, T. Möller, J. E. Dahl, R. M. K. Carlson, R. Mitric, T. Rander and A. Merli, Phys. Chem. Chem. Phys., 2015, 17, 4739–4749 RSC.
- CPMD, https://www.cpmd.org/, Copyright IBM Corp 1990–2019, Copyright MPI für Festkörperforschung Stuttgart 1997–2001.
- J. P. Perdew and A. Zunger, Phys. Rev. B: Condens. Matter Mater. Phys., 1981, 23, 5048 CrossRef CAS.
- N. Troullier and J. L. Martins, Phys. Rev. B: Condens. Matter Mater. Phys., 1991, 43, 1993 CrossRef CAS PubMed.
- M. Preuss and F. Bechstedt, Phys. Rev. B: Condens. Matter Mater. Phys., 2006, 73, 155413 CrossRef.
-
https://www.chem.purdue.edu/jmol/vibs/c6h6.html
.
- J. Ulstrup and J. Jortner, J. Chem. Phys., 1975, 63, 4358 CrossRef CAS.
|
| This journal is © The Royal Society of Chemistry 2025 |
Click here to see how this site uses Cookies. View our privacy policy here. 
 Open Access Article
 This Open Access Article is licensed under a
  *a,
Tobias
Dittmann
b,
Fuhe
Wang
a,
Yan
Zhang
*a,
Tobias
Dittmann
b,
Fuhe
Wang
a,
Yan
Zhang
 , and differs from the EXPC matrix elements calculated from electron and hole wavefunctions directly (see ref. 47).
 is the total HR factor, i, j, and k denote different vibrational modes and nig, njg, and nkg denote the corresponding phonon (vibron) quantum numbers. For practical purposes, the sums will be truncated at the certain maximum number of vibrons nmax.