
 Open Access Article
 This Open Access Article is licensed under a
 Creative Commons Attribution 3.0 Unported Licence
Advances and applications of dynamic surface-enhanced Raman spectroscopy (SERS) for single molecule studies
Yanqiu
Zou
a,
Huaizhou
Jin
b,
Qifei
Ma
c,
Zhenrong
Zheng
*a,
Shukun
Weng
d,
Karol
Kolataj
e,
Guillermo
Acuna
 e,
Ilko
Bald
f and
Denis
Garoli
*cdg
e,
Ilko
Bald
f and
Denis
Garoli
*cdg
aCollege of Optical Science and Engineering, Zhejiang University, Hangzhou 310027, China. E-mail: zzr@zju.edu.cn
bKey Laboratory of Quantum Precision Measurement, College of Physics, Zhejiang University of Technology, Hangzhou, China
cCollege of Optical and Electronic Technology, China Jiliang University, Hangzhou 310018, China. E-mail: denis.garoli@unimore.it
dIstituto Italiano di Tecnologia, Via Morego 30, 16163 Genova, Italy
eDepartment of Physics, University of Fribourg, Fribourg CH 1700, Switzerland
fInstitute of Chemistry, University of Potsdam, 14476 Potsdam, Germany
gDipartimento di Scienze e metodi dell'ingegneria, Università degli Studi di Modena e Reggio Emilia, 42122 Reggio Emilia, Italy
First published on 23rd December 2024
Abstract
Dynamic surface-enhanced Raman spectroscopy (SERS) is nowadays one of the most interesting applications of SERS, in particular for single molecule studies. In fact, it enables the study of real-time processes at the molecular level. This review summarizes the latest developments in dynamic SERS techniques and their applications, focusing on new instrumentation, data analysis methods, temporal resolution and sensitivity improvements, and novel substrates. We highlight the progress and applications of single-molecule dynamic SERS in monitoring chemical reactions, catalysis, biomolecular interactions, conformational dynamics, and real-time sensing and detection. We aim to provide a comprehensive review on its advancements, applications as well as its current challenges and development frontiers.
Introduction
Introduction to dynamic SERS
Raman Spectroscopy (RS) is a powerful analytical technique in various fields, including chemistry, biology, and materials sciences.1,2 Compared to traditional detection and sensing methods in these sciences such as mass spectroscopy and High-Performance Liquid Chromatography (HPLC) in chemistry and material sciences or enzyme-linked immunosorbent assay (ELISA) in biology, RS provides rich structural information, or “vibrational fingerprints” that can be used for identification and characterization. Also compared to infrared spectroscopy, RS is more suitable for the analysis of aqueous samples, because water has a strong absorption in the IR region that can obscure IR signals, whereas the Raman scattering from water primarily affects only the OH stretching region (around 3400 cm−1),3,4 leaving other spectral regions for analysis.Despite the inherent advantages of RS, its practical application has been limited by its relatively low sensitivity. This limitation has been addressed by the development of SERS,5–12 which uses electromagnetic fields generated by plasmonic nanostructures to amplify the Raman scattering signal of molecules. The SERS enhancement factor can reach up to 1012, allowing for the detection of single molecules.13–17 There are several important molecule characterization techniques, including electron microscopy,18,19 single-molecule fluorescence microscopy20 and nuclear magnetic resonance (NMR).21 Each has distinct advantages and limitations. Electron microscopy requires fixed samples and vacuum conditions, with cutting-edge methods like cryo-EM18 demanding significant infrastructure investment and cannot monitor reactions in real time. Single-molecule fluorescence microscopy is a series of advanced fluorescence microscopy techniques including Stimulated Emission Depletion (STED),22 Total Internal Reflection Fluorescence (TIRF),23 Stochastic Optical Reconstruction Microscopy (STORM)24 and so on, and they can be used to track molecular dynamics with very high spatial resolution but requires fluorescent labels and may suffer from photobleaching. NMR demands larger sample volumes and longer acquisition times, and is usually not a single molecule technique.
Dynamic SERS uniquely offers real-time monitoring of chemical reactions with microsecond resolution and chemical specificity under ambient conditions. These techniques can also work synergistically with dynamic SERS. For example, electron microscopy or STORM can reveal detailed structural information, while dynamic SERS can track rapid chemical changes in solution, providing complementary insights into molecular processes. Recent advancements in the design and fabrication of SERS substrates have significantly contributed to the improved sensitivity and reproducibility of SERS measurements.25–28 Novel plasmonic nanostructures have been developed to provide high-density hotspots for enhanced SERS signals.29,30
In recent years, the development of dynamic SERS has garnered significant attention, as it enables real-time monitoring of chemical and biological processes. Dynamic SERS can be used to provide insights into the kinetics and mechanisms of these processes.31,32 Dynamic SERS involves decreasing the acquisition time from minutes or seconds down to milliseconds to effectively capture, with high temporal resolution, SERS signals during potential chemical or mechanical reactions of the molecules under investigation. The fundamental concept behind dynamic SERS exploits the dynamic nature of nanoparticles in solution to extract pure SERS signals from the overwhelming solvent background. Through analysis of the spectral fluctuations, dynamic SERS effectively removes spectral interferences and enables the detection of SERS signals from nanoparticles at extremely low concentrations, as shown in Fig. 1(a) and (b). The key to the development of dynamic SERS is the development of both sensitivity and temporal resolution. High SERS sensitivity allows to detect trace amounts of molecules at very little time intervals, thus enabling researchers to continuously monitor the molecular structures of the analytes and discover molecular confirmations or reaction intermediates that appear for very short time. To date, some research groups were able to collect consecutive Raman spectra at the millisecond or microsecond intervals,33,34 for example, Fig. 1(c) shows the time-dependent heat map of SERS intensity as a function of Raman shift in R6G solution. The ability to detect single molecules has also opened up new avenues for dynamic SERS, such as studying conformations and intermediates by observing and tracking single molecules in real-time.35
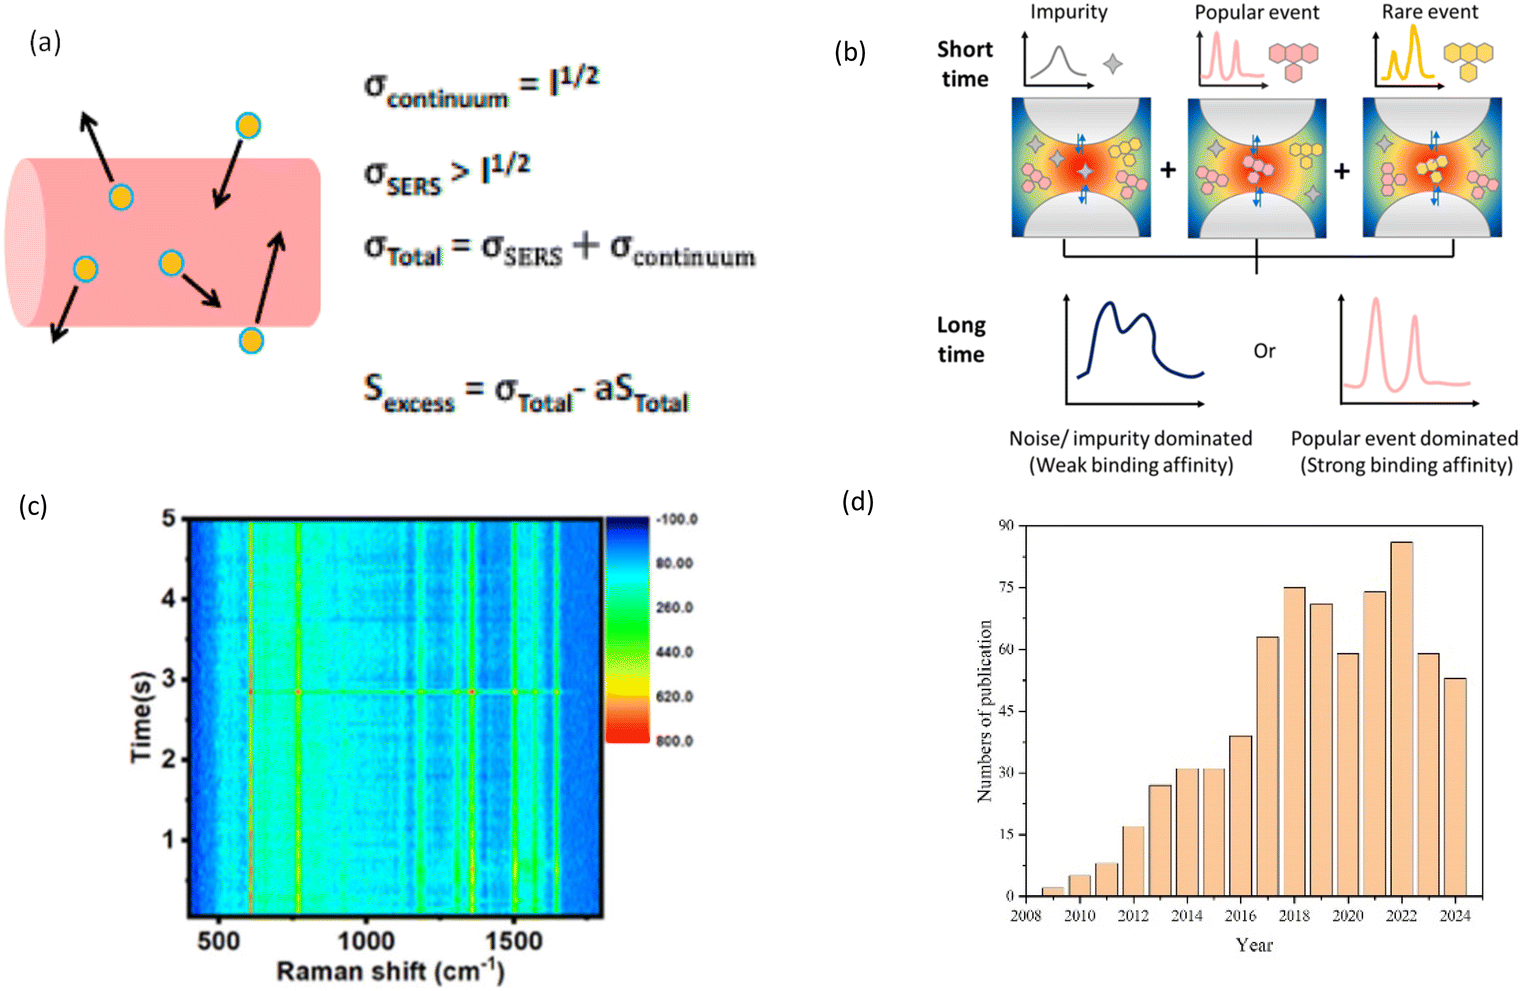 | ||
| Fig. 1 Dynamic SERS concept and its research trends. (a) (left) An illustration of dynamic SERS concept which shows a colloidal nanoparticle moving through a focused laser beam. (right) The standard deviation of the continuum, σcontinuum, will scale as the square root of the intensity while the σSERS from the nanoparticle will be larger. The signal attributed to the excess noise, Sexcess, from the dynamic SERS-active nanoparticles can be determined by calculating the difference between the total noise, σtotal, and the total signal, Stotal, while accounting for the disparity in magnitude between the standard deviation and average signals using a factor a. Reproduced with permission from ref. 34. Copyright 2012 American Chemical Society. (b) This updated schematic illustrate rare event to single molecule level. In the traditional SERS measurement (long time exposure), either the popular events or the noise-dominated SERS spectrum is obtained. In the dynamic SERS measurement (short time exposure), the signals from the impurity and popular and rare events of the target are well distinguished. (c) Time-dependent heat map of SERS intensity as a function of Raman shift in R6G solution. Reproduced with permission from ref. 33. Copyright 2020 American Chemical Society. (d) Numbers of literatures published annually since 2024, searched for using the keyword “dynamic SERS” by using Google Scholar, as of August 2024. | ||
The growing interest in dynamic SERS is demonstrated from the steady increase in the number of publications on this topic over the years. As shown in Fig. 1(d), dynamic SERS first emerged as a research topic around 2008. Since then, the annual number of publications has steadily grown from below 15 per year before 2012 to more than 50 publications per year after 2017, peaking at 86 publications in 2022. This trend highlights the increasing recognition of dynamic SERS as a promising tool for investigating complex chemical and biological systems, as the sensitivity and temporal resolution of dynamic SERS continues to evolve.
Key foundational works
The development of dynamic SERS is based on a series of key foundational studies. These pioneering works first established the existence of transient and amplified Raman signals, and improved on both sensitivity and temporal resolution.One of the earliest demonstrations of dynamic SERS in a biologically relevant system was the study by Etchegoin et al. on photoinduced oxygen release in hemoglobin.36 By means of surface-enhanced resonant Raman scattering (SERRS) using silver colloids, they observed transient, massive amplifications of Raman signals during oxygen dissociation, attributed to a charge-transfer mechanism at the protein–nanoparticle interface that allows normally Raman-forbidden modes to be observed. The enhanced signals were shown to originate from the heme groups and to be sensitive to their local environment and orientation. Yan et al. studied optimal hotspot generation for dynamic SERS, and monitored the formation of optimal hotspots in real-time using in situ small-angle X-ray scattering.37
The temporal resolution of dynamic SERS slowly improved. In 2012, Scott et al. were able to acquire a clear Raman spectrum of 4-mercaptopyridine (4MP) every 100 ms by exploiting nanoparticle Brownian motion to extract site-specific SERS signals and remove interfering background contributions.34 They were able to acquire 1000 consistent SERS spectra over the span of 10 seconds.
Dynamic SERS mapping and imaging is another research frontier for dynamic SERS. In 2014, Ertsgaard et al. demonstrated dynamic control and sub-diffraction localization of plasmonic hotspots on a silver nanohole array, which enabled super-resolution SERS imaging.38 The work of Brulé et al. is one of the earlier works for data analysis in dynamic SERS. They used statistical and Fourier analysis of Raman intensity fluctuations to determine the concentration sensitivity of SM dynamic SERS.39 Their probability density function allows calibration-free determination of molecular concentrations over a wide range (10−11 to 10−6 M).
Purpose and scope of the review
The purpose of this review is to provide a comprehensive overview of recent advances in single molecule dynamic SERS, including its mechanisms and applications, and complementary methodologies. This review covers the primary applications of dynamic SERS in research: conformational dynamics of biomolecules, nucleic acid and protein sequencing, chemical reaction dynamics, and dynamic SERS imaging.Recent advancements in dynamic SERS techniques
Advancements in fast dynamic SERS
High-speed imaging and spectroscopy techniques have played a crucial role in advancing dynamic SERS by enabling the acquisition of SERS spectra with improved temporal resolution. The initial connection between fluctuations in SERS intensity and the measurable response from single molecules has been a significant focus in the field of SERS.7,11 This relationship highlights the sensitivity of SERS, which allows for the detection of individual molecules through enhanced Raman signals, particularly at specific sites on metallic surfaces known as SERS active sites or hot spots. Most of the work done in this field are by Lindquist and Brolo's group. In 2019 they developed a high-speed imaging system that combines a fast camera and a high-power laser to capture SERS intensity fluctuations from individual nanoparticles at a rate of up to 800![[thin space (1/6-em)]](https://www.rsc.org/images/entities/char_2009.gif) 000 frames per second.40 Details of their experimental approach also with the high-speed SERS signal acquisition are shown in Fig. 2. This technique allowed them to observe the formation and dissociation of single-molecule SERS hotspots in real-time, providing insights into the dynamic nature of SERS-active sites.
000 frames per second.40 Details of their experimental approach also with the high-speed SERS signal acquisition are shown in Fig. 2. This technique allowed them to observe the formation and dissociation of single-molecule SERS hotspots in real-time, providing insights into the dynamic nature of SERS-active sites.
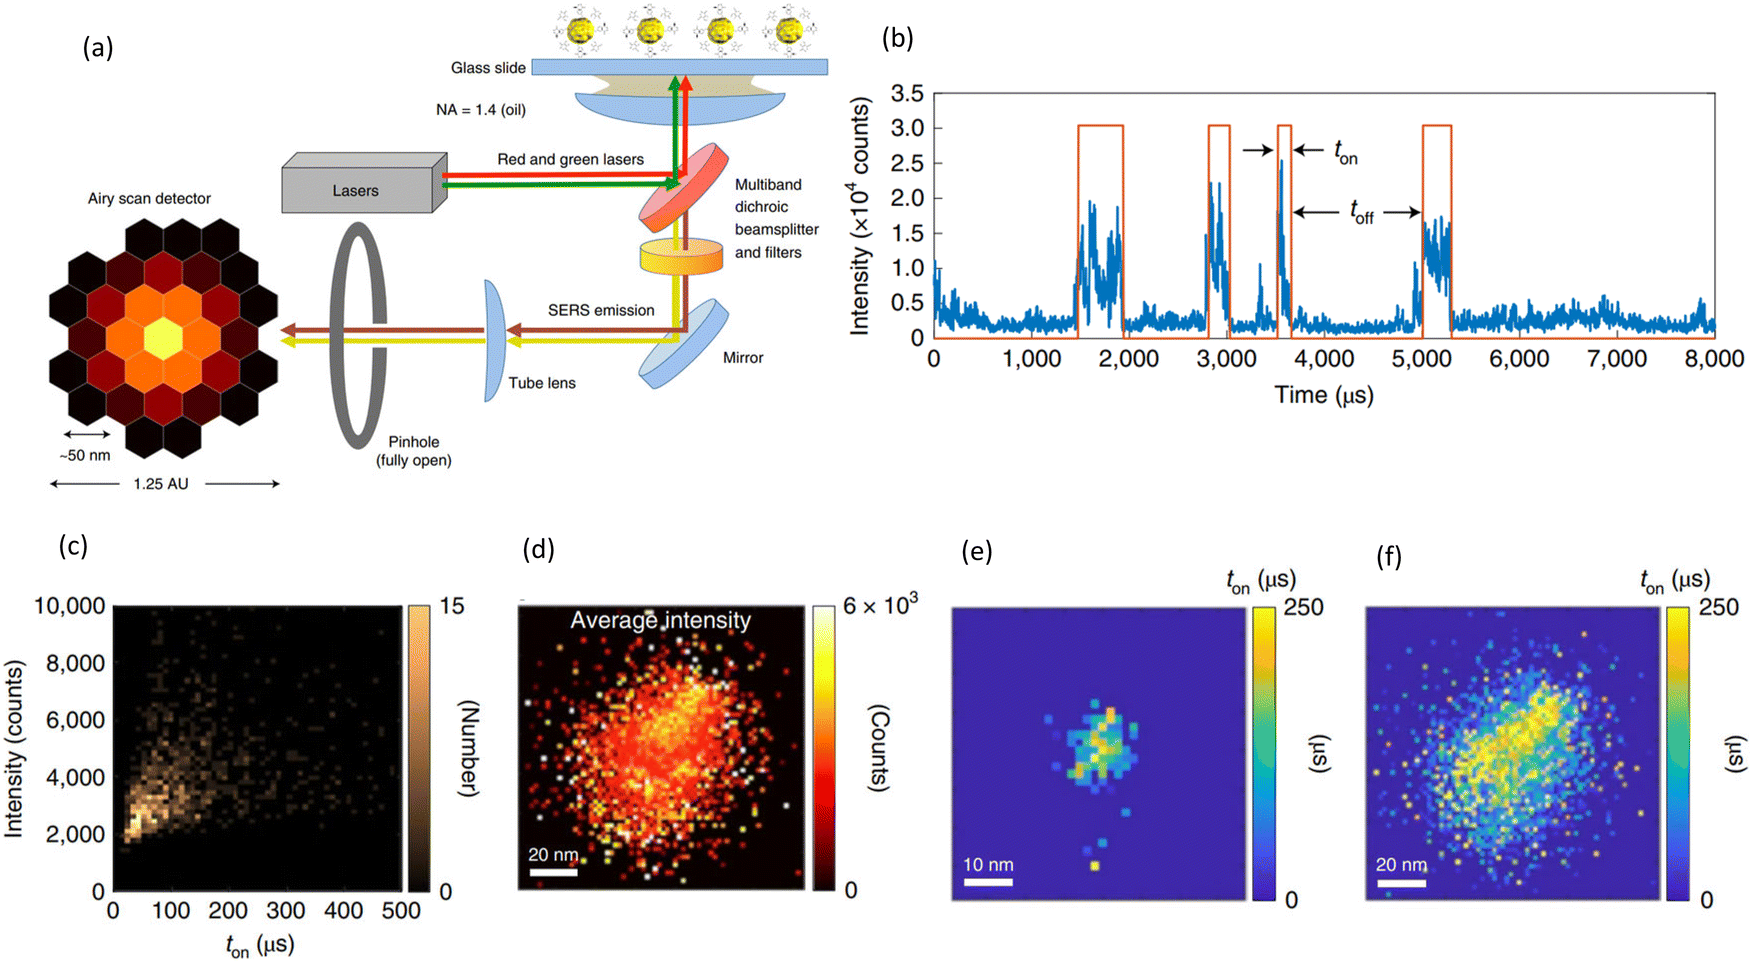 | ||
| Fig. 2 Classical high-speed imaging SERS system and single molecule SIFs. (a) Schematic illustrations of High-speed spectral acquisition system and their experimental approach. Single-molecule SIFs, covered 500 cm−1 to 2000 cm−1, (b) digitized (d-SIF, shown as a red envelope) to extract time dynamics. (c) Bivariate histogram of the same data showing the SIF intensity versus the d-SIF on time ton in microseconds. (d) An image of another nanoparticle, this time representing 11577 individual SIF events, and again showing the occurrence of SIFs all over the single particle. (e) The 32 pixels Airyscan imaging array was used to spatially map the characteristics of the nanoparticle from SM-SERS events. (f) Spatial distribution of ton for the same particle as in (d). Reproduced with permission from ref. 40. Copyright 2019 Springer Nature. | ||
Building upon this work, they further investigated the ultra-high-speed dynamics of SERS hotspots, improving the temporal resolution to 100 μs in 2020.41 This advancement allowed them to probe the sub-millisecond dynamics of SERS hotspots, revealing previously unobserved chemical and biological phenomena.42 Moreover, they found that high-speed SERS intensity fluctuations events occur with relatively equal probability across a broad spectral range, including both the Stokes and anti-Stokes regions of the SERS spectrum.
In 2023, the same group achieved ultrafast dynamic SERS measurement, collecting 100 thousand spectra per second and pushed temporal resolution to 10 μs.43 Ultimately, Cheng et al. pushed the limit of temporal resolution to 5 μs measuring 200 thousand spectra per second using a lab-built 32-channel tuned-amplifier array.44 Employing this measurement system in stimulated Raman scattering experiments the authors were able to obtain 200 thousand spectra, or measure 11000 individual particles per second using a flow cytometry set-up. Their works on ultra-high-speed SERS intensity fluctuations open new potential applications in analytical chemistry and chemical imaging. Understanding plasmon-induced fluctuations can enable ultra-low concentration quantification, while recording fluctuation frequency changes may mitigate secondary effects. Super-resolution techniques, such as STORM, can be adapted to utilize SERS intensity fluctuations for imaging dynamic events in single cells, driving further discoveries in SERS-based imaging.
De Albuquerque et al. also used SERS intensity fluctuations for dynamic SERS research. They integrated high-speed SERS imaging with super-resolution microscopy to visualize the spatial distribution and temporal evolution of SERS hotspots on single nanoparticles.45,46 This multi-modal approach allowed them to correlate the SERS intensity fluctuations with the nanoscale morphological changes of the nanoparticles, providing a deeper insight into the structure–function relationships in SERS.
Dynamic SERS related imaging techniques
The idea of dynamic SERS imaging first appeared around 2009. In 2009, Bozzini et al. used dynamic SERS imaging to study the electrodeposition of gold (Au) from a potassium gold cyanide bath, and were able to analyse the time-dependent SERS intensities of adsorbed CN−.47 In 2010, Wark et al. introduced a wide-field imaging approach for the real-time analysis of SERS-active silver nanoparticle clusters suspended in solution.48 They used a 550 nm bandpass filter to select the 1275 cm−1 Raman band of the ABT-DMOP reporter molecule and were able to take the image of the peak over time, doing so, they were able to collect sufficient signals from an integration time of 50 ms.Fast forward to the recent development of dynamic SERS imaging techniques, Lindquist et al. utilized high speed imaging to study single-molecule dynamic SERS intensity fluctuations.49 High-speed imaging was used to reveal hotspot-to-hotspot variability, suggesting that transient atomic-scale hotspot generation dominates over molecular diffusion. Dynamic SERS with ms time resolution was also used to detect nanometer-scale disorder in Au crystal lattices by detection of plasmonic flare emissions due to the formation of plasmonic pico-cavities.50
These techniques are now utilized in various applications spanning chemistry, cell biology, and other scientific fields. In cell biology, dynamic SERS can be used to achieve sensitive and multiplexed detection of drugs, intracellular pH, and reactive oxygen species in living cells with improved spatiotemporal resolution.51 For example, Koike et al. utilized 3D live-cell SERS imaging to visualize the drug uptake process with sufficient temporal resolution.52 By introducing gold nanoparticles into lysosomes and using an alkyne-tagged cathepsin B inhibitor, they achieve sensitive detection and 3D time-lapse imaging of drug localization.
Novel substrates and platforms
There are several types of new SERS substrates and platforms being developed for dynamic SERS. Nanorods,53 nanocages,54 nanopores55,56 or nanoslits57 are all novel substrates with strong enhancement factors suitable for various applications of dynamic SERS.In recent years, various nanolithography methods, including electron beam lithography, nanosphere lithography, laser interference lithography, and the emerging technique of displacement Talbot lithography and other techniques are becoming staple methods for fabricating precise SERS active nanostructures such as nanopores58 or nanoslits.57 A popular research field focuses on DNA sequencing using nanopore or nanoslit platforms. In a typical nanopore depicted in Fig. 3(a), Huang et al. used plasmonic nanopores to directly adsorb molecules onto a gold nanoparticle and then trapping the single nanoparticle in a plasmonic nanohole up to several minutes enabling single molecule detection of both DNA and protein sequence with single nucleotide or amino-acid sensitivity.55,59 In another recent study, the same authors demonstrated a simple plasmonic nanopore prepared by using nanoporous metal to achieve single molecule DNA sensing.60
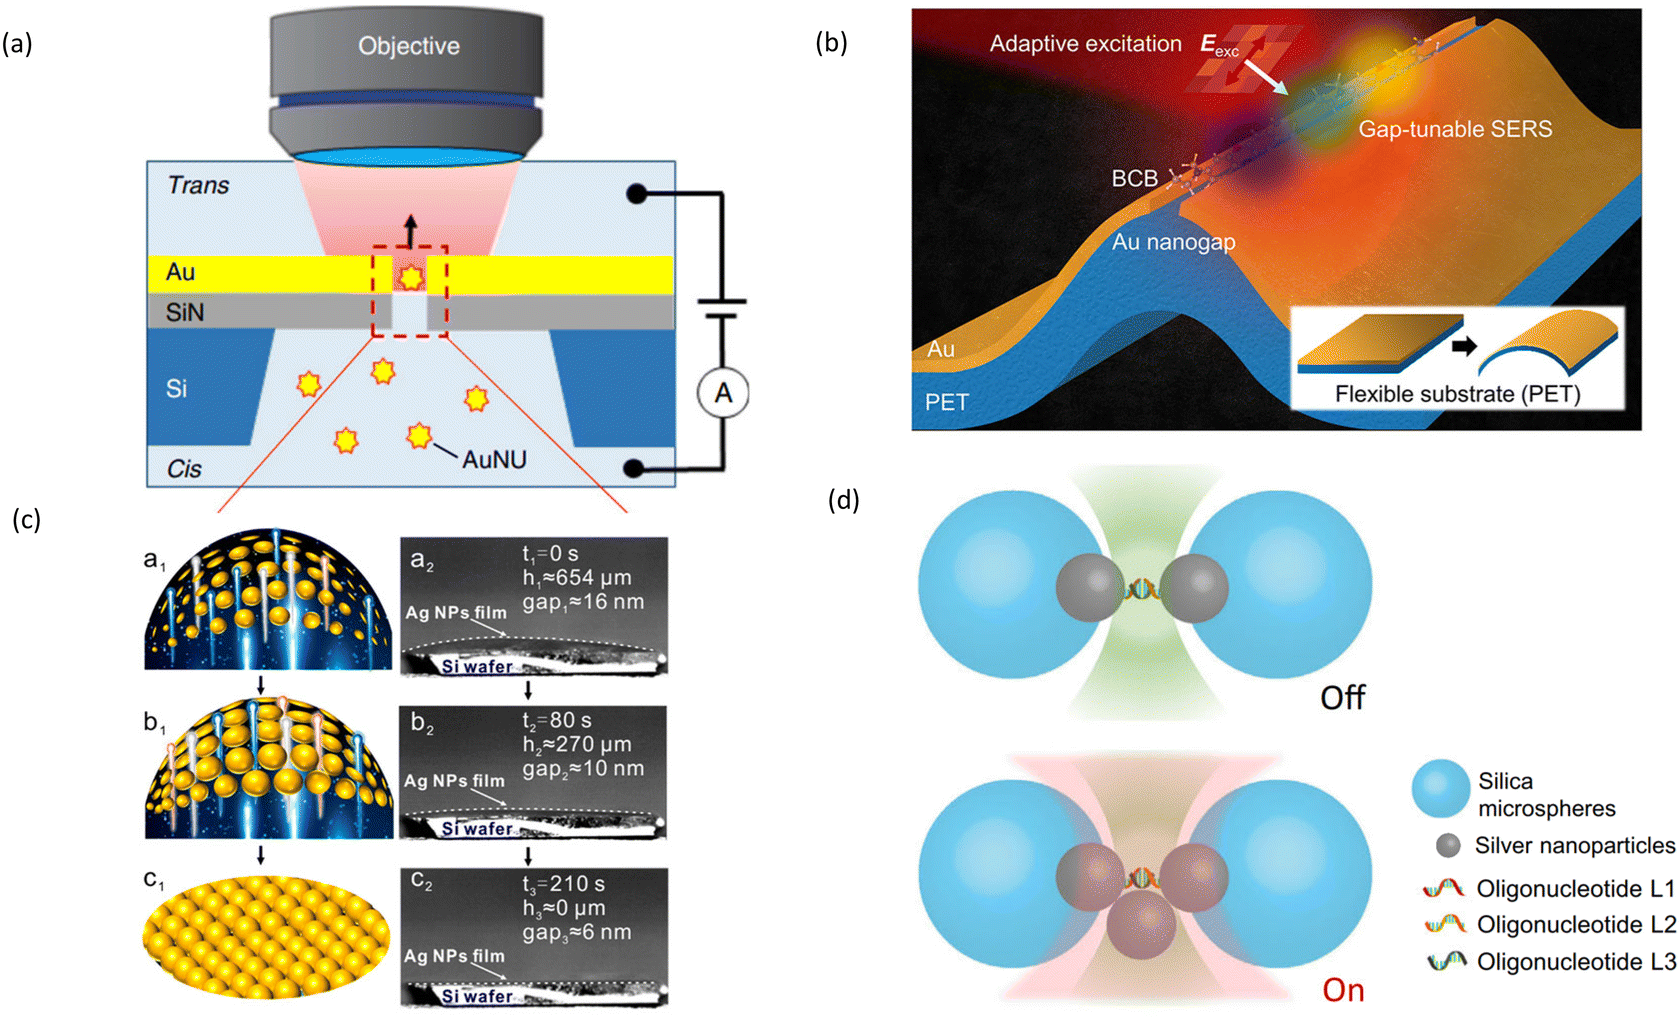 | ||
| Fig. 3 Novel substrates and platforms for dynamic SERS detection. (a) Nanopore to investigate DNA sequences. Reproduced with permission from ref. 55. Copyright 2019 Springer Nature. (b) Flexible substrate (PET). Reproduced with permission from ref. 62. Copyright 2024 American Chemical Society. (c) AgNPs-decorated Basil-seeds microgels (ABM) platform for dynamic SERS. Reproduced with permission from ref. 68. Copyright 2021 Journal of the American Chemical Society. (d) Plasmonic tweezer platform to detect protein conformation. Reproduced with permission from ref. 76. Copyright 2023 Springer Nature. | ||
Chang et al. reported the fabrication of Au nanorods on carbon-based nanomaterials as hybrid substrates for high-efficiency dynamic SERS.53 The synergistic effect of the plasmonic Au nanorods and the carbon nanomaterials resulted in enhanced Raman signals and improved stability. Fu et al. developed a high-density nanotip-composed 3D hierarchical Au/CuS hybrid for sensitive, signal-reproducible, and substrate-recyclable SERS detection.61
A new direction for plasmonic nanogap fabrication is tunable nanogaps. Moon et al. presented a gap-tunable SERS platform based on a flexible 1D Au nanogap device.62 By engineering the gap width through mechanical bending, they achieved a ∼1200 cm−1 tunability of the gap plasmon resonance, enabling selective enhancement of different molecular vibrational modes. A typical tunable nanogap structure is illustrated in Fig. 3(b). Another method for the manipulation of the gap size is the use of thermo-responsive materials.63–65 For example, Mitomo et al. arranged Au triangular nanoprisms into a 2D array on a thermoresponsive hydrogel surface.63 Further, the slits between the individual nanoparticles could be shrunk by heating the surface. The resulting hotspots were used for the detection of single proteins trapped between nanoparticles.
Photoactive materials have also been explored for dynamic SERS substrates. De la Asuncion-Nadal et al. developed photoactive Au@MoS2 micromotors for dynamic SERS sensing, leveraging the photocatalytic properties of MoS2 to enhance the SERS performance.66 On the other hand, Lu et al. utilized metal–organic frameworks (MOFs) involving UiO-66, a photoactive material, as templates to guide the electrochemical lithography of SERS substrates, resulting in high-quality, reproducible plasmonic nanostructures.67
Most of these studies presented novel substrates with hotspots that have strong enhancement. Moving analyte molecules into hotspots is another direction for enhanced sensitivity. Ge et al. constructed a nanocapillary pumping system for actively capturing target molecules in hotspots formed between nanoparticles,68Fig. 3(c) shows the schematics of initial shrinking stages of AgNPs-decorated basil-seeds microgels (ABM) and their respective SEM images. In other studies, Chen et al. and Song et al. also developed their respective systems to dynamically capture and detect pesticides in water and fruit peel, respectively.69,70
DNA represents another instrument enabling positioning analytes directly into a Raman-active hotspot. Notably, there are different ways DNA can be employed for this purpose. In the simplest approach DNA is simply modified with a specific molecule, typically a fluorophore, to position it into a hotspot. A vivid example of this approach is the creation of a hotspot between core–shell Au@Au NPs with dye-labelled DNA molecules positioned in the interface.71 Likewise, DNA can be used to create a hotspot between two plasmonic nanoparticles, positioning the studied molecule in the hotspot at the same time.72 For example, Xu et al. used this approach to create a Raman sensor for the detection of target DNA strands.73 Once a DNA strand of interest is present in a solution, it hybridizes to DNA strands on gold nanoparticles, creating a dimer and facilitating a measurement of the Raman signal of Cy3 deposited on one of the nanoparticles.
The full potential of the DNA strands is realized with the DNA origami technique. In this method, a 3D DNA-based structures with arbitrary shapes are created via folding of a long, circular plasmid with a set of short DNA strands. Due to the specificity and addressability of the DNA strands, obtained structures create a perfect platform to position both the nanoparticles and studied molecules with a nanometer precision, and thus has been used extensively for the creation of optical nanoantennas, also for SERS.73–75
Finally, there is currently a new strategy that can be combined with dynamic SERS, the plasmonic tweezer. The plasmonic tweezer can trap nanoparticles to construct real-time reversible hotspots,76 shown in Fig. 3(d). This optical plasmonic tweezer-coupled SERS platform can identify low-populated species among a background of molecules, achieving single-molecule sensitivity. This enables real-time monitoring of structural transitions in molecules.
Data analysis and machine learning algorithms
Data analysis algorithm in dynamic SERS is seeing rapid development due to (a) large quantities of spectral data produced by dynamic SERS and (b) the development of deep learning methods.77 Machine learning algorithms are also particularly useful for biomolecular detection and classification, because direct analysis of SERS spectra of biological samples is very difficult.Wang et al. presented a label-free method for characterizing native proteins using SERS and correlation coefficient-directed data analysis.78 They utilized a machine learning approach based on correlation coefficients to differentiate between different proteins and their conformational changes. This method allows for the rapid and accurate identification of proteins without the need for labelling, which is particularly useful for studying proteins in their native state.
In another study with proteins, Almehmadi et al. successfully used principal component analysis (PCA) to differentiate single molecule SERS spectra of albumin-Traut's Reagent (BSA-TR) adduct and the control glycine-Traut's Reagent (glycine-TR) adduct.79
Dong et al. demonstrated the application of dynamic SERS and support vector machines (SVM) for the detection and direct readout of drugs in human urine samples.80 They collected dynamic SERS spectra from urine samples containing different drugs and used SVM, a supervised machine learning algorithm, to classify and identify the drugs based on their spectral features. This approach enables rapid and sensitive detection of drugs in complex biological matrices, highlighting the potential of combining SERS with machine learning techniques for practical sensing applications.
Machine learning algorithms can also be used on SERS spectra of cells. For example, Fuentes et al. used Raman spectroscopy to measure tumour cell lines and used Convolutional Neural Network (CNN) to accurately classify cell lines as radiosensitive or radioresistant.81
Single molecule dynamic SERS and applications
Monitoring chemical reactions and catalysis
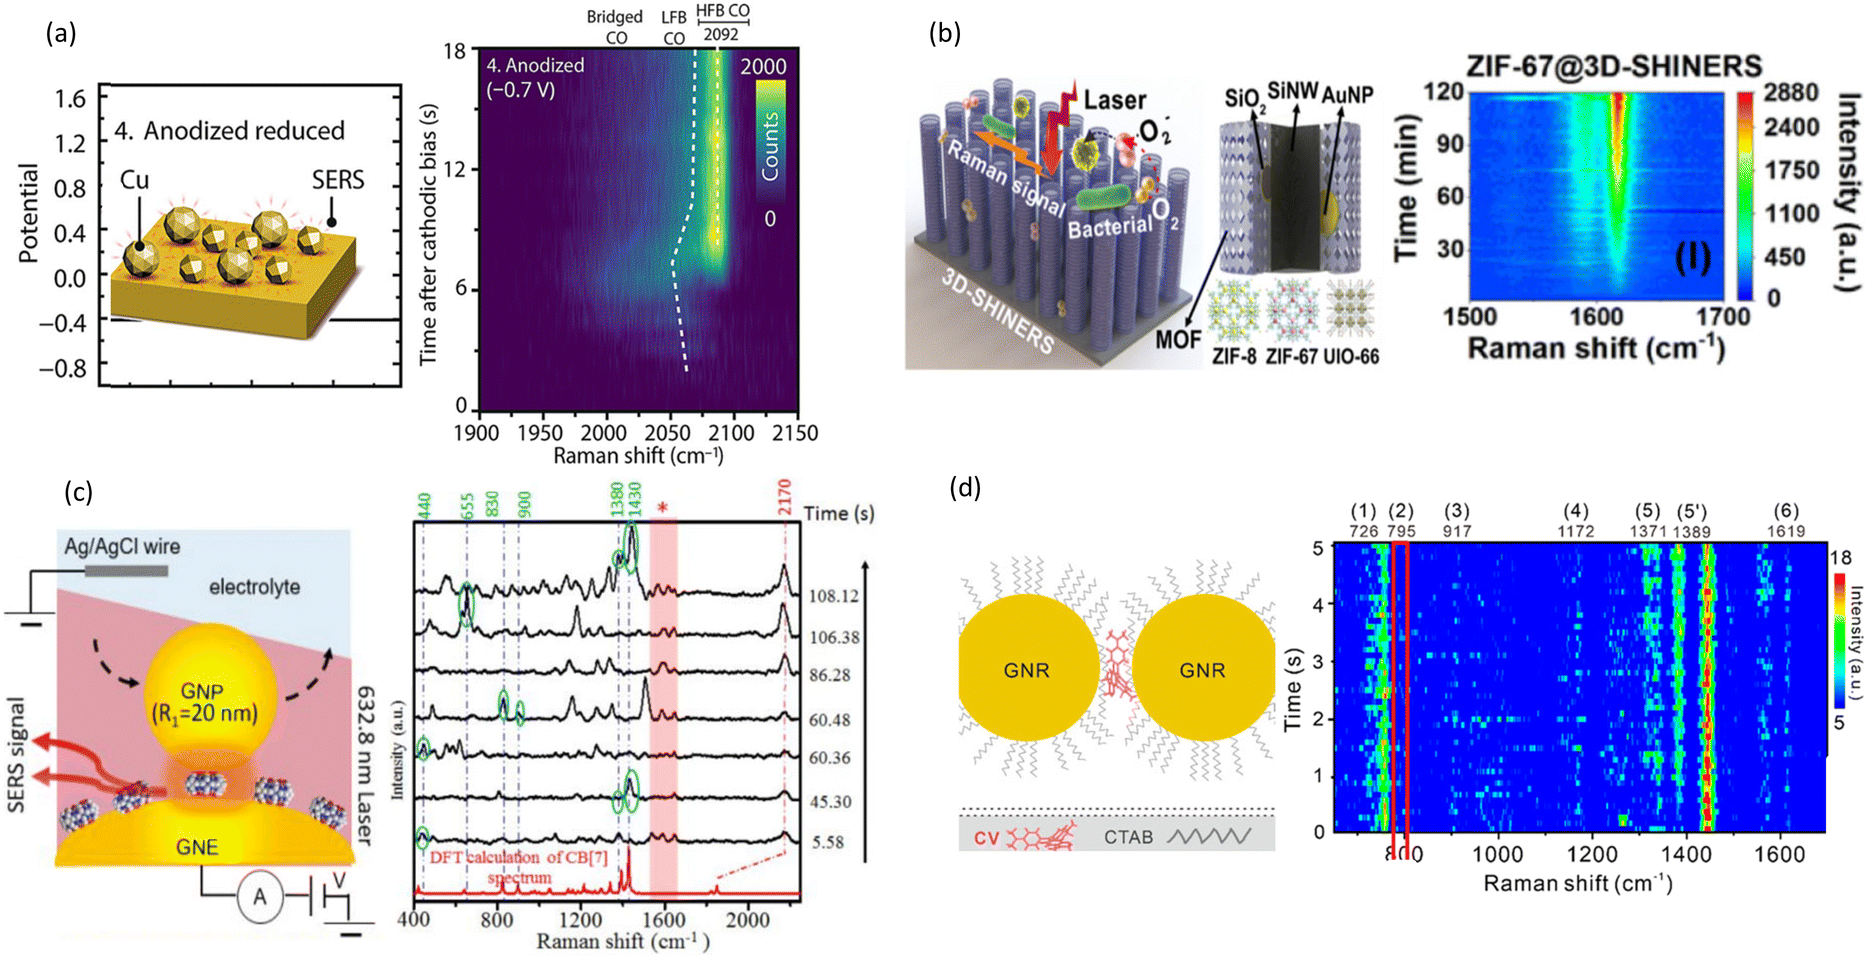
One of the most critical and impactful applications of SM dynamic SERS is to monitor chemical reactions, especially catalysis in real time.82,83 The landmark work was done by Zee Hwan Kim's group; they demonstrated that by using well-controlled plasmonic junctions and time-resolved SERS, it is possible to directly monitor the metal-catalysed chemical reactions of individual molecules in real-time, providing a powerful new tool for studying heterogeneous catalytic reactions at the single-molecule level.84 Dynamic SERS allows researchers to identify ephemeral intermediates to gain insights into reaction mechanisms and kinetics.An et al. employed sub-second time-resolved SERS to investigate the dynamic CO intermediates during electrochemical CO2 reduction on copper electrodes.85 With time-resolved SERS, they were able to reveal a highly dynamic adsorbed CO intermediate, with a characteristic vibration below 2060 cm−1 that was correlated with C–C coupling and ethylene production, as shown in Fig. 4(a).
 | ||
| Fig. 4 Dynamic SERS researching on (a) intermediates during chemical reduction, with spectral heatmap from SERS measurements showing the dynamic behaviour of corresponding reduced steps. Reproduced with permission from ref. 85. Copyright 2021 Wiley-VCH GmbH. (b) Photocatalysis. Reproduced with permission from ref. 31. Copyright 2022 American Chemical Society. (c) Charge transfer between molecular scaffolding to the nanoparticles. Reproduced with permission from ref. 87. Copyright 2020 The Royal Society of Chemistry. (d) Single molecular motion at gas/liquid interface. Reproduced with permission from ref. 88. Copyright 2023 American Chemical Society. | ||
Zoltowski et al. studied the frequency fluctuations of SERS signals during a photocatalytic reaction using a wide-field spectral imaging approach with a frame rate of 100 ms, demonstrating the formation of relevant intermediates and their dependence on nanoparticle aggregation state.86
One of the frontiers for dynamic monitoring of chemical reactions is photocatalysis. Chen et al. developed a de-Au@mTiO2 nanocage reactor, with dense shareable hot spots for in situ and dynamic SERS tracking of photocatalysis.54 In another study, Cheng et al. demonstrated in situ monitoring of dynamic photocatalysis using MOFs decorated with shell-isolated nanoparticles (SHINs).31 Using dynamic SERS, Cheng et al. compared between different MOF photocatalysts, including ZIF-67, ZIF-8, and UIO-66 and recorded real-time spectroscopic evidence of reactive oxygen species formation under sunlight irradiation. Fig. 4(b) illustrates the conversion of ROS produced by the MOF through photocatalysis into detectable Raman signals, providing a real-time SERS heatmap of the process.
Dynamic SERS can also be used to study the interaction between molecular scaffolding to the nanoparticles. Ai et al. studied the interaction between cucurbit[7]uril (CB[7]) and gold nanoparticles(GNPs), and were able to observe selective enhancement of normally weak vibrational modes of the CB[7] molecule.87Fig. 4(c) shows a time-resolved SERS trajectory exhibiting blinking signals that were recorded ∼60 min after adding GNPs with a +0.5 V bias. Results show the dynamics of transiently formed CB[7] plasmonic molecular junctions.
In recent years, another important field in chemical research has been the analysis of interface between liquids, liquid/gas or liquid/solid, and dynamic SERS is often suitable for this because of low water background. For example, Yan et al. developed a novel SERS platform capable of monitoring single molecules in real-time at the liquid/gas interface for extended periods,88 as illustrated in Fig. 4(d). By combining millisecond dynamic SERS with DFT calculations, the authors captured the orientation of individual CV molecules moving within the sub-nanometer space, accomplishing real time molecular orientation monitoring.
Single molecule detection and sensing
Dynamic detection and sensing of single molecules is also an important avenue of SM dynamic SERS. Changes in biomarkers can often indicate diseases, drug effects or health changes, and the ability to detect such changes in real time could help future diagnosis of diseases or drug development immensely.In 2020, Zong et al. were able to detect single R6G molecules with 50 ms temporal resolution, and captured the transient neutral R6G0 state of R6G on AgNPs.33 Li et al. developed a digital nanopillar SERS platform for ultrasensitive multiplex cytokine analysis.89 This platform can be used to predict and monitor immune-related adverse events (irAEs) in cancer immunotherapy. Their assay enables single cytokine counting down to attomolar levels, and the platform demonstrated its capability to longitudinally monitor cytokine levels and predict severe immune-related adverse event risk in a pilot cohort of melanoma patients.
Dynamic SERS detection can also be used in environmental monitoring; Guo et al. presented a rotary micromotor-sensor system that accelerates the enrichment and detection of DNA molecules. The microsensors are composed of diatom frustules adorned with AgNPs, and can reach an enhancement factor of 109 to 1010. This system is used to monitor the presence of single DNA molecules in water samples.90
Nanopores are also used for the detection and sensing of a single molecule or of its orientation, electronic state, and oxygenation states. Using a sub-10 nm conical gold nanopore, Zhou et al. were able to probe multidimensional structural information of single molecules while they were translocated through the nanopores.91 As shown in Fig. 5(d), they fabricated a sub-10 nm conical gold nanopore at the tip of a quartz nanopipette. This plasmonic nanopore allowed them to probe single molecules translocation through the nanopore using dynamic SERS detection. For small rhodamine 6G (R6G) molecules, the SERS spectra varied based on the orientation of the molecules during transport. New peaks and peak shifts were observed, likely due to charge transfer interactions between R6G and the gold surface in different orientations, as shown in Fig. 5(a), (b), and (c). For single hemoglobin (Hb) proteins, as shown in Fig. 5(e) and (f), the SERS spectra could distinguish the orientation of the porphyrin ring (vertical vs. parallel) as well as the oxygenated vs. deoxygenated states of Hb as it passed through the nanopore.
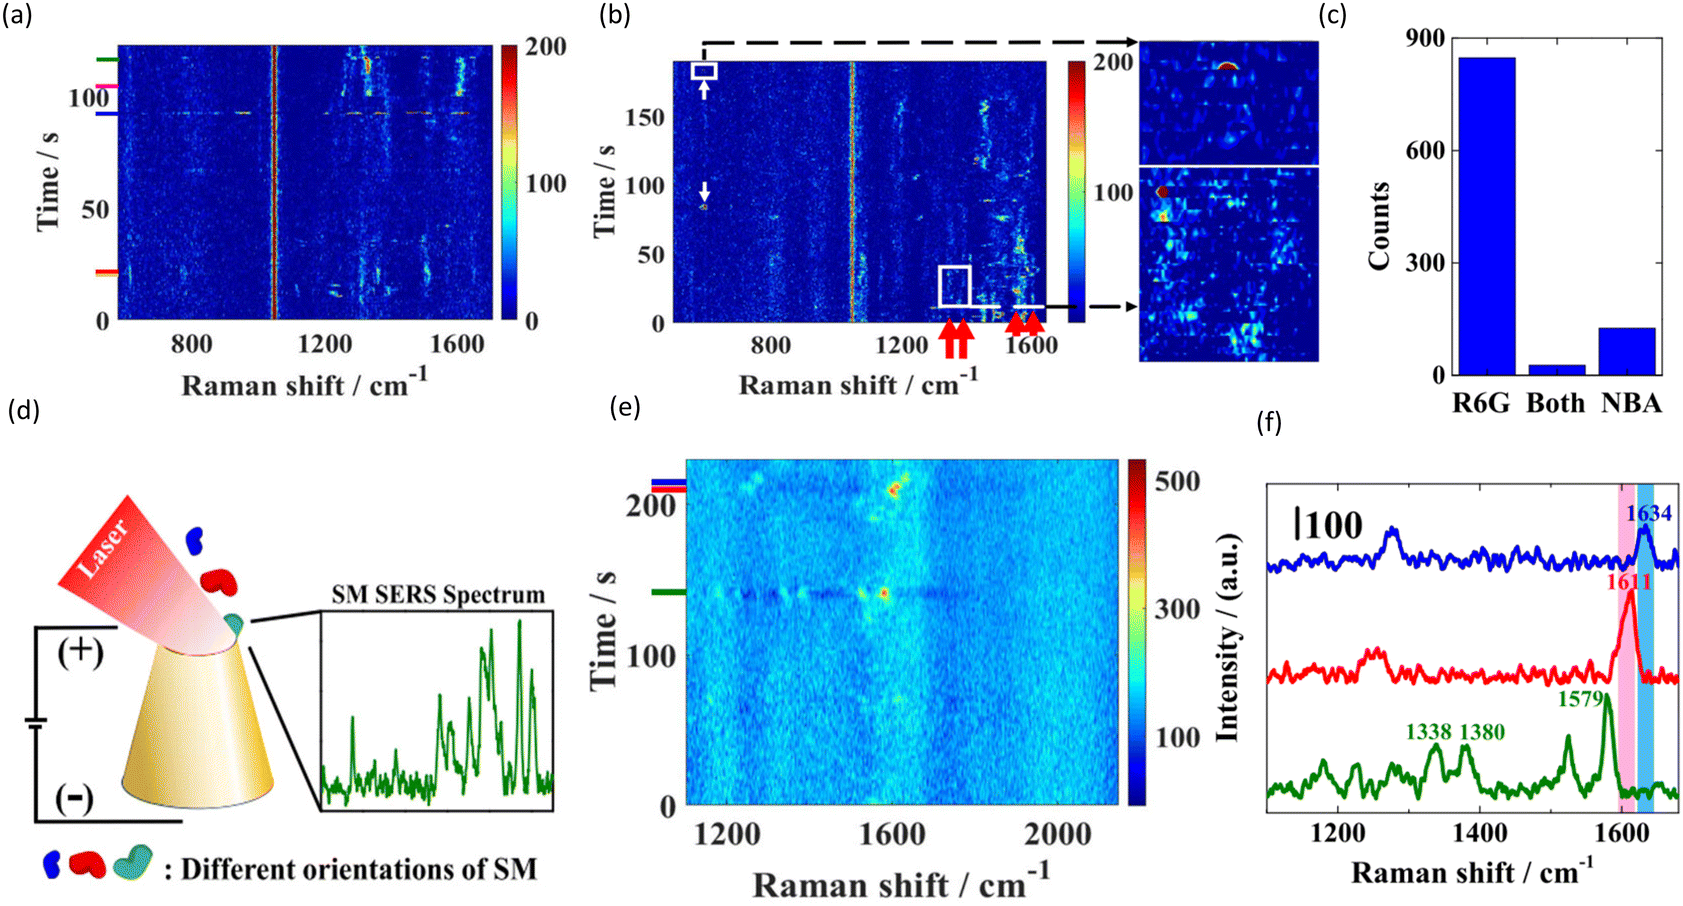 | ||
| Fig. 5 (a and b) Contour graphs of Raman spectra of 10−9 M R6G, the mixture of 10−9 M R6G and 10−9 M NBA under −300 mV with a 0.3 s exposure time respectively. (c) Bi-analyte SERS distribution of R6G and NBA. (d) Conjoint SERS–plasmonic nanopore setup. (e) Contour Raman spectra of 10−9 M Hb in a 1 M LiNO3 (pH 6.6) solution under −300 mV with a 2 s exposure time. The SERS spectra shown in (f) are labeled by short lines with corresponding colors. (f) The SERS spectra extracted from (e) at the time 114, 209, and 211 s, respectively. Reproduced with permission from ref. 91. Copyright 2021 American Chemical Society. | ||
Described methods enable a single molecule detection and sensing, however they lack a control over the position of the analyte in space. Detection is therefore based solely on measurements of molecules randomly passing through the hotspot area or deposited at different locations on the Raman-active surface. First, it extends the measuring time until the passing molecule is observed. Secondly, this can result in large differences in signal intensity for molecules oriented in different hotspot areas.92 Finally, if a molecule passes through a hotspot or easily detaches from a surface, the available measurement time may be too short to observe the dynamic processes of the molecules under investigation.
This problem can be solved using the already introduced DNA origami technique. As explained before, with this method, it is not only easy to create a plasmonic hotspot, but also to precisely place the molecule of interest within it. For this reason, the DNA origami technique has been extensively employed for single-molecule measurements.75 Vibrant example of the use of DNA origami for the SM measurements is the detection of a single protein.93–95 For example, the detection of a single streptavidin and thrombin protein was realized by placing them between gold nanowires using biotin or an aptamer and measuring the Raman signal over time.94 In another example a single cytochrome C protein was monitored over time and spectral shifts of the Amide III band indicated conformational changes of the protein within the hot spot.96 Furthermore, the catalytic cycle of a single horseradish peroxidase (HRP) enzyme was monitored over time using dynamic SERS and DNA origami nanostructures.97
The ability to detect and characterize single molecules using nanopores and DNA origami techniques has opened new possibilities for studying molecular orientation and sequencing at the single-molecule level. With the help of trapping tools such as nanopores or plasmonic traps, studying biomolecular interactions and conformational dynamics are becoming a frontier for dynamic SERS. These tools also enable researchers to perform dynamic SERS sequencing of nucleic acids and proteins. In fact, Zhou et al.'s work91 laid the foundations for their future work of protein sequencing. These applications will be discussed in the following sections.
Biomolecular interactions and conformational dynamics
As previously mentioned, SM dynamic SERS has significant applications for investigating biomolecular interactions. Plasmonic traps, molecular binding, or nanopores are often used to trap single biomolecules for SM dynamic SERS. Many of the studies on conformational dynamics are applied to proteins, peptides or even individual amino acids while some are done on DNA or RNA as well. Plasmonic tweezers are often combined with fluorescence to study biomolecular interaction;98 however, molecules or structures, such as adenine or protein tertiary structures, can be studied using SERS as well.Huang's group at HKUST pioneered the work of combining SERS with optical tweezers for single biomolecular assays. In 2023, they demonstrated the use of an efficient optical plasmonic tweezer-controlled SERS platform for the characterization of pH-dependent amylin species in aqueous milieus.76 As shown in Fig. 6(a), by optically trapping an AgNP at the plasmonic junction between two AgNP-coated silica microbeads, they created a dynamic nanocavity that acquired Raman spectra, which provides information on the distribution of protein tertiary structures in real time. This allowed them to characterize the pH-dependent conformational changes of amylin in real time. Mostafa et al. also used AuNP dimers to study protein conformational changes, and observed the oxidation and conformational change processes of cytochrome C.96 In addition, they also studied the reactivity of N-methyl-4-sulfanylbenzamide (NMSB) at nanocavities of gold and silver nanoparticle aggregates under plasmonic excitation to gain understanding of the respective reaction mechanism.82 The relevant results are shown in Fig. 6(b) and (c), respectively.
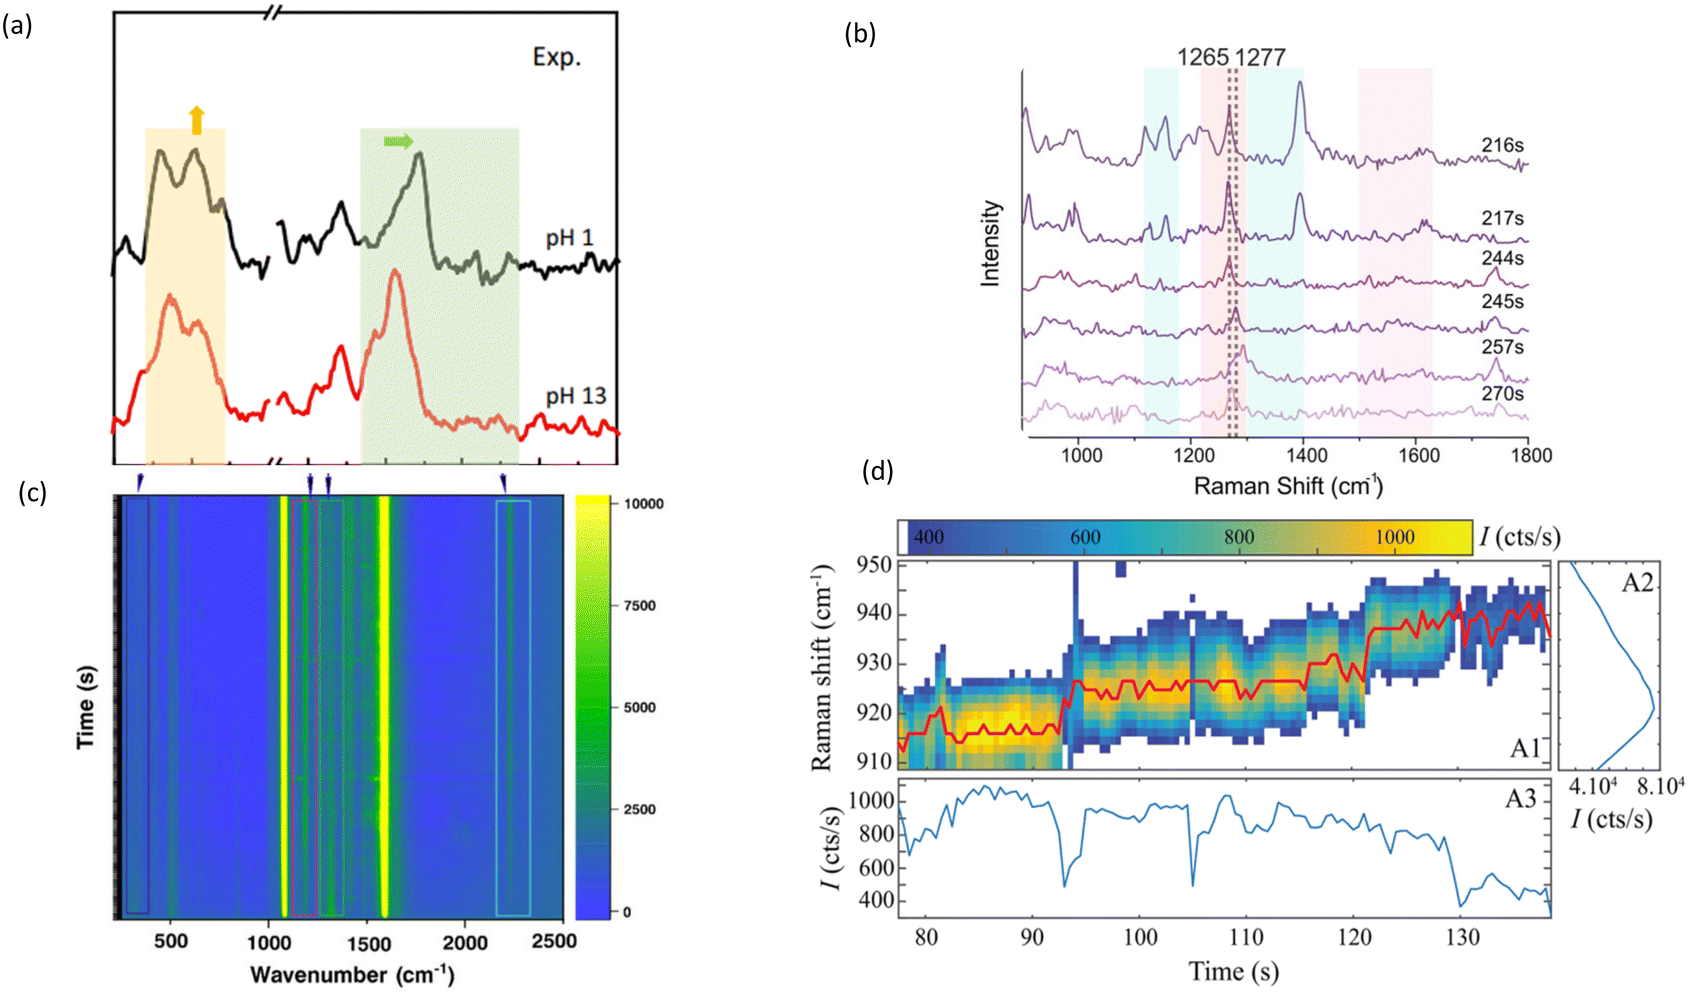 | ||
| Fig. 6 Dynamic interaction or conformation of molecule. (a) SERS spectra of Tyr at pH 1.0 (black) and pH 13.0 (red), respectively. Reproduced with permission from ref. 76. Copyright 2023 Springer Nature. (b) SERS spectra showing different time points from a single DONA measurement, highlighting the shift of the Amide III band (blue zones highlight heme unit peaks, the red zone indicates peptide backbone peaks, and the purple zone shows spectral contributions from both). Reproduced with permission from ref. 96. Copyright 2024 Springer Nature. (c) Time-series SERS map recorded for 100 s under 633 nm laser excitation showing the transformation of NMSB molecule. Reproduced with permission from ref. 82. Copyright 2024 American Chemical Society. (d) Surface enhanced Raman chromatograms of three specific Raman lines of Trp in the single molecule regime. Reproduced with permission from ref. 99. Copyright 2019 American Chemical Society. | ||
Wang et al. developed a method to characterize protein “nativeness” using dynamic SERS.78 With 3D physiological hotspots formed with iodide-modified gold nanoparticles, they were able to quantify the degree of protein denaturation caused by various ions. This suggests that using dynamic SERS to observe changes in protein conformations induced by external factors is promising.
Leray et al. also used dynamic SERS to resolve conformational changes and charge transfer in the amino acid tryptophan (Trp) at the single-molecule level.99 As shown in Fig. 6(d), they were able to discern the conformational changes by analysing the auto- and cross-correlation functions of specific Raman bands.
For DNA conformational changes, Feng et al. designed a SERS-based molecular ruler to directly monitor the conformational changes of single DNA aptamers in real-time.100 They designed a core-satellite plasmonic nanostructure where the ∼20 nm AuNP satellites are connected to the ∼100 nm core AuNP via a single DNA aptamer. Upon binding to its target, the aptamer undergoes a conformational change, bringing the satellite closer to the core. This results in a stepwise enhancement in the SERS signal intensity due to increased plasmonic coupling, and the authors were able to track the dynamic folding processes in real time.
Nucleic acid and protein sequencing and structural assays
Dynamic SERS can be combined with nanopores and nanoslit structures to study nucleic acids. By using a nanopore-based SERS platform, Huang et al. were able to detect the translocation of individual nucleic acid molecules through the nanopore in real-time, as shown in Fig. 7(a), while simultaneously obtaining sequence-specific SERS signals.55,59,101 To achieve it, they used a plasmonic platform that enables the electro-plasmonic trapping of individual Au nanoparticles. This effect generated a nanocavity between the particle and the nanopore, creating a giant field localized within few nanometers. Other groups, such as Chen et al., also achieved dynamic detection of single nucleobase using nanopore or nanoslit based SERS platforms.57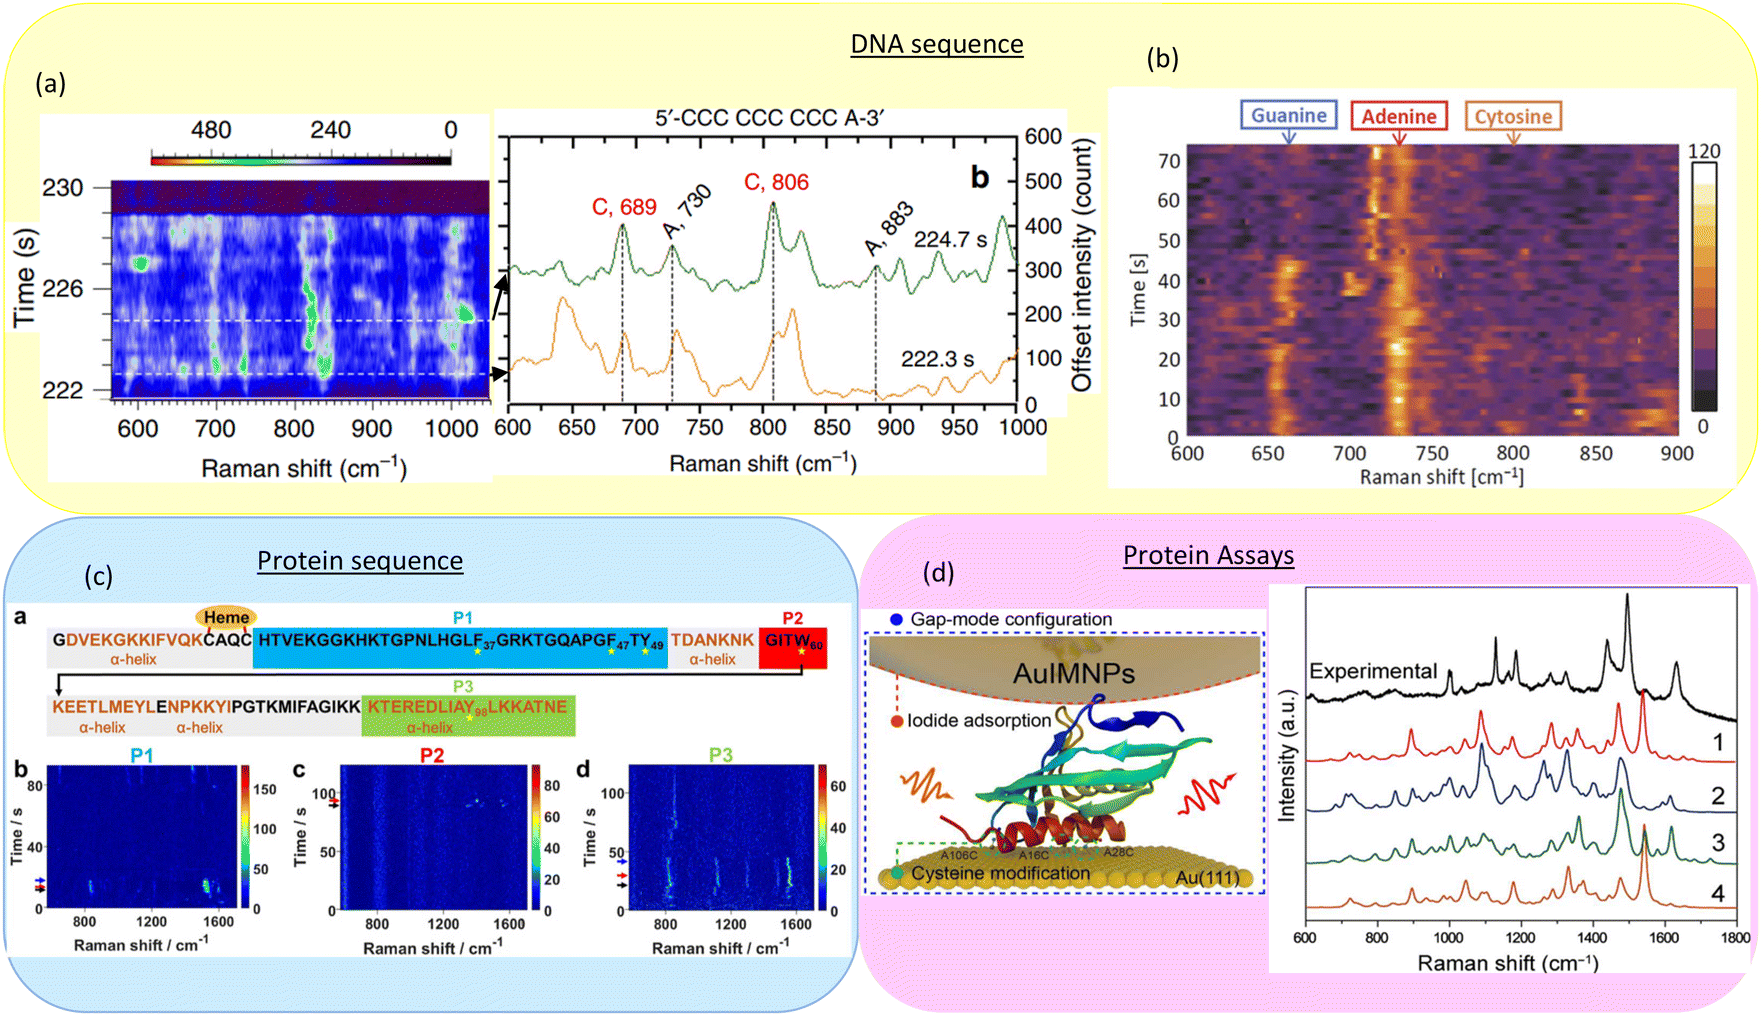 | ||
| Fig. 7 Sequences or structural assays detection with time-dependent SERS spectra. (a) DNA sequence detection by nanopore. Reproduced with permission of ref. 55. Copyright 2019 Springer Nature. (b) DNA sequence research from a gold nanoparticle dimer. Reproduced with permission of ref. 102. Copyright 2022 Optica Publishing Group. (c) Investigated on protein sequence by a plasmonic structure. Reproduced with permission of ref. 56. Copyright 2023 American Chemical Society. (d) Rapidly determining the 3D structure of protein assays. Reproduced with permission of ref. 103. Copyright 2023 American Association for the Advancement of Science. | ||
Sugano et al. also demonstrated the dynamic SERS detection of a single DNA oligomer using a single AuNP dimer.102 By controlling the position and orientation of the AuNP dimer, they ensured a single hotspot in the laser spot. The Raman peaks of DNA components, including nucleobases and the backbone, were dynamically observed over time. The DNA sequence with time-dependent SERS spectra is shown in Fig. 7(b).
Nanopores can also be used to study and sequence proteins. Zhou et al. used a plasmonic nanopore for protein sequencing.56 As illustrated in Fig. 7(c), by applying high bias voltages, single cytochrome c proteins were unfolded and sequentially translocated through a gold nanopore. Characteristic SERS spectra of specific amino acids were recorded as different protein segments passed through the SERS hotspot, making it possible to use dynamic SERS to sequence proteins.
Advancements in plasmonic nanocavities not only enables SERS based DNA or protein sequencing, but also accelerate the development of SERS based protein structural assays. As seen in Fig. 7(d), In 2023, Ma et al. used a nanoparticle-on-mirror (NPoM) setup with a deciphering strategy called SPARC to accurately reconstruct protein structures based on SERS signals in seconds.103 The development of such methods could lead to the development of dynamic structural analysis of interfacial proteins in their native environments.
Discussion, challenges and future directions
One of the main challenges of single molecule dynamic SERS is its repeatability and reliability.104 Many factors could contribute to the reliability and repeatability of dynamic SERS, such as substrate design, sample preparation, control of measurement conditions, and data analysis. Reproducibility and uniformity of SERS substrates is one of the problems that contribute to the less-than-ideal repeatability of dynamic SERS.105,106 Further research into standardized protocols and robust data analysis methods may help overcome these limitations.Complex environments may also hinder the application of dynamic SERS in situ, and dynamic SERS measurements in vivo are even more difficult. While there are some studies that achieved in situ single molecule SERS, such as the works of Li et al. and Yang et al., studies about in situ single molecule dynamic SERS are rare.107,108
While there are already studies that combined dynamic SERS with other cutting-edge technologies such as plasmonic trapping or nanopores, other frontier plasmonic technologies may also be combined with dynamic SERS to great effect.
Metasurfaces, for example, could be combined with dynamic SERS.109 Martins et al. combined metasurfaces with ultrafast low field-of-view (FoV) deflectors to achieve high frame rates (kHz) and a large FoV for LiDAR, which has potential use in dynamic SERS.
The development of UV SERS also holds promise.110 UV SERS presents several promising advantages, such as increased scattering intensity, higher spatial resolution, resonance enhancement for organic, biological, and semiconductor analytes. However, further development of enhancement substrates is required for single molecule dynamic SERS in UV ranges; currently, aluminium nanostructures are the best-performing substrates, while future substrates may push the sensitivity to single molecule level.111–113
The future of dynamic SERS is promising, with ongoing advancements in SERS substrates, instrumentation, and data analysis techniques. Key future research fields are improved sensitivity, temporal resolution and data processing techniques. Higher temporal and spatial resolution are essential for dynamic SERS studies. Fig. 8 illustrates the progress in temporal resolution of dynamic SERS over time. The temporal resolution has improved from milliseconds to microseconds, reaching <10 μs in 2019–2023. These improvements can be realized by developing rapid signal detectors for better temporal response114,115 and implementing super-resolution imaging techniques for enhanced spatial resolution.116 Also combining dynamic SERS with developing plasmonic nanotechnology, including nanopores and plasmonic tweezers may also open new avenues for single molecule assays. Finally, future research in stability and repeatability may improve the application of dynamic SERS both in situ and potentially in vivo.
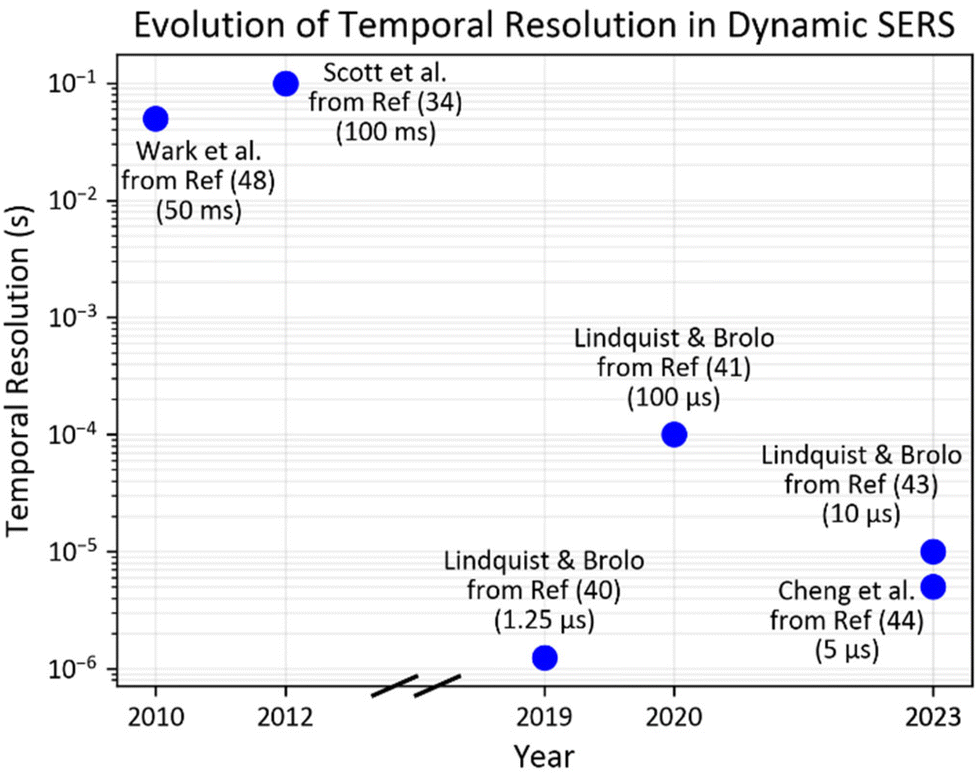 | ||
| Fig. 8 The evolution of temporal resolution in Dynamic SERS. | ||
Data availability
No primary research results, software or code have been included and no new data were generated or analysed as part of this review.Conflicts of interest
There are no conflicts to declare.Acknowledgements
The authors acknowledge financial support from National Natural Science Foundation of China, Grant No. 22202167 and National Key Research and Development Project of China, Grant No. 2023YFF0613603. We also thanks the European Union under the Horizon-MSCA-DN-2022: DYNAMO, grant agreement 101072818.References
- P. J. Hendra and P. M. Stratton, Laser-Raman spectroscopy, Chem. Rev., 1969, 69(3), 325–344 CrossRef CAS.
- C. V. Raman and K. S. Krishnan, A New Type of Secondary Radiation, Nature, 1928, 121(3048), 501–502 CrossRef CAS.
- M. Pastorczak, M. Kozanecki and J. Ulanski, Raman Resonance Effect in Liquid Water, J. Phys. Chem. A, 2008, 112(43), 10705–10707 CrossRef CAS PubMed.
- G. R. Medders and F. Paesani, Infrared and Raman Spectroscopy of Liquid Water through “First-Principles” Many-Body Molecular Dynamics, J. Chem. Theory Comput., 2015, 11(3), 1145–1154 CrossRef CAS PubMed.
- M. Fleischmann, P. J. Hendra and A. J. McQuillan, Raman spectra of pyridine adsorbed at a silver electrode, Chem. Phys. Lett., 1974, 26(2), 163–166 CrossRef CAS.
- D. L. Jeanmaire and R. P. Van Duyne, Surface raman spectroelectrochemistry: Part I. Heterocyclic, aromatic, and aliphatic amines adsorbed on the anodized silver electrode, J. Electroanal. Chem. Interfacial Electrochem., 1977, 84(1), 1–20 CrossRef CAS.
- S. Nie and S. R. Emory, Probing Single Molecules and Single Nanoparticles by Surface-Enhanced Raman Scattering, Science, 1997, 275(5303), 1102–1106 CrossRef CAS PubMed.
- A. I. Perez-Jimenez, D. Lyu, Z. Lu, G. Liu and B. Ren, Surface-enhanced Raman spectroscopy: benefits, trade-offs and future developments, Chem. Sci., 2020, 11(18), 4563–4577 RSC.
- J. Langer, D. Jimenez de Aberasturi, J. Aizpurua, R. A. Alvarez-Puebla, B. Auguie and J. J. Baumberg, et al., Present and Future of Surface-Enhanced Raman Scattering, ACS Nano, 2020, 14(1), 28–117 CrossRef CAS PubMed.
- X. X. Han, R. S. Rodriguez, C. L. Haynes, Y. Ozaki and B. Zhao, Surface-enhanced Raman spectroscopy, Nat. Rev. Methods Primers, 2021, 1(1), 87 CrossRef CAS.
- K. Kneipp, Y. Wang, H. Kneipp, L. T. Perelman, I. Itzkan and R. R. Dasari, et al., Single molecule detection using surface-enhanced Raman scattering (SERS), Phys. Rev. Lett., 1997, 78(9), 1667 CrossRef CAS.
- <2019_Acsnano_Present and future of SERS.pdf>.
- A. B. Zrimsek, N. Chiang, M. Mattei, S. Zaleski, M. O. McAnally and C. T. Chapman, et al., Single-Molecule Chemistry with Surface- and Tip-Enhanced Raman Spectroscopy, Chem. Rev., 2017, 117(11), 7583–7613 CrossRef CAS.
- S. Lee, Nanoparticle-on-mirror cavity: a historical view across nanophotonics and nanochemistry, J. Korean Phys. Soc., 2022, 81(6), 502–509 CrossRef.
- Y. Zou, L. Jiang, T. Zhai, T. You, X. Jing and R. Liu, et al., Surface-enhanced Raman scattering by hierarchical CuS microflowers: Charge transfer and electromagnetic enhancement, J. Alloys Compd., 2021, 865, 158919 CrossRef CAS.
- T. Itoh, M. Prochazka, Z. C. Dong, W. Ji, Y. S. Yamamoto and Y. Zhang, et al., Toward a New Era of SERS and TERS at the Nanometer Scale: From Fundamentals to Innovative Applications, Chem. Rev., 2023, 123(4), 1552–1634 CrossRef CAS PubMed.
- X. Bi, D. M. Czajkowsky, Z. Shao and J. Ye, Digital colloid-enhanced Raman spectroscopy by single-molecule counting, Nature, 2024, 628(8009), 771–775 CrossRef CAS PubMed.
- E. Nogales and J. Mahamid, Bridging structural and cell biology with cryo-electron microscopy, Nature, 2024, 628(8006), 47–56 CrossRef CAS.
- J. Stuckner, T. Shimizu, K. Harano, E. Nakamura and M. Murayama, Ultra-Fast Electron Microscopic Imaging of Single Molecules With a Direct Electron Detection Camera and Noise Reduction, Microsc. Microanal., 2020, 26(4), 667–675 CrossRef CAS PubMed.
- M. Di Antonio, A. Ponjavic, A. Radzevičius, R. T. Ranasinghe, M. Catalano and X. Zhang, et al., Single-molecule visualization of DNA G-quadruplex formation in live cells, Nat. Chem., 2020, 12(9), 832–837 CrossRef CAS PubMed.
- G. W. Gomes, M. Krzeminski, A. Namini, E. W. Martin, T. Mittag and T. Head-Gordon, et al., Conformational Ensembles of an Intrinsically Disordered Protein Consistent with NMR, SAXS, and Single-Molecule FRET, J. Am. Chem. Soc., 2020, 142(37), 15697–15710 CrossRef CAS.
- G. Vicidomini, P. Bianchini and A. Diaspro, STED super-resolved microscopy, Nat. Methods, 2018, 15(3), 173–182 CrossRef CAS.
- E. M. Kudalkar, T. N. Davis and C. L. Asbury, Single-Molecule Total Internal Reflection Fluorescence Microscopy, Cold Spring Harbor Protoc., 2016, 5, pdb top077800 CrossRef PubMed.
- J. Xu, H. Ma and Y. Liu, Stochastic Optical Reconstruction Microscopy (STORM), Curr. Protoc. Cytom., 2017, 81, 12 Search PubMed.
- K. Ge, Y. Hu and G. Li, Recent Progress on Solid Substrates for Surface-Enhanced Raman Spectroscopy Analysis, Biosensors, 2022, 12(11), 941 CrossRef CAS PubMed.
- X. Cao, S. Chen, W. Li, J. Li, L. Bi and H. Shi, One-step synthesis of highly-branched gold nanostructures and its application in fabrication of SERS-active substrates, AIP Adv., 2018, 8(10), 105133 CrossRef.
- R. Shi, X. Liu and Y. Ying, Facing Challenges in Real-Life Application of Surface-Enhanced Raman Scattering: Design and Nanofabrication of Surface-Enhanced Raman Scattering Substrates for Rapid Field Test of Food Contaminants, J. Agric. Food Chem., 2018, 66(26), 6525–6543 CrossRef CAS PubMed.
- K. Srivastava, H. Le-The, J. J. A. Lozeman, A. van den Berg, W. van der Stam and M. Odijk, Prospects of nano-lithographic tools for the fabrication of surface-enhanced Raman spectroscopy (SERS) substrates, Micro Nano Eng., 2024, 23, 100267 CrossRef CAS.
- X. Miao, L. Yan, Y. Wu and P. Q. Liu, High-sensitivity nanophotonic sensors with passive trapping of analyte molecules in hot spots, Light: Sci. Appl., 2021, 10(1), 5 CrossRef CAS.
- L. Wu, W. Wang, W. Zhang, H. Su, Q. Liu and J. Gu, et al., Highly sensitive, reproducible and uniform SERS substrates with a high density of three-dimensionally distributed hotspots: gyroid-structured Au periodic metallic materials, NPG Asia Mater., 2018, 10(1), e462 CrossRef CAS.
- J. Cheng, H. Cao, Y. Xu, Y. Yang, Y. He and H. Wang, In Situ Monitoring of Dynamic Photocatalysis of Metal-Organic Frameworks by Three-Dimensional Shell-Isolated Nanoparticle-Enhanced Raman Spectroscopy, Anal. Chem., 2022, 94(14), 5699–5706 CrossRef CAS PubMed.
- S. Bai and K. Sugioka, Emerging Strategies in Surface-Enhanced Raman Scattering (SERS) for Single-Molecule Detection and Biomedical Applications, Biomed. Mater. & Devices, 2022, 1(2), 739–750 Search PubMed.
- C. Zong, C. J. Chen, X. Wang, P. Hu, G. K. Liu and B. Ren, Single-Molecule Level Rare Events Revealed by Dynamic Surface-Enhanced Raman Spectroscopy, Anal. Chem., 2020, 92(24), 15806–15810 CrossRef CAS.
- B. L. Scott and K. T. Carron, Dynamic surface enhanced Raman spectroscopy (SERS): extracting SERS from normal Raman scattering, Anal. Chem., 2012, 84(20), 8448–8451 CrossRef CAS.
- R. Zhang, Y. Zhang, Z. C. Dong, S. Jiang, C. Zhang and L. G. Chen, et al., Chemical mapping of a single molecule by plasmon-enhanced Raman scattering, Nature, 2013, 498(7452), 82–86 CrossRef CAS.
- P. Etchegoin, H. Liem, R. C. Maher, L. F. Cohen, R. J. C. Brown and M. J. T. Milton, et al., Observation of dynamic oxygen release in hemoglobin using surface enhanced Raman scattering, Chem. Phys. Lett., 2003, 367(1), 223–229 CrossRef CAS.
- X. Yan, P. Li, B. Zhou, X. Tang, X. Li and S. Weng, et al., Optimal Hotspots of Dynamic Surfaced-Enhanced Raman Spectroscopy for Drugs Quantitative Detection, Anal. Chem., 2017, 89(9), 4875–4881 CrossRef CAS PubMed.
- C. T. Ertsgaard, R. M. McKoskey, I. S. Rich and N. C. Lindquist, Dynamic placement of plasmonic hotspots for super-resolution surface-enhanced Raman scattering, ACS Nano, 2014, 8(10), 10941–10946 CrossRef CAS.
- T. Brulé, A. Bouhelier, H. Yockell-Lelièvre, J.-E. Clément, A. Leray and A. Dereux, et al., Statistical and Fourier Analysis for In-line Concentration Sensitivity in Single Molecule Dynamic-SERS, ACS Photonics, 2015, 2(9), 1266–1271 CrossRef.
- N. C. Lindquist, C. D. L. de Albuquerque, R. G. Sobral-Filho, I. Paci and A. G. Brolo, High-speed imaging of surface-enhanced Raman scattering fluctuations from individual nanoparticles, Nat. Nanotechnol., 2019, 14(10), 981–987 CrossRef CAS PubMed.
- A. T. Bido, B. G. Nordberg, M. A. Engevik, N. C. Lindquist and A. G. Brolo, High-Speed Fluctuations in Surface-Enhanced Raman Scattering Intensities from Various Nanostructures, Appl. Spectrosc., 2020, 74(11), 1398–1406 CrossRef CAS PubMed.
- N. C. Lindquist and A. G. Brolo, Ultra-High-Speed Dynamics in Surface-Enhanced Raman Scattering, J. Phys. Chem. C, 2021, 125(14), 7523–7532 CrossRef CAS.
- M. M. Schmidt, E. A. Farley, M. A. Engevik, T. N. Adelsman, A. Tuckmantel Bido and N. D. Lemke, et al., High-Speed Spectral Characterization of Single-Molecule SERS Fluctuations, ACS Nano, 2023, 17(7), 6675–6686 CrossRef CAS PubMed.
- C. Zhang, K. C. Huang, B. Rajwa, J. Li, S. Yang and H. Lin, et al., Stimulated Raman scattering flow cytometry for label-free single-particle analysis, Optica, 2017, 4(1), 103–109 CrossRef CAS PubMed.
- C. D. L. de Albuquerque, K. M. Hokanson, S. R. Thorud, R. G. Sobral-Filho, N. C. Lindquist and A. G. Brolo, Dynamic Imaging of Multiple SERS Hotspots on Single Nanoparticles, ACS Photonics, 2020, 7(2), 434–443 CrossRef CAS.
- C. D. L. de Albuquerque, R. G. Sobral-Filho, R. J. Poppi and A. G. Brolo, Digital Protocol for Chemical Analysis at Ultralow Concentrations by Surface-Enhanced Raman Scattering, Anal. Chem., 2018, 90(2), 1248–1254 CrossRef CAS PubMed.
- B. Bozzini, L. D'Urzo, D. Lacitignola, C. Mele, I. Sgura and E. Tondo, Investigation into dynamics of Au electrodeposition based on analysis of SERS spectral time series, Trans. IMF, 2013, 87(4), 193–200 CrossRef.
- A. W. Wark, R. J. Stokes, S. B. Darby, W. E. Smith and D. Graham, Dynamic Imaging Analysis of SERS-Active Nanoparticle Clusters in Suspension, J. Phys. Chem. C, 2010, 114(42), 18115–18120 CrossRef CAS.
- N. C. Lindquist, A. T. Bido and A. G. Brolo, Single-Molecule SERS Hotspot Dynamics in Both Dry and Aqueous Environments, J. Phys. Chem. C, 2022, 126(16), 7117–7126 CrossRef CAS.
- C. Carnegie, M. Urbieta, R. Chikkaraddy, B. de Nijs, J. Griffiths and W. M. Deacon, et al., Flickering nanometre-scale disorder in a crystal lattice tracked by plasmonic flare light emission, Nat. Commun., 2020, 11(1), 682 CrossRef CAS.
- D.-K. Lim and P. P. P. Kumar, Recent advances in SERS-based bioanalytical applications: live cell imaging, Nanophotonics, 2024, 13(9), 1521–1534 CrossRef CAS PubMed.
- K. Koike, K. Bando, J. Ando, H. Yamakoshi, N. Terayama and K. Dodo, et al., Quantitative Drug Dynamics Visualized by Alkyne-Tagged Plasmonic-Enhanced Raman Microscopy, ACS Nano, 2020, 14(11), 15032–15041 CrossRef CAS.
- W. R. Chang, C. Hsiao, Y. F. Chen, C. J. Kuo and C. W. Chiu, Au Nanorods on Carbon-Based Nanomaterials as Nanohybrid Substrates for High-Efficiency Dynamic Surface-Enhanced Raman Scattering, ACS Omega, 2022, 7(45), 41815–41826 CrossRef CAS PubMed.
- K. Chen, Z. Zhang, R. Li, M. Wang, S. Liu and Z. Gao, et al., A nanocage reactor with dense shareable hot spots for in situ and dynamic SERS tracking photocatalytic reaction bonds variations, Chem. Eng. J., 2024, 489, 151358 CrossRef CAS.
- J. A. Huang, M. Z. Mousavi, Y. Zhao, A. Hubarevich, F. Omeis and G. Giovannini, et al., SERS discrimination of single DNA bases in single oligonucleotides by electro-plasmonic trapping, Nat. Commun., 2019, 10(1), 5321 CrossRef PubMed.
- J. Zhou, Q. Lan, W. Li, L. N. Ji, K. Wang and X. H. Xia, Single Molecule Protein Segments Sequencing by a Plasmonic Nanopore, Nano Lett., 2023, 23(7), 2800–2807 CrossRef CAS PubMed.
- C. Chen, Y. Li, S. Kerman, P. Neutens, K. Willems and S. Cornelissen, et al., High spatial resolution nanoslit SERS for single-molecule nucleobase sensing, Nat. Commun., 2018, 9(1), 1733 CrossRef PubMed.
- W. Li, J. Zhou, N. Maccaferri, R. Krahne, K. Wang and D. Garoli, Enhanced Optical Spectroscopy for Multiplexed DNA and Protein-Sequencing with Plasmonic Nanopores: Challenges and Prospects, Anal. Chem., 2022, 94(2), 503–514 CrossRef CAS PubMed.
- J. A. Huang, M. Z. Mousavi, G. Giovannini, Y. Zhao, A. Hubarevich and M. A. Soler, et al., Multiplexed Discrimination of Single Amino Acid Residues in Polypeptides in a Single SERS Hot Spot, Angew. Chem., Int. Ed., 2020, 59(28), 11423–11431 CrossRef CAS.
- A. Hubarevich, J.-A. Huang, G. Giovannini, A. Schirato, Y. Zhao and N. Maccaferri, et al., λ-DNA through Porous Materials—Surface-Enhanced Raman Scattering in a Simple Plasmonic Nanopore, J. Phys. Chem. C, 2020, 124(41), 22663–22670 CrossRef CAS.
- H. Fu, W. Liu, J. Li, W. Wu, Q. Zhao and H. Bao, et al., High-Density-Nanotips-Composed 3D Hierarchical Au/CuS Hybrids for Sensitive, Signal-Reproducible, and Substrate-Recyclable SERS Detection, Nanomaterials, 2022, 12(14), 2359 CrossRef CAS PubMed.
- T. Moon, H. Joo, B. Das, Y. Koo, M. Kang and H. Lee, et al., Adaptive Gap-Tunable Surface-Enhanced Raman Spectroscopy, Nano Lett., 2024, 24(12), 3777–3784 CrossRef CAS PubMed.
- T. Gao, T. Yachi, X. Shi, R. Sato, C. Sato and Y. Yonamine, et al., Ultrasensitive Surface-Enhanced Raman Scattering Platform for Protein Detection via Active Delivery to Nanogaps as a Hotspot, ACS Nano, 2024, 18(32), 21593–21606 CrossRef CAS.
- B. Hu, D. W. Sun, H. Pu and Q. Wei, A dynamically optical and highly stable pNIPAM @ Au NRs nanohybrid substrate for sensitive SERS detection of malachite green in fish fillet, Talanta, 2020, 218, 121188 CrossRef CAS PubMed.
- Y.-W. Cheng, W.-H. Chuang, K.-S. Wang, W.-C. Tseng, W.-Y. Chiu and C.-H. Wu, et al., Thermoresponsive SERS Nanocapsules Constructed by Linear-Dendritic Poly(urea/malonamide) for Tunable Biomolecule Detection, ACS Appl. Polym. Mater., 2021, 4(1), 240–249 CrossRef.
- V. de la Asuncion-Nadal, J. V. Perales-Rondon, A. Colina, B. Jurado-Sanchez and A. Escarpa, Photoactive Au@MoS(2) Micromotors for Dynamic Surface-Enhanced Raman Spectroscopy Sensing, ACS Appl. Mater. Interfaces, 2023, 15(47), 54829–54837 CrossRef CAS.
- Y. Lu, X. Zhang, L. Zhao, H. Liu, M. Yan and X. Zhang, et al., Metal-organic framework template-guided electrochemical lithography on substrates for SERS sensing applications, Nat. Commun., 2023, 14(1), 5860 CrossRef CAS PubMed.
- M. Ge, P. Li, G. Zhou, S. Chen, W. Han and F. Qin, et al., General Surface-Enhanced Raman Spectroscopy Method for Actively Capturing Target Molecules in Small Gaps, J. Am. Chem. Soc., 2021, 143(20), 7769–7776 CrossRef CAS PubMed.
- L. Chen, R. Q. Peng, W. Deng, J. A. Huang and D. Li, All-in-One Electrokinetic Strategy Coupled with a Miniaturized Chip for SERS Detection of Multipesticides, Anal. Chem., 2024, 96(24), 9834–9841 CrossRef CAS.
- M. Song, D. Huang, N. Huo, E. K. Fodjo, W. Deng and D. Li, Tailoring of hot spots in plasmonic microgels for dynamic SERS detection of multi-pesticides by suction-release strategy, Chem. Eng. J., 2023, 473, 145398 CrossRef CAS.
- D. K. Lim, K. S. Jeon, J. H. Hwang, H. Kim, S. Kwon and Y. D. Suh, et al., Highly uniform and reproducible surface-enhanced Raman scattering from DNA-tailorable nanoparticles with 1 nm interior gap, Nat. Nanotechnol., 2011, 6(7), 452–460 CrossRef CAS.
- D. Graham, D. G. Thompson, W. E. Smith and K. Faulds, Control of enhanced Raman scattering using a DNA-based assembly process of dye-coded nanoparticles, Nat. Nanotechnol., 2008, 3(9), 548–551 CrossRef CAS.
- L. Xu, M. Sun, W. Ma, H. Kuang and C. Xu, Self-assembled nanoparticle dimers with contemporarily relevant properties and emerging applications, Mater. Today, 2016, 19(10), 595–606 CrossRef CAS.
- S. Kogikoski, J. Ameixa, A. Mostafa and I. Bald, Lab-on-a-DNA origami: nanoengineered single-molecule platforms, Chem. Commun., 2023, 59(32), 4726–4741 RSC.
- M. Dass, F. N. Gur, K. Kolataj, M. J. Urban and T. Liedl, DNA Origami-Enabled Plasmonic Sensing, J. Phys. Chem. C, 2021, 125(11), 5969–5981 CrossRef CAS.
- W. Fu, H. Chi, X. Dai, H. Zhu, V. S. D. Mesias and W. Liu, et al., Efficient optical plasmonic tweezer-controlled single-molecule SERS characterization of pH-dependent amylin species in aqueous milieus, Nat. Commun., 2023, 14(1), 6996 CrossRef CAS PubMed.
- M. Chisanga and J. F. Masson, Machine Learning-Driven SERS Nanoendoscopy and Optophysiology, Annu. Rev. Anal. Chem., 2024, 17(1), 313–338 CrossRef CAS.
- P. S. Wang, H. Ma, S. Yan, X. Lu, H. Tang and X. H. Xi, et al., Correlation coefficient-directed label-free characterization of native proteins by surface-enhanced Raman spectroscopy, Chem. Sci., 2022, 13(46), 13829–13835 RSC.
- L. M. Almehmadi, S. M. Curley, N. A. Tokranova, S. A. Tenenbaum and I. K. Lednev, Surface Enhanced Raman Spectroscopy for Single Molecule Protein Detection, Sci. Rep., 2019, 9(1), 12356 CrossRef PubMed.
- R. Dong, S. Weng, L. Yang and J. Liu, Detection and direct readout of drugs in human urine using dynamic surface-enhanced Raman spectroscopy and support vector machines, Anal. Chem., 2015, 87(5), 2937–2944 CrossRef CAS PubMed.
- A. M. Fuentes, K. Milligan, M. Wiebe, A. Narayan, J. J. Lum and A. G. Brolo, et al., Stratification of tumour cell radiation response and metabolic signatures visualization with Raman spectroscopy and explainable convolutional neural network, Analyst, 2024, 149(5), 1645–1657 RSC.
- A. Dutta, M. Oncak, F. Izadi, E. Arthur-Baidoo, J. Ameixa and S. Denifl, et al., Plasmon-driven chemical transformation of a secondary amide probed by surface enhanced Raman scattering, Commun. Chem., 2024, 7(1), 188 CrossRef PubMed.
- A. Stefancu, J. Aizpurua, I. Alessandri, I. Bald, J. Baumberg and L. Besteiro, et al., Impact of Surface Enhanced Raman Spectroscopy in Catalysis, ACS Nano, 2024, 18(43), 29337–29379 CrossRef CAS PubMed.
- H. K. Choi, W. H. Park, C. G. Park, H. H. Shin, K. S. Lee and Z. H. Kim, Metal-Catalyzed Chemical Reaction of Single Molecules Directly Probed by Vibrational Spectroscopy, J. Am. Chem. Soc., 2016, 138(13), 4673–4684 CrossRef CAS.
- H. An, L. Wu, L. D. B. Mandemaker, S. Yang, J. de Ruiter and J. H. J. Wijten, et al., Sub-Second Time-Resolved Surface-Enhanced Raman Spectroscopy Reveals Dynamic CO Intermediates during Electrochemical CO(2) Reduction on Copper, Angew. Chem., Int. Ed., 2021, 60(30), 16576–16584 CrossRef CAS PubMed.
- C. M. Zoltowski, D. N. Shoup and Z. D. Schultz, Investigation of SERS Frequency Fluctuations Relevant to Sensing and Catalysis, J. Phys. Chem. C, 2022, 126(34), 14547–14557 CrossRef CAS.
- Q. Ai, J. Zhou, J. Guo, P. Pandey, S. Liu and Q. Fu, et al., Observing dynamic molecular changes at single-molecule level in a cucurbituril based plasmonic molecular junction, Nanoscale, 2020, 12(32), 17103–17112 RSC.
- W. Yan, S. Chen, P. Li, R. Dong, H. H. Shin and L. Yang, Real-Time Monitoring of a Single Molecule in Sub-nanometer Space by Dynamic Surface-Enhanced Raman Spectroscopy, J. Phys. Chem. Lett., 2023, 14(39), 8726–8733 CrossRef CAS.
- J. Li, A. Wuethrich, A. A. I. Sina, H. H. Cheng, Y. Wang and A. Behren, et al., A digital single-molecule nanopillar SERS platform for predicting and monitoring immune toxicities in immunotherapy, Nat. Commun., 2021, 12(1), 1087 CrossRef CAS PubMed.
- J. Guo, Z. Liang, Y. Huang, K. Kim, P. Vandeventer and D. Fan, Acceleration of Biomolecule Enrichment and Detection with Rotationally Motorized Opto-Plasmonic Microsensors and the Working Mechanism, ACS Nano, 2020, 14(11), 15204–15215 CrossRef CAS PubMed.
- J. Zhou, P. L. Zhou, Q. Shen, S. A. Ahmed, X. T. Pan and H. L. Liu, et al., Probing Multidimensional Structural Information of Single Molecules Transporting through a Sub-10 nm Conical Plasmonic Nanopore by SERS, Anal. Chem., 2021, 93(34), 11679–11685 CrossRef CAS PubMed.
- P. G. Etchegoin and E. C. Le Ru, A perspective on single molecule SERS: current status and future challenges, Phys. Chem. Chem. Phys., 2008, 10(40), 6079–6089 RSC.
- C. Heck, Y. Kanehira, J. Kneipp and I. Bald, Placement of Single Proteins within the SERS Hot Spots of Self-Assembled Silver Nanolenses, Angew. Chem., Int. Ed., 2018, 57(25), 7444–7447 CrossRef CAS.
- F. Schuknecht, K. Kolataj, M. Steinberger, T. Liedl and T. Lohmueller, Accessible hotspots for single-protein SERS in DNA-origami assembled gold nanorod dimers with tip-to-tip alignment, Nat. Commun., 2023, 14(1), 7192 CrossRef CAS PubMed.
- K. Tapio, A. Mostafa, Y. Kanehira, A. Suma, A. Dutta and I. Bald, A Versatile DNA Origami-Based Plasmonic Nanoantenna for Label-Free Single-Molecule Surface-Enhanced Raman Spectroscopy, ACS Nano, 2021, 15(4), 7065–7077 CrossRef CAS PubMed.
- A. Mostafa, Y. Kanehira, K. Tapio and I. Bald, From Bulk to Single Molecules: Surface-Enhanced Raman Scattering of Cytochrome C Using Plasmonic DNA Origami Nanoantennas, Nano Lett., 2024, 24(23), 6916–6923 CrossRef CAS PubMed.
- Y. Kanehira, S. Kogikoski Jr., E. Titov, K. Tapio, A. Mostafa and I. Bald, Watching a Single Enzyme at Work Using Single-Molecule Surface-Enhanced Raman Scattering and DNA Origami-Based Plasmonic Antennas, ACS Nano, 2024, 18(31), 20191–20200 CrossRef CAS PubMed.
- A. Haghizadeh, M. Iftikhar, S. S. Dandpat and T. Simpson, Looking at Biomolecular Interactions through the Lens of Correlated Fluorescence Microscopy and Optical Tweezers, Int. J. Mol. Sci., 2023, 24(3), 2668 CrossRef CAS PubMed.
- A. Leray, J. E. Clement, A. Bouhelier and E. Finot, Conformational Changes and Charge Transfer in Biomolecules Resolved Using Dynamic Enhanced Raman Correlation Spectroscopy, J. Phys. Chem. B, 2019, 123(9), 1931–1938 CrossRef CAS.
- N. Feng, L. Zhang, J. Shen, Y. Hu, W. Wu and E. Kouadio Fodjo, et al., SERS molecular-ruler based DNA aptamer single-molecule and its application to multi-level optical storage, Chem. Eng. J., 2022, 433, 133666 CrossRef CAS.
- D. Garoli, H. Yamazaki, N. Maccaferri and M. Wanunu, Plasmonic Nanopores for Single-Molecule Detection and Manipulation: Toward Sequencing Applications, Nano Lett., 2019, 19(11), 7553–7562 CrossRef CAS.
- K. Sugano, K. Maruoka, K. Ikegami, A. Uesugi and Y. Isono, Dynamic surface-enhanced Raman spectroscopy of DNA oligomer with a single hotspot from a gold nanoparticle dimer, Opt. Lett., 2022, 47(2), 373–376 CrossRef CAS.
- H. Ma, S. Yan, X. Lu, Y. F. Bao, J. Liu and L. Liao, et al., Rapidly determining the 3D structure of proteins by surface-enhanced Raman spectroscopy, Sci. Adv., 2023, 9(47), eadh8362 CrossRef CAS.
- C. Zong, M. Xu, L. J. Xu, T. Wei, X. Ma and X. S. Zheng, et al., Surface-Enhanced Raman Spectroscopy for Bioanalysis: Reliability and Challenges, Chem. Rev., 2018, 118(10), 4946–4980 CrossRef CAS PubMed.
- M. Fan, G. F. S. Andrade and A. G. Brolo, A review on recent advances in the applications of surface-enhanced Raman scattering in analytical chemistry, Anal. Chim. Acta, 2020, 1097, 1–29 CrossRef CAS PubMed.
- M. Feizpour, Q. Liu, T. Van der Donck, H. Thienpont, W. Meulebroeck and H. Ottevaere, Characterizing planar SERS substrates: unraveling the link between physical characteristics and performance metrics, J. Phys. Photonics, 2024, 6, 025002 CrossRef.
- C. Li, Y. Zhang, Z. Ye, S. E. J. Bell and Y. Xu, Combining surface-accessible Ag and Au colloidal nanomaterials with SERS for in situ analysis of molecule-metal interactions in complex solution environments, Nat. Protoc., 2023, 18(9), 2717–2744 CrossRef CAS PubMed.
- C. W. Yang, X. Zhang, L. Yuan, Y. K. Wang and G. P. Sheng, Deciphering the microheterogeneous repartition effect of environmental matrix on surface-enhanced Raman spectroscopy (SERS) analysis for pollutants in natural waters, Water Res., 2023, 232, 119668 CrossRef CAS.
- R. Juliano Martins, E. Marinov, M. A. B. Youssef, C. Kyrou, M. Joubert and C. Colmagro, et al., Metasurface-enhanced light detection and ranging technology, Nat. Commun., 2022, 13(1), 5724 CrossRef CAS PubMed.
- A. N. Giordano and R. Rao, Beyond the Visible: A Review of Ultraviolet Surface-Enhanced Raman Scattering Substrate Compositions, Morphologies, and Performance, Nanomaterials, 2023, 13(15), 2177 CrossRef CAS.
- M. W. Knight, N. S. King, L. Liu, H. O. Everitt, P. Nordlander and N. J. Halas, Aluminum for plasmonics, ACS Nano, 2014, 8(1), 834–840 CrossRef CAS.
- P. Ponzellini, G. Giovannini, S. Cattarin, R. P. Zaccaria, S. Marras and M. Prato, et al., Metallic Nanoporous Aluminum–Magnesium Alloy for UV-Enhanced Spectroscopy, J. Phys. Chem. C, 2019, 123(33), 20287–20296 CrossRef CAS.
- S. Banerjee, L. Mattarozzi, N. Maccaferri, S. Cattarin, S. Weng and A. Douaki, et al., Porous aluminum decorated with rhodium nanoparticles: preparation and use as a platform for UV SERS, Mater. Adv., 2024, 5(15), 6248–6254 RSC.
- P. Wang, J. Liang and L. V. Wang, Single-shot ultrafast imaging attaining 70 trillion frames per second, Nat. Commun., 2020, 11(1), 2091 CrossRef CAS.
- B. Mandracchia, C. Zheng, S. Rajendran, W. Liu, P. Forghani and C. Xu, et al., High-speed optical imaging with sCMOS pixel reassignment, Nat. Commun., 2024, 15(1), 4598 CrossRef CAS PubMed.
- K. A. Willets, Super-Resolution Surface-Enhanced Raman Scattering: Perspectives on the Past, Present, and Future, ACS Nano, 2024, 18(41), 27824–27832 CrossRef CAS.
| This journal is © The Royal Society of Chemistry 2025 |