 Open Access Article
Facet-controlled electrosynthesis of nanoparticles by combinatorial screening in scanning electrochemical cell microscopy†
Heekwon
Lee‡
 a,
Jesús Alberto
Muñoz-Castañeda‡
a and
Hang
Ren
 *abc
*abc
aDepartment of Chemistry, The University of Texas at Austin, Austin, Texas 78712, USA. E-mail: hren@utexas.edu
bTexas Materials Institute, The University of Texas at Austin, Austin, Texas 78712, USA
cAllen J. Bard Center for Electrochemistry, The University of Texas at Austin, Austin, Texas 78712, USA
First published on 23rd January 2025
Abstract
Controlled synthesis of faceted nanoparticles on surfaces without explicit use of ligands has gained attention due to their promising applications in electrocatalysis and chemical sensing. Electrodeposition is a desirable method; however, precise control over their size, spatial distribution, and morphology requires extensive optimization. Here, we report the spatially resolved synthesis of shape-controlled Pt nanoparticles and fast screening of synthesis conditions in scanning electrochemical cell microscopy (SECCM) with pulse potentials. The screening is performed on isolated ∼μm2 areas in SECCM, enabling multiple experimental conditions to be evaluated in a single mapping experiment. The screening reveals that the formation of (100) facets in Pt nanoparticles is sensitive to the upper and lower potential limits of the square-wave potential pulse. The facet selectivity is attributed to a facet-dependent migration effect influenced by the concurrent hydrogen evolution reaction during Pt deposition. Moreover, the density and size of nanoparticles can be controlled. This approach offers a pathway toward automated synthesis and characterization of faceted metallic nanoparticles, providing opportunities for advancements in electrocatalysis and sensor development.
Introduction
Here, we report the facet-controlled electrosynthesis of nanoparticles directly on the electrode surface without added ligand by scanning electrochemical cell microscopy (SECCM). The use of SECCM enables fast screening of square-wave potentials used in the synthesis by varying the parameters within the same map in SECCM. The experimental results with colocalized characterization not only allow for the selective synthesis of cubic Pt nanoparticles with (100) facets but also help reveal an unconventional mechanism of differential local migration that leads to facet selectivity. The ability to control the facets in the nanoparticle in ligand-free electrodeposition directly on the substrate surface enables extra control in synthesizing nanoparticle libraries under SECCM, contributing to the high-throughput precision synthesis and screening of nanomaterials.Metallic nanoparticles have physical and chemical properties that are applied to many applications, such as catalysis, optics, electronics, and biology.1–3 The properties are intricately related to their size, shape, and composition, which can be finely tuned by precision synthesis processes. Faceted metallic nanoparticles have attracted considerable interest because of their well-defined surface structures, which offer a good model system to study structure–property relationships beyond single crystal substrates.4,5 These facet nanoparticles have also shown applications in catalysis.6–8
Various chemical methods, such as wet chemistry, have been developed for synthesizing facet-controlled nanoparticles.7,9–11 However, such approaches often involve the use of ligands that bind to the nanoparticle surface, which can obstruct the active sites for catalysis, and undermine the interpretation of the structure–activity relationship. Their removal requires additional purification steps, and the trace amount of ligand after purification, if any, is also challenging to characterize. Additionally, these particles need to be immobilized on a substrate electrode in the application of electrocatalysis and electrochemical sensors. In contrast, electrochemical synthesis of nanoparticles is an effective alternative method.12–14 In electrochemical synthesis, the driving force, i.e., the potential on the electrode, can be readily controlled in real-time, allowing for precise control of the nucleation and growth processes during synthesis. The rate of electrodeposition can be monitored as the current, enabling quantitative control over nanoparticle size. Moreover, these particles are directly synthesized on the substrate electrode surface, eliminating the extra step of immobilization.
Advanced potential waveforms beyond DC potential, e.g., square waves have enabled the synthesis of nanoparticles with specific facet orientations without the addition of ligands.5,15–18 These nanoparticles have demonstrated superior catalytic performance, e.g., in ethanol oxidation and formic acid oxidation, which are highly sensitive to the facet.15,19 However, the throughput for optimizing the experimental conditions is low as one set of parameters requires one electrode. Scanning electrochemical cell microscopy (SECCM) is a powerful tool for the controlled electrodeposition of nanoparticles with high spatial resolution.20,21 The movement of droplet cells in SECCM allows thousands of electrochemical experiments performed on the same substrate, which can significantly increase the throughput of the electrochemical experiments.22–24 Although the SECCM configuration has a limitation in the quantity of nanoparticle synthesis produced at the same time compared to wet chemistry, SECCM has been successfully employed in the deposition of silver nanoparticles, both as single deposits and as arrays, as well as in the synthesis of bimetallic nanoparticles with controlled composition.25–27
Herein, we use SECCM coupled with potential pulses to screen facet-controlled metallic nanoparticles in a combinatorial manner. Multiple conditions of the square-wave potentials, including the upper/lower potentials, and the frequency, can be screened on the same substrate. Colocalized characterization with electron microscopy and atomic force microscopy (AFM) demonstrates the conditions important to control the facet, size, and density of nanoparticles under SECCM. The approach offers additional fine control, especially the facet, in the synthesis of nanoparticle libraries in SECCM, which moves towards automated nanoparticle synthesis and accelerated materials discovery, especially suitable for discovering electrocatalysts.
Results and discussion
A single-channel SECCM setup was employed for electrodeposition of shape-controlled Pt nanoparticles using square-wave potentials, as illustrated in Scheme 1. A single-barrel nanopipette with a typical opening radius of ∼420 nm (Fig. S1†) was filled with Pt precursor solution (0.5 mM Na2PtCl4 + 100 mM H2SO4). The precise positioning of the nanopipette, as commonly practiced in SECCM to contact the meniscus at the pipette tip with the glassy carbon (GC) substrate, completes the circuit and triggers a sudden current flow. This current spike provides the feedback to temporarily park the nanopipette at the surface and initiate the square-wave pulses for Pt deposition (see the experimental setup details in ESI section S1†). The contact area between the droplet and the substrate defines the localized electroactive area for electrodeposition. The upper and lower limit potentials (EL and EU), frequency (f), and duration (td) of square-wave potentials can modulate the morphology of the resulting nanoparticles. After completion of each deposition, the pipette is retracted and moved to a new location, where the electrodeposition condition can be varied. Details of each experimental sequence in SECCM are illustrated in Scheme S2 in ESI section S3.† Note that the substrate with nanoparticles was gently rinsed to eliminate residual Pt salts.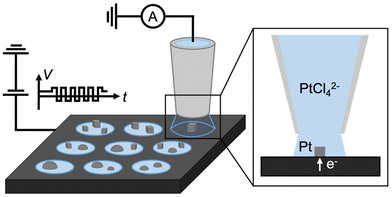 | ||
| Scheme 1 Schematic illustration of shaped controlled electrodeposition of a metal nanoparticle array by SECCM. | ||
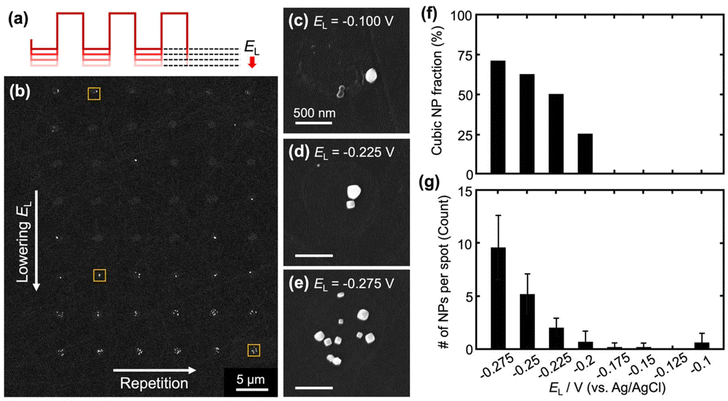
The shape-controlled electrodeposition of Pt nanoparticles was systematically investigated by varying one of the parameters of the square wave at a time (i.e., EL, EU, f, and td). In the first set of experiments, EL was varied while other parameters were kept constant (EU = 1.24 V, f = 500 Hz, and td = 5 s). As the SEM images in Fig. 1 show, the morphology of the Pt nanoparticles is highly sensitive to EL. At EL = −0.1 V, the nanoparticles primarily exhibited rounded shapes on the substrate. A gradual transition in nanoparticle morphology was observed as EL decreased. At EL of −0.275 V, cubic nanoparticles were formed. The total number of nanoparticles per deposition spot also increased with decreasing EL (Fig. 1g). This is because more negative potentials promote nucleation, leading to a higher density of nanoparticles at each SECCM spot.
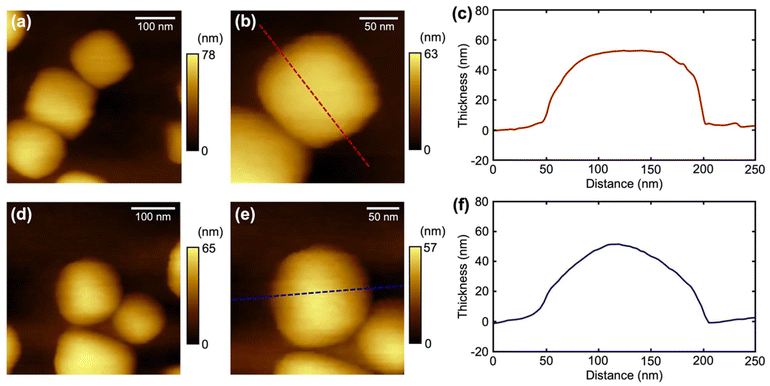
AFM was employed to further characterize the morphology of the synthesized Pt nanoparticles deposited under two different EL, and the topographic micrographs and line-scan profiles are shown in Fig. 2. At a lower EL (−0.275 V), nanoparticles show flat top planes (Fig. 2a and b), consistent with the cubic morphology observed under SEM. The square planes on the cubic nanoparticles are (100) facets. In contrast, rounded nanoparticles were obtained at higher EL (−0.1 V) as shown in Fig. 2d and e. The rounded-shaped profile suggests no preference for specific facets. Similar round shapes were also observed under constant-potential deposition (Fig. S3 and ESI section S5†). The AFM analysis corroborates the SEM findings and highlights the sensitive dependence of facet formation on the lower potentials of the square wave used in electrodeposition.
Next, we studied the effect of EU in the square-wave potential on the morphology and density of Pt nanoparticles. EU was varied from 1.04 to 1.34 V with an increment of 0.05 V, while other waveform parameters were kept the same (EL = −0.275 V, f = 500 Hz, and td = 5 s). The results in Fig. S4† show that the total number of nanoparticles decreases as EU increases. The half-cycle of EU in the waveform is at the potential where Pt can be oxidized. Therefore, the decrease in particle number with increasing EU is likely because some small Pt are anodically etched and dissolved. In addition, the fraction of cubic nanoparticles increases as a function of EU (see ESI section S6†).
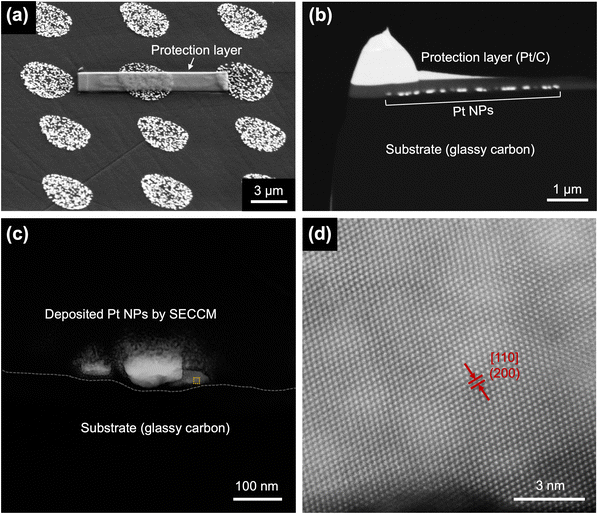
To further analyze the atomic structures of the cubic Pt nanoparticles fabricated by SECCM, high-resolution scanning transmission electron microscopy (STEM) was employed to analyze the nanoparticles obtained using conditions that maximized the fraction of cubic morphology (i.e., EU = 1.24, EL = −0.275 V, f = 500 Hz, and td = 5 s) using a ∼3 μm diameter pipette. Fig. 3a–c shows the TEM lamella sample preparation to lift out the Pt nanoparticle deposited in SECCM to expose their cross sections. Detailed procedures of TEM specimen preparation are provided in ESI section S7.† As depicted in Fig. 3d, a low-index facet with (200) crystal orientation along the [110] zone axis is observed, which aligns with the final morphology of cubic Pt nanoparticles. A d-spacing of 1.96 Å is attributed to the (200) plane in the FCC structure of Pt.
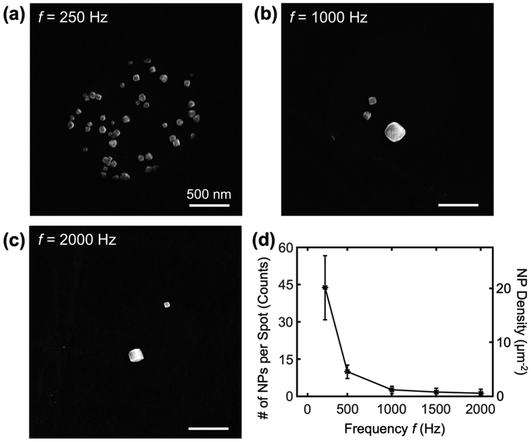
The effect of the frequency of the square-wave potential on the nanoparticle synthesis is further studied under SECCM in a similar fashion with increasing frequency in each row of the SECCM scan. Fig. 4 exhibits SEM images of nanocubes deposited at square-wave frequencies ranging from 250 to 2000 Hz, with other conditions unchanged (EU = 1.24 V, EL = −0.275 V, and td of 5 s). First, no significant dependence of the shape of the nanoparticle on the frequency was observed, but the density of nanoparticles was affected by the frequency. At the lowest frequency of 250 Hz (Fig. 4a), the deposition results in ∼44 nanocubes per spot (or 18 μm−2), indicating a high nucleation and growth rate. As the frequency was increased to 1000 Hz, the average number of nanoparticles decreased to 1.2 (or 0.49 μm−2) in each spot, as shown in Fig. 4b. When the frequency was increased to 2000 Hz, the individual deposition spots contained zero, one, or a few nanoparticles (Fig. 4c). The result suggests that higher frequencies of square waves decrease the nucleation rate. The relationship of decreasing density of nanoparticles with square-wave frequency is summarized in Fig. 4d, and more electron micrographs are included in Fig. S6.† The observation that higher particle density with decreasing square-wave potential is intriguing because the total time spent in the nucleation potential (i.e., the total time spent at EU) in a given square wave is unchanged with frequency. The possible explanation is a two-step process where a pre-nucleation step needs to occur before the nucleation step, which warrants a separate detailed study. The tunable control over the density of nanoparticles via square-wave frequency highlights the versatility of SECCM in nanoparticle synthesis, allowing for the optimization of deposition conditions to achieve the designed nanoparticle density and morphology. Note that the upper limit of the frequency was estimated to be 4.2 kHz, which is confined by the RC time constant in the electrochemical system (see ESI section S9†).
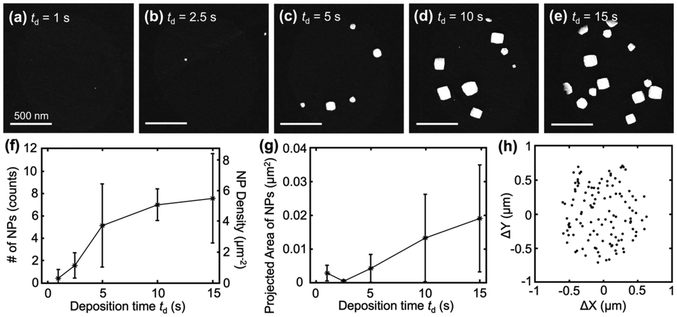
Lastly, we demonstrate that the size of nanoparticles can be controlled by the deposition time of the square wave, td. The effect of td on nanoparticle growth was systematically studied by varying td from 1 to 15 seconds while keeping the potential and frequency constant for cubic nanoparticle deposition (EU = 1.24 V, EL = −0.275 V, f = 500 Hz). SEM images of the nanoparticles synthesized at different td are shown in Fig. 5a–e. At the shortest td of 1 s, only a few small nanoparticles were observed (Fig. 5a), indicating limited nucleation and growth. As the td increased to 5 s (Fig. 5b), the number and size of the nanoparticles increased, with more well-defined nanocubes being formed. Further increasing td to 15 s resulted in a significant increase in both the number and size of the nanoparticles (Fig. 5c–e). The increase in the number of nanoparticles with td is summarized in Fig. 5f. This suggests that nucleation and growth continue to occur with time, similar to the process of progressive nucleation.28 Additionally, the growth of the nanoparticles over time is further confirmed by the projected area of the deposited particles vs td, as shown in Fig. 5g. Lastly, the spatial distribution of the nucleation sites from all deposition times is assessed by plotting the center of the Pt nanoparticle with respect to the center of the droplet. As shown in Fig. 5h, a random distribution of nucleation sites is observed with no preferred location within the droplet in SECCM observed under square-wave potential modulation, suggesting the uniform accessibility of the entire electrode surface under the droplet under this condition. This random distribution suggests that the conclusions discovered here will likely apply to macroscale electrodes whenever the electrode is uniformly accessible. The statistical analysis of the spatial distribution of the nucleation sites is shown in ESI section S10.†
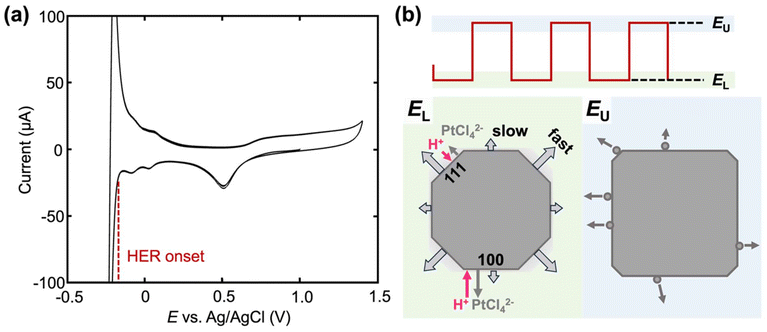
The overall control that square-wave potential offers in the electrosynthesis of Pt nanoparticles can be understood as follows. The transition of a rounded-shaped particle to a cubic one occurs when EL is below −0.2 V (vs. Ag/AgCl), which overlaps with the onset of hydrogen evolution reaction (HER) on Pt as shown in the macroelectrode voltammogram in Fig. 6a. This suggests that HER and Pt deposition from PtCl42− occurs simultaneously when cubic nanoparticles are formed during the EL half cycle of the square wave. The local HER current in acid is expected to be higher on Pt(100) compared to Pt(111) according to single-crystal electrochemical studies previously reported,29 which induces more migration of PtCl42− away from the surface. As illustrated in Fig. 6b, the enhanced migration of PtCl42− lowers the surface concentration of Pt precursor to a larger extent at (100) compared to (111), making Pt deposition slower on (100). The slower deposition on (100) compared to other facets preserves the (100) facet in the final nanoparticle. During the EU half-cycle, Pt is anodically etched. The low-coordinated atoms are etched faster, leaving behind high-coordinated atoms, creating low-index facets on Pt nanoparticles.18 Moreover, the presence of SO42− ions further aids this process by preferentially adsorbing onto the Pt (100) surface, stabilizing these facets and promoting the formation of cubic-like nanoparticles.30,31 Note that although the mass transfer is often the limiting step in acid HER on Pt instead of charge transfer, pulse-potential conditions significantly increase the mass transfer, explaining the importance of using square waves in controlling the facets.
Conclusions
In summary, a precision electrosynthesis method has been developed for facet-controlled nanoparticles by integrating SECCM with square-wave potentials using Pt nanoparticles as a model system. This approach enables high-throughput screening of deposition conditions and their effect on the morphology and facet of nanoparticles. Electron microscopy and AFM confirmed the tuning nanoparticle shapes, ranging from rounded nanoparticles to nanocubes with Pt(100) facets. The number of deposited nanoparticles, spanning from a few to several dozen, can be controlled by adjusting the pulse frequency, while their size can be regulated by the deposition time. This work serves as an initial step towards automated ligand-free synthesis and characterization of structurally well defined metallic nanoparticles, with significant implications for electrocatalysis and related fields. While this work emphasizes potential control for precision nanoparticle synthesis, future exploration of current control methods could offer alternative control over nanoparticle synthesis.Methods
Chemical and materials
Platinum solutions were prepared with sodium tetrachloride-platinate (II) hydrate (Sigma-Aldrich), sulfuric acid (98% Certified ACS Plus Grade, Fisher Chemical), and deionized water (18.2 MΩ cm, Synergy Water Purification System). A miniature silver/silver chloride reference electrode (ET072-1, eDAQ) was used as a quasi-reference counter electrode (QRCE) in SECCM, using a ME-series pipette holder (MEW-F10FL, Harvard Apparatus) to connect it to the micropipette.Pipette preparation
Single channel nanopipettes of approximately 420 nm were fabricated from quartz glass capillaries (Q100-70-7.5, Sutter Instrument) using the P-2000 micropipette puller (Sutter Instrument). The pulling parameters were HEAT = 490, FIL = 1, VEL = 30, DEL = 145, PUL = 200.SECCM measurements
All SECCM experiments were conducted in a homebuilt scanning electrochemical probe system. This was controlled by an FPGA card (PCIe-7852R, National Instrument) through the Warwick Electrochemical Scanning Probe Microscopy Platform (WEC-SPM) software, kindly provided by the Warwick Electro-chemistry & Interfaces Group (WEIG). Two piezo systems were used to control movement; for the z-direction of the pipette a one-axis piezo-positioner (P-622.1CD, Physik Instrumente), and for the x-y plane movement of the substrate a two-axis piezo positioner (P-542.2CD. Physik Instrumente). This was all enclosed with a custom-built Faraday cage and mounted on a mechanical vibration isolator (BM-4, Minus K Technology). All current measurement was done with a Patch-clamp amplifier (Dagan Chem-clamp).Square-wave voltammetry
A DAQ terminal block (NI BNC-2110 DAQ), manipulated through LabVIEW, was used as an arbitrary waveform generator. The output of the terminal block is controlled by the value of a triggering potential to be either a constant zero voltage DC potential or one of ten preprogrammed square-wave conditions. The output is summed to the DC potential (controlled by the FPGA card) using a summing amplifier sent to the Patch-clamp amplifier and applied to the substrate.Data availability
The data supporting this article have been included as the main figures or as part of the ESI.†Conflicts of interest
There are no conflicts to declare.Acknowledgements
The research is supported by the Welch Foundation (F-2158-2023040) and the Sloan Foundation (FG-2023-20317). We also acknowledge the use of the microscope facilities at the Texas Materials Institute at UT Austin. We are grateful to Dr Xun Zhan for supporting the TEM analysis and Prof. Kim McKelvey for supporting the base software WEC-SPM.References
- J. N. Anker, W. P. Hall, O. Lyandres, N. C. Shah, J. Zhao and R. P. Van Duyne, Biosensing with Plasmonic Nanosensors, Nat. Mater., 2008, 7(6), 442–453, DOI:10.1038/nmat2162.
- A. D. Castañeda, N. J. Brenes, A. Kondajji and R. M. Crooks, Detection of microRNA by Electrocatalytic Amplification: A General Approach for Single-Particle Biosensing, J. Am. Chem. Soc., 2017, 139(22), 7657–7664, DOI:10.1021/jacs.7b03648.
- W. J. Stark, P. R. Stoessel, W. Wohlleben and A. Hafner, Industrial Applications of Nanoparticles, Chem. Soc. Rev., 2015, 44(16), 5793–5805, 10.1039/C4CS00362D.
- S. Xie, S.-I. Choi, X. Xia and Y. Xia, Catalysis on Faceted Noble-Metal Nanocrystals: Both Shape and Size Matter, Curr. Opin. Chem. Eng., 2013, 2(2), 142–150, DOI:10.1016/j.coche.2013.02.003.
- N. Tian, Z.-Y. Zhou, S.-G. Sun, Y. Ding and Z. L. Wang, Synthesis of Tetrahexahedral Platinum Nanocrystals with High-Index Facets and High Electro-Oxidation Activity, Science, 2007, 316(5825), 732–735, DOI:10.1126/science.1140484.
- C. Xiao, B.-A. Lu, P. Xue, N. Tian, Z.-Y. Zhou, X. Lin, W.-F. Lin and S.-G. Sun, High-Index-Facet- and High-Surface-Energy Nanocrystals of Metals and Metal Oxides as Highly Efficient Catalysts, Joule, 2020, 4(12), 2562–2598, DOI:10.1016/j.joule.2020.10.002.
- J. Lim, C.-Y. Liu, J. Park, Y.-H. Liu, T. P. Senftle, S. W. Lee and M. C. Hatzell, Structure Sensitivity of Pd Facets for Enhanced Electrochemical Nitrate Reduction to Ammonia, ACS Catal., 2021, 11(12), 7568–7577, DOI:10.1021/acscatal.1c01413.
- J.-X. Tang, L.-P. Xiao, C. Xiao, N. Tian, Z.-Y. Zhou and S.-G. Sun, Tetrahexahedral PdRh Nanocrystals with Tunable Composition as a Highly Efficient Electrocatalyst for Ethylene Glycol Oxidation, J. Mater. Chem. A, 2021, 9(17), 11049–11055, 10.1039/D1TA00663K.
- T. S. Ahmadi, Z. L. Wang, T. C. Green, A. Henglein and M. A. El-Sayed, Shape-Controlled Synthesis of Colloidal Platinum Nanoparticles, Science, 1996, 272(5270), 1924–1925, DOI:10.1126/science.272.5270.1924.
- L. Zhang, Z. Xie and J. Gong, Shape-Controlled Synthesis of Au–Pd Bimetallic Nanocrystals for Catalytic Applications, Chem. Soc. Rev., 2016, 45(14), 3916–3934, 10.1039/C5CS00958H.
- M. Liu, Y. Zheng, L. Zhang, L. Guo and Y. Xia, Transformation of Pd Nanocubes into Octahedra with Controlled Sizes by Maneuvering the Rates of Etching and Regrowth, J. Am. Chem. Soc., 2013, 135(32), 11752–11755, DOI:10.1021/ja406344j.
- N. Tian, Z.-Y. Zhou, N.-F. Yu, L.-Y. Wang and S.-G. Sun, Direct Electrodeposition of Tetrahexahedral Pd Nanocrystals with High-Index Facets and High Catalytic Activity for Ethanol Electrooxidation, J. Am. Chem. Soc., 2010, 132(22), 7580–7581, DOI:10.1021/ja102177r.
- L.-F. Chen, A.-Y. Xie, Y.-Y. Lou, N. Tian, Z.-Y. Zhou and S.-G. Sun, Electrochemical Synthesis of Tetrahexahedral Cu Nanocrystals with High-Index Facets for Efficient Nitrate Electroreduction, J. Electroanal. Chem., 2022, 907, 116022, DOI:10.1016/j.jelechem.2022.116022.
- M. W. Glasscott, A. D. Pendergast, S. Goines, A. R. Bishop, A. T. Hoang, C. Renault and J. E. Dick, Electrosynthesis of High-Entropy Metallic Glass Nanoparticles for Designer, Multi-Functional Electrocatalysis, Nat. Commun., 2019, 10(1), 2650, DOI:10.1038/s41467-019-10303-z.
- J. Liu, X. Fan, X. Liu, Z. Song, Y. Deng, X. Han, W. Hu and C. Zhong, Synthesis of Cubic-Shaped Pt Particles with (100) Preferential Orientation by a Quick, One-Step and Clean Electrochemical Method, ACS Appl. Mater. Interfaces, 2017, 9(22), 18856–18864, DOI:10.1021/acsami.7b04267.
- Y. Liu, D. Gokcen, U. Bertocci and T. P. Moffat, Self-Terminating Growth of Platinum Films by Electrochemical Deposition, Science, 2012, 338(6112), 1327–1330, DOI:10.1126/science.1228925.
- K. Huang, J. Clausmeyer, L. Luo, K. Jarvis and R. M. Crooks, Shape-Controlled Electrodeposition of Single Pt Nanocrystals onto Carbon Nanoelectrodes, Faraday Discuss., 2018, 210, 267–280, 10.1039/C8FD00018B.
- C. Xiao, N. Tian, J.-X. Tang, L.-F. Chen, Z.-Y. Zhou and S.-G. Sun, Electrolyte Effects on the Shape-Controlled Synthesis of Pt Nanocrystals by Electrochemical Square-Wave Potential Method, J. Electroanal. Chem., 2023, 935, 117344, DOI:10.1016/j.jelechem.2023.117344.
- X. Liu, K. Wang, L. Zhou, H. Pu, T. Zhang, J. Jia and Y. Deng, Shape-Controlled Synthesis of Concave Pt and Willow-Like Pt Nanocatalysts via Electrodeposition with Hydrogen Adsorption/Desorption and Investigation of Their Electrocatalytic Performances toward Ethanol Oxidation Reaction, ACS Sustainable Chem. Eng., 2020, 8(16), 6449–6457, DOI:10.1021/acssuschemeng.0c00967.
- N. Ebejer, A. G. Güell, S. C. S. Lai, K. McKelvey, M. E. Snowden and P. R. Unwin, Scanning Electrochemical Cell Microscopy: A Versatile Technique for Nanoscale Electrochemistry and Functional Imaging, Annu. Rev. Anal. Chem., 2013, 6(1), 329–351, DOI:10.1146/annurev-anchem-062012-092650.
- L. F. Gaudin, I. R. Wright, T. R. Harris-Lee, G. Jayamaha, M. Kang and C. L. Bentley, Five Years of Scanning Electrochemical Cell Microscopy (SECCM): New Insights and Innovations, Nanoscale, 2024, 16(26), 12345–12367, 10.1039/D4NR00859F.
- X. Xu, D. Valavanis, P. Ciocci, S. Confederat, F. Marcuccio, J.-F. Lemineur, P. Actis, F. Kanoufi and P. R. Unwin, The New Era of High-Throughput Nanoelectrochemistry, Anal. Chem., 2023, 95(1), 319–356, DOI:10.1021/acs.analchem.2c05105.
- M. Li, K.-H. Ye, W. Qiu, Y. Wang and H. Ren, Heterogeneity between and within Single Hematite Nanorods as Electrocatalysts for Oxygen Evolution Reaction, J. Am. Chem. Soc., 2022, 144(12), 5247–5252, DOI:10.1021/jacs.2c00506.
- J. Zhao, M. Wang, Y. Peng, J. Ni, S. Hu, J. Zeng and Q. Chen, Exploring the Strain Effect in Single Particle Electrochemistry Using Pd Nanocrystals, Angew. Chem., Int. Ed., 2023, 62(30), e202304424, DOI:10.1002/anie.202304424.
- Md. M. Rahman, C. L. Tolbert, P. Saha, J. M. Halpern and C. M. Hill, On-Demand Electrochemical Fabrication of Ordered Nanoparticle Arrays Using Scanning Electrochemical Cell Microscopy, ACS Nano, 2022, 16(12), 21275–21282, DOI:10.1021/acsnano.2c09336.
- P. Ciocci, D. Valavanis, G. N. Meloni, J. Lemineur, P. R. Unwin and F. Kanoufi, Optical Super–Localisation of Single Nanoparticle Nucleation and Growth in Nanodroplets, ChemElectroChem, 2023, 10(9), e202201162, DOI:10.1002/celc.202201162.
- H. Lee, K. C. Matthews, X. Zhan, J. H. Warner and H. Ren, Precision Synthesis of Bimetallic Nanoparticles via Nanofluidics in Nanopipets, ACS Nano, 2023, 17(22), 22499–22507, DOI:10.1021/acsnano.3c06011.
- E. Mondaca-Medina, R. García-Carrillo, H. Lee, Y. Wang, H. Zhang and H. Ren, Nanoelectrochemistry in Electrochemical Phase Transition Reactions, Chem. Sci., 2023, 14(28), 7611–7619, 10.1039/D3SC01857A.
- N. M. Marković, B. N. Grgur and P. N. Ross, Temperature-Dependent Hydrogen Electrochemistry on Platinum Low-Index Single-Crystal Surfaces in Acid Solutions, J. Phys. Chem. B, 1997, 101(27), 5405–5413, DOI:10.1021/jp970930d.
- A. S. Lapp, Z. Duan, G. Henkelman and R. M. Crooks, Combined Experimental and Theoretical Study of the Structure of AuPt Nanoparticles Prepared by Galvanic Exchange, Langmuir, 2019, 35(50), 16496–16507, DOI:10.1021/acs.langmuir.9b03192.
- R. A. Martínez–Rodríguez, F. J. Vidal–Iglesias, J. Solla–Gullón, C. R. Cabrera and J. M. Feliu, Synthesis and Electrocatalytic Properties of H2 SO4 –Induced (100) Pt Nanoparticles Prepared in Water–in–Oil Microemulsion, ChemPhysChem, 2014, 15(10), 1997–2001, DOI:10.1002/cphc.201400056.
Footnotes |
| † Electronic supplementary information (ESI) available: Experimental setup and procedure for square-wave voltammetry in SECCM, SEM of nanopipettes, additional voltammograms and electron micrographs for deposition under other square-wave conditions, and DC potential, RC constant calculation, and spatial distribution of nucleation sites. See DOI: https://doi.org/10.1039/d4nr04564e |
| ‡ Authors contributed equally. |
| This journal is © The Royal Society of Chemistry 2025 |


