 Open Access Article
Decoupling many-body interactions in the CeO2(111) oxygen vacancy structure with statistical learning and cluster expansion†
Yujing
Zhang
ab,
Zhong-Kang
Han
 c,
Beien
Zhu
 d,
Xiaojuan
Hu
e,
Maria
Troppenz
f,
Santiago
Rigamonti
 f,
Hui
Li
*a,
Claudia
Draxl
 f,
M. Verónica
Ganduglia-Pirovano
 *g and
Yi
Gao
 *dh
*dh
aBeijing Advanced Innovation Center for Soft Matter Science and Engineering, Beijing University of Chemical Technology, Beijing 100029, China. E-mail: hli@buct.edu.cn
bKey Laboratory of Interfacial Physics and Technology, Shanghai Institute of Applied Physics, Chinese Academy of Sciences, Shanghai 201800, China
cSchool of Materials Science and Engineering, Zhejiang University, Hangzhou 310027, China
dPhoton Science Research Center for Carbon Dioxide, Shanghai Advanced Research Institute, Chinese Academy of Sciences, Shanghai 201210, China. E-mail: gaoyi@sari.ac.cn
eFritz-Haber-Institut der Max-Planck-Gesellschaft, Faradayweg 4-6, 14195 Berlin, Germany
fInstitut für Physik und Iris Adlershof, Humboldt-Universität zu Berlin, Zum Großen Windkanal 2, 12489 Berlin, Germany
gInstituto de Catálisis y Petroleoquímica, Consejo Superior de Investigaciones Científicas, 28049 Madrid, Spain. E-mail: vgp@icp.csic.es
hKey Laboratory of Low-Carbon Conversion Science & Engineering, Shanghai Advanced Research Institute, Chinese Academy of Sciences, Shanghai 201210, China
First published on 23rd December 2024
Abstract
Oxygen vacancies (VO's) are of paramount importance in influencing the properties and applications of ceria (CeO2). Yet, comprehending the distribution and nature of VO's poses a significant challenge due to the vast number of electronic configurations and intricate many-body interactions among VO's and polarons (Ce3+ ions). In this study, we established a cluster expansion model based on first-principles calculations and statistical learning to decouple the interactions among the Ce3+ ions and VO's, thereby circumventing the limitations associated with sampling electronic configurations. By separating these interactions, we identified specific electronic configurations characterized by the most favorable VO–Ce3+ attractions and the least favorable Ce3+–Ce3+/VO–VO repulsions, which are crucial in determining the stability of vacancy structures. Through more than 108 Metropolis Monte Carlo samplings of VO's and Ce3+ ions in the near surface of CeO2(111), we explored potential configurations within an 8 × 8 supercell. Our findings revealed that oxygen vacancies tend to aggregate and are abundant in the third oxygen layer with an elevated VO concentration primarily due to extensive geometric relaxation, an aspect previously overlooked. This work introduces a novel theoretical framework for unraveling the complex vacancy structures in metal oxides, with potential applications in redox and catalytic chemistry.
1. Introduction
Cerium oxide (CeO2), known for its high concentration of surface oxygen vacancies (VO's), exhibits remarkable oxygen storage capacity and redox catalytic performance, finding applications in diverse areas such as automobile exhaust gas treatment, hydrogen production, purification, and fuel cells.1–10 The CeO2 (111) crystal facet, known for its stability and accessibility, has been extensively studied.11–19 Experiments involving scanning tunneling microscopy (STM) and atomic resolution dynamic force microscopy (DFM) have provided insights into the various near-surface VO structures at the CeO2(111) surface.20,21 The theoretical interpretation of the distributions of these vacancies has proven to be a challenge.22–30 Early studies identified the formation of a single VO, leaving two electrons localized on the 4f orbitals of two Ce4+ ions, converting them into Ce3+ ions.22 Li et al.23 and Ganduglia-Pirovano et al.24,25 suggested that the energetically favored location for an isolated oxygen vacancy is in the subsurface layer, with the excess electrons localized in two next-nearest neighbor (NNN) cations. This configuration was found to be approximately 0.2 eV more stable than the NNN of the surface vacancy and significantly lower in energy than the VO in deeper oxygen layers. Further research explained the observed high stability of an ordered (2 × 2) oxygen subsurface vacancy structure at a VO concentration of 1/4.21,25 However, precise sampling of the VO structures remains challenging due to the varied stability introduced by Ce3+ ions at different coordination spheres around the VO's.31 As the number of VO's increases, the number of Ce3+ also rises, leading to an exponential increase in possible electronic configurations. The spatial correlation among Ce3+'s and VO's and the mutual spatial correlation between Ce3+'s and VO's become exceedingly complex and are closely tied to the stability of configurations. Understanding the nature of VO structures and making accurate predictions about VO/Ce3+ configurations require a precise evaluation of the stabilities of numerous electronic configurations, considering the interactions among Ce3+–Ce3+, VO–Ce3+, VO–VO, and their couplings. However, this level of complexity exceeds the current computational capacity. In recent years, theoretical research has increasingly focused on combining machine learning with first-principles methods to address challenges related to metal oxide surfaces.32,33In this study, we employed a combination of statistical learning methods, a cluster expansion (CE) model, and first-principles calculations to decouple the interactions among Ce3+'s and VO's. This approach allowed us to sample the electronic configurations of VO's at the CeO2(111) surface more effectively. We identified specific configurations characterized by maximum VO–Ce3+ attractions and minimum Ce3+–Ce3+/VO–VO repulsions. Notably, as the concentration of VO's increases, they tend to distribute toward the third oxygen layer rather than concentrating near the surface, as observed with isolated VO's. This unique behavior is attributed to a distinct geometric relaxation, a factor that was overlooked in earlier studies, which primarily considered lower oxygen vacancy concentrations and/or focused on the surface and subsurface layers.23–25,34 The integration of statistical learning and computational models has significantly enhanced our understanding of the intricate interactions and configurations of oxygen vacancies (VO's) and Ce3+'s species on the CeO2(111) surface. It is evident that the stability of oxygen vacancies is crucial in understanding the surface physics and chemistry of reducible oxides, indicating a potential need for reinterpreting earlier data. Given that the surface chemistry of such oxides is largely influenced by defects, there is ample opportunity for unexpected discoveries.
2. Theoretical methods
2.1. DFT modeling
We performed spin-polarized DFT calculations using the Perdew–Burke–Ernzerhof (PBE) functional, implemented in the Vienna ab initio simulation package (VASP).35,36 To account for the localized Ce 4f states (Ce3+), we applied DFT+U with an effective U value of 5.0 eV.37–39 Additionally, to inspect different configurations of the reduced Ce3+ sites, a two-step relaxation procedure was applied. In the first step, we replaced selected Ce4+ ions by La3+ ions, with a larger ionic radius, for coarse optimization. The obtained relaxed structure was further optimized using the regular Ce4+ projector augmented wave (PAW) potentials. All configurations were charge-compensated according to the number of oxygen vacancies. Valence states were considered for Ce (5s, 5p, 6s, 4f, 5d) and O (2s, 2p) electrons, and PAW potentials were employed to represent core–valence interactions. A plane-wave cutoff of 400 eV was used to expand the Kohn–Sham valence states.40,41 The CeO2(111) surface was modeled as a periodic slab with a 4 × 4 surface supercell and included four O–Ce–O tri-layers. To avoid interactions between periodic images, a vacuum layer of 15 Å was included. The bottom three atomic layers (O–Ce–O) were held fixed to their bulk positions, and the Γ point was adopted for all calculations.2.2. Statistical learning and the cluster expansion model
Statistical learning in conjunction with the CELL code (available at the Python Package Index (PyPI) repository https://pypi.org/project/clusterX/; documentation can be found at https://sol.physik.hu-berlin.de/cell) was employed to train energy data calculated using DFT and optimize the cluster expansion (CE) model.34,42–46 The cluster pool consists of 3144 clusters, each containing no more than 4 points (where a point represents either a Ce3+ or a VO), with the distance between the points determined according to the lattice constant of 15.45 Å in the x and y directions and periodicity. Increasing the cutoff from 8 Å to 9 Å raises the total number of features from 3144 clusters to 8527 clusters, but we did not identify any additional clusters with predominant contributions. Further increasing the cutoff exceeds the supercell limit. Thus, choosing 8 Å as the cutoff threshold in our work is reasonable and justified (Table S1†). Various configurations were considered, incorporating one to four vacancies randomly located at the surface, subsurface, and third oxygen layer, each corresponding to different concentrations (Θ = 1/16, 1/8, 3/16, 1/4). The Ce3+ positions were randomly located at the surface and subsurface. The VO formation energy (ECEf) for a given configuration S is described as | (1) |
3. Results
3.1. Decoupling of the many-body interaction using a statistical-learning model
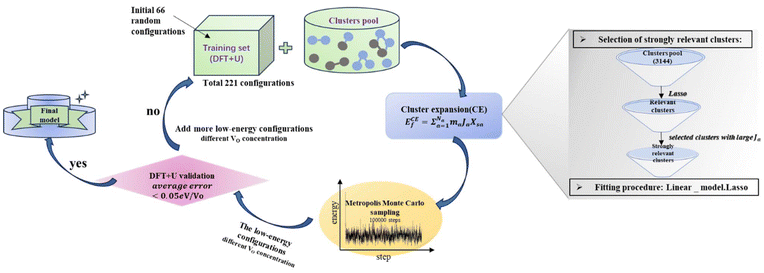
To determine the VO formation energy (ECEf) of any configuration of VO's and their associated Ce3+'s, we constructed a CE model that accounts for interactions among Ce3+–Ce3+, VO–Ce3+, VO–VO, and their couplings (clusters). As shown in Scheme 1, the training data for our CE model consisted of DFT+U calculations involving diverse random configurations of VO structures. These structures encompassed VO concentrations (Θ) of 1/16, 1/8, 3/16, and 1/4. These VO concentrations pertain to the monolayer oxygen atoms and are defined as Θ = n/N, where N = 16 and n = 1, 2, 3, 4. Here, N represents the number of oxygen atoms in a non-reduced oxygen layer within the surface unit cell, and n is the number of VO's in the unit cell. Due to the fact that the formation energies of bulk VO's are much larger than those near the surface, as indicated by previous studies24,49,50 and our preliminary tests (Fig. S1†), we have confined the VO's to the three topmost oxygen layers: the surface, the subsurface, and the third oxygen layer. Similarly, Ce3+ ions are confined to the two topmost cationic layers: the surface and subsurface. Our objective is to address the possibility of VO's in the deeper layers. We will demonstrate the high abundance of VO's in the third layer using a combination of LASSO and cluster expansion methods in this work, which extends beyond previous understanding. While we do not exclude the possibility of VO's in the 4th layer or even deeper layers, these were not included in the current work due to their relatively higher energies and much higher computational cost. Subsequently, the VO formation energies were calculated, | (2) |
 is the energy of the configuration with n VO's and relaxed geometry and EO2 and
  are the total energies of the isolated O2 molecule and the pristine slab. In the DFT+U calculation process, the oxidation state of a given Ce atom can be estimated by evaluating its local magnetic moment, defined as the difference between up and down spins on the atoms. This can be estimated by integrating the site- and angular momentum projected spin-resolved density of states over spheres with radii chosen as the Wigner–Seitz radii of the PAW potentials. In the case of reduced Ce ions, where the occupation of Ce f states is close to 1 and the magnetic moment is ∼1μB, these ions are typically referred to as Ce3+. Fig. S2† illustrates isosurfaces of the difference between spin-up and spin-down charges for the example of four subsurface oxygen vacancies and eight Ce3+ ions. The localization of the charge in f-like orbitals is clearly observable. Additionally, Ce3+–O bond lengths (∼2.49 Å) are larger than those of Ce4+–O bonds (∼2.37 Å).
In the cluster expansion method with an 8 Å cutoff, we considered all clusters consisting of no more than 4 points, where each point represents either a Ce3+ or a VO. The initial pool included 3144 clusters: 1 zero-body, 5 one-body, 47 two-body, 430 three-body, and 2661 four-body clusters. These clusters account for the positions of VO's and Ce3+'s, and the distances between them. The key clusters were selected based on the vacancy formation energies of charge-balanced configurations obtained from DFT calculations, which inherently account for all the electronic interactions, including electrostatic interactions. Thus, charge balance is implicit in our model. These clusters serve as parameters within the CE model rather than as independent physical structures. To represent a complete and realistic configuration, multiple clusters must be combined (as shown in Fig. S3†). To disentangle the many-body interactions and identify the predominant features with the largest effective cluster interactions, we employed the least absolute shrinkage and selection operator (LASSO) approach3.8,51–55 LASSO is an effective algorithm to avoid overfitting and select the optimal cluster set. In this approach, the objective function minimized is as follows:
 | (3) |
Here, the first term represents the summation of the squared error between the predicted and calculated formation energies, and the second term, the l1 regularization term, is the summation of |Ja|. The hyperparameter λ is obtained by minimizing a leave-one-out cross-validation error. The leave-one-out cross-validation method was employed to avoid overfitting and evaluate the predictive power of the CE model. From the clusters identified by LASSO, we isolated those with significant effective cluster interactions (Ja) to establish a preliminary model. Subsequently, we performed Metropolis Monte Carlo (MC) simulations coupled with statistical learning predictions at 1000 K over 105 steps. At each step, the model provided energy predictions, enabling the identification of the 20 lowest-energy configurations across various VO concentrations (4 concentrations with 5 configurations per concentration). Given the complexity of the reduced ceria surface, the primary objective of this work is not to develop a model with extremely high accuracy for predicting the lowest energy configuration directly. Instead, we aim to efficiently identify low-energy configurations with a sufficiently low error between the average predicted VO formation energy, ECEf, and DFT+U calculations. If the error exceeded the threshold (0.05 eV per VO), new configurations sampled by MC were incorporated into the training set, and the training process continued. The final model converged to standard reference training error metrics (RMSE, MAE), cross-validation error (CV_RMSE, CV_MAE), and DFT verification thresholds for the 20 low-energy configurations. Following 8 iterations of active training, wherein clusters were re-selected with the pool containing 3144 clusters at each iteration, we identified 15 key clusters involving only one-body and two-body interactions from the initial pool of 3144 clusters by analyzing errors across different clusters and the energy deviation of the lowest-energy configurations. This analysis is detailed in Tables S2 and S3.† A total of 221 configurations were used in the final training process of our CE model. The configurations for training, along with the diversity and uniformity of our training set, are shown in Fig. S4.†
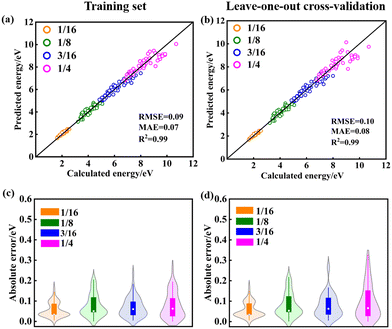
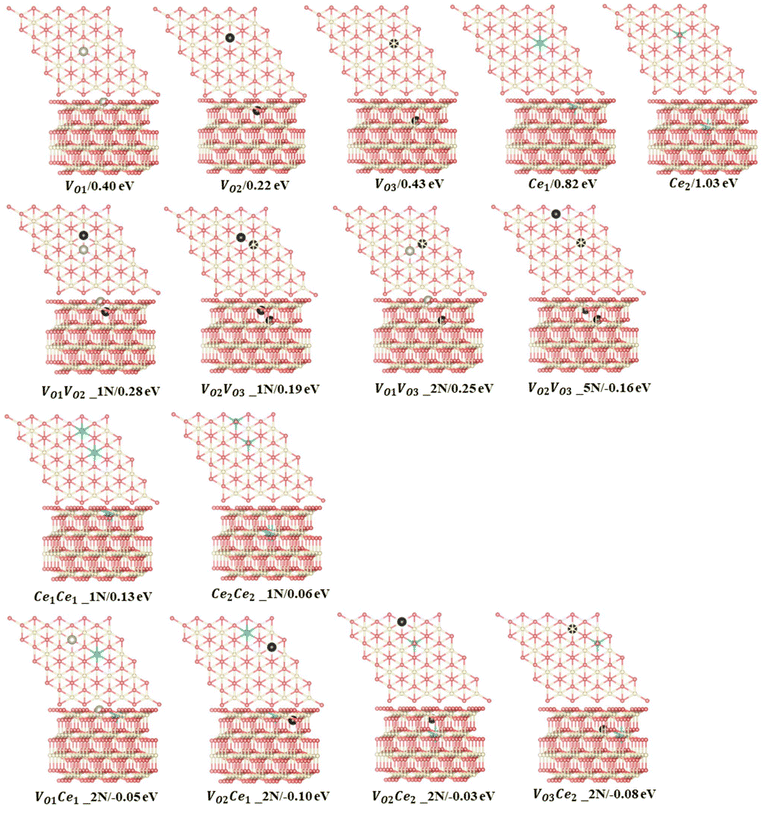
The training maximum-absolute error (MAE) is 0.07 eV per VO (Fig. 1a) and the cross-validation MAE is 0.08 eV per VO (Fig. 1b). The detailed distributions of the absolute errors between the CE predicted formation energy and the DFT calculated formation energy of Vo's are displayed in Fig. 1c and d. The error distributions are concentrated below 0.1 eV, as indicated by the median line and the broad area of the violin plot. The largest deviations between the calculated and predicted energies for the training set and leave-one-out cross-validation arise from the high-energy unstable configurations. The formation energies of the 15 primary cluster features identified by decoupling the many-body interaction are shown in Fig. 2. In this notation, VOnCem_ lN, n and m denote the oxygen atomic layer and the Ce atomic layer where the VO and Ce3+ are located, respectively. l denotes the positional relationship definition of VO–VO, VO–Ce3+, and Ce3+–Ce3+ in the order of nearest neighbors (as shown in Fig. S5 and Table S4†).
The monomer configuration reveals that the isolated vacancy prefers the subsurface (VO2 = 0.22 eV), which is approximately 0.2 eV more stable than the surface vacancy (VO1 = 0.40 eV) and the 3rd layer vacancy (VO3 = 0.43 eV). In contrast, the Ce3+ ion prefers the surface (Ce1 = 0.82 eV) over the subsurface (Ce2 = 1.03 eV), which is in line with previous knowledge.23 Regarding two-body interactions, there is a clear repulsion between the VO's in nearest-neighbor positions in different layers (VO1VO2_1N, VO2VO3_1N, VO1VO3_2N). Among these interactions, VO1VO2_1N exhibits the strongest repulsion (0.28 eV), while VO2VO3_1N is the weakest (0.19 eV). However, Vo's in the subsurface and the 3rd layers exhibit strong attraction when forming a specific pattern, denoted as VO2VO3_5N, with an interaction energy of −0.16 eV. When we replace this two-body cluster with a three-body cluster, VO2Ce1VO3_5N (Fig. S6†), where one Ce3+ is added at a next-nearest neighbor position relative to VO2 and VO3, the fitting accuracy remains similar (Table S5†). This suggests that the two-body cluster VO2VO3_5N effectively captures the three-body interaction in VO2Ce1VO3_5N. In contrast, removing VO2VO3_5N decreases the accuracy of the model (Table S5†). Moreover, as shown in Table S6,† the prediction errors of model 3, which excluded the VO2VO3_5N two-body cluster, are significant for low-energy configurations. The VO2VO3_5N pattern allows the Ce3+ ions to occupy energetically favorable sites as next-nearest neighbors to both VO's, thereby enhancing the system stability (Fig. S7†). Thus, this two-body cluster effectively represents the existing multi-body interactions within the model. For cerium ions, surface Ce3+ ions in nearest-neighbor positions exhibit stronger repulsion (Ce1Ce1_1N = 0.13 eV) than subsurface Ce3+ ions (Ce2Ce2_1N = 0.06 eV). Additionally, the next-nearest neighbor interaction between VO and Ce3+ (VOnCen_2N) is consistently attractive, in line with previous studies suggesting that Ce3+ ions prefer the NNN position to VO's.24 Specifically, for surface Ce3+ ions, the strongest attraction is with the formation of a NNN configuration with subsurface VO's (VO2Ce1_2N = −0.10 eV), while for the subsurface Ce3+, the strongest attractions are with 3rd layer VO's (VO3Ce2_2N = −0.08 eV). The interaction (attraction/repulsion) is relative to the isolated VO's or Ce3+'s. Clusters with negligible interactions, such as the “missing” 3N and 4N clusters (and others), can be interpreted as having the same energy as isolated VO's. This insight helps to understand the frequent occurrence of patterns with two VO's along the same line (Fig. 3a), even when not identified as key clusters.
3.2. Statistical-learning model predicts the stability of configurations
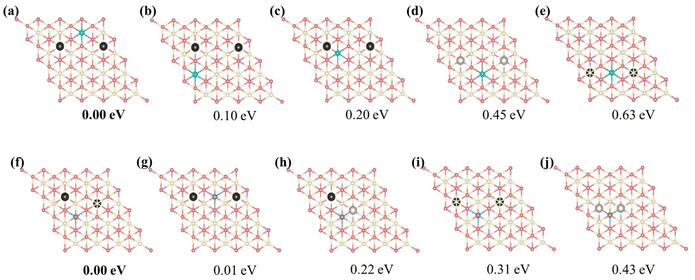
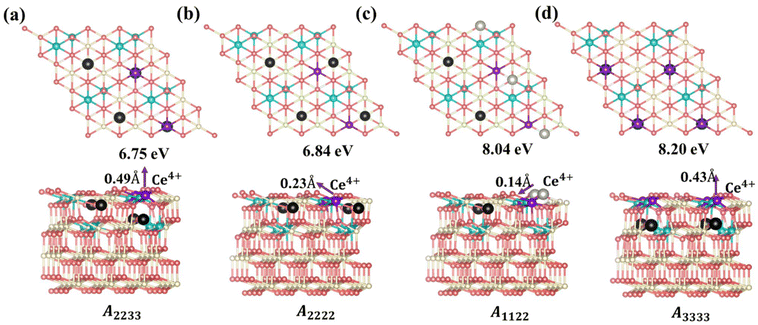
The special motifs described above can be used to understand the specific stability of the local configurations, serving as building blocks in comprehending the stability of complete physical configurations. Leveraging on the 15 primary features obtained through decoupling, one can readily predict the stability of any vacancy structure concerning the positions of VO's and Ce3+'s. Fig. S8† presents several configurations of a single VO with two Ce3+ ions. Among these configurations, the subsurface VO with two NNN surface Ce3+'s is most stable, and the formation energy of this configuration can be used as a benchmark (0.00 eV) to measure the stability of other configurations. For example, the relative energies of the surface and 3rd layer Vo with two NNN surface Ce3+ ions are 0.28 eV and 0.42 eV, respectively. This finding is consistent with previous studies.23,25 However, in the case of multi-vacancies, the situation becomes more complicated; again, the most stable motif is used as a benchmark. As shown in Fig. 3, for the surface Ce3+ ions (Fig. 3(a–e)), as the positions of VO's and the relative position between the VO's and the Ce3+ ions vary, it becomes evident that motif (a) involves the most stable subsurface VO2 and exhibits the most attractive interaction between Ce3+ and VO (VO2Ce1_2N) compared to other configurations. The distance between the VO's is that of 3rd neighbors (7.72 Å) in the oxygen layer, consistent with previous work.25 On the other hand, for subsurface Ce3+ (Fig. 3(f–j)), motif (f), which satisfies both strong VO3Ce2_2N and VO2VO3_5N attractions, is the most stable. This indicates that the 3rd layer VO's are stable when subsurface Ce3+ are present. In summary, specific local configurations with high stability have been identified.Based on the above analysis, we can understand the lowest-energy configurations at different concentrations (Θ = 1/16, 1/8, 3/16, and 1/4) using a 4 × 4 supercell obtained from the protocol in Scheme 1. As shown in Fig. S9 and S10,† these configurations were predicted by the CE model and subsequently verified through DFT+U calculations. For low VO concentrations (Θ = 1/16 and 1/8), the low-energy configurations feature vacancies distributed in the surface and subsurface layers. This observation is consistent with previous literature,23,25 indicating that subsurface VO's are the most stable, with excess electrons localized on NNN cerium positions to the vacancies. Specifically, for Θ = 1/8, the most stable configuration has VO's forming third-nearest-neighbor pairs in the oxygen plane, aligning with previous knowledge25 (Fig. S10†). However, as the VO concentration increases (Θ = 3/16), vacancies begin to appear in the 3rd oxygen layer in addition to the subsurface layer, rather than in the surface layer. A configuration featuring two VO's in the subsurface and one VO in the 3rd oxygen layer (cf. VO2VO3_5N in Fig. 2) becomes more stable than the configuration where all VO's are located in the subsurface (Fig. S10†). These results extend the previous understanding that Vo's first distribute in the subsurface and then in the surface across a wide range of vacancy concentrations. With a further increase in VO concentration to 1/4, more VO's distribute to the 3rd layer. A stable structure emerges, composed of VO2VO3_5N and VO2Ce1_2N features (Fig. 4a). In this structure, termed A2233 (Amnpq, m, n, p, and q denote the oxygen layers where the VO's are located), two VO's are in the subsurface layer, while two VO's are in the 3rd oxygen layer. The Ce3+ ions are positioned in NNN positions relative to the vacancies. This configuration is energetically favorable by 0.09 eV compared to the proposed (2 × 2) structure from previous literature, where all VO's are in the subsurface and are third-nearest neighbors in the oxygen plane, termed A2222 (Fig. 4b).25 It has been suggested that vacancy-induced lattice relaxation effects play an essential role in determining the spacing between VO's in the (2 × 2) structure. Moreover, although the outermost cerium layer is usually the energy-preferred location for Ce3+ ions, in both of these structures, they prefer to be in the deeper layer rather than adjacent to a vacancy. In the novel structure (Fig. 4a), two VO's are located in the third oxygen layer rather than all in the subsurface, with a distance of 6.11 Å (VO2VO3_5N = 6.11 Å) between VO2 and VO3.
4. Discussion
4.1. Stability analysis based on DFT calculations
To gain a deeper understanding of the molecular mechanism behind the stability of VO's in the 3rd layer rather than the surface layer at higher vacancy concentrations, we focus on the A2233, A2222 and A1122 configurations at Θ = 1/4 (Fig. 4). In our analysis, we propose that the vacancy formation energy can be decomposed into two components:24 bond-breaking energy (Eb) and relaxation energy (Er): | (4) |
 is the energy of a configuration with n VO's and unrelaxed geometry and EO2 and
  are the total energies of the isolated O2 molecule and the pristine slab,
 | (5) |
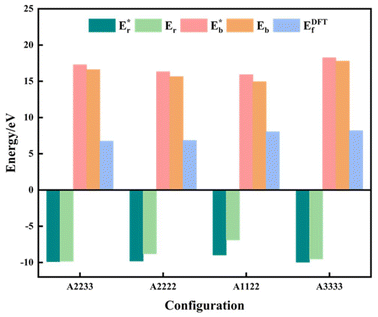
 is the energy of a configuration with n VO's and relaxed geometry, as shown in Fig. 5. The relaxation energies for A2233, A2222, and A1122 are −9.85 eV, −8.80 eV, −6.90 eV, respectively. When compared to Eb, it is evident that the larger Er, resulting from substantial geometric relaxation, is the primary driver behind the stability of the A2233 configuration. To further elucidate the impact of the relaxation, we also calculated Er and Eb for isolated VO's (Θ = 1/16) and considered the sum of the corresponding energies of isolated single VO's in the Amnpq configurations. As shown in Table S7 and Fig. S11,† the deeper the VO is located, the more significant Er and Eb become. When comparing an isolated subsurface VO to a surface VO, the relaxation energy gain increases (ΔEr = 0.41 eV) considerably more than bond-breaking energies (ΔEb = 0.21 eV). This indicates that structure relaxation is necessary for subsurface vacancy stabilization, in line with a previous study.24 Conversely, when the isolated VO is positioned in the 3rd layer, Eb is significantly enhanced (0.69 eV) compared to the surface VO, surpassing the increase in relaxation energy (0.45 eV). As a result, a single VO is favored to be distributed in the subsurface. In summary, there exists a competitive relationship between Er and Eb,24 where extensive geometric relaxation plays a pivotal role in determining the stability of VO's at different locations. For configurations Amnpq with four VO's, the Eb for A2233, A2222 and A1122 (Fig. 5) is approximately 1 eV lower than
  (sum of the corresponding energies of isolated single VO). Furthermore, the relaxation energy gains (|Er|) are reduced compared to isolated single VO's (
 ) due counteracting vacancy-induced relaxation effects with increasing coverage (from 1/16 to 1/4). However, the relaxation in configuration A2233 with 3rd layer VO's is only minimally impeded (0.03 eV) compared to A2222 (1 eV) and A1122 (2.08 eV), which contributes to the stability of A2233. The stronger relaxation in A2233 is reflected in the atomic displacements of surface Ce4+ ions nearest to the VO's. This distance is much larger for A2233 (0.49 Å) on average (purple atoms in Fig. 4) compared to those for A2222 (0.23 Å) and A1122 (0.14 Å). This is because Ce4+ ions nearest neighbor to the VO's tend to move away from VO site;25A2233 provides more space for the upward relaxation of the 6-fold coordinated surface Ce4+ ions due to the absence of a Ce–O bond at the opposite position, which is a distinct feature compared to A2222 and A1122 (Fig. 4). However, it is not the case that larger relaxation energy always leads to a more stable corresponding configuration. Based on our CE model, we sampled configurations with four vacancies in the third layer and predicted the stable configuration A3333, which was then verified by DFT (Fig. 4). Note that in all four configurations, Ce3+ ions are in next-nearest sites to the vacancies. Our analysis revealed that A2233 remains the most stable configuration, while A3333 is the least stable. Specifically, the Eb of A3333 (17.77 eV) is significantly higher compared to other configurations. Although Er of A3333 (−9.53 eV) is higher than those of A2222 (−8.80 eV) and A1122 (−6.90 eV), its overall stability is compromised due to its substantial Eb. Moreover, the Ce4+ ions directly above the oxygen vacancy in A3333 exhibit a stronger relaxation (0.43 Å) compared to those in A2222 (0.23 Å) and A1122 (0.14 Å). This indicates that while surface Ce4+ relaxation contributes to stability, the large bond-breaking energy in A3333 reduces its overall stability compared to A2233. Therefore, based on this analysis, at very low VO concentration, VO's tend to prefer the subsurface layer. As the concentration of VO's increases (from 1/16 to 1/4), the repulsion between VO's become significant, causing some VO's to migrate to the 3rd layer, where more relaxation space is available. However, due to their high bond-breaking energy associated with VO's in the 3rd layer, not all of VO's will migrate there. Note that already at Θ = 3/16, vacancies begin populating the 3rd layer (Table S8 and Fig. S12†). We also consider additional configurations in which the positions of Ce3+ remain unchanged with respect to those in A2233, A2222 and A1122, but those of the vacancies do not. They are either distributed in the surface and subsurface (A1122a) or scattered across the surface, subsurface, and third oxygen layer (A1223) (Fig. S13†). In these cases, the formation energy is higher than that of the A2233 configuration, and the relaxation is smaller (Table S8†). To rule out the migration of VO's to the fourth oxygen layer, we performed DFT+U calculations for some configurations with vacancies distributed in the fourth layer (Fig. S14†), and no configurations with lower formation energies were found. This further supports the stability of the A2233 configuration.
4.2. Monte Carlo sampling in a larger supercell based on the statistical-learning model
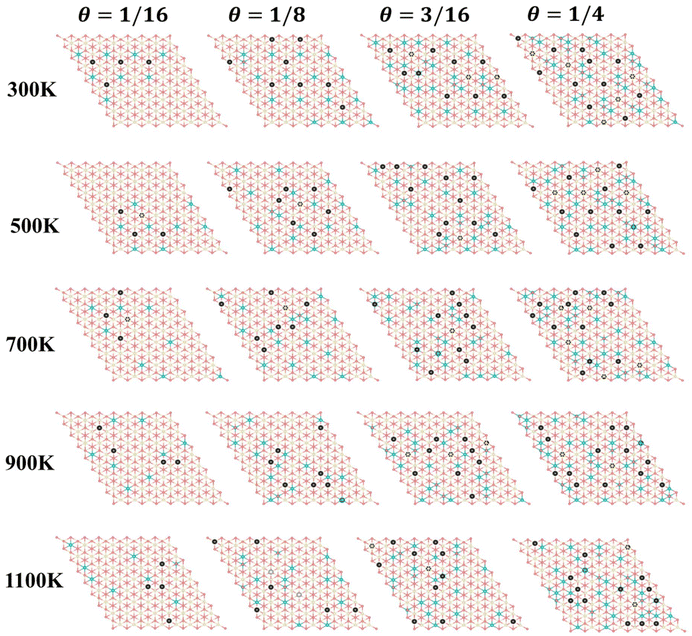
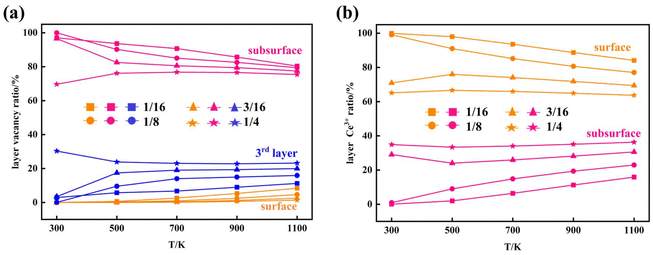
Furthermore, we performed simulations using a periodic slab with an 8 × 8 surface supercell of four O–Ce–O layers to sample the distribution of VO's at different temperatures (T = 300 K, 500 K, 700 K, 900 K, and 1100 K) and concentrations (Θ=1/16, 1/8, 3/16, and 1/4) using the Metropolis Monte Carlo (MC) algorithm in the canonical ensemble, where the volume of the simulation cell, the composition, and the temperature are held constant. Periodic boundary conditions are used in the simulation. This sampling algorithm generates a sequence of configurations by altering the current configuration at each step through one or more swaps of two randomly selected species within the substitutional lattice. Following a swap, the new proposed configuration with energy Ej is accepted with a probability | (6) |
We also note that an earlier STM experiment observed the abundance of surface VO's at moderate to high temperature.20 These experiments cannot characterize the VO's beyond the subsurface. The novel finding of the relatively higher stability of the 3rd layer VO's compared to surface VO's at the high VO's concentrations underscores the potential requirement to reconsider previous interpretations that neglected the possible existence of vacancies in the third oxygen layer.34 More sophisticated studies are needed in the future.
5. Conclusions
In summary, the reduced CeO2 surface is a complex system featuring oxygen vacancies, VO's, and Ce3+ ions with many-body interactions among them. Understanding these interactions is challenging without decoupling them into simpler one- and two-body terms. Through the application of the LASSO regression method and cluster expansion, we successfully achieved this decoupling with high accuracy. Among the total 3144 clusters representing many-body interactions, we identified 15 key clusters that play a predominant role in the configuration space. Our approach effectively addresses the challenge of sampling a large number of configurations and disentangling the many-body interactions among the Ce3+ ions and VO's. Our investigation revealed a tendency for VO's on the reduced CeO2(111) surface to aggregate into specific configurations with Ce3+ ions, favoring the VO positioning in the third oxygen layer. This phenomenon primarily stems from the significant lattice relaxation effect. This research reshapes the fundamental understanding of ceria surface structures and lays a solid foundation for further active learning when extending the approach to other Ce-related oxides. Moreover, the coupled statistical-learning and cluster expansion method demonstrated here can be readily adapted to study other metal oxides with well-defined lattice structures.Author contributions
Y. G. conceived the original idea. H. L., M. V. G. P., and Y. G. supervised the project. Y. Z. performed the DFT calculations. Y. Z., Z.-K. H., and X. H. performed the statistical learning and CE calculations. Y. Z. analyzed the data. Z.-K. H., B. Z., and X. H. helped to analyze the data. M. T., S. R., and C. D. developed the program code. Y. Z. wrote the initial draft of the manuscript. M. V. G. P. and Y. G. assisted in interpreting the results and revising the manuscript. All authors contributed to discussions and provided critical feedback.Data availability
The CELL code is available via the Python Package Index (PyPI) repository at https://pypi.org/project/clusterX/. Data of statistical learning can be found at https://doi.org/:10.17172/NOMAD/2024.05.08-1.Conflicts of interest
The authors declare no conflicts of interest.Acknowledgements
Y. G. acknowledges the support of the National Key R&D Program of China (2023YFA1506900), the National Natural Science Foundation of China (12174408), the Natural Science Foundation of Shanghai (22JC1404200), and the Foundation of Key Laboratory of Low-Carbon Conversion Science & Engineering, Shanghai Advanced Research Institute, Chinese Academy of Sciences (KLLCCSE-202201Z, SARI, CAS). H. L. acknowledges the funding support from the National Key R&D Program of China (2022YFA1504001) and the National Natural Science Foundation of China (22288102, 21935001). M. V. G. P. acknowledges the support of the Grant PID2021-128915NB-I00 funded by MCIN/AEI/10.13039/501100011033 and by ERDF, UE. All calculations were performed at National Supercomputer Centers in Tianjin, Shanghai and Guangzhou.References
- J. A. Rodriguez, S. Ma, P. Liu, J. Hrbek, J. Evans and M. Pérez, Science, 2007, 318, 1757–1760 CrossRef CAS.
- S. Park, J. M. Vohs and R. J. Gorte, Nature, 2000, 404, 265–267 CrossRef CAS.
- Q. Fu, H. Saltsburg and M. Flytzani-Stephanopoulos, Science, 2003, 301, 935–938 CrossRef CAS.
- G. A. Deluga, J. R. Salge, L. D. Schmidt and X. E. Verykios, Science, 2004, 303, 993–997 CrossRef CAS.
- C. T. Campbell and C. H. F. Peden, Science, 2005, 309, 713–714 CrossRef CAS PubMed.
- X. Q. Wang, J. A. RodriguezJonathan, J. C. HansonDaniel, D. Gamarra, A. Martínez-Arias and M. Fernández-Garcíaet, J. Phys. Chem. B, 2006, 110, 428–434 CrossRef CAS.
- R. J. Gorte, AIChE J., 2010, 56, 1126–1135 CrossRef CAS.
- J. A. Rodriguez, P. Liu, J. Hrbek, J. Evans and M. Pérez, Angew. Chem., Int. Ed., 2007, 46, 1329–1332 CrossRef CAS PubMed.
- A. Bruix, J. A. Rodriguez, P. J. Ramírez, S. D. Senanayake, J. Evans, J. B. Park, D. Stacchiola, P. Liu, J. Hrbek and F. Illas, J. Am. Chem. Soc., 2012, 134, 8968–8974 CrossRef CAS PubMed.
- M. Capdevila-Cortada, M. García-Melchor and N. López, J. Catal., 2015, 327, 58–64 CrossRef CAS.
- H. Nörenberg and G. A. D. Briggs, Surf. Sci., 1999, 424, L352–L355 CrossRef.
- K.-I. Fukui, Y. Namai and Y. Iwasawa, Appl. Surf. Sci., 2002, 188, 252–256 CrossRef CAS.
- R. Olbrich, G. E. Murgida, V. Ferrari, C. Barth, A. M. Llois, M. Reichling and M. V. Ganduglia-Pirovano, J. Phys. Chem. C, 2017, 121, 6844–6851 CrossRef CAS.
- S. Gritschneder and M. Reichling, Nanotechnology, 2007, 18, 044024 CrossRef.
- S. Gritschneder, Y. Namai, Y. Iwasawa and M. Reichling, Nanotechnology, 2005, 16, S41–S48 CrossRef CAS.
- S. Torbrügge, M. Cranney and M. Reichling, Appl. Phys. Lett., 2008, 93, 073112 CrossRef.
- F. Šutara, M. Cabala, L. Sedláček, T. Skála, M. Škoda, V. Matolín, K. C. Prince and V. Cháb, Thin Solid Films, 2008, 516, 6120–6124 CrossRef.
- M. Škoda, M. Cabala, I. Matolínová, K. C. Prince, T. Skála, F. Šutara, K. Veltruská and V. Matolínet, J. Chem. Phys., 2009, 130, 034703 CrossRef PubMed.
- D. C. Grinter and G. Thornton, J. Phys.: Condens. Matter, 2022, 34, 253001 CrossRef CAS PubMed.
- F. Esch, S. Fabris, L. Zhou, T. Montini, C. Africh, P. Fornasiero, G. Comelli and R. Rosei, Science, 2005, 309, 752–755 CrossRef CAS PubMed.
- S. Torbrügge, M. Reichling, A. Ishiyama, S. Morita and Ó. Custance, Phys. Rev. Lett., 2007, 99, 056101 CrossRef PubMed.
- N. V. Skorodumova, S. I. Simak, B. I. I. Lundqvist, A. Abrikosov and B. Johansson, Phys. Rev. Lett., 2002, 89, 166601 CrossRef CAS.
- H.-Y. Li, H.-F. Wang, X.-Q. Gong, Y.-L. Guo, Y. Guo, G. Z. Lu and P. Hu, Phys. Rev. B: Condens. Matter Mater. Phys., 2009, 79, 193401 CrossRef.
- M. V. Ganduglia-Pirovano, J. L. F. D. Silva and J. Sauer, Phys. Rev. Lett., 2009, 102, 026101 CrossRef PubMed.
- G. E. Murgida and M. V. Ganduglia-Pirovano, Phys. Rev. Lett., 2013, 110, 246101 CrossRef PubMed.
- J. Kullgren, M. J. Wolf, C. W. M. Castleton, P. Mitev, W. J. Briels and K. Hermansson, Phys. Rev. Lett., 2014, 112, 156102 CrossRef CAS PubMed.
- X.-P. Wu and X.-Q. Gong, Phys. Rev. Lett., 2016, 116, 086102 CrossRef PubMed.
- M. J. Wolf, J. Kullgren and K. Hermansson, Phys. Rev. Lett., 2016, 117, 279601 CrossRef PubMed.
- X.-P. Wu and X.-Q. Gong, Phys. Rev. Lett., 2016, 117, 279602 CrossRef.
- J. Kullgren, M. J. Wolf, P. D. Mitev, K. Hermansson and W. J. Briels, J. Phys. Chem. C, 2017, 121, 15127–15134 CrossRef CAS.
- J.-F. Jerratsch, X. Shao, N. Nilius, H.-J. Freund, C. Popa, M. V. Ganduglia-Pirovano, A. M. Burow and J. Saueret, Phys. Rev. Lett., 2011, 106, 246801 CrossRef PubMed.
- V. C. Birschitzky, F. Ellinger, U. Diebold, M. Reticcioli and C. Franchini, npj Comput. Mater., 2022, 8, 125 CrossRef.
- V. C. Birschitzky, I. Sokolović, M. Prezzi, K. Palotás, M. Setvín, U. Diebold, M. Reticcioli and C. Franchini, npj Comput. Mater., 2024, 10, 89 CrossRef CAS.
- Z.-K. Han, Y.-Z. Yang, B. Zhu, M. V. Ganduglia-Pirovano and Y. Gao, Phys. Rev. Mater., 2018, 2, 035802 CrossRef CAS.
- G. Kresse and J. Furthmüller, Phys. Rev. B: Condens. Matter Mater. Phys., 1996, 54, 11169–11186 CrossRef CAS.
- J. P. Perdew, K. Burke and M. Ernzerhof, Phys. Rev. Lett., 1996, 77, 3865–3868 CrossRef CAS.
- S. L. Dudarev, G. A. Botton, S. Y. Savrasov, C. J. Humphreys and A. P. Sutton, Phys. Rev. B: Condens. Matter Mater. Phys., 1998, 57, 1505–1509 CrossRef CAS.
- M. Cococcioni and S. D. Gironcoli, Phys. Rev. B: Condens. Matter Mater. Phys., 2005, 71, 035105 CrossRef.
- D. W. Zhang, Z.-K. Han, G. E. Murgida, M. V. Ganduglia-Pirovano and Y. Gao, Phys. Rev. Lett., 2019, 122, 096101 CrossRef CAS.
- P. E. Blöchl, Phys. Rev. B: Condens. Matter Mater. Phys., 1994, 50, 17953–17979 CrossRef.
- G. Kresse and D. Joubert, Phys. Rev. B: Condens. Matter Mater. Phys., 1999, 59, 1758–1775 CrossRef CAS.
- Cell documentation, https://sol.physik.hu-berlin.de/cell.
- S. Rigamonti, M. Troppenz, M. Kuban, A. Hübner and C. Draxl, NPJ Comput. Mater., 2024, 10, 195 CrossRef CAS.
- M. C. Nguyen, X. Zhao, C.-Z. Wang and K.-M. Ho, J. Appl. Phys., 2015, 117, 093905 CrossRef.
- M. Troppenz, S. Rigamonti and C. Draxl, Chem. Mater., 2017, 29, 2414–2424 CrossRef CAS.
- Z.-K. Han, D. Sarker, M. Troppenzet, S. Rigamonti, C. Draxl, W. A. Saidi and S. V. Levchenko, J. Appl. Phys., 2020, 128, 145302 CrossRef CAS.
- J. M. Sanchez, F. Ducastelle and D. Gratias, Phys. A, 1984, 128, 334–350 CrossRef.
- D. Sarker, Z.-K. Han and S. V. Levchenko, Phys. Rev. Mater., 2023, 7, 055802 CrossRef CAS.
- G. E. Murgida, V. Ferrari, A. M. Llois and M. V. Ganduglia-Pirovano, Phys. Rev. Mater., 2018, 2, 083609 CrossRef.
- G. E. Murgida, V. Ferrari, M. V. Ganduglia-Pirovano and A. M. Llois, Phys. Rev. B: Condens. Matter Mater. Phys., 2014, 90, 115120 CrossRef.
- R. Tibshirani, J. R. Stat. Soc.: Ser. B (Methodol.), 1996, 58, 267–288 CrossRef.
- L. Barroso-Luque, P. C. Zhong, J. H. Yang, F. Y. Xie, T. Chen, B. Ouyang and G. Ceder, Phys. Rev. B, 2022, 106, 144202 CrossRef CAS.
- Y. F. Wang, Y.-Q. Su, E. J. M. Hensen and D. G. Vlachos, ACS Nano, 2020, 14, 13995–14007 CrossRef CAS PubMed.
- H. Bhattacharjee, N. Anesiadis and D. G. Vlachos, Sci. Rep., 2021, 11, 14372 CrossRef CAS PubMed.
- Y. J. Hu, G. Zhao, M. F. Zhang, B. Bin, T. D. Rose, Q. Zhao, Q. Zu, Y. Chen, X. K. Sun, M. D. Jong and L. Qi, npj Comput. Mater., 2020, 6, 25 CrossRef CAS.
Footnote |
| † Electronic supplementary information (ESI) available. See DOI: https://doi.org/10.1039/d4nr04591b |
| This journal is © The Royal Society of Chemistry 2025 |

