DOI:
10.1039/D5NR00287G
(Paper)
Nanoscale, 2025,
17, 6580-6592
Zn0.5Cd0.5Se quantum dot-integrated MOF-derived C/N–CeO2 photocatalyst for enhanced H2O2 production and O2 evolution reactions†
Received
20th January 2025
, Accepted 2nd February 2025
First published on 19th February 2025
Abstract
Herein, a rational strategy is presented to reduce the sluggish reaction kinetics and inefficient charge carrier separation of heterojunctions while enhancing their opto-electronic properties. A 1D–0D heterojunction, i.e., MOF-derived C/N–CeO2/Zn0.5Cd0.5Se quantum dot (CZCSe-1) hybrid material, was constructed to address the limitations associated with the H2O2 production and O2 evolution reactions through a facile reflux treatment. As anticipated, the optimised CZCSe-1 composite exhibited an impressive H2O2 production rate of 2820.43 μmol g−1 h−1, which was 1.7- and 2.1-fold higher than those of pristine C/N–CeO2 and ZCSe, respectively, and it exhibited stability up to four cycles. Additionally, an O2 evolution rate of 234.89 mmol g−1 h−1 was recorded for CZCSe-1, which showed superior activity over other materials previously reported in the literature. It was revealed that the outstanding photocatalytic performance was attributed to the effective anchoring of 0D ZCSe onto vacancy-rich C/N–CeO2 nanorods, displaying improved charge separation as obtained from the Pl, EIS, TPC and maximized redox capability analyses. The charge transfer dynamics in the CZCSe-1 composite via the S-scheme heterojunction was further investigated through free radical detection (ESR analysis) and work function study (VB-XPS). This work offers a new approach for optimizing economic metal oxide-based photocatalysts for H2O2 production and other applications.
1. Introduction
Hydrogen peroxide (H2O2) is an essential chemical with wide range of applications in organic synthesis, chemical industry, and environmental remediation.1 Recently, H2O2 has received great attention as a potential substitute for electricity generation and as a novel energy storage mechanism.2 The huge demand for H2O2 has directed attention towards its synthetic route; meanwhile, 95% of H2O2 is produced via the indirect oxidation of anthraquinone, which is an energy-intensive reaction and emits toxic by-products.1,3–6 As a greener alternative, photocatalytic production of H2O2 using semiconductor catalysts is convincing because it uses water and oxygen as the chemical source and sunlight as the energy input.7 At present, the photocatalytic H2O2 production process is limited by the narrow solar light adsorption range, inefficient charge carrier separation, and sluggish reaction kinetics.8 At the same time, artificial photosynthesis and photoelectrochemical water splitting benefit significantly from O2 evolution.9 Thereby, the ingenious design of photocatalysts with suitable band gaps, high conductivity, and robust kinetics is highly desirable.
Out of the plentiful semiconducting materials, metal oxides are high-performance photocatalysts owing to their inherent properties like stability, natural abundance, non-toxicity, and low cost.6,10–15 In particular, CeO2 is less explored in the area of photocatalytic H2O2 production because it mostly responds to UV light owing to its wide band gap (3.1–3.3 eV).9,13 Therefore, adopting suitable methods for CeO2 synthesis over conventional ones can be more beneficial in terms of narrow band gap, porosity, specific surface area, and stability.12,16 Furthermore, unique properties like ultra-high specific surface area, exceptional porosity, structural diversity, and chemical and thermal stability have made metal–organic frameworks (MOFs) an ideal template material to derive metal oxides while preserving their structural traits.12,16,17 Additionally, nonmetals (such as N and S) doped from the MOF precursor in the derived system enhance the visible light absorption capacity by narrowing the band gap compared to the traditionally prepared metal oxides.17 Nevertheless, the photogenerated e− and h+ in individual CeO2 tend to recombine, which in turn reduces the photocatalytic efficacy.9 Therefore, achieving effective spatial exciton separation while maintaining the potent redox capability of the photocatalyst is the key to enhancing H2O2 production and O2 evolution. In this regard, an S-scheme heterojunction represents a two-in-one approach towards efficient charge segregation and robust redox capabilities.
The S-scheme heterojunction usually consists of photocatalysts for both reduction and oxidation processes, each having a different work function and staggered band structure. Unequal Fermi levels induce the energy band bending followed by the formation of a built-in-electric field, both acting as the driving force for the transport of photogenerated charge carriers.18 Consequently, the photogenerated e− and h+ on the semiconductor, which possess stronger redox abilities, remain available to participate in the respective photoreactions by the accumulation of ineffective excitons. Further, semiconductor quantum dots (QDs) have become a renowned photocatalytic nanomaterial owing to the size-dependent bandgap, quantum confinement effect, high photoluminescence quantum yield, easy surface modification, multiple exciton generation, high surface-to-volume ratio and exceptional stability.5,18–20 Zn0.5Cd0.5Se (ZCSe), a representative alloyed quantum dot, exhibits a narrow bandgap in the visible region, quantum size effect, photochemical stability, and competing optoelectrical properties.21 As compared to C/N–CeO2, ZCSe acts as a more powerful reduction photocatalyst, and its integration with the MOF-derived C/N–CeO2 is expected to build a desirable S-scheme heterojunction with effective separation of efficient photoexcited charge carriers.3,22–24
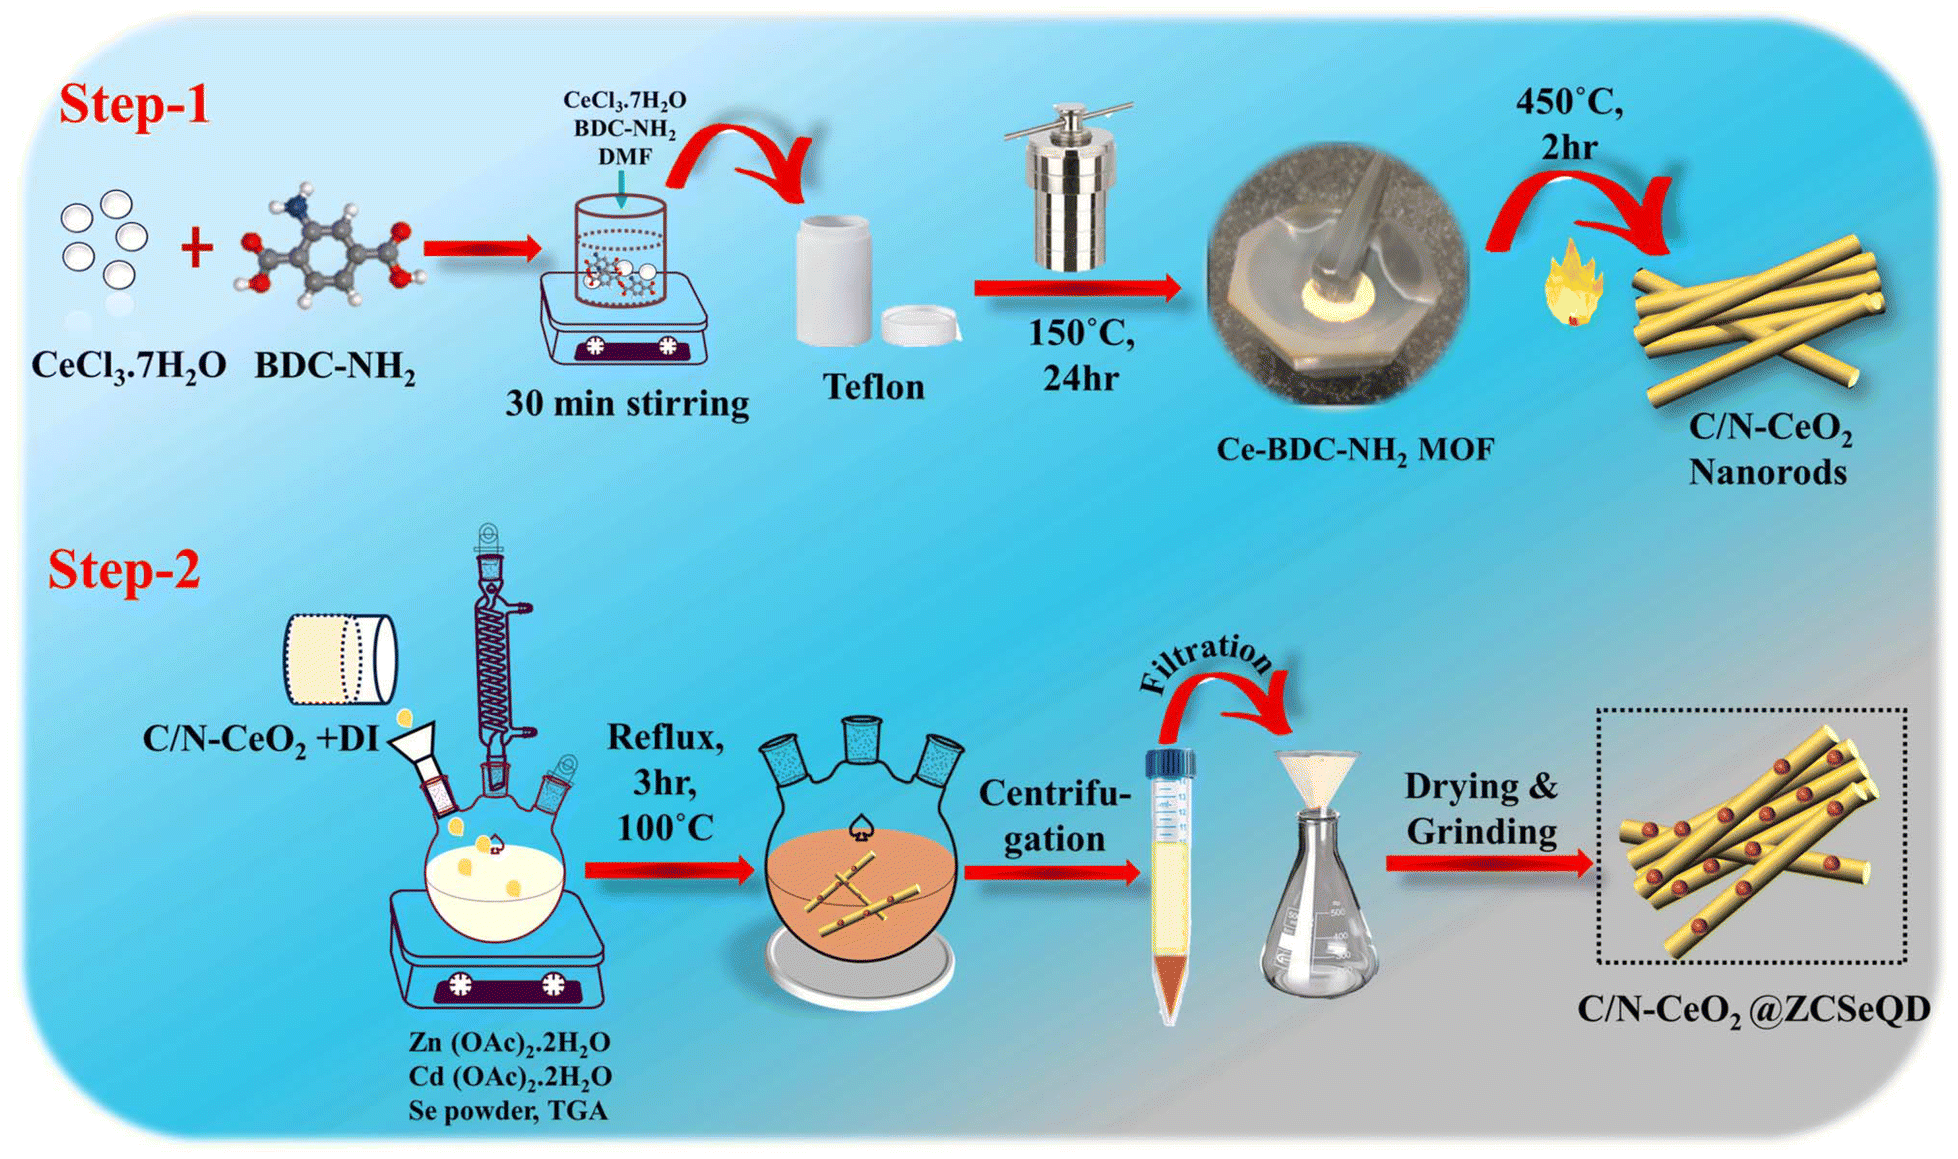
To achieve the aforementioned objectives, we herein synthesized Ce–MOF via a simple solvothermal technique. Subsequently, C/N–CeO2 was obtained by annealing the as-synthesized Ce–MOFs in a muffle furnace for 2 h at 450 °C under an ambient air atmosphere. Finally, the ZCSe-anchored defect-induced C/N–CeO2 nanohybrid was fabricated by a facile one-pot method utilizing TGA as a capping agent, represented schematically in Scheme 1. The opposing surface charges of the constituent materials, suitable energy level positions, and superior charge transfer efficiency are considered the three pillars of the fabricated binary hybrid. Notably, under visible light (λ > 420 nm), the CZCSe-1 sample presents the optimal H2O2 and O2 production rates of 2820.43 μmol g−1 h−1 and 234.89 mmol g−1 h−1, respectively, with stability up to the fourth cycle of photocatalytic reactions. The boosted performance demonstrated by the best photocatalyst, CZCSe-1, could be ascribed to the larger active surface area, higher life span of the excitons, presence of oxygen vacancies (OVs), and higher photo response. The reaction pathway was confirmed by an active species trapping experiment and ESR results. Thus, this work offers a novel perspective on the pathway for developing advanced S-scheme-based systems for a wide variety of photocatalytic applications.
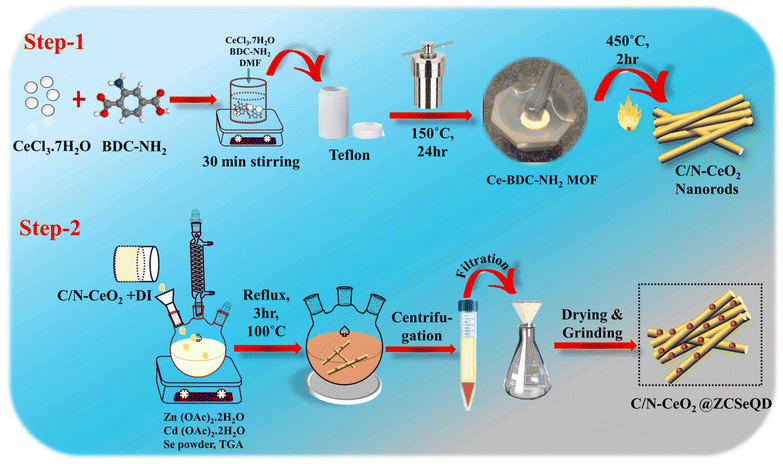 |
| | Scheme 1 Schematic of the synthesis method of (Step-1) C/N–CeO2 and (Step-2) CZCSe composites. | |
2. Results and discussion
2.1. Synthesis and characterization
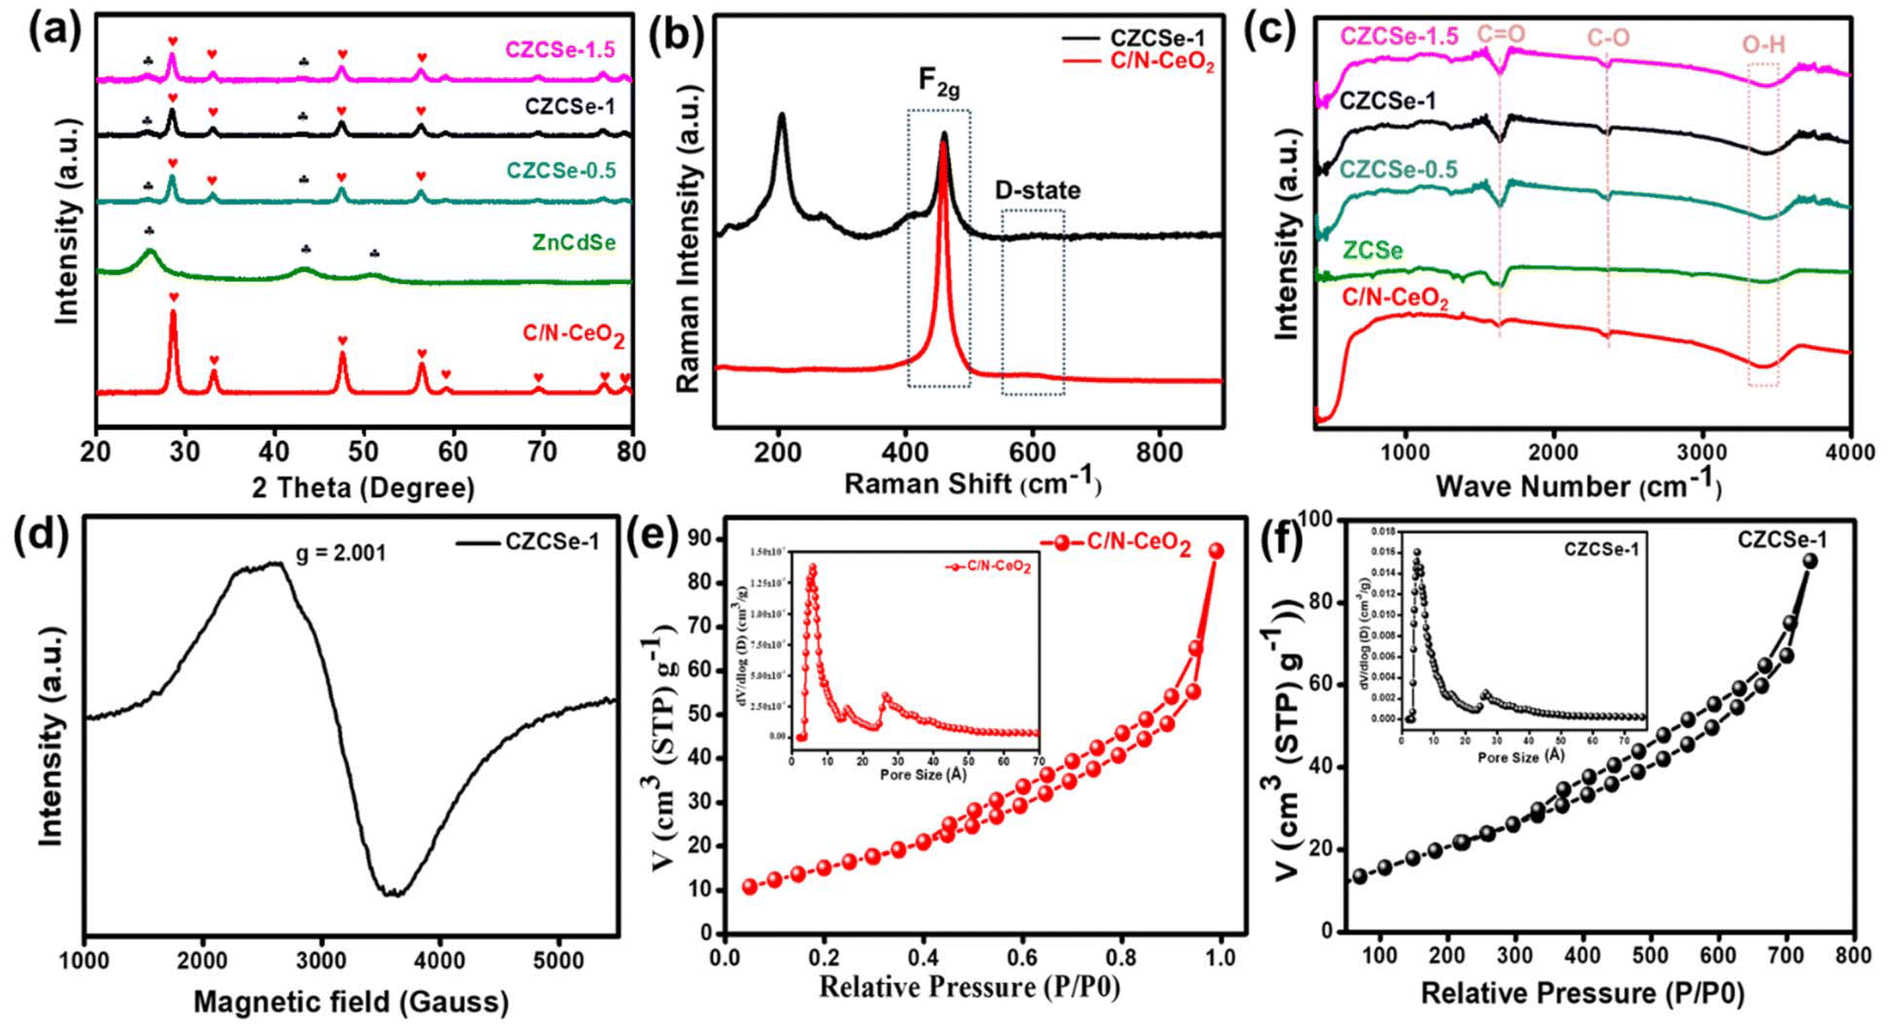
Typically, CZCSe-x could be obtained via a reflux treatment, where the ZCSe gets deposited on the C/N–CeO2, which is obtained from the pyrolysis of Ce–MOF at 450 °C.5,25 As a result, a dark maroon product well dispersed in water was obtained, which is required for various photocatalytic applications like O2 reduction reaction and O2 evolution reaction via water splitting. The structural formation was confirmed by X-ray diffraction (XRD) patterns and Raman spectra, as shown in Fig. 1(a) and (b), respectively. Fig. 1(a) displays the dominant CeO2 diffraction peaks located at 2θ = 28.6°, 33.1°, 47.6°, and 56.4°, corresponding to the (111), (200), (220), and (311) crystal planes, respectively, which were obtained in pristine C/N–CeO2 and CZCSe-x composites.9,13,25 Furthermore, the distinct peaks for neat ZCSe obtained at around 2θ = 26°, 43.3°, and 51° were well indexed to the (111), (220), and (311) crystal planes, respectively.26,27 Interestingly, the intensity of peaks at 26°, 43.3°, and 51° increases with the increased amount of ZCSe in composites, which indicates the successful fabrication of the CZCSe-x composites. A close inspection of the XRD profile reveals that the peak intensities of CeO2 in the composites became weaker and slightly shifted to smaller angles as compared to that of the parent materials, signifying uniform distribution of ZCSe QDs on C/N–CeO2 nanorods.28 No other prominent peak in the XRD pattern of the composites was found, which suggested the good crystallinity and high purity of the samples.28 In addition, the XRD spectrum of C/N–CeO2 was compared with neat CeO2 (Fig. S1(b and c)†). The observed shifting of the peak position to higher angles was attributed to the lattice strain caused by smaller ionic radii of C and N, which indicates the doping of nonmetals.29–31 Further, Raman analysis was proposed to assess the microstructural imperfection in the crystal. The characteristic peak at 464 cm−1 was particularly ascribed to the F2g band, while the D-band (defect band) of C/N–CeO2 was verified by the peaks at 273 cm−1 and 587.5 cm−1.9,25 In addition, the broad peak at around 200–240 cm−1 in CZCSe-1 could be due to the first longitudinal optical phonon (1LO) mode of CdSe (207 cm−1) and phonon modes of ZnSe (243 cm−1).21,32,33 Further, the analysis confirmed that the slight deviation in the peak position of CZCSe-1 is due to lattice expansion and defect generation.9Fig. 1(c) shows the FTIR spectra of all the synthesized materials. According to the literature, the broad band in the spectra (3350–3500 cm−1) of all synthesized materials appeared mainly due to stretching vibrations of O–H and N–H bonds.25,34 The band at around 460 cm−1 is due to the deformation mode of the Ce–O bond.35 A peak at around 2350 cm−1 reveals the stretching vibration of C–O adsorbed from the atmospheric CO2, whereas the other peak at approximately 1640 cm−1 indicates the stretching vibration of the C![[double bond, length as m-dash]](https://www.rsc.org/images/entities/char_e001.gif) O group of TGA.35,36 Additionally, Fig. 1(d) displays the electron spin resonance (ESR) spectrum of CZCSe-1, which characterizes the presence of oxygen vacancies. Herein, a specific response close to the g value of 2.001 in CZCSe-1 was observed. In CeO2, Ce is mostly present in its stable oxidation state, i.e., Ce4+. When Ce4+ is reduced to Ce3+ due to defect formation (oxygen vacancy), the unpaired electron in the 4f orbital of the Ce3+ ion contributes to the ESR signal. In addition, oxygen vacancies in CeO2 create localized unpaired electrons that are trapped in the vacancy site. Thus, the peak represents the overlapping peak in the ESR spectra.25,37 Besides, for C/N–CeO2, a strong symmetrical signal was observed at 340 mT, corresponding to g ∼ 1.97 (Fig. S2†). This suggested an ideal paramagnetic centre formed by the trapping of an electron near the surface of the redox couple (Ce3+/Ce4+) to form Ce4+–VO–Ce3+.38
O group of TGA.35,36 Additionally, Fig. 1(d) displays the electron spin resonance (ESR) spectrum of CZCSe-1, which characterizes the presence of oxygen vacancies. Herein, a specific response close to the g value of 2.001 in CZCSe-1 was observed. In CeO2, Ce is mostly present in its stable oxidation state, i.e., Ce4+. When Ce4+ is reduced to Ce3+ due to defect formation (oxygen vacancy), the unpaired electron in the 4f orbital of the Ce3+ ion contributes to the ESR signal. In addition, oxygen vacancies in CeO2 create localized unpaired electrons that are trapped in the vacancy site. Thus, the peak represents the overlapping peak in the ESR spectra.25,37 Besides, for C/N–CeO2, a strong symmetrical signal was observed at 340 mT, corresponding to g ∼ 1.97 (Fig. S2†). This suggested an ideal paramagnetic centre formed by the trapping of an electron near the surface of the redox couple (Ce3+/Ce4+) to form Ce4+–VO–Ce3+.38
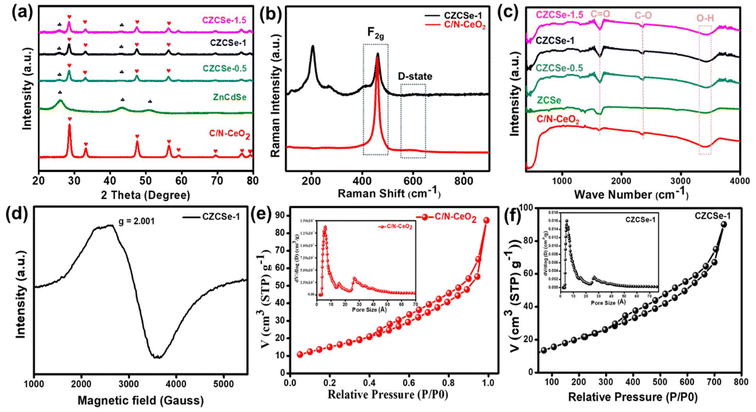 |
| | Fig. 1 (a) XRD spectra of C/N–CeO2, ZCSe, and CZCSe-x composites, (b) Raman spectra of C/N–CeO2 and CZCSe-1, (c) FT-IR spectra of C/N–CeO2, ZCSe, and CZCSe-x composites, (d) EPR spectrum of CZCSe-1, and (e) and (f) BET and BJH plots of C/N–CeO2 and CZCSe-1. | |
The porosity and specific surface area were determined by measuring the nitrogen sorption isotherms on fully activated samples at 77 K. The Brunauer–Emmett–Teller (BET) surface area of CZCSe-1 was determined to be 80.2 m2 g−1, which was notably higher than that of neat C/N–CeO2 (57.5 m2 g−1) and ZCSe (59.65 m2 g−1), as shown in Fig. 1(e and f) and in Fig. S3.† Moreover, CZCSe-1 exhibited a type-IV isotherm (H3 hysteresis loop), with many mesopores (size <50 nm), in agreement with the pore size distribution curve.9,12,25 The high surface area of the photocatalyst CZCSe-1 estimated the presence of more exposed reaction sites, which probably played a key role in the adsorption and activation of the reduced molecules. However, the neat C/N–CeO2 and ZCSe displayed a type-IV isotherm showing a micro- and meso-porous architecture.
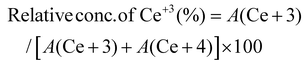
Typically, the surface elemental composition and oxygen vacancies (OVs) of the photocatalysts are examined by X-ray photoelectron spectroscopy (XPS). The XPS survey spectra in Fig. S4† reveal the presence of C, N, Ce, and O in C/N–CeO2 and C, N, Ce, O, Zn, Cd, and Se in CZCSe-1. In Fig. 2(a), three distinct peaks at 284.6, 285.9, and 289.0 eV are ascribed to the CC, C–N, and C–OH bonds of C 1s, while the core level N 1s XPS spectra (Fig. 2(b)) deconvoluted into two peaks at 399.2 eV and 401.1 eV, confirming the substitutional nitrogen in the O–Ce–N structure and the interstitial N state in the sample, respectively.4,6,9,10,25,37,39 Moreover, two types of deconvoluted peaks are observed in the O 1s spectra (Fig. 2(c)), and the peaks at 529.2 and 531.0 eV are assigned to the C–O and OVs species, respectively.6,9,25 The OV peak in the CZCSe-1 composite is notably amplified, which is required to supply additional adsorption sites for the photocatalytic activity.13,25,40 The spin–orbit coupling between the 3d5/2 (represented as U) and 3d3/2 (represented as V) term symbols may be responsible for the complex XPS spectra of Ce 3d (Fig. 2(d)). The V′ and U′ peaks are assigned to Ce in the +3 oxidation state, while all other peaks are assigned to Ce in the +4 oxidation state.16,17 By calculating the area under each peak in the Ce 3d spectrum and using eqn (1), the relative concentration of Ce3+ to Ce4+ in CZCSe-1 was determined to be nearly 34%, which was around 22% in the case of pristine C/N–CeO2.41 This result confirms that CZCSe-1 contains a significant number of OVs, as previously revealed by Raman and EPR studies.
| |  | (1) |
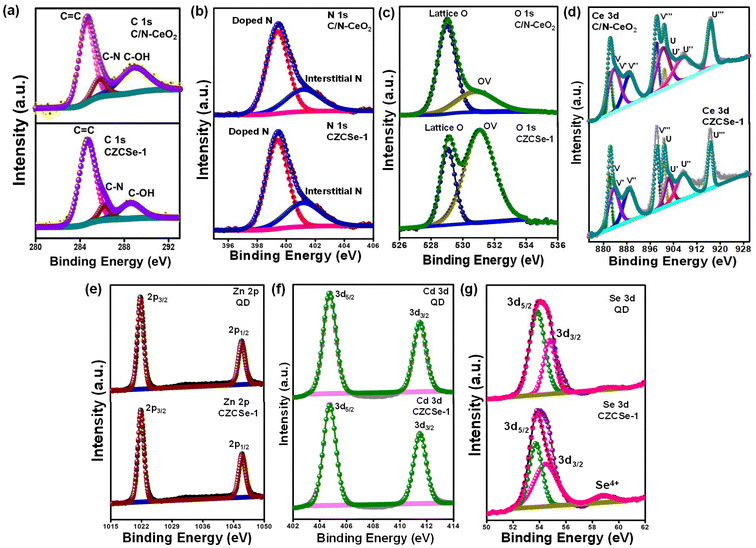 |
| | Fig. 2 High resolution XPS spectra of C/N–CeO2, ZCSe, and CZCSe-1: (a) C 1s, (b) N 1s, (c) O 1s, (d) Ce 3d, (e) Zn 2p, (f) Cd 3d, and (g) Se 3d. | |
Moreover, the peaks at 1044.8 and 1021.7 eV correspond to Zn 2p1/2 and Zn 2p3/2 of Zn2+ in ZCSe (Fig. 2(e)), and the peaks at 411.8 and 405.0 eV can be attributed to Cd 3d3/2 and Cd 3d5/2 of Cd2+ (Fig. 2(f)).19,21 In the XPS spectra of Se 3d, the binding energy of the two peaks at 54.5 and 53.7 eV can be attributed to Se 3d3/2 and Se 3d5/2 (Fig. 2(g)).21 Notably, in CZCSe-1, one prominent peak was observed at 59.3 eV in the Se 3d spectra corresponding to Se4+, which offers extra electronic states in the bandgap of materials, thereby narrowing the bandgap and enhancing the photocatalytic activity due to the extended absorption range.
Moreover, the transport of electrons at the interface of the composite material CZCSe-1 can be explored by analyzing the XPS spectra. As observed from the individual spectrum, there is a slight +ve deviation of Ce, O, and C than that of pristine C/N–CeO2 and a slight −ve deviation of Cd, Zn, and Se that that of neat ZCSe in terms of the binding energy values, which represents a change in the electron density of distinct materials inside the heterostructure due to the transfer of electrons from C/N–CeO2 to ZCSe. This lowers the binding energy value by increasing the electron density on the ZCSe surface and vice versa.25,42 These findings corroborate the XRD analysis by confirming the effective interaction of two pure materials and the construction of an n–n heterojunction. Moreover, zeta potential measurements show that ZCSe has a negative surface charge while the pristine C/N–CeO2 carries a positive surface charge (Fig. S5†), indicating that both display strong electrostatic attraction towards each other, which is valuable for the n–n binary hybrid formation.25
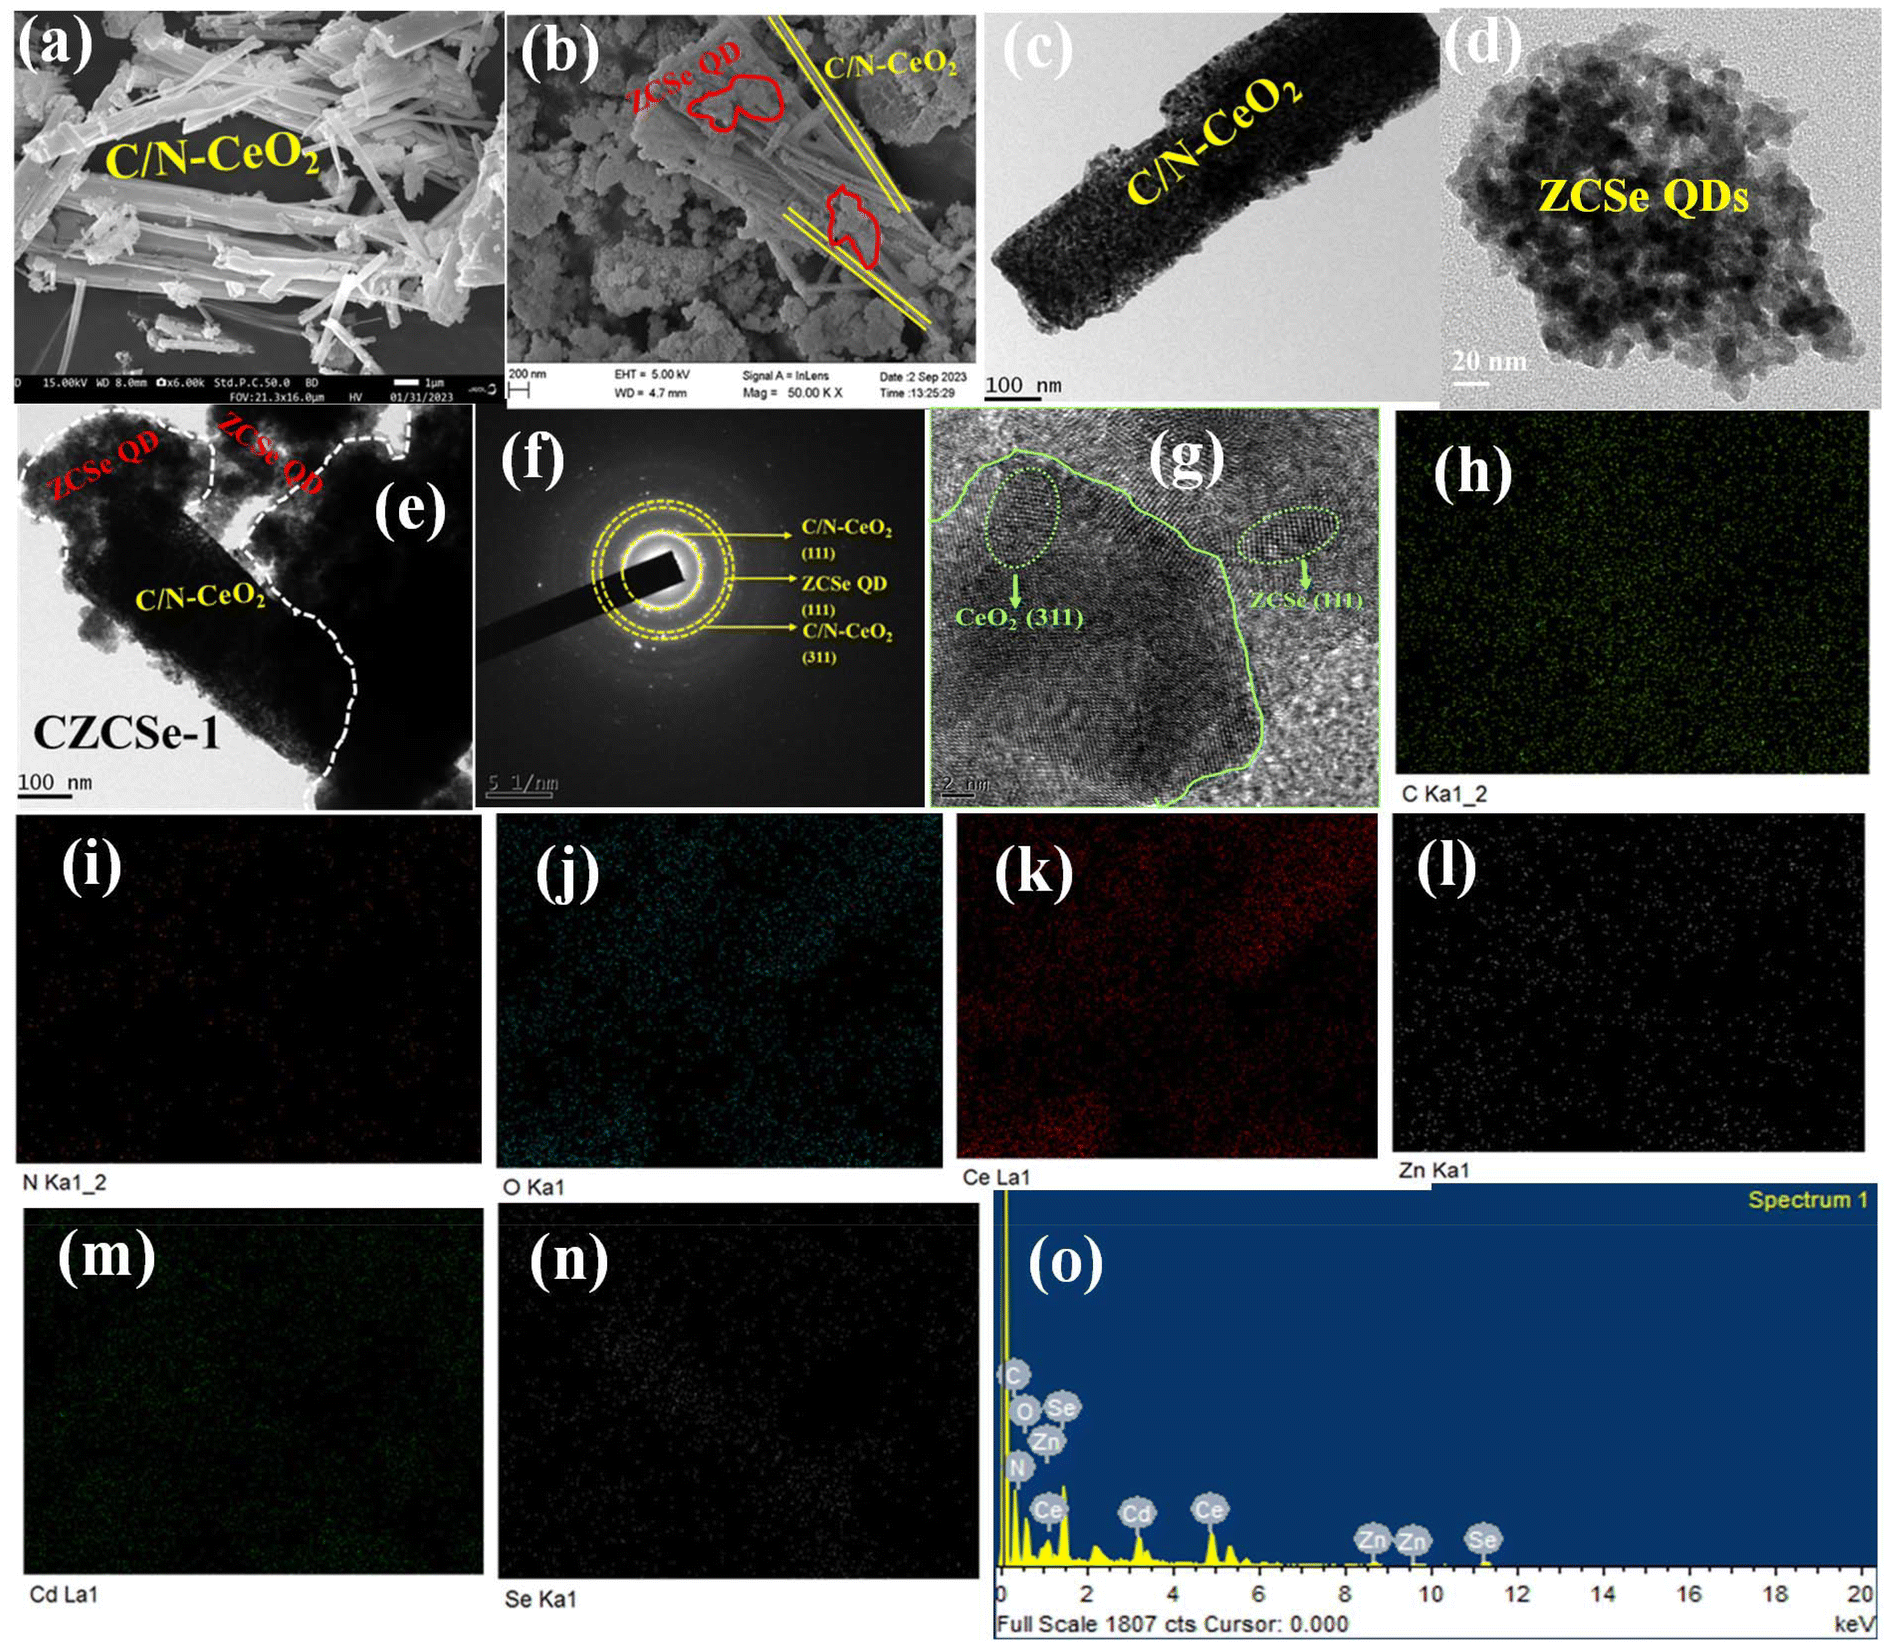
Further, to elucidate the role of ZCSe on C/N–CeO2 nanorods during crystal growth, we monitored the morphology of the hybrid composite using FESEM. In Fig. 3(a), the morphology of pristine C/N–CeO2 exhibits a rod-like structure. Additionally, the morphology of the hybrid composite CZCSe-1, as shown in Fig. 3(b), illustrates bundles of C/N–CeO2 nanorods enwrapped with multiple dots, thereby undoubtedly indicating the formation of the CZCSe-1 heterostructure, as further confirmed by transmission electron microscopy (TEM) analysis (Fig. 3(c–e)). The SAED pattern shown in Fig. 3(f) confirms the polycrystalline property of the material with the ring designated to the (111) and (311) plane of C/N–CeO2 and the (111) plane of ZCSe, as verified from the XRD analysis.21,25 Furthermore, the close interfacial interaction between C/N–CeO2 and ZCSe is revealed by the HRTEM image shown in Fig. 3(g), with lattice fringes of 0.32 and 0.33 nm, which correspond to (311) and (111), respectively.21 Also, the FESEM–EDX color mapping (Fig. 3(h–n)) and elemental spectra (Fig. 3(o)) confirm the presence of C, N, Ce, O, Cd, Zn, and Se elements in our fabricated material, in agreement with the XPS results.
 |
| | Fig. 3 FESEM images of (a) C/N–CeO2 and (b) CZCSe-1, TEM images of (c) C/N–CeO2, (d) ZCSe, and (e) CZCSe-1, (f) SAED pattern of CZCSe-1, (g) HRTEM image of CZCSe-1, (h–n) elemental colour mapping, and (o) spectra of CZCSe-1. | |
3. Photocatalytic activity
3.1. Photocatalytic H2O2 production (PHPP)
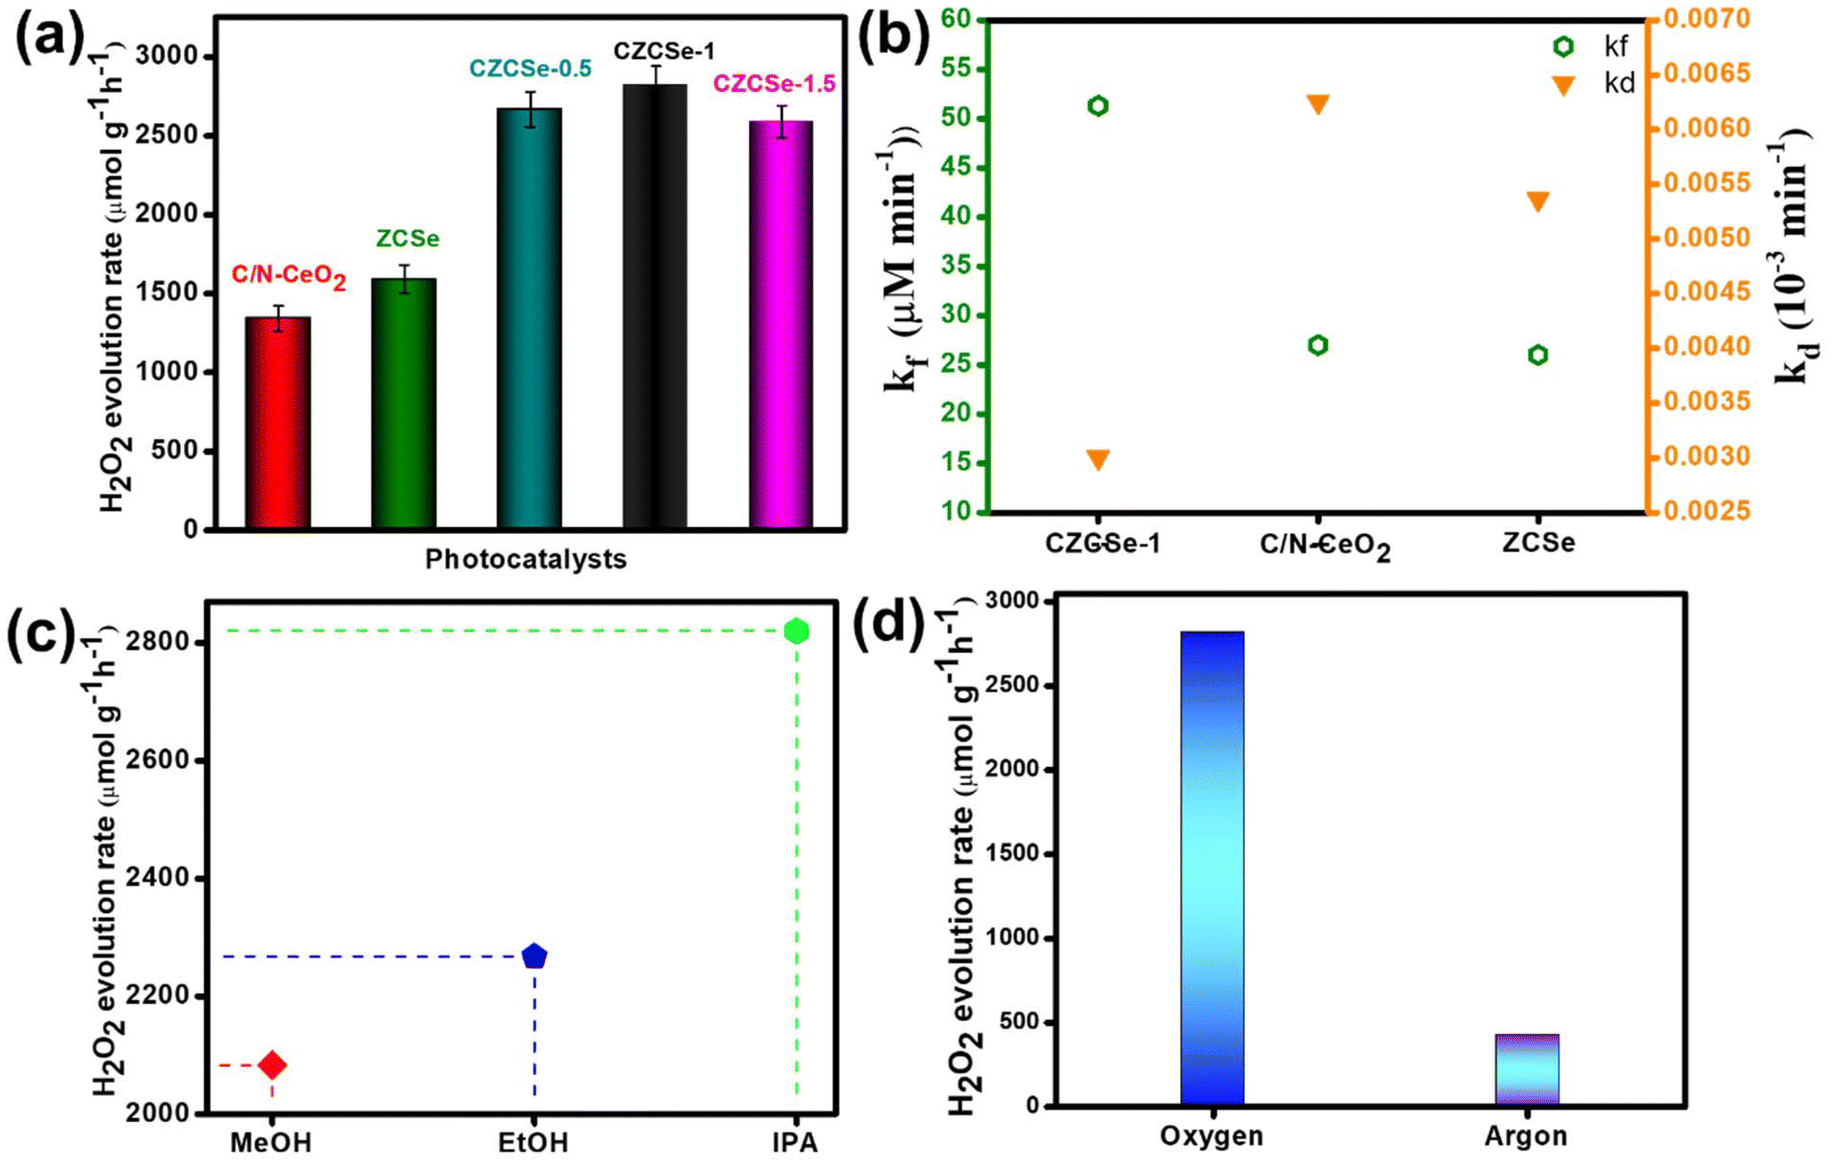
The PHPP was investigated using ethanol as a sacrificial agent in an oxygen-saturated aqueous atmosphere under visible light illumination. Pristine C/N–CeO2 and ZCSe show a comparatively lower PHPP of 1342.85 and 1590 μmol g−1 h−1, respectively. Compared to CZCSe-0.5 (2667.12 μmol g−1 h−1) and CZCSe-1.5 (2589.46 μmol g−1 h−1) composites, the PHPP of the CZCSe-1 (2820.43 μmol g−1 h−1) composite is much higher (Fig. 4(a)). As the ZCSe percentage increases, the PHPP first rises and subsequently drops. This is attributed to the high amount of ZCSe blocking the active sites, thus reducing the photocatalytic efficiency.36,43 CZCSe-1 exhibits the highest PHPP (2820.43 μmol g−1 h−1), 1.7 and 2.1-fold higher than those of C/N–CeO2 and ZCSe, respectively, confirming the successful heterojunction formation between C/N–CeO2 and ZCSe. The error bars indicate the good consistency of the PHPP of CZCSe-1.5 Remarkably, CZCSe-1 outperforms the majority of the oxide-based semiconductor materials reported earlier in the literature, which is summarized in Table S6.† CZCSe-1 shows 0.11% solar-to-chemical energy conversion (SCC) efficiency and is presented in ESI section 4(b).† The PHPP is the combined outcome of the formation and decomposition of H2O2, which can be fitted using eqn (2).5,8| | 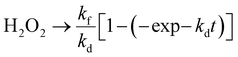 | (2) |
 |
| | Fig. 4 (a) H2O2 production rate over different photocatalysts, (b) formation (kf) and decomposition (kd) rate constants of H2O2 production, (c) H2O2 production rate over different solvents, and (d) H2O2 production rate under different atmospheres. | |
Herein, the formation and decomposition rate constants are represented by the symbols kf and kd, respectively, corresponding to zero order and first order. Fig. 4(b) shows the fitted values of kf and kd values, among which CZCSe-1 exhibited the highest kf and lowest kd values, proving it as the best photocatalyst among all prepared samples. Further, the decomposition experiment of H2O2 was performed using a 100 μM concentration of H2O2, as it is inherently unstable under light illumination. Remarkably, 16% of H2O2 decomposition was recorded for CZCSe-1 after a two-hour light irradiation, highlighting the stability of H2O2 in this system (Fig. S8(b)†). For photocatalysts to be efficient for practical applications, cycling stability is as important as high production rates. The recycling stability of CZCSe-1 (Fig. S8(c)†) illustrates that the PHPP of CZCSe-1 displays insignificant variation even after five cycles, suggesting the significant stability of CZCSe-1 for the PHPP. Afterward, PXRD (Fig. S12(a)†), FESEM (Fig. S12(b)†), FT-IR (Fig. S12(c)†), and UV (Fig. S12(d)†) analyses of CZCSe-1 were conducted to demonstrate the crystallinity, morphology, and chemical properties after the photocatalytic reaction, and the results were identical to those of CZCSe-1 before the experiment. Several controlled experiments were conducted to determine the reaction pathway for the PHPP. Moreover, the influence of an electron donor on H2O2 production is indispensable, and the outcomes are displayed in Fig. 4(c).† As illustrated, the maximum production rate was achieved for IPA, followed by EtOH and MeOH.44 The high performance of IPA is due to the fact that being a secondary alcohol, it facilitates radical formation and stabilization, leading to higher yields of H2O2 compared to methanol and ethanol. In addition, its electron-donating capacity favors the ORR process in order to produce H2O2 efficiently.8,45 As shown in Fig. 4(d), negligible H2O2 yield is recorded under dark conditions and in an Ar-saturated solution for CZCSe-1, revealing that H2O2 is produced from the photocatalytic O2 reduction reaction.
To better understand the reaction pathways and identify the reactive oxygen species involved in the ORR, a series of quenching experiments were performed to examine the intermediate species implicated in the PHPP using CZCSe-1. DMSO, CA, pBQ, and TBA act as sacrificial agents for electrons, holes, superoxide, and hydroxyl radicals, respectively (Fig. S8(a)†).3,24,46,47 The introduction of DMSO significantly diminished the PHPP of CZCSe-1, while the presence of CA generated more PHPP, indicating the role of electrons in the oxygen reduction reaction towards PHPP. Notably, the PHPP of CZCSe-1 abruptly diminished with the addition of pBQ; however, with the addition of TBA, the PHPP of CZCSe-1 moderately decreased. This implies that O2˙− is a crucial intermediate reactive species in the PHPP of CZCSe-1, potentially allowing an indirect single e− ORR pathway. Further, to obtain a better understanding of the reaction pathway, the PHPP of CZCSe-1 was analysed by employing other hole scavengers, such as methanol, ethanol, and IPA (Fig. 4(c)). The addition of the above hole scavengers improved the PHPP by potentially slowing down the decomposition of H2O2 and demonstrated that ORR by photogenerated electrons is the primary source of H2O2 generation.6 Additionally, electron spin resonance (ESR) of CZCSe-1 was analysed in the presence of a spin-trapping reagent. 5,5-Dimethyl-1-pyroline N-oxide (DMPO) was used as a spin-trapping agent to trap the intermediate species such as O2˙− and OH˙ (Fig. S10(a and b)†). As illustrated in Fig. S10(b),† CZCSe-1 shows four characteristic peaks with 1![[thin space (1/6-em)]](https://www.rsc.org/images/entities/char_2009.gif) :1:1:1 intensity, suggesting the formation of DMPO–O2˙− under light illumination; however, the corresponding peak intensity is negligible in the dark.8 The observation was further supported by the nitro blue tetrazolium (NBT) and terephthalic acid (TA) analysis, which were performed to confirm the formation of the respective intermediate radicals O2˙− and OH˙ (Fig. S9(a and b)†).48,49 Therefore, it can be concluded from the ESR and NBT analysis that CZCSe-1 can efficiently facilitate an indirect single electron ORR pathway for PHPP, as illustrated in the following equations.
:1:1:1 intensity, suggesting the formation of DMPO–O2˙− under light illumination; however, the corresponding peak intensity is negligible in the dark.8 The observation was further supported by the nitro blue tetrazolium (NBT) and terephthalic acid (TA) analysis, which were performed to confirm the formation of the respective intermediate radicals O2˙− and OH˙ (Fig. S9(a and b)†).48,49 Therefore, it can be concluded from the ESR and NBT analysis that CZCSe-1 can efficiently facilitate an indirect single electron ORR pathway for PHPP, as illustrated in the following equations.
| | | C/N–CeO2/ZCSe → e− (CB) + h+ (VB) | (I) |
| | | O2˙− + e− + 2H+ → H2O2 | (III) |
Besides, the PHPP of CZCSe-1 could possibly be due to water oxidation by photogenerated holes and OH˙ intermediate species. The dimerization of OH˙ produces H2O2, which is stated as WOR. As C/N–CeO2 possesses a VB potential (2.3 V) that is more positive than that of the electrode potential H2O/OH˙ (1.99 V vs. NHE), it can oxidize H2O to OH˙. The above results suggest two possible pathways for the PHPP that occur over CZCSe-1 (Scheme 2): (1) single-electron indirect ORR with O2˙− as the intermediate; (2) direct oxidation of H2O by photogenerated holes. Hereafter, both photogenerated electrons and holes efficiently participated in the reaction pathways, significantly decreasing the recombination rate of charge carriers. More significantly, in CZCSe-1, the S-Scheme heterojunction enhanced the photogenerated e−–h+ separation and migration, substantially promoting their photocatalytic activity.
| | | C/N–CeO2/ZCSe → e− (CB) + h+ (VB) | (IV) |
 |
| | Scheme 2 Schematic of the S-scheme charge dynamics for H2O2 production and O2 evolution. | |
3.2. Photocatalytic O2 evolution reaction (POER)
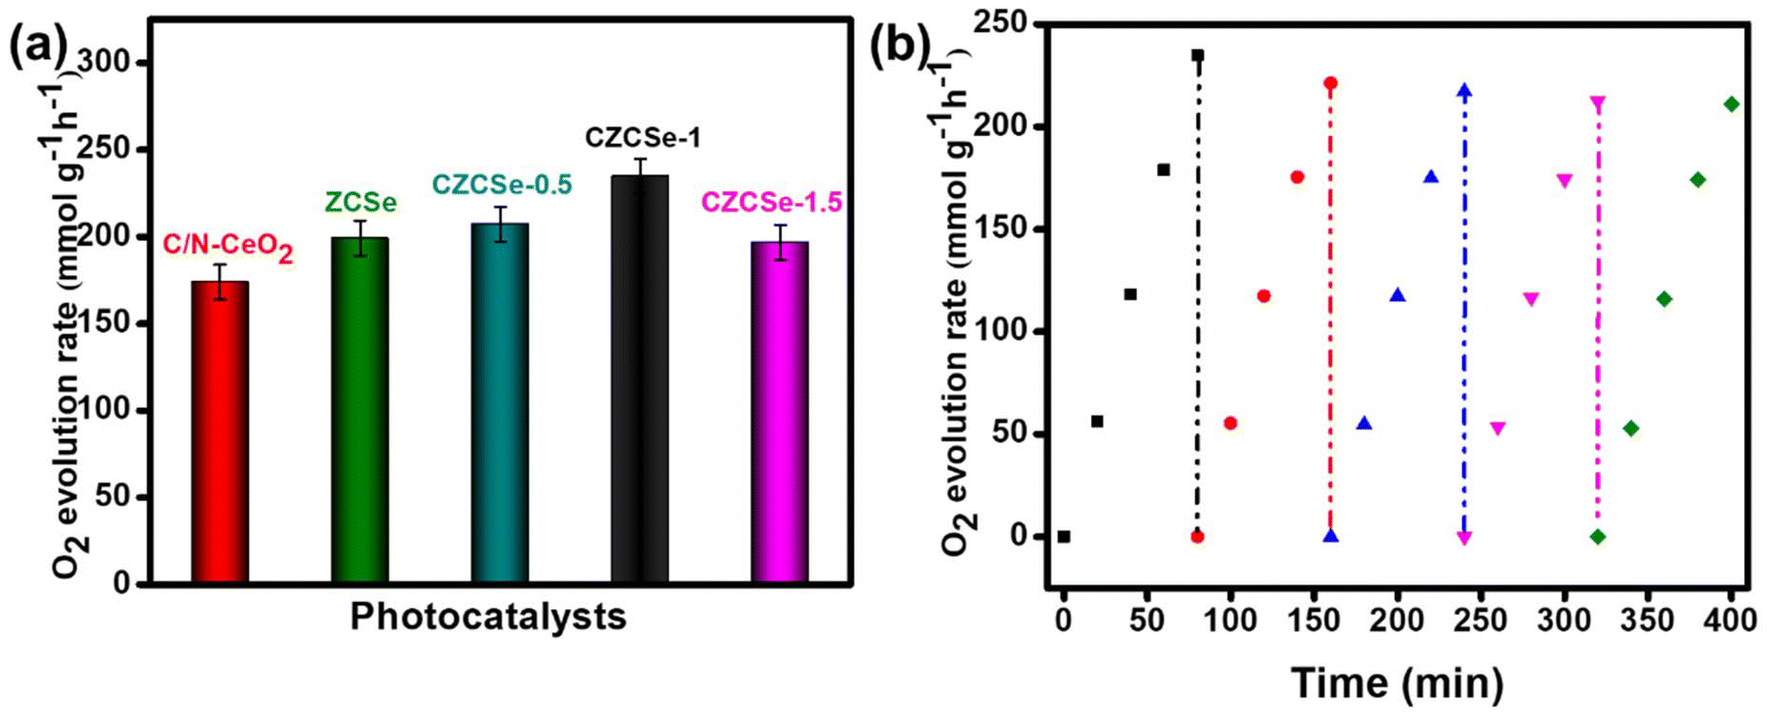
In addition to the above, POER is termed as a challenging and slow rate reaction, as it involves the 4e−–4H+ coupling process.9 All the synthesized materials were applied in the POE process under visible light irradiation, and the obtained result is displayed in Fig. 5(a). The maximum O2 evolution rate (234.89 mmol g−1 h−1) was shown by the best photocatalyst, CZCSe-1, with an ACE of 3.76%. The result could be attributed to the efficient charge separation and longer lifetime of the photocarriers, which are supported by the EIS, PL, and TRPL plots. Further, MOF-derived C/N–CeO2 and CZCSe-1 composites hold specific interest due to the presence of defects (OVs), which are helpful in the formation of the intermediate O-atom during H2O decomposition.9 Moreover, the photo-stability of CZCSe-1 is demonstrated in Fig. 5(b), with a minute drop in the POE rate even after five consecutive cycles. A comparative table (Table S5†) of the POE rate of other metal oxides-based systems is provided for better correlation.
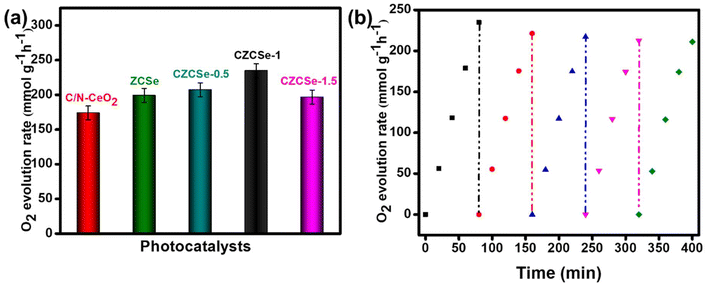 |
| | Fig. 5 (a) O2 production rate over different photocatalysts and (b) recyclability test of CZCSe-1 for O2 evolution. | |
4. Mechanistic approach for photocatalytic H2O2 production
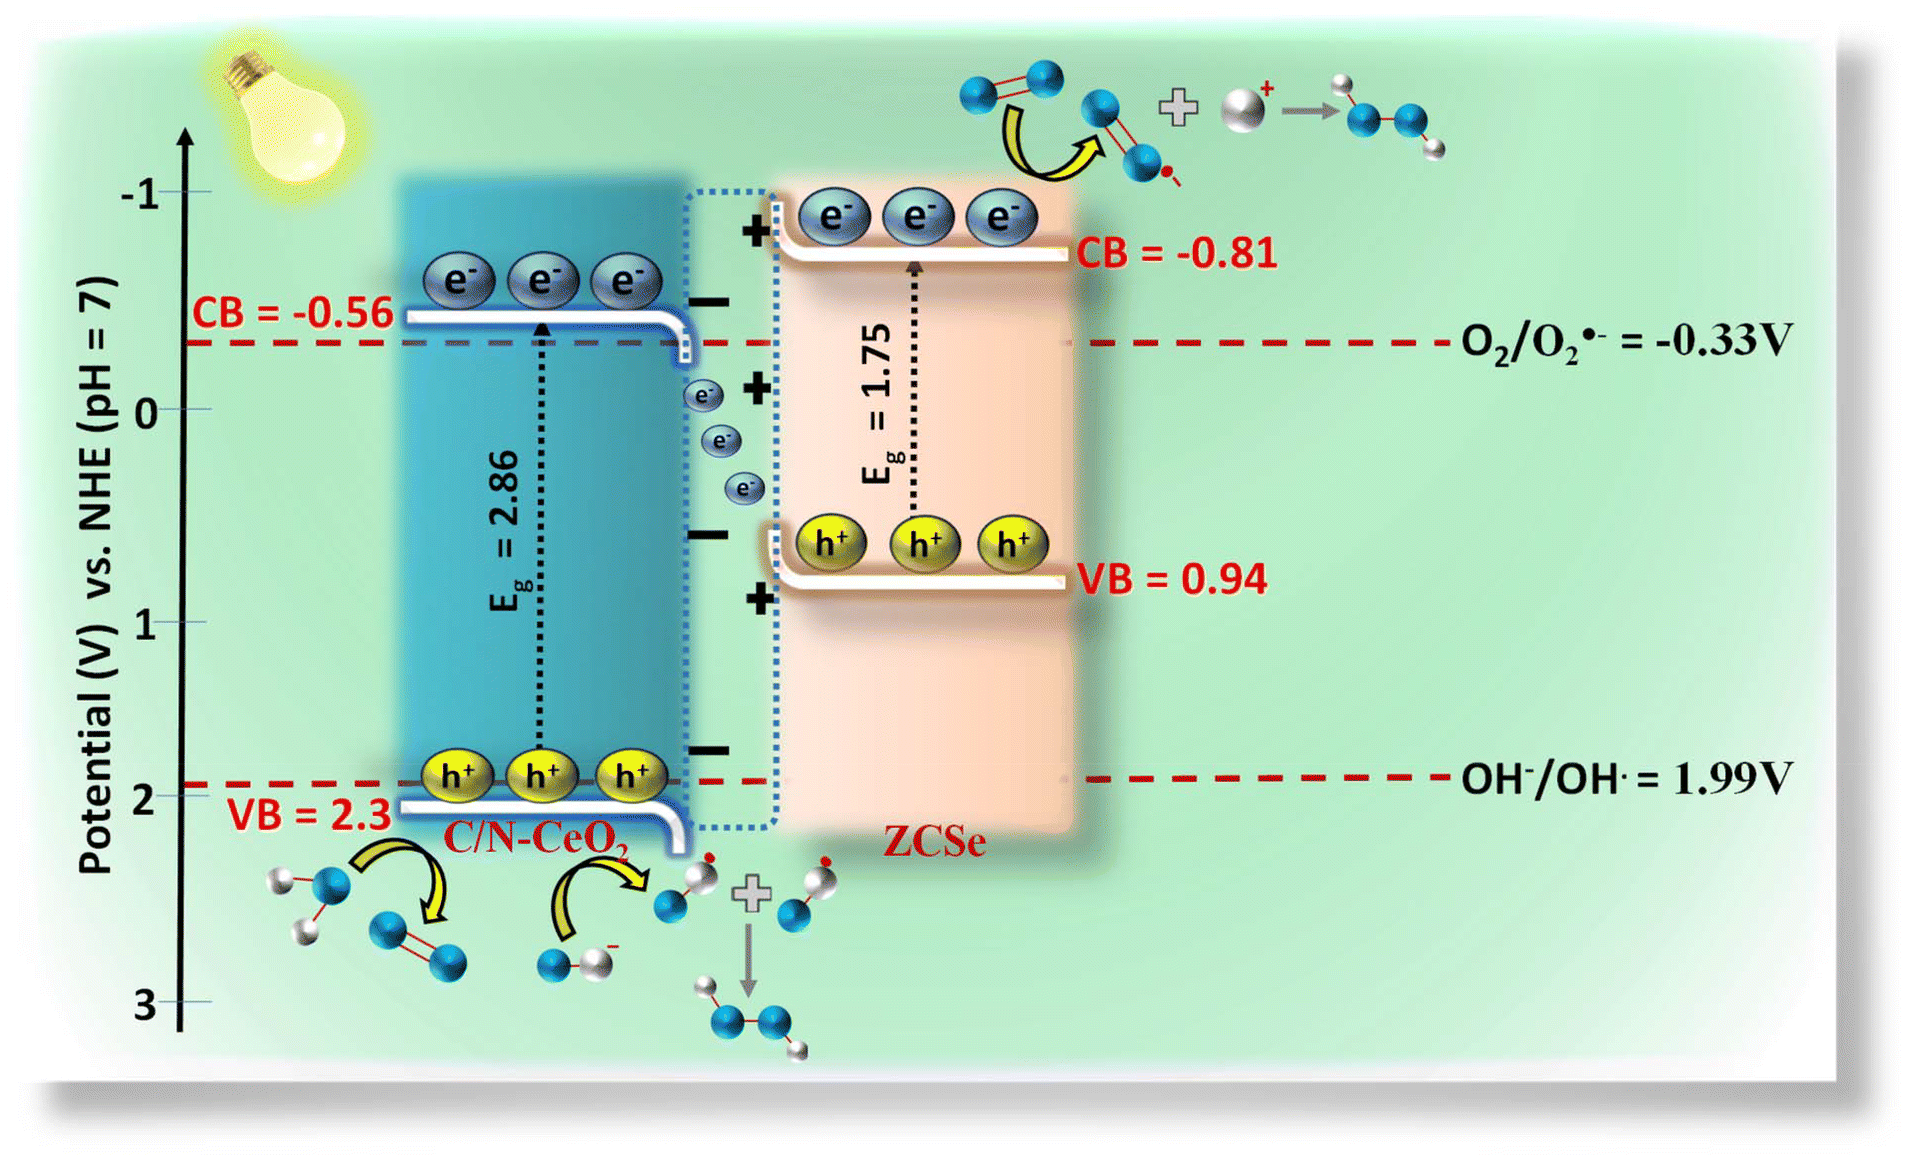
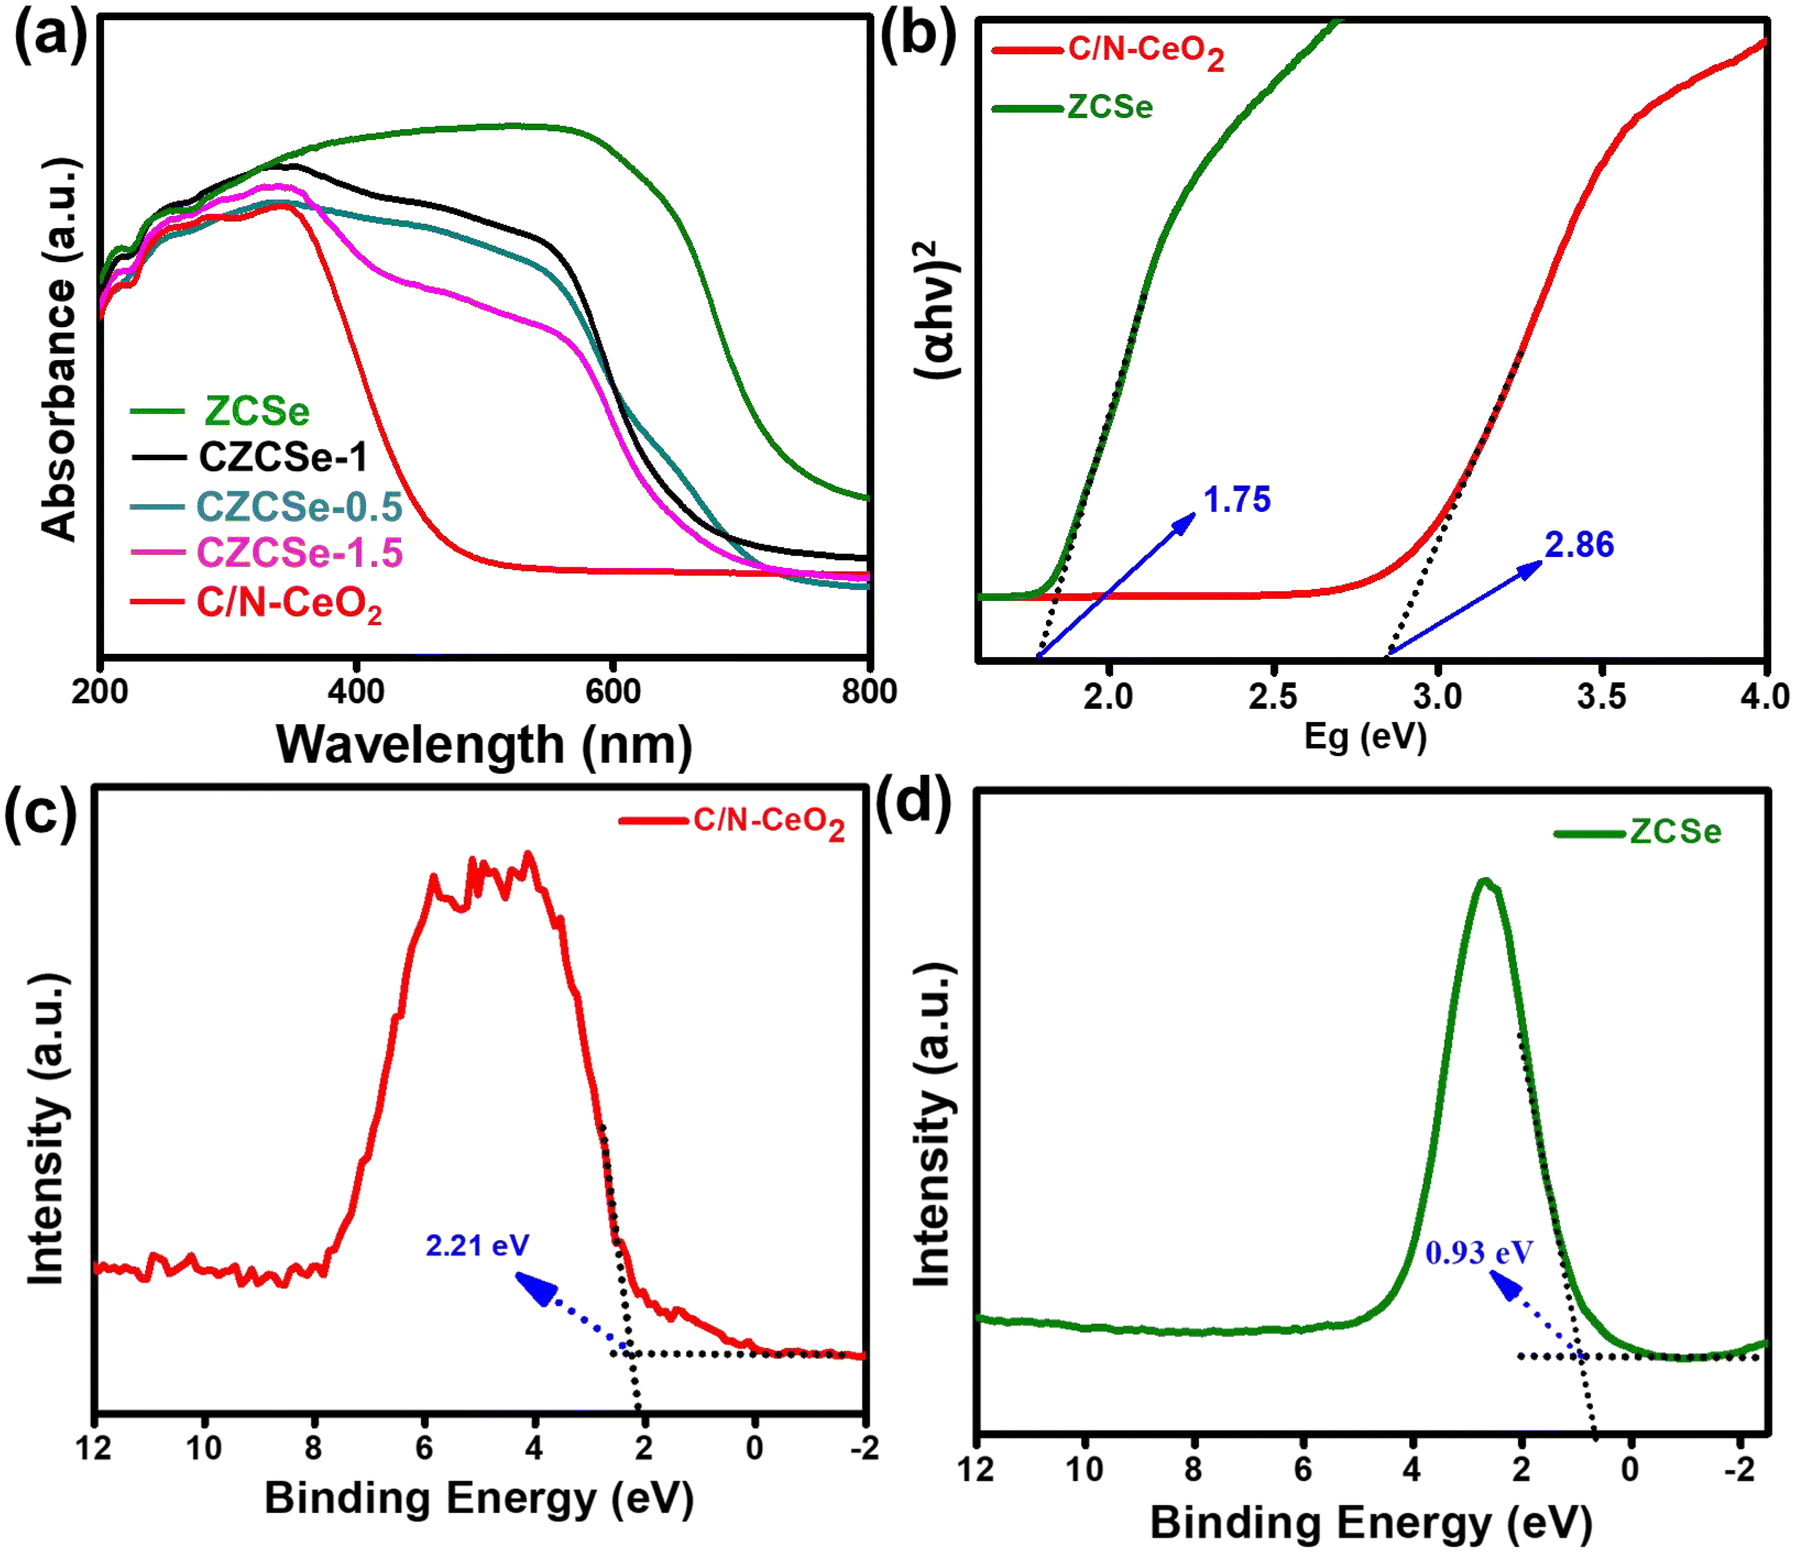
Based on the significant enhancement of the PHPP and PWO of CZCSe-1, a number of characterization techniques were employed to validate the proposed mechanism. Also, the photocatalytic performance is significantly influenced by the optical properties and electronic structure of the composite materials. The UV-vis absorption spectroscopy of all synthesized materials was analysed and displayed in Fig. 6(a). As illustrated, the absorption tail of the parent C/N–CeO2 extends from UV to the visible region because of the interband charge transfer (CT) between Ce3+/Ce4+ and CT between O2− (2p) EVB to Ce4+ (4f) ECB.9,50 The neat ZCSe shows good absorption in the visible region with an absorption edge at around 750 nm.5,21 Moreover, a significant phenomenon was observed for the composites in which their photoresponse and absorption gradually enhanced with an increase in the amount of ZCSe, and the optimum photoabsorption was found for CZCSe-1. The enhanced light-absorbing capability of the heterostructure with an ideal amount of ZCSe on C/N–CeO2 revealed the firmly established heterostructure among the two neat components. Additionally, the Tauc plot was used to assess the band gap of neat materials (Fig. 6(b)) by plotting the energy and absorption values, which were found to be 2.86 and 1.75 eV for C/N–CeO2 and ZCSe, respectively.21,25 Further, a small-range scan of the valence band XPS (VB-XPS) plots can be used to determine the VB value of the semiconductors. The VB values of C/N–CeO2 and ZCSe were determined to be 2.21 and 0.93 V, as depicted in Fig. 6(c) and (d), respectively. Thereafter, we perform the Mott–Schottky (MS) experiment to measure the band edge potentials of the photocatalysts, as these are also some essential parameters to describe the reaction mechanism. Fig. S11(a and b)† displays the flat band potential of C/N-CeO2 and ZCSe as −0.65 V and −0.9 V vs. Ag/AgCl, respectively. The n-type character of the semiconductors was indicated by the positive slopes displayed by ZCSe and C/N–CeO2.28,51 The measured flat band potential with reference to the Ag/AgCl electrode at pH = 7 can be converted to the NHE scale by the following equation16,24,50| |  | (3) |
 |
| | Fig. 6 (a) UV-Vis DRS spectra of all the synthesized photocatalysts, (b) Tauc plot of C/N–CeO2 and ZCSe, and VB-XPS spectra of (c) C/N–CeO2 and (d) ZCSe. | |
Here, 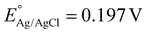 at 25 °C and EAg/AgCl is the flat band potential of the standard hydrogen electrode. The fermi level (Ef) position of C/N–CeO2 and ZCSe were calculated to be −0.46 and −0.71 V. Generally, the Ef value in the NHE scale of the n-type semiconductor was nearer to the CB position; hence, by considering a 0.1 V value variation, the CB potential of C/N–CeO2 and ZCSe could be close to −0.56 V and −0.81 V (vs. NHE, pH = 7), respectively. Consequently, according to the expression,52–54
E
CB is the conduction band, EVB is the valence band, and Eg denotes the bandgap energy. The EVB values of C/N–CeO2 and ZCSe were estimated to be about 2.3 and 0.94 V, respectively. Additionally, using the following formula, the VB potential of NHE may be determined based on the contact potential difference between the samples and the XPS analyzer55
| | | EVB-NHE = φ + EVB − XPS − 4.44 | (5) |
E
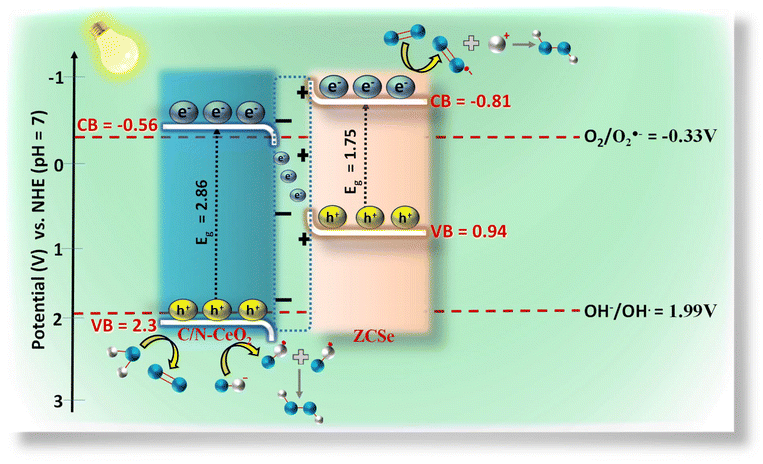
VB-NHE is the VB potential in the NHE scale at pH = 7, φ is the work function of an electron with a value of 4.55 eV from the XPS analysis, and EVB-XPS is the VB value calculated using the VB-XPS plots. Hence, the EVB-NHE of C/N–CeO2 and ZCSe is equal to 2.3 V and 0.94 V, respectively. C/N–CeO2 and ZCSe were found to have bandgaps of 2.86 and 1.75 eV, respectively, based on the results of the MS and XPS spectra investigations, which were found to be in good correlation with the bandgap values derived from the Tauc plot. To examine the interfacial charge transfer between the two materials, the work functions of C/N–CeO2 and ZCSe were measured and calculated using the small-range scan of the VB-XPS plots. When the solid sample and metal sample holder of the XPS analyser were in good electrical contact with the balanced electron transfer, the Fermi levels of both the materials in the composite reached the same level. However, the kinetic energy of the e− was altered due to the contact difference ΔV = Φ − φ (φ is the work function obtained from the XPS analyser with the value equal to 4.55 eV, and Φ is the work function of the sample), thereby changing the binding energy of the electrons.8,55 By measuring the change in the binding energy in a small range by XPS, ΔV could be gained from the spacing between the two inflection points (IPs) of the curves (Fig. S7(a and b)†), and then the Φ value of C/N–CeO2 and ZCSe could be estimated as 6.38 and 5.28 eV, respectively. Therefore, on the basis of MS and VB-XPS values above, the energy band alignments of the heterojunction and the possible charge transfer pathway were proposed and illustrated in Scheme S1.† In contrast to ZCSe, a material with a smaller work function (5.55) and a higher Fermi level, C/N–CeO2 had a bigger work function (6.38) and a lower Fermi level. Therefore, the electrons on ZCSe would naturally go to C/N–CeO2 upon close contact until their Fermi levels reached equilibrium. At this point, an internal electric field (IEF) developed at the contact surface, where the opposite charges were accumulated on both sides.56 The stimulation of IEF upon light irradiation increased the potential difference between C/N–CeO2 and ZCSe by increasing the probability that the excited electrons on the CB of C/N–CeO2 (CBC/N–CeO2) would transfer and recombine with the holes on the VB of ZCSe (VBZCSe).
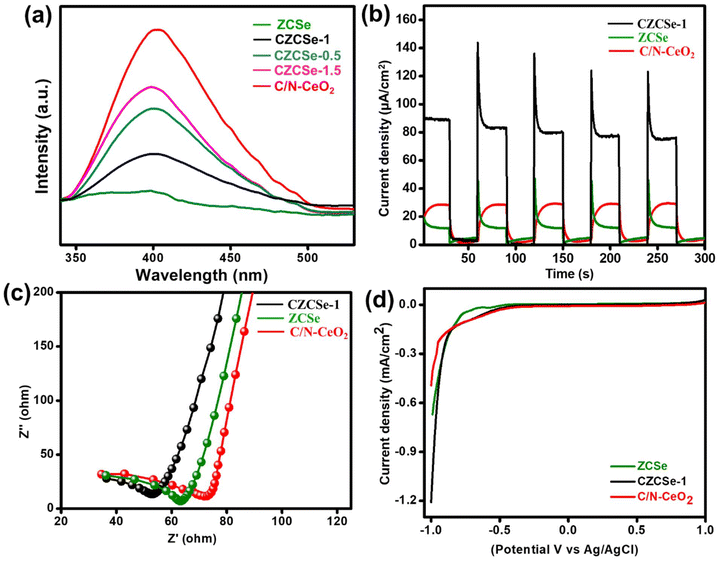
Photoluminescence (PL) spectroscopy provides an effective way to determine the trapping, separation, and migration efficiency of excitons.57–59 From the spectrum, the strong and intensified peak represents the fast recombination of e−–h+ pairs, whereas low and weaker PL intensity signifies delayed recombination of charge carriers.60,61 The PL emission of all the synthesized samples was recorded by photoexcitation at 330 nm (Fig. 7(a)). Pure C/N–CeO2 shows PL signals with peaks at around 429 and 540 nm, probably attributed to the OV and self-trapping excitations, respectively.9,13 A reduction in the intensity can be noticed for composites (lowest for CZCSe-1), which indicates the lower recombination rate of the photogenerated charge carriers. Furthermore, the diminished PL intensity of pristine ZCSe signifies low photoexcitation efficiency in the particular region due to the quantum confinement effect.8 Therefore, the outcomes suggest that in CZCSe-1, the photoexcited charge carriers are effectively separated and facilitate the execution of photocatalytic reactions at the respective ends of the semiconductors. Also, time-resolved photoluminescence (TRPL) analysis of C/N–CeO2 and CZCSe-1 was carried out in order to extend the above discussion (Fig. S6†). The average lifetime of the photoexcited charge carriers was estimated by using the following equation,25
 |
| | Fig. 7 (a) PL spectra of all synthesized photocatalysts, (b) transient photocurrent, (c) EIS, and (d) LSV curves of C/N–CeO2, ZCSe and CZCSe-1. | |
Here, all symbols correspond to their usual meaning.42 As noted, the CZCSe-1 composite has the highest average lifetime (τ = 1.38 ns) as compared to that of neat C/N–CeO2 (τ = 0.27 ns), providing evidence of the highest anti-recombination rate of excitons and photoactivity in the case of the CZCSe-1 composite. Further, we performed the transient photocurrent measurements to verify the separation, mobility, and lifetime of the photoinduced excitons. From the graph (Fig. 7(b)), the remarkably highest photocurrent density was recorded for the CZCSe-1 heterojunction compared to those of neat C/N–CeO2 and ZCSe. Moreover, the analysis can be attributed to the enhanced segregation of photoinduced excitons, signifying that the excitons were generated effectively in CZCSe-1 and available for a longer time before they recombined. This improvement leads to the validation of a better charge carrier migration at the interface, establishing an n–n heterostructure between C/N–CeO2 and ZCSe. Furthermore, the electrochemical impedance spectroscopy (EIS) technique for C/N–CeO2, ZCSe, and CZCSe-1 composite materials under light irradiation is depicted in Fig. 7(c). Generally, from the arc radius of the Nyquist plot, we can assess the charge transfer resistance of the photocatalyst, and a lower resistance implies that the charge carriers can move more freely to participate in the photocatalytic reactions.25,62,63 As shown in Fig. 7(c), the CZCSe-1 composite has the smallest semicircle arc, signifying the lowest charge transfer resistance and superior channelization of photoinduced excitons. The improved separation and migration of photogenerated charge carriers with boosted conductivity of the best composite material can be attributed to the formation of a 1D–0D S-scheme heterojunction.64–68 As shown in Fig. 7(d), CZCSe-1 displayed the maximum cathodic current as compared to neat materials, suggesting the easy reduction of molecular oxygen to superoxide followed by H2O2 formation.69,70
Despite the clarity on the band structure and initial transfer of photogenerated charge carriers at the heterojunction interface, there is still a lack of other solid evidence regarding the formation of reactive intermediates involved during the photocatalytic process for the PWO and PHPP. In light of this, various quenchers, including p-BQ, TBA, CA, and DMSO, were employed to trap O2˙−, ˙OH, h+, and e−, respectively (Fig. S8(a)†). When DMSO and p-BQ were utilized as scavenging agents, as illustrated in Fig. S8(a),† a significant decrease in the PHPP efficiency was observed, which demonstrated the major role of e− and O2˙− for the production of H2O2via the 1 e− two-step process. However, employing TBA and CA as scavenging agents also impacted the PHPP rate, demonstrating the sufficient participation of ˙OH and h+ in the reaction. Moreover, the ESR spin trap technique was employed to ensure the involvement of O2˙− and ˙OH in the reaction process. Fig. S10(a) and S10(b)† demonstrate that in the dark, no O2˙− or ˙OH signals were detected. After exposure to visible light, radical signals emerged, signifying the formation of O2˙− and ˙OH radicals in the presence of CZCSe-1. Combined with the result of the trapping test and ESR analysis, we believe that H2O2 is produced in two ways, i.e., (i) by the action of O2˙− and H+ at CBZCSe and (ii) by the recombination of two species of ˙OH at VBC/N–CeO2. The calculated CB position of ZCSe (−0.81 V) and VB position of C/N–CeO2 (2.3 V) is suitable for the production of ˙O2− and ˙OH radicals, as represented above.
Scheme 2 displays a plausible mechanism for an improved photocatalytic process based on the above data and discussion. The band structure analysis indicates that the CZCSe-1 nanohybrid exhibits a standard type-II heterojunction. Conversely, if that is the case, the holes on VBZCSe would not suitably have a higher oxidation potential (0.94 V) to generate ˙OH (OH−/OH˙, 1.99 V), which is clearly in disagreement with the above experimental outcomes. The energy band structure, IEF, trapping test, and DMPO-ESR results were all combined to successfully clarify the most reasonable S-scheme charge transfer pathway. An internal electric field (IEF) was generated when C/N–CeO2 and ZCSe were in contact, causing the downward and upward band bending movement of C/N–CeO2 and ZCSe, respectively. Upon light illumination, electrons on CBC/N–CeO2 and holes on VBZCSe recombined with each other due to the combined interaction of IEF and band bending while keeping the holes and electrons with higher redox potentials on VBC/N–CeO2 and CBZCSe. The holes on VBC/N–CeO2 oxidised H2O to O2 and OH− to ˙OH, while the electrons on CBZCSe reduced O2 to O2˙−, which further reacts with H+ to produce H2O2, as described in the above equations.
5. Conclusion
This study has demonstrated the successful fabrication of defect-induced C/N–CeO2 nanorods with surface decorating ZCSe QDs using a simple reflux technique, which resulted in a significant enhancement of photocatalytic H2O2 production and O2 evolution. When 1 mmol ZCSe (molar ratio of Zn/Cd is 1:1) was used, the CZCSe-1 sample exhibited the optimal H2O2 production (SCC = 0.11%) and O2 evolution rate (ACE = 3.6%). The augmented photocatalytic activities may be attributed to the robust interaction between oppositely charged C/N–CeO2 and ZCSe, not allowing the further decomposition of H2O2 into ˙OH. Also, the surface defects are responsible for the broad and intensified light absorption by CZCSe-1 and serve as the e− trapping site, thus impeding the photocarrier recombination. The decreased EIS and PL signals, higher cathodic photocurrent, and maximum photoresponse phenomenon further explain the photocarrier generation, separation, and transport via the S-scheme charge dynamics verified through VB-XPS and EPR analyses. Hence, this investigation offers a simple fabrication technique of a 1D–0D heterojunction (C/N–CeO2/ZCSe) with new perspectives of a novel S-scheme system towards photocatalytic H2O2 production and O2 evolution.
Data availability
The data described in this article have been included as a part of the ESI.†
Conflicts of interest
The authors declare that they have no known competing financial interests or personal relationships that could have appeared to influence the work reported in this paper.
Acknowledgements
S ‘O’ A Deemed to be University, Bhubaneswar, Odisha's management and staff are thankfully acknowledged for their constant support and encouragement in this work.
References
- B. Liu, C. Bie, Y. Zhang, L. Wang, Y. Li and J. Yu, Langmuir, 2021, 37, 14114–14124 CrossRef CAS PubMed.
- R. S. Disselkamp, Energy Fuels, 2008, 22, 2771–2774 CrossRef CAS.
- B. P. Mishra, L. Biswal, S. Das, L. Acharya and K. Parida, Langmuir, 2023, 39, 957–971 CrossRef CAS PubMed.
- Y. Xiao, Y. Tao, Y. Jiang, J. Wang, W. Zhang, Y. Liu, J. Zhang, X. Wu and Z. Liu, Sep. Purif. Technol., 2023, 304, 122385 CrossRef CAS.
- J. Sahu, S. Mansingh, B. P. Mishra, D. Prusty and K. Parida, Dalton Trans., 2023, 52, 16525–16537 RSC.
- A. Ray, S. Subudhi, S. P. Tripathy, L. Acharya and K. Parida, Adv. Mater. Interfaces, 2022, 9, 2201440 CrossRef CAS.
- L. Acharya, G. Swain, B. P. Mishra, R. Acharya and K. Parida, ACS Appl. Energy Mater., 2022, 5, 2838–2852 CrossRef CAS.
- K. K. Das, U. A. Mohanty, R. Mohanty, P. P. Sarangi, D. P. Sahoo and K. Parida, ACS Appl. Energy Mater., 2024, 7, 6360–6375 CrossRef CAS.
- S. Mansingh, S. Subudhi, S. Sultana, G. Swain and K. Parida, ACS Appl. Nano Mater., 2021, 4, 9635–9652 CrossRef CAS.
- S. Zhang, J. Guo, W. Zhang, H. Gao, J. Huang, G. Chen and X. Xu, ACS Sustainable Chem. Eng., 2021, 9, 11479–11492 CrossRef CAS.
- Y. Pu, Y. Luo, X. Wei, J. Sun, L. Li, W. Zou and L. Dong, Appl. Catal., B, 2019, 254, 580–586 CrossRef CAS.
- X. Tao, W. Cong, L. Huang and D. Xu, J. Alloys Compd., 2019, 805, 1060–1070 CrossRef CAS.
- S. Sultana, S. Mansingh and K. M. Parida, J. Phys. Chem. C, 2018, 122, 808–819 CrossRef CAS.
- C. Zhu, Y. Wang, Z. Jiang, F. Xu, Q. Xian, C. Sun, Q. Tong, W. Zou, X. Duan and S. Wang, Appl. Catal., B, 2019, 259, 118072 CrossRef CAS.
- R. Bibi, H. Huang, M. Kalulu, Q. Shen, L. Wei, O. Oderinde, N. Li and J. Zhou, ACS Sustainable Chem. Eng., 2019, 7, 4868–4877 CrossRef CAS.
- G. S. More and R. Srivastava, Ind. Eng. Chem. Res., 2021, 60, 12492–12504 CrossRef CAS.
- G. S. More and R. Srivastava, Ind. Eng. Chem. Res., 2021, 60, 12492–12504 CrossRef CAS.
- C. Zhao, X. Li, L. Yue, S. Yuan, X. Ren, Z. Zeng, X. Hu, Y. Wu and Y. He, J. Alloys Compd., 2023, 968, 171956 CrossRef CAS.
- D. A. Hines and P. V. Kamat, Am. Chem. Soc., 2014, 6, 3041–3057 CAS.
- M. Yang, Y. Wang, Y. Ren, E. Liu, J. Fan and X. Hu, J. Alloys Compd., 2018, 752, 260–266 CrossRef CAS.
- J. Qin, B. Liu, K. H. Lam, S. Song, X. Li and X. Hu, ACS Sustainable Chem. Eng., 2020, 8, 17791–17799 CrossRef CAS.
- N. X. Ca, H. T. Van, P. V. Do, L. D. Thanh, P. M. Tan, N. X. Truong, V. T. K. Oanh, N. T. Binh and N. T. Hien, RSC Adv., 2020, 10, 25618–25628 RSC.
- B. Ng, L. K. Putri, X. Y. Kong, Y. W. Teh and P. Pasbakhsh, Adv. Sci. (Weinh), 2020, 7, 1903171 CrossRef CAS PubMed.
- L. Acharya, S. Nayak, S. P. Pattnaik, R. Acharya and K. Parida, J. Colloid Interface Sci., 2020, 566, 211–223 CrossRef CAS PubMed.
- B. P. Mishra, L. Acharya, S. Subudhi and K. Parida, Int. J. Hydrogen Energy, 2022, 47, 32107–32120 CrossRef CAS.
- J. Panda, P. Behera, S. Subudhi, S. P. Tripathy, G. Swain, S. Dash and K. Parida, Mater. Adv., 2024, 5, 4865–4877 RSC.
- Y. Kageshima, Y. Gomyo, H. Matsuoka, H. Inuzuka, H. Suzuki, R. Abe, K. Teshima, K. Domen and H. Nishikiori, ACS Catal., 2021, 11, 8004–8014 CrossRef CAS.
- L. Wei, D. Zeng, X. He, L. Wang, Y. Bao, G. He, T. Fujita, W.-J. Ong, L. Wei, D. Zeng, X. He, L. Wang, Y. Bao, G. He, T. Fujita and W.-J. Ong, Adv. Energy Sustainability Res., 2022, 3, 2100210 CrossRef CAS.
- G. Swain, S. Sultana and K. Parida, ACS Sustainable Chem. Eng., 2020, 12, 4848–4862 CrossRef.
- S. D. Senol, O. Ozturk and C. Terzioğlu, Ceram. Int., 2015, 41, 11194–11201 CrossRef CAS.
- Y. Zhang, J. Shi, Z. Huang, X. Guan, S. Zong, C. Cheng, B. Zheng and L. Guo, Chem. Eng. J., 2020, 401, 126135 CrossRef CAS.
- P. Babu, S. Mohanty, B. Naik and K. Parida, ACS Appl. Energy Mater., 2018, 1, 5936–5947 CrossRef CAS.
- B. Thi Thu Hien, J. Mater. Sci., 2028, 6, 218–222 Search PubMed.
- M. Verma, A. Kaswan, D. Patidar, K. B. Sharma and N. S. Saxena, J. Mater. Sci.: Mater. Electron., 2016, 27, 8871–8878 CrossRef CAS.
- S. Subudhi, G. Swain, S. P. Tripathy and K. Parida, Inorg. Chem., 2020, 59, 9824–9837 CrossRef CAS PubMed.
- G. Murugadoss, D. D. Kumar, M. R. Kumar, N. Venkatesh and P. Sakthivel, Sci. Rep., 2021, 11, 8398 CrossRef PubMed.
- S. Subudhi, G. Swain, S. P. Tripathy and K. Parida, Inorg. Chem., 2020, 59, 9824–9837 CrossRef CAS PubMed.
- W. Zou, B. Deng, X. Hu, Y. Zhou, Y. Pu, S. Yu, K. Ma, J. Sun, H. Wan and L. Dong, Appl. Catal., B, 2018, 238, 111–118 CrossRef CAS.
- R. M. Rakhmatullin, V. V. Semashko, S. L. Korableva, A. G. Kiiamov, A. A. Rodionov, R. Tschaggelar, J. A. Van Bokhoven and C. Paun, Mater. Chem. Phys., 2018, 219, 251–257 CrossRef CAS.
- S. Maiti, T. Dhawa, A. K. Mallik and S. Mahanty, Sustainable Energy Fuels, 2017, 1, 288–298 RSC.
- G. Pacchioni, ChemPhysChem, 2003, 4, 1041–1047 CrossRef CAS PubMed.
- D. P. Sahoo, S. Patnaik and K. Parida, ACS Omega, 2019, 4, 14721–14741 CrossRef CAS PubMed.
- P. Behera, A. Ray, S. P. Tripathy, L. Acharya, S. Subudhi and K. Parida, J. Photochem. Photobiol., A, 2023, 436, 114415 CrossRef CAS.
- A. Ray, S. Sultana, S. P. Tripathy and K. Parida, ACS Sustainable Chem. Eng., 2021, 9, 6305–6317 CrossRef CAS.
- J. Zhang, L. Zheng, F. Wang, C. Chen, H. Wu, S. A. K. Leghari and M. Long, Appl. Catal., B, 2020, 269, 118770 CrossRef CAS.
- X. Geng, L. Wang, L. Zhang, H. Wang, Y. Peng and Z. Bian, Chem. Eng. J., 2021, 420, 129722 CrossRef CAS.
- Y. Li, S. Wan, W. Liang, B. Cheng, W. Wang, Y. Xiang, J. Yu and S. Cao, Small, 2024, 20, 2312104 CrossRef CAS PubMed.
- N. Kaur, J. Singh, S. Kumar, P. Singh, S. Al-Rashed, H. Kaur and M. Rawat, J. Mater. Sci.: Mater. Electron., 2020, 31, 21233–21247 CrossRef CAS.
- A. Behera, D. Kandi, S. Sahoo and K. Parida, J. Phys. Chem. C, 2019, 123, 17112–17126 CrossRef CAS.
- P. Mishra, A. Behera, D. Kandi, S. Ratha and K. Parida, Inorg. Chem., 2020, 59, 4255–4272 CrossRef CAS PubMed.
- C. Jiang, H. Wang, Y. Wang and H. Ji, Appl. Catal., B, 2020, 277, 119235 CrossRef CAS.
- S. P. Tripathy, S. Subudhi, A. Ray, P. Behera, G. Swain, M. Chakraborty and K. Parida, Langmuir, 2023, 39, 7294–7306 CrossRef CAS PubMed.
- B. P. Mishra and K. Parida, J. Mater. Chem. A, 2021, 9, 10039–10080 RSC.
- G. Swain, S. Sultana and K. Parida, Inorg. Chem., 2019, 58, 9941–9955 CrossRef CAS PubMed.
- L. Biswal, S. Nayak and K. Parida, Catal. Sci. Technol., 2021, 11, 1222–1248 RSC.
- R. Sun, Z. Zhu, N. Tian, Y. Zhang and H. Huang, Angew. Chem., Int. Ed., 2024, 63, e202408862 CrossRef CAS PubMed.
- X. Li, J. Xiong, X. Gao, J. Ma, Z. Chen, B. Kang, J. Liu, H. Li, Z. Feng and J. Huang, J. Hazard. Mater., 2020, 387, 121690 CrossRef CAS PubMed.
- S. Subudhi, S. P. Tripathy and K. Parida, Catal. Sci. Technol., 2021, 11, 392–415 RSC.
- S. Subudhi, S. P. Tripathy and K. Parida, Inorg. Chem. Front., 2021, 8, 1619–1636 RSC.
- S. P. Tripathy, S. Subudhi and K. Parida, Coord. Chem. Rev., 2021, 434, 213786 CrossRef CAS.
- D. P. Sahoo, S. Patnaik and K. Parida, ACS Omega, 2019, 4, 14721–14741 CrossRef CAS PubMed.
- P. Babu, S. Mohanty, B. Naik and K. Parida, ACS Appl. Energy Mater., 2018, 1, 5936–5947 CrossRef CAS.
- S. P. Tripathy, S. Subudhi, A. Ray, P. Behera, A. Bhaumik and K. Parida, Langmuir, 2022, 38, 1766–1780 CrossRef CAS PubMed.
- S. P. Tripathy, S. Subudhi, A. Ray, P. Behera, J. Panda, S. Dash and K. Parida, J. Colloid Interface Sci., 2023, 629, 705–718 CrossRef CAS PubMed.
- S. Wang, B. Zhu, M. Liu, L. Zhang, J. Yu and M. Zhou, Appl. Catal., B, 2019, 243, 19–26 CrossRef CAS.
- H. Zhang and X. Bai, Appl. Catal., B, 2021, 298, 120516 CrossRef CAS.
- M. Karimia, S. Sadeghia, R. G. Gavinehroudi, H. Mohebali, A. Mahjoub and A. Heydari, New J. Chem., 2021, 45, 6671–6681 RSC.
- S. Yuan, X. Liang, Y. Zheng, Y. Chu, X. Ren, Z. Zeng, G. Nan, Y. Wu and Y. He, J. Colloid Interface Sci., 2024, 670, 373–384 CrossRef CAS PubMed.
- M. Karimia, S. Sadeghia, R. G. Gavinehroudi, H. Mohebali, A. Mahjoub and A. Heydari, New J. Chem., 2021, 45, 6671–6681 RSC.
- T. Jiang, K. Wang, T. Guo, X. Wu and G. Zhang, Chin. J. Catal., 2020, 41, 161–169 CrossRef CAS.
|
| This journal is © The Royal Society of Chemistry 2025 |
Click here to see how this site uses Cookies. View our privacy policy here. 
 Open Access Article
 This Open Access Article is licensed under a
  *
*


 at 25 °C and EAg/AgCl is the flat band potential of the standard hydrogen electrode. The fermi level (Ef) position of C/N–CeO2 and ZCSe were calculated to be −0.46 and −0.71 V. Generally, the Ef value in the NHE scale of the n-type semiconductor was nearer to the CB position; hence, by considering a 0.1 V value variation, the CB potential of C/N–CeO2 and ZCSe could be close to −0.56 V and −0.81 V (vs. NHE, pH = 7), respectively. Consequently, according to the expression,52–54