DOI:
10.1039/D5PM00007F
(Paper)
RSC Pharm., 2025, Advance Article
A molecular simulation-based deep neural network model for deciphering the adsorption of 5-Fluorouracil in COFs†
Received
13th January 2025
, Accepted 19th April 2025
First published on 23rd April 2025
Abstract
A database of 1242 experimentally synthesized COFs has been studied to understand their potential as drug carriers by employing molecular simulations and machine learning models to analyze the adsorption abilities and predict the capacity of loading the anticancer drug, 5-fluorouracil. Our findings indicate that different organic linkers, structural features, binding sites, topologies, etc. of COFs play an important role in determining the maximum loading capacity and release parameters of 5-FU. The implementation of molecular simulations-based machine learning methods for drug adsorption studies in COFs is rare in the literature. Once the model was validated, we studied the maximum loading capacity of 5-FU in a series of COFs, 102–108 and 112, from the COF database, as these exhibited a gradual trend in textural properties, aiming to understand this trend and the correlation between their structure and loading capacity. Then, we proceeded to study the adsorption process in detail in 4 of the COFs: three 2D COFs—COF-206, i.e., DCuPc–ANDI-COF; COF-362, i.e., PI-COF-3; and COF-398, i.e., Py-DBA-COF-1—and one 3D COF—COF-363, i.e., PI-COF-4. Radial distribution function and adsorption energy analyses revealed some important interactions and thermodynamic parameters leading to strong binding and slow release of 5-FU. The adsorption energy values in the top-performing COFs fall within the range of −8.43 to −42.25 × 10³ kJ mol−1. The correlation of ML input parameters in terms of various chemical and structural descriptors with the maximum loading capacity is discussed. From the molecular simulations, COF-362 is the best-performing COF in terms of loading capacity and adsorption energy values. The ML models, i.e., random forest, decision tree and three deep neural networks, were trained on 80% of the total data, while the remaining 20% of the data was used to test the models. DNN model-3 was chosen as the final model for further analysis based on R2 = 0.87, RMSE = 189.81, and MAE = 100.87. SHapley Additive exPlanations (SHAP) analysis and the feature importance chart indicated that among the structural descriptors, Sacc, LCD, and Vf, and among the chemical descriptors, C, H, and N, had the most positive impact on the output predictions of the model. Finally, a graphical user interface based on the best-performing ML model was created to predict the 5-FU loading capacity of COFs. This will save users time without the need to run the code or perform various tedious drug-loading experiments.
Introduction
One of the critical challenges in pharmaceutical science is identifying suitable drug delivery systems (DDSs) tailored for specific drugs and treatments.1 DDSs are specialized carriers or devices that deliver therapeutic molecules at controlled rates, in precise amounts, and to specific target sites under defined physiological conditions.2 While standard DDSs, such as micelles, liposomes, and nanoparticles, are frequently utilized, they often suffer from limitations related to stability, uncontrolled release, and toxicity.3 To overcome these challenges, advanced DDSs based on porous materials, including metal–organic frameworks (MOFs) and covalent organic frameworks (COFs), have gained significant attention for their potential in drug encapsulation and delivery. Numerous experimental and computational studies have explored the potential of MOFs for drug delivery in treating various diseases, including cancer,1 hypertension,2 cardiovascular disorders,3 and diabetes.4 COFs, however, offer an alternative approach due to their metal-free architecture, which mitigates the risk of metal ion leaching, a known issue with MOFs, and consequently reduces potential toxicity while enhancing stability under physiological conditions. Unlike MOFs, composed of metal nodes coordinated by organic linkers, COFs consist entirely of organic building blocks linked by strong covalent bonds, resulting in materials with enhanced chemical and thermal stability. COFs are constructed using covalent bonds between organic moieties, with linkages such as C–B, C–C, C![[double bond, length as m-dash]](https://www.rsc.org/images/entities/char_e001.gif) N, C–O, and C–Si, forming diverse two-dimensional (2D) and three-dimensional (3D) frameworks. In 2D COFs, the layers stack via π–π interactions, creating planar structures, whereas 3D COFs are characterized by tetrahedral or orthogonal geometries, producing extended network architectures. 2D and 3D COFs possess desirable attributes such as large surface area, porosity, low cytotoxicity, and excellent chemical stability, making them particularly well-suited for drug loading and controlled release applications. Functionalizing COFs with groups such as fluorine, amino, alkyl, or sulfur significantly increases binding sites, resulting in stronger drug–COF interactions, improved drug-loading capacities, and more stable drug–COF complexes.
N, C–O, and C–Si, forming diverse two-dimensional (2D) and three-dimensional (3D) frameworks. In 2D COFs, the layers stack via π–π interactions, creating planar structures, whereas 3D COFs are characterized by tetrahedral or orthogonal geometries, producing extended network architectures. 2D and 3D COFs possess desirable attributes such as large surface area, porosity, low cytotoxicity, and excellent chemical stability, making them particularly well-suited for drug loading and controlled release applications. Functionalizing COFs with groups such as fluorine, amino, alkyl, or sulfur significantly increases binding sites, resulting in stronger drug–COF interactions, improved drug-loading capacities, and more stable drug–COF complexes.
Modern nanocarriers, particularly COFs, offer several advantages over conventional drug formulations, which often suffer from poor solubility, limited cellular penetration, and broad systemic distribution that can result in adverse side effects. COFs can protect drug molecules from degradation in harsh physiological environments and allow for controlled, site-specific drug release, reducing the need for frequent dosing and decreasing the burden on detoxification organs such as the liver and kidneys. This controlled release capability makes COFs highly promising for improving therapeutic efficacy while minimizing side effects. Several drugs, including doxorubicin,5 5-fluorouracil (5-FU),6 ibuprofen,7 insulin,7 quercetin,8 and captopril,9 have already been successfully encapsulated within COFs, demonstrating their versatility in various therapeutic contexts.
Molecular simulation studies on drug uptake by MOFs have been explored in the past by some research groups. Bernini et al. reported the screening of biocompatible MOFs, such as MIL-53, MIL-100, MIL-101, Mg MOF-74, CD MOF-1(K), and bioMOF-100, for the adsorption of ibuprofen via grand canonical Monte Carlo (GCMC) simulations.10 In 2017, Yeganegi and Gomar investigated the adsorption of 5-FU, hydroxyurea, and mercaptopurine in the zeolitic frameworks ZIF-7, ZIF-8, and ZIF-9.11 Liu and coworkers studied the adsorption of bendamustine and 5-FU in a series of Zr-based MOFs: UiO-66, UiO-66-NH2, UiO-66-COOH, UiO-67, and UiO-66-NDC.12 Sose et al. in 2021 reported the modeling and experiments on a series of biocompatible MOFs, specifically, UiO-AZB, HKUST-1 (or CuBTC) and NH2-MIL-53(Al), to study the adsorption of 5-FU, ibuprofen, and hydroxyurea.13 Liu Jiaqi et al.2 studied the adsorption of an antihypertensive drug amlodipine in a couple of MOFs in 2021. Proenza et al.14 studied the adsorption of 5-FU and caffeine into ZIF-8. Tayebee et al.15 2020, reported the adsorption of 5-FU in pristine and Fe-, Al-, Ga-, and Mg-doped ZnO nanoclusters using density functional theory. They were able to conclude that the doped nanoclusters have higher adsorption energy compared to pristine ZnO. Li et al.16 in 2020 used DFT calculations to understand the mechanism of adsorption of another anti-cancer drug acyclovir in magnetic nanoparticles. They were able to investigate important theoretical parameters such as the nature of intermolecular interactions, electron densities, and Laplacians. Huang et al.,17 in 2024, reported on an experimental study of Au-doped Fe3O4 as an effective 5-FU anti-liver cancer drug suggesting a loading capacity of 78% and a release capacity of 41%. In another experimental report by Chen et al.,18 in 2023, 5-FU was loaded onto the surface of a gold–silver nanocomposite, resulting in 70% adsorption. A couple of experimental reports of 5-FU loading in COFs are available that include a study by Ma et al.19 on the fluorinated COF DF-TAPB-COF. The drug loading rate was found to be 69%. Zhao et al.6 developed PI-3-COF and PI-2-COF with 16 and 30 wt% loading rates for 5-FU. Banerjee et al.20 reported two-dimensional covalent organic nanosheets that demonstrated 12% 5-FU loading with the help of UV-vis absorption spectroscopy.
Despite this significant progress, there still needs to be a deeper understanding of drug–COF interactions, particularly regarding how these systems can be optimized for specific drugs and diseases. While 5-FU, a widely used chemotherapeutic agent, has been extensively studied with MOFs as the adsorbent, comprehensive investigations into its behavior within COFs remain scarce. This study seeks to address this gap by focusing on the adsorption and uptake of 5-FU within COFs, employing advanced computational methods, including grand canonical Monte Carlo (GCMC) simulations and machine learning techniques, to investigate drug–COF interactions and optimize COF structures for enhanced drug encapsulation and loading capacity.
Multiscale modeling has allowed substantial strides to be made in various applications, including adsorption, chemical reactions, and diffusion processes. The appropriate level of theory in multiscale modeling depends on the system under investigation and the timescale of the phenomena involved. GCMC simulations are particularly well-suited for modeling drug adsorption in the pores of COFs, while molecular dynamics (MD) simulations are used to study drug release mechanisms in these systems. Integrating machine learning models into this study further enables the analysis of how structural and chemical parameters influence drug adsorption, providing insights into the rational design of COFs for specific drug delivery applications. This work presents a comprehensive computational analysis of the adsorption and diffusion behavior of 5-FU within COF structures, focusing on the influence of functionalization and other structural parameters on drug encapsulation and release. By employing advanced simulation techniques and machine learning models, the study aims to offer new insights into developing next-generation COFs with optimized properties for drug delivery. The findings are expected to contribute to both computational and experimental efforts in designing COFs with enhanced capabilities for drug storage and controlled release, thus advancing the development of innovative DDSs for a wide range of therapeutic applications.
With more than trillions of possible MOFs that can be created, the sheer number of materials has far surpassed what can be practically explored through trial-and-error experiments or brute-force molecular simulations within a reasonable period.4
In this work, we have utilized GCMC simulations and machine learning to screen and decipher the COF database21 for the adsorption of the model anticancer drug 5-fluorouracil and its loading capacity. First, we validated our simulation method by comparing the results of 5-FU adsorption by various MOFs.11,14,22,23 Once the validation was achieved, we studied the maximum loading capacity of 5-FU in a series of COFs, 102–108 and 112, from the COF database, as they exhibited a gradual trend in textural properties, helping us understand the trend and correlation of the structure with the loading capacity. Then, we proceeded to study the adsorption process in detail in 4 COFs: three 2D COFs—COF-206, i.e., DCuPc–ANDI-COF; COF-362, i.e., PI-COF-3; and COF-398, i.e., Py-DBA-COF-1—and one 3D COF—COF-363, i.e., PI-COF-4. These 2D and 3D COFs were chosen as they have different linkers, binding sites, topologies, and textural properties, which will provide deeper insights into the adsorption process and loading capacities of these COFs. In addition, a thorough analysis of the radial distribution function (RDF) and adsorption energy was also conducted to understand the mechanism and form an idea of the drug release properties of the same. After that, we performed machine learning studies on the COF database to create a model for predicting the 5-FU loading capacity of different COFs. The model was trained using the GCMC data, and the input of the ML model was the structural and chemical descriptors of the COF. Furthermore, SHapley Additive exPlanations (SHAP) analysis was performed to identify the importance of the descriptors on the loading of 5-FU in these COFs.
Computational method
5-FU is a pyrimidine derivative containing CO and F as the substituents on the ring. The molecular dimensions of 5-FU are 5.8 × 4.4 × 3.0 Å (see Fig. 1). 5-FU is used as an anticancer drug to treat various types of cancers including breast, colon, rectal, stomach, pancreatic, ovarian, and bone cancers. 5-FU interferes with the nucleoside metabolism, by incorporating itself into damaged DNA and RNA, inducing cytotoxicity and cell death. It is of great interest to see how the substituents present on the pyrimidine ring of 5-FU interact with the binding sites of COFs and affect the drug's adsorption and loading capacities in these structures.
 |
| | Fig. 1 Chemical structure of 5-fluorouracil. Color codes: red: O; blue: N; cyan: F; gray = C; and white: H. | |
COF database
High-throughput screening was utilized for the CORE-COF15 database, which included 1242 experimentally synthesized COFs. This database has a complete profile of all the COFs in terms of their structural parameters. In this study, we used Zeo++ 0.3 software24 to calculate various structural features of the COFs, including parameters such as the largest cavity diameter (LCD), pore limiting diameter (PLD), volume surface area (VSA), pore volume (Vp), density (ρ), and void fraction (φ). Considering both accuracy and computational cost, this work screens COFs with PLD values greater than 10 Å (larger than the molecular diameter of 5-FU), void fraction ≥0.70, and surface area ≥2000 m2 g−1 to establish a reference standard. The screening resulted in the identification of 81 COFs from a total of 1242 COFs. The schematic representation of the screening methodology adopted in this work is shown in Fig. 2. The structural diversity of the COFs obtained from this initial screening was visually displayed through a violin plot and a structure table (Fig. 3 and 4). A probe radius of 1.86 Å (the kinetic radius of the N2 molecule) was employed to calculate the surface area, and the COFs with zero accessible surface area were eliminated, allowing 5-FU to be adsorbed into the remaining COFs.
 |
| | Fig. 2 Schematic representation of the methodology for generating the dataset for the machine learning model. | |
 |
| | Fig. 3 Violin plot of (a) PLD and LCD and (b) φ of the 1242 COFs. | |
 |
| | Fig. 4 Violin plot of (a) PLD and LCD and (b) φ of the screened COFs. | |
Grand canonical Monte Carlo simulations
To begin our investigation, we initiated grand canonical Monte Carlo (GCMC) simulations using RASPA software6 to calculate the uptake of 5-FU by the COFs at 1 bar and 298 K. The interactions between the host–gas and gas–gas molecules were described using the Lennard-Jones (LJ) potential (eqn (1)).7 The interaction parameters for the COF atoms were obtained from the generic force field known as DREIDING. The interaction parameters for some of the metal atoms within the COFs were derived from the universal force field (UFF). The LJ interactions were truncated at a cutoff distance of 12 Å, and long-range corrections were not applied. The box side lengths in the simulations were all greater than 24 Å, i.e., two times the cutoff distance. The Lorentz–Berthelot mixing rule was employed to determine the force field parameters for interactions between different types of atoms. During the GCMC simulation, 10![[thin space (1/6-em)]](https://www.rsc.org/images/entities/char_2009.gif) 000 cycles were executed for initialization purposes, and an additional 10000 cycles were conducted to determine the overall mean value of 5-FU adsorption. Each loop utilized five different types of moves: translation, rotation, reinsertion, exchange, and molecular identity exchange. The Peng–Robinson equation of state determined the gas fugacity coefficient.25
000 cycles were executed for initialization purposes, and an additional 10000 cycles were conducted to determine the overall mean value of 5-FU adsorption. Each loop utilized five different types of moves: translation, rotation, reinsertion, exchange, and molecular identity exchange. The Peng–Robinson equation of state determined the gas fugacity coefficient.25| |
 | (1) |
In eqn (1), qi and qj represent the partial charges associated with atom i, and atom j, respectively, and ε0 denotes the vacuum dielectric constant, equal to 8.8542 × 10⁻¹² C2 N−1 m−2. Moreover, εij and rij, signify the depth of the potential well and the collision volume associated with atoms i and j, respectively. The force field parameters used for 5-FU are given in Table 1.16
Table 1 Lennard-Jones parameters for all atoms of 5-FU used in the GCMC simulations3
| |
Atom |
σ (Å) |
ε/kb (K) |
| 5-FU |
C |
3.340 |
43.292 |
| N |
3.250 |
85.578 |
| O |
3.340 |
105.724 |
| F |
3.118 |
30.707 |
| H |
1.069 |
7.903 |
Machine learning (ML) modeling
The data generated by the GCMC simulations for the adsorption of 5-FU by different COFs were used as the training data for the ML modeling. Different types of ML models were used in this work, such as random forest (RF), artificial neural network (ANN), and decision tree (DT), which were compared, and the best model was selected for further analysis. The input to the ML model was the chemical and structural descriptors of the COFs. The details of the structural and chemical descriptors are given in Table 2.
Table 2 Summary of chemical and structural descriptors of COFs used for the ML models
| Category |
Descriptor |
| Chemical |
H (hydrogen) |
| C (carbon) |
| N (nitrogen) |
| O (oxygen) |
| F (fluorine) |
| Ni (nickel) |
| Si (silicon) |
| Br (bromine) |
| Cu (copper) |
| Zn (zinc) |
| Rh (rhodium) |
| Co (cobalt) |
| S (sulfur) |
| B (boron) |
| Structural |
Density (crystal density) |
| Accessible surface area (Sacc) (m2 g−1) |
| Accessible surface area (Sacc) (m2 cm−3) |
| Free volume (Vfree) |
| PLD (pore limiting diameter) |
| LCD (largest cavity diameter) |
| Void fraction (φ) |
Artificial neural network (ANN)
ANN models have an input layer, hidden layer(s), and an output layer and are widely used in various fields, including the screening of materials.26 Each layer consists of interconnected nodes known as neurons. The neurons of one layer are connected to subsequent layers, and each connection is associated with a weight that determines the strength of the connection.27 The non-linear activation function is applied to the output to introduce non-linearity into the model. This helps the model learn the complex functional relationship between the input and output. Some common activation functions are ReLU, sigmoid, softmax, and tanh.26 ANN models are trained using the backpropagation algorithm, such as in the deep neural network (DNN), which involves iterative weight adjustments between neurons to minimize the loss function. The loss function measures the difference between the predicted and actual output values. The weight adjustment process utilizes optimization algorithms such as gradient descent and stochastic gradient descent. A schematic representation of the DNN model is given in Fig. 5.
 |
| | Fig. 5 Schematic representation of the DNN model. | |
Decision tree
A decision tree is a supervised learning approach and consists of nodes that indicate decisions based on the features and the branches that represent the outcome of the decision.27 The DT model is trained using a recursive partitioning process where the algorithm selects the best feature to split the data at each node.28 The algorithm evaluates different splitting criteria for estimating the best feature and its value. The DT model has limitations and is prone to overfitting if the tree grows too deep, and a slight change in the training data causes a significant change in the tree and, consequently, in the output.27
Random forest
The RF is an ensemble modeling algorithm developed based on the collection of decision trees.27 It combines the outputs of multiple DTs to reach a single result, and each tree in the ensemble comprises a data sample taken from the training data set with a replacement, known as a bootstrap sample.28 Overfitting in RF is avoided by incorporating ensemble strategies and random sampling, which also assist in making accurate predictions. The hyperparameters in the RF model are node size, the number of trees, and the number of features sampled.
ML model performance evaluation and interpretability
The performance of the ML models was tested using the following performance metrics:
Root mean square error (RMSE). RMSE indicates the degree of dispersion of the sample; the lower the RMSE, the better the model's predictions and the better the fit with respect to the original data sample. RMSE is very susceptible to large and small errors and is a good measurement of the model's accuracy.28| |
 | (2) |
Coefficient of correlation (R2). This is a statistical measure of how well the independent variable in a statistical model explains the variation in the dependent variable. It ranges from 0 to 1, where 1 indicates the perfect fit of the model to the data:| |
 | (3) |
Mean absolute error (MAE). This is the average error between the predicted and actual values of the sample and the smaller the value of the MAE, the better the ML model's predictions. The MAE is expressed as| |
 | (4) |
where N is the total number of the samples, yi is the true value, xi is the predicted value, and y is the average value of the true values.The interpretability of the ML model is necessary to understand the importance of the features with respect to the overall model predictions. Furthermore, model interpretability was performed using SHAP analysis. SHAP originated from game theory29 and was used to identify the importance of features. Here, it has been leveraged as a modern explanation framework for understanding the influence on 5-FU loading into COFs of the chemical and structural descriptors. The interpretability of a model is the process of understanding how an ML model makes predictions by establishing a relationship between input and output. This facilitates engineers and scientists in understanding the rationale behind the model predictions and builds trust in the ML model. ML models with high interpretability are easily understood by humans and their applicability and implementation in real-world scenarios are easily explained.
Results and discussion
Validation of the simulation method
To validate the simulation method and force field, the 5-FU simulation was conducted to compare with the reported literature results for MOFs. Table 3 shows the comparison of the simulation results of the reported literature and our work on the adsorption capacity of 5-FU in various state-of-the-art MOFs for validation of the model for further analysis of the COF database.
Table 3 Physical properties, pore size distributions (PSDs), and simulated maximum uptake of 5-FU by the MOFs under study
| MOF |
PLD (Å) |
Maximum experimental uptake of 5-FU (mg g−1) |
Maximum simulated uptake of 5-FU (mg g−1) |
| IRMOF-122 |
7.93 |
1428 |
1456 |
| IRMOF-1022 |
12.08 |
2839 |
2991 |
| IRMOF-822 |
9.17 |
2131 |
2102 |
| ZIF-830 |
3.40 |
477 |
535 |
| ZIF-623 |
1.64 |
796 |
840 |
| UiO-6631 |
3.99 |
279 |
288 |
Correlation between COF structural property parameters and adsorption and loading capacity of 5-FU
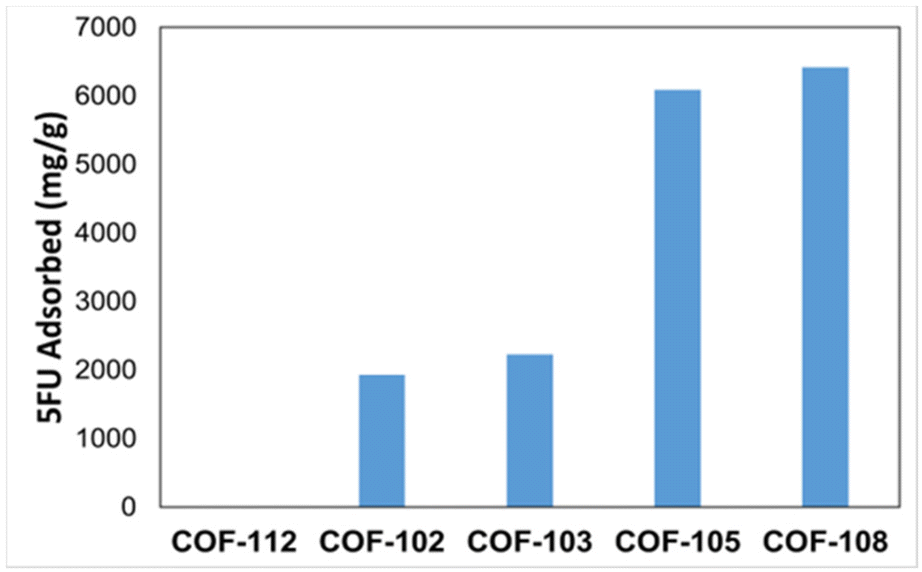
In Table 4, a series of COFs, COF-112 and COF-102 to 108 (obtained from the COF database file), are studied to understand how the textural properties of COFs affect the amount of 5-FU adsorbed. It can be observed that as one moves down the table, the PLD, surface area, and void fraction values gradually increase. Here, it can be seen that in the case of COF-112, the PLD is smaller than the size of 5-FU, hence correspondingly, simulation results established that no adsorption takes place. Furthermore, in the case of COFs 102 to 108, the GCMC simulation results indicate that the adsorption of 5-FU gradually increases as the parameters increase, indicating a direct correlation between the COF structural property parameters and the amount of 5-FU adsorption.
Table 4 Textural properties of the selected COFs studied by simulations in this work
| COF name |
PLD (Å) |
Surface area (m2 g−1) |
Void fraction |
5-FU loading (mg g−1) |
| COF-112 |
2.03 |
0 |
0.41128 |
1 |
| COF-102 |
7.98 |
5128.69 |
0.781 |
1930 |
| COF-103 |
8.50 |
5315.45 |
0.797 |
2229 |
| COF-105 |
16.12 |
6644.76 |
0.911 |
6092 |
| COF-108 |
19.05082 |
6386.63 |
0.916 |
6415 |
In Fig. 6, it can be seen that the pore volume of the COFs against adsorption values exhibits an almost linear trend, which indicates that COFs with larger pores adsorb more significant amounts of the adsorbate. The pore volume becomes a relevant factor in the process. This behavior was also observed by Erucar and Keskin32 and Rodrigues and Martins22 when evaluating 5-FU adsorption on MOFs with different pore volumes.
 |
| | Fig. 6 Graphical representation of the amount of 5-FU adsorbed in COF-112 and COF-102 to COF-108 as calculated by simulations in this work. | |
Mechanism of 5-FU adsorption in COFs
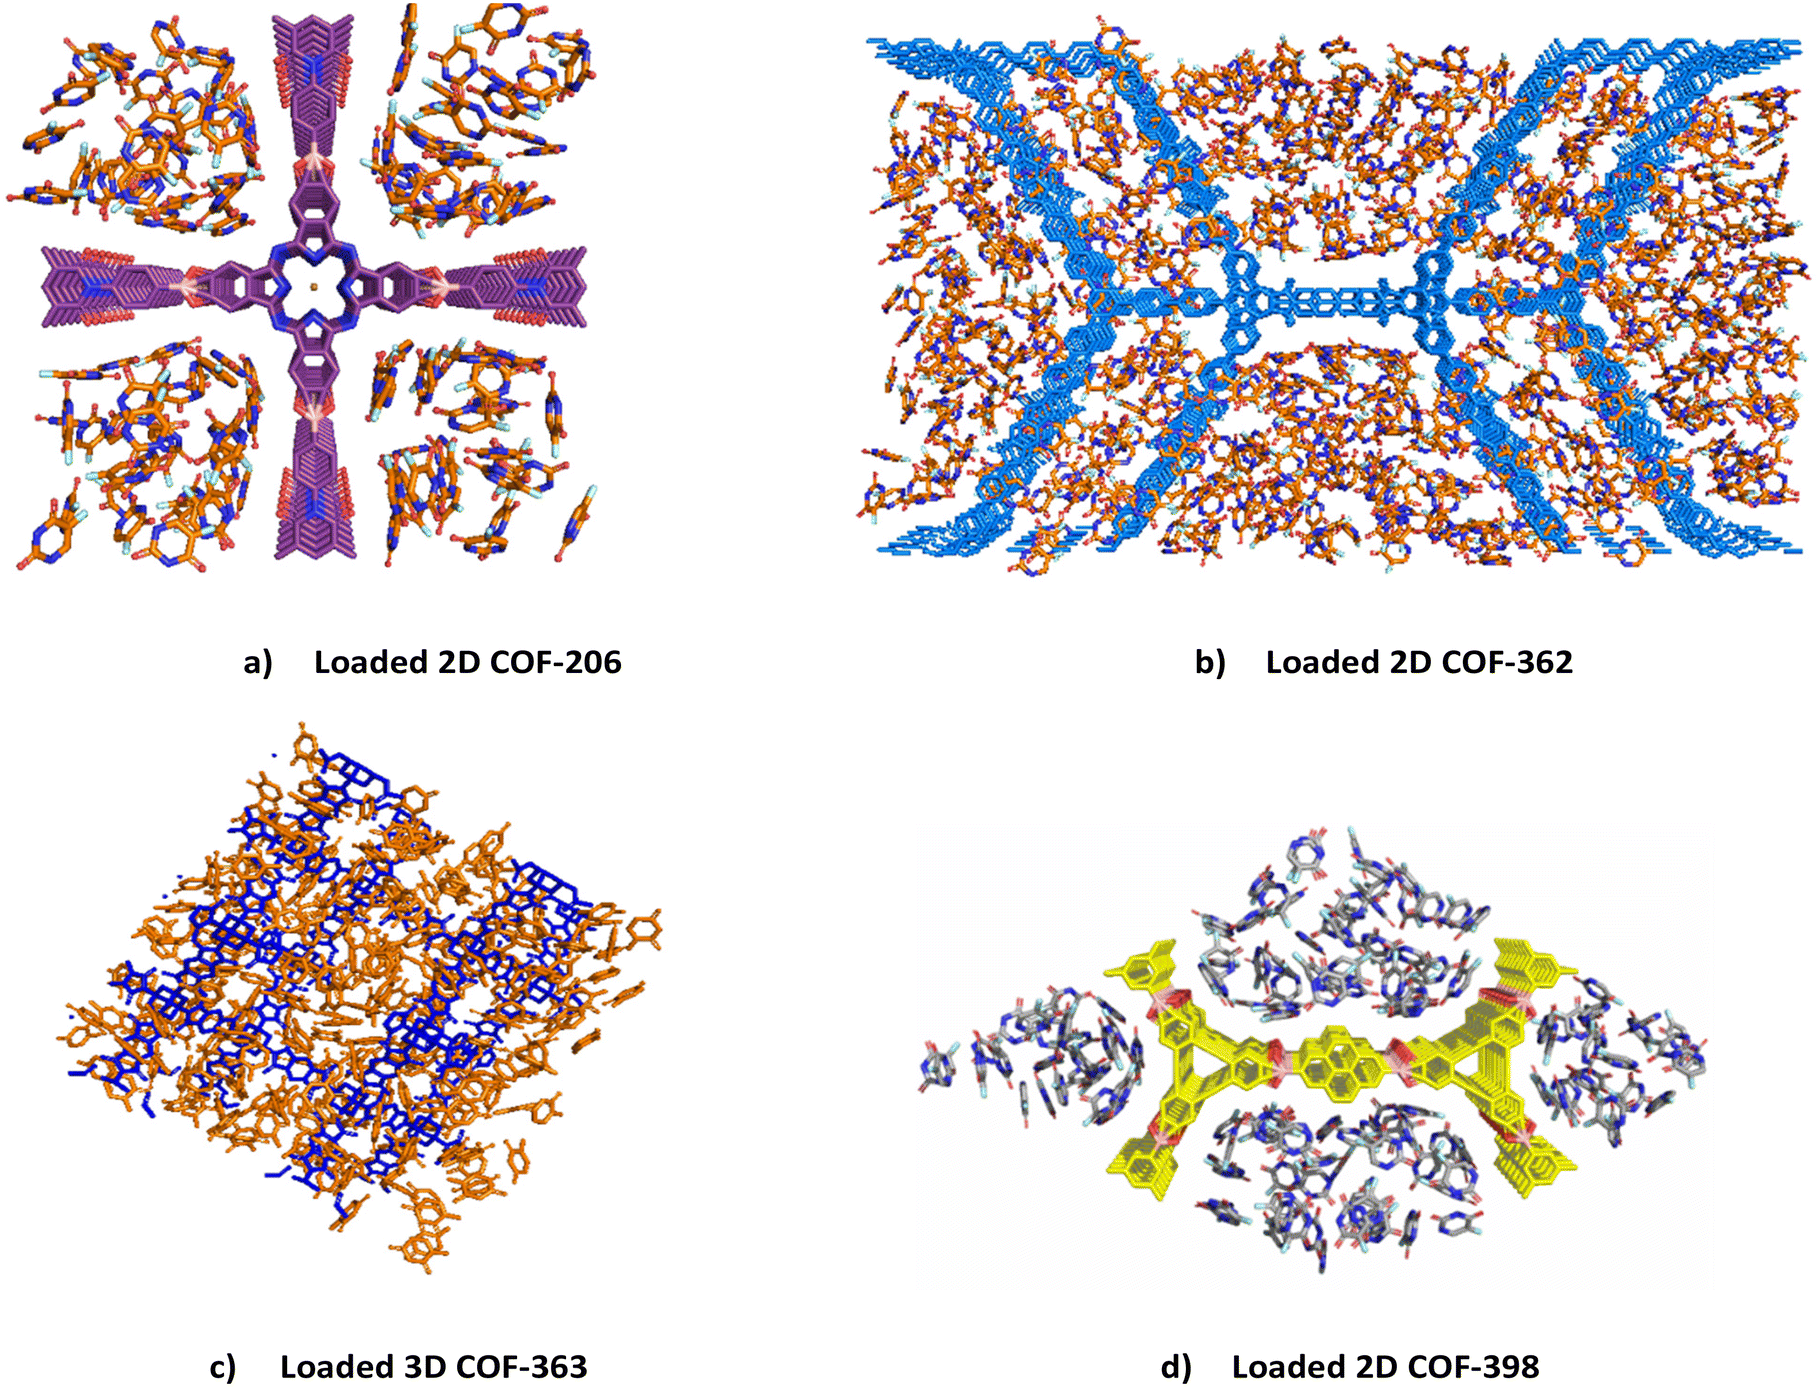
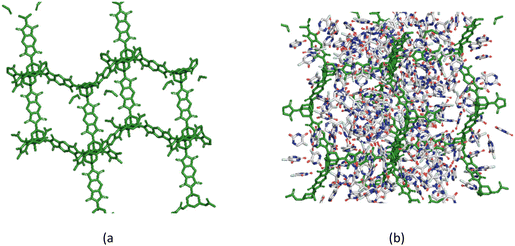
In this section, we describe the mechanism of 5-FU adsorption in detail in four COFs, namely, COF-206, COF-362, COF-363, and COF-398, selected from the database on the basis of their unique structural features such as topology, pore diameter, surface area, void fraction, and unique binding sites, which play an important role in the drug loading ability of a COF. In Fig. 7, we have presented complete perspective views of the four loaded COFs obtained via GCMC simulations to provide the reader with an understanding of the loaded COFs.
 |
| | Fig. 7 A complete perspective view of the loaded COFs obtained from GCMC simulation results. (a) 2D COF-206; (b) 2D COF-362; (c) 3D COF-363; (d) 2D COF-398. | |
Mechanistic insights into 5-FU adsorption in a 2D COF-206, input name: DCuPc–ANDI-COF
COF-206, with the name DCuPc–ANDI-COF, has a pore size of 3.6 nm. It belongs to the category of donor–acceptor COFs, where the porphyrin ring, denoted by DCuPc, acts as the donor group and the naphthalene diimide linkage, ANDI, behaves as the acceptor unit. DCuPc–ANDI-COF has a 2D SQL topology. Its void fraction is 0.75, PLD = 27.15 Å, and it has a surface area of 1595 m2 g−1. Fig. 8 shows snapshots of the 5-FU-loaded COF-206 obtained using iRASPA software. Based on our simulation results, the loading capacity of DCuPc–ANDI-COF was found to be 1420 mg g−1.
 |
| | Fig. 8 Snapshots of 5-FU loaded in COF-206 with input name DCuPc–ANDI-COF at saturation with 1 × 1 × 8 unit cells. 5-FU molecules are shown in gray stick representation style. (a) and (b) Empty COF-206 and (c) and (d) 5-FU-loaded COF-206. | |
Analysis using the radial distribution function (RDF) helps in discussing the distribution of 5-FU molecules inside the pores.3 RDF analysis helps in understanding the major binding sites within the COF and their binding to the 5-FU molecules. The RDF analysis of COF-206 is shown in Fig. 9. Here, 5-FU is bound to the COF atoms via hydrogen bonding between the F, O, N, C, and H of 5-FU and the O, N, and electron-rich aromatic rings of COF-206. In the case of COF-206, i.e., DCuPc–ANDI-COF, it can be seen that the major interactions occur between the framework borate O and the 5-FU atoms and between the naphthalimide O and 5-FU. After that, we observe that the phenyl ring and the boron atoms of the framework and the 5-FU molecules interact with each other. Upon further analysis, it was found that weaker interactions occur between the Cu of the porphyrin ring and 5-FU, maybe because these Cu sites are not exposed. The host–adsorbate distances were found to be in the range of 1.81–2.26 Å and the adsorbate–adsorbate RDF fell within the range of 1.76–2.79 Å (refer to Table S1†).
 |
| | Fig. 9 Radial distribution function (RDF) analysis of the selected atoms in COF-206, i.e., DCuPc–ANDI-COF. In the first figure, binding atoms of COF-206 have been labelled and studied via RDF analysis with the atoms of 5-FU. The specific atom-to-atom interactions are labelled in the inset plots of the figure. | |
Mechanistic insights into 5-FU adsorption in a 2D COF-362, input name: PI-COF-3
COF-362, with the input name of PI-COF-3, is a 2D COF classified under the category of PI-n-COFs, where n represents the number of amino groups. It is obtained by the condensation reaction of 1,3,5-triformylbenzene with 2,4,6-tris(4-aminophenyl)-s-triazine. Its void fraction is 0.80; the PLD is 31.9 Å; and the surface area is 3197 m2 g−1. Through our simulation results, the 5-FU loading capacity was found to be 2399.10 mg g−1. For this COF, the experimentally reported loading capacity was found to be 16 wt%.6 The deviation from the experimental results can be explained by the fact that the simulation results represent the loading capacity in a completely ordered crystalline material, whereas the experimental results suffer due to the phase purity of the COF, interactions with the solvent, interpenetration of the framework, etc., out of many other possibilities. Snapshots of the empty and loaded COF are presented in Fig. 10. Upon analysis of the RDF results, it was observed that the major loading occurs at the periphery of the frameworks and at the center of the cavities. The RDF analysis of COF-362 is shown in Fig. S5.† The host–adsorbate distances were found to be in the range of 1.71–2.31 Å, and the adsorbate–adsorbate RDF appeared within the range of 1.76–2.77 Å (refer to Table S1†).
 |
| | Fig. 10 Snapshots of 5-FU loaded in COF-362 with input name PI-COF-3 at saturation with 1 × 1 × 5 unit cells. 5-FU molecules are shown in gray stick representation style. (a) and (b) Empty COF-362 and (c) and (d) 5-FU-loaded COF-362. | |
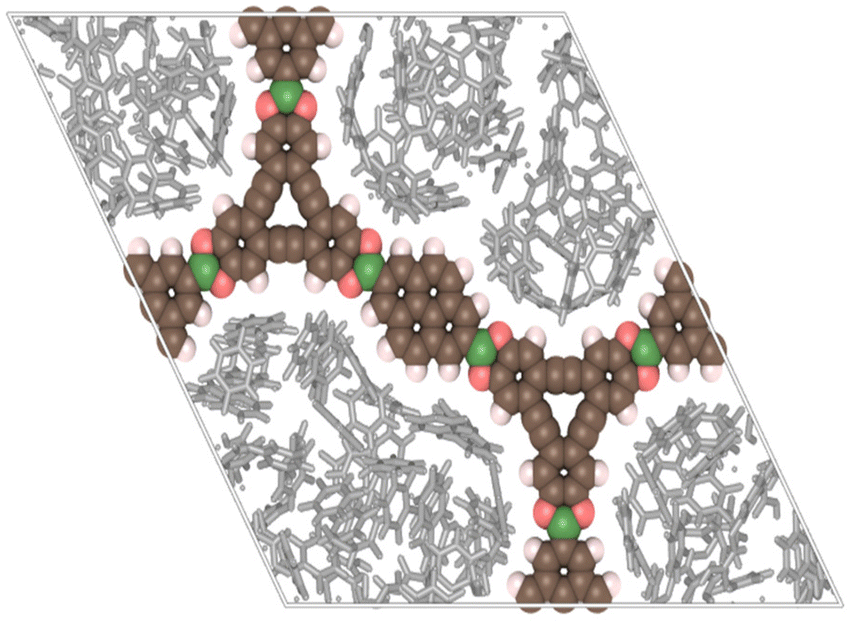
Mechanistic insights into 5-FU adsorption in a 2D COF-398, input name: Py-DBA-COF-1
COF-398, i.e., Py-DBA-COF-1, is a 2D COF with an hcb topology. It is formed by a condensation reaction between pyrene-2,7-diboronic acid (PDBA) and π-conjugated dehydrobenzoannulenes (DBA) (Fig. 11). The framework has a void fraction of 0.78, a PLD of 33.38 Å, and a surface area of 1903.75 m2 g−1. It has unique luminescence properties making it useful for sensory and imaging purposes. The RDF analysis of COF-398 is shown in Fig. S6.† The presence of boronate groups in the rings provides suitable adsorption sites for 5-FU, as revealed by our RDF analysis. The boronate oxygen atoms act as the binding sites. In the case of overall framework interactions with the drug, the fluoride of 5-FU interacts more strongly than the other atoms present in the molecule. The host–adsorbate distances were found to be in the range of 1.81–2.26 Å, and the adsorbate–adsorbate RDF are within the range of 1.78–2.82 Å (refer to Table S1†). Based on our GCMC simulation results, the loading capacity of Py-DBA-COF-1 was found to be 1727.89 mg g−1.
 |
| | Fig. 11 Snapshot of 5-FU loaded in COF-398 with input name Py-DBA-COF-1 at saturation with 1 × 1 × 8 unit cells. 5-FU molecules are shown in gray stick representation style. | |
Mechanistic insights into 5-FU adsorption in a 3D COF-363, input name: PI-COF-4
Pyrometallic dianhydride (PMDA) and 1,3,5,7-tetra-aminoadamantane (TAA) combine to form the extended 3D framework of COF 363 with input name PI-COF-4 through imidization, resulting in a diamondoid topology (Fig. 12). PI-COF-4 exhibits high thermal stability and large surface area. It has been found to be a suitable host for ibuprofen. It has a void fraction of 0.88, a PLD of 13.4 Å, and a surface area of 5107.4 m2 g−1. In the present study, the loading capacity of 5-FU in this COF was found to be 3659 mg g−1 (Table 5). The RDF analysis of COF-363 is shown in Fig. S7.† The host–adsorbate distances were found to be in the range of 1.81–2.34 Å and the adsorbate–adsorbate RDF fell within the range of 1.76–2.84 Å (refer to Table S1†). These interactions are indicative of the presence of weak van der Waals forces and hydrogen bonding-type electrostatic interactions.
 |
| | Fig. 12 Snapshots of 5-FU loaded in COF-363 with input name PI-COF-4 at saturation with 2 × 2 × 1 unit cells. 5-FU molecules are shown in gray stick representation style. (a) Empty COF-363 framework and (b) 5-FU-loaded COF-363. | |
Table 5 Total internal energy (Ugh), host–adsorbate interaction energy (UHA), adsorbate–adsorbate interaction energy (UAA), and heat of adsorption (Hads) calculations for the four COFs under study
| COF |
PLD |
Surface area |
5-FU loading (mg g−1) |
Ugh/103 kJ mol−1 |
UHA/103 kJ mol−1 |
UAA/103 kJ mol−1 |
Hads, kJ mol−1 |
| COF-206 |
27.15 |
1595 |
1420 |
−8.43 |
−2.60 |
−5.82 |
−107.21 |
| COF-362 |
31.9 |
3197 |
2399.10 |
−42.25 |
−17.45 |
−24.80 |
−122.99 |
| COF-363 |
13.4 |
5107.4 |
3659 |
−15.94 |
−5.05 |
−10.88 |
−118.59 |
| COF-398 |
33.38 |
1903.75 |
1727.89 |
−9.40 |
−2.59 |
−6.81 |
−103.64 |
Adsorption energy analysis
The adsorption energy of an adsorbed atom is the energy to be given to the adsorbed atom to desorb it from the surface. In the case of drug adsorption, it indicates the strength of the binding of the drug to the host material. A negative adsorption energy value indicates a thermodynamically favorable adsorption process. Qualitatively speaking, the total internal energy of adsorption, Ugh, reflects the drug binding and release ability of a particular COF. Among the three 2D COFs and one 3D COF under study, it can be seen from Table 5 that Ugh in the case of the 2D COF, COF-362, is −42.25 × 10³ kJ mol−1. In contrast, in the case of the 3D COF, COF-363, Ugh is −15.94 × 10³ kJ mol−1, followed by Ugh values for the other 2D COFs, COF-398 and COF-206, of −9.40 and −8.43 × 10³ kJ mol−1, respectively. It can also be observed that the contribution of the adsorbate–adsorbate interaction energy, UAA, is more than that of the host–adsorbate interaction energy in all cases, indicating that the 5-FU to 5-FU interaction increases more than the 5-FU to COF atom interaction as the loading increases inside the pores, which is in accordance with results reported earlier in the case of drug adsorption by MOFs.10,13,14 Amongst these 4 COFs, studied based on their Ugh values, it can be inferred that COF-362 will show the slowest release of 5-FU. In the adsorption process, the enthalpy of adsorption, by definition, is the amount of heat released or adsorbed. It is governed by factors such as the binding strength between the host–adsorbate and structural features such as surface area and pore volume. For COF-362, the total enthalpy of adsorption was calculated to be −122.99 kJ mol−1, the highest among the four COFs. This again confirms that the binding strength of COF-362 to 5-FU is the greatest among these four COFs. Hence, the release of 5-FU will be slower and sustained for a longer duration with COF-362.
Machine learning models
The ML models (RF, DT, and DNN) were trained with 80% of the total data, and the remaining 20% of the data was used to test the model. The model's performance was tested in terms of R2, RMSE, and MAE. Three different DNN models were created to test the role of the layers in the overall model prediction. All the DNN models have an input layer of 21 features (chemical (14) and structural descriptors (7)), and the output layer has one node. The number of hidden layers in DNN model-1 was one with 27 nodes, while DNN model-2 has 4 hidden layers with 30, 15, 10, and 5 nodes, respectively.
DNN model-3 has 8 hidden layers with 45, 35, 30, 25, 20, 15, 10, and 5 nodes, respectively. Fig. 13 shows parity plots of the test and training data for RF, DT and DNN model-3. From Fig. 13(a–c), it can be observed that the predictions of DNN-model-3 are the best among all the other models. A comparison of the three models for test data in terms of R2, MAE and RMSE is detailed in Table 6.
 |
| | Fig. 13 Parity plots from RF, DT and DNN model-3 analysis of the test data. | |
Table 6 Comparison of different ML models for the test data
| ML model |
R2 |
RMSE |
MAE |
| Random forest model |
0.62 |
323.20 |
137.21 |
| Decision tree model |
0.78 |
240.30 |
136.4 |
| DNN model-1 |
0.60 |
451 |
330 |
| DNN model-2 |
0.78 |
241.83 |
157.74 |
| DNN model-3 |
0.87 |
189.81 |
110.87 |
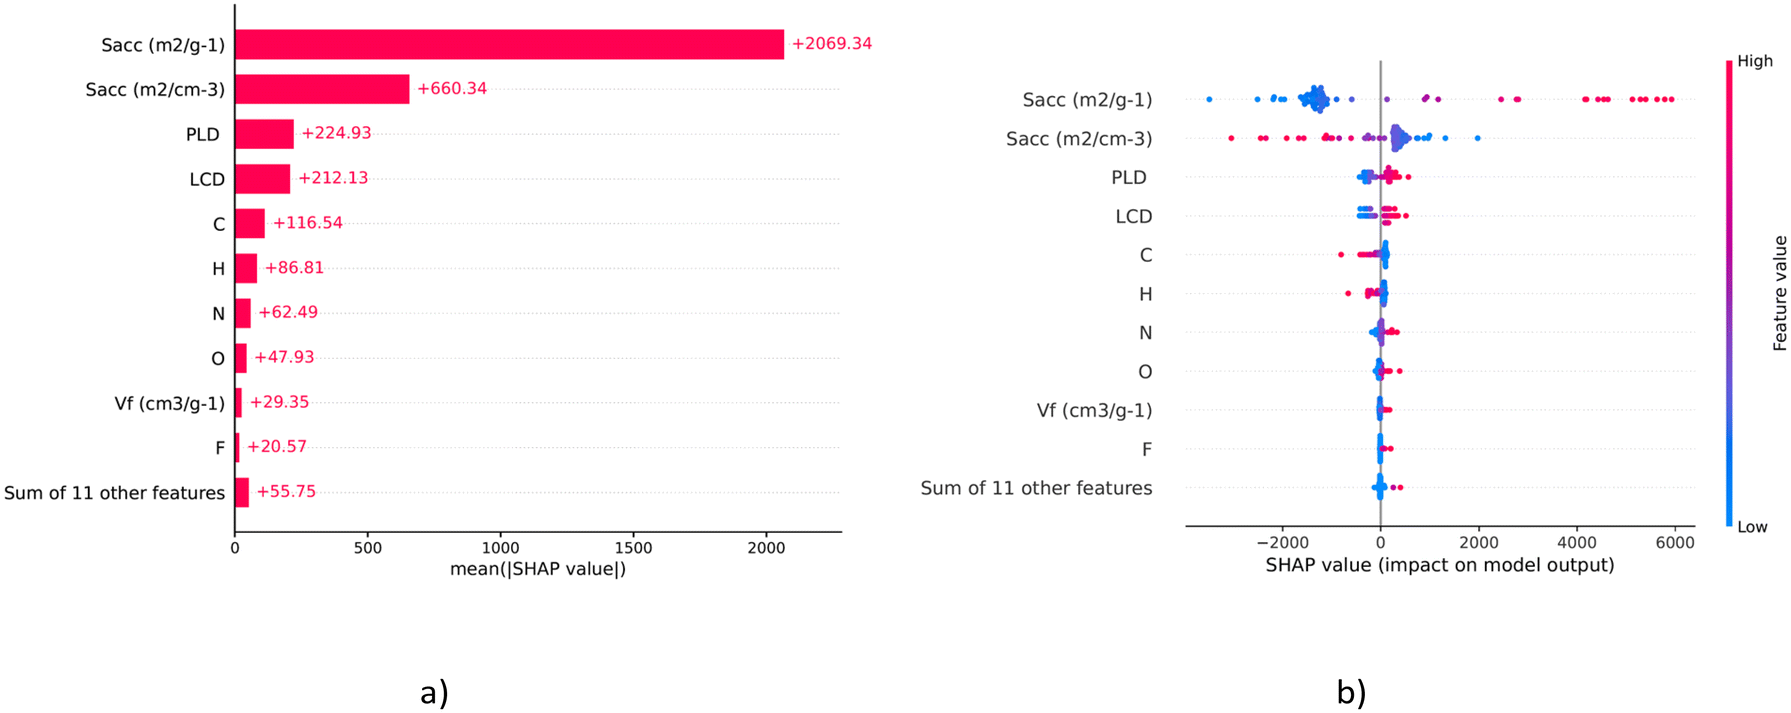
From Table 6, it can be deduced that DNN model-3 is the best among all the other models and has the lowest values of RMSE and MAE and the maximum value of R2. Hence, DNN model-3 was taken as the final ML model for further analysis. The SHAP feature importance chart and summary plot, shown in Fig. 14(a) and (b), respectively, provide comprehensive views of the impact each feature has on the model's predictions. These indicate the distribution of the impacts each feature has on the model's output, i.e., 5-FU loading. In SHAP analysis, a positive SHAP value indicates an increased likelihood of a more accurate prediction outcome and vice versa for the negative value. The accessible surface area “Sacc” has a wide range of effects, with a cluster of highly positive impact values. This suggests that higher Sacc values have a positive impact and are strongly associated with more accurate predictions. This is followed by the number of C and H atoms in the COF, which has a mixture of positive and negative impacts on the model's output. However, C consistently has a positive impact on the model predictions. The feature importance chart, derived from the mean absolute SHAP values, ranks the features by their overall impact on the model's predictions. Among the structural descriptors of the COF, Sacc, LCD and Vf determine the major impact on the model's output predictions and among the chemical descriptors, C, H and N exert the most positive impact on the model's output predictions. These findings can direct the synthesis of novel linkers that enhance COF performance for 5-FU loading.
 |
| | Fig. 14 SHAP (SHapley Additive exPlanations) analysis of the feature importance chart (a) and summary plot (b). | |
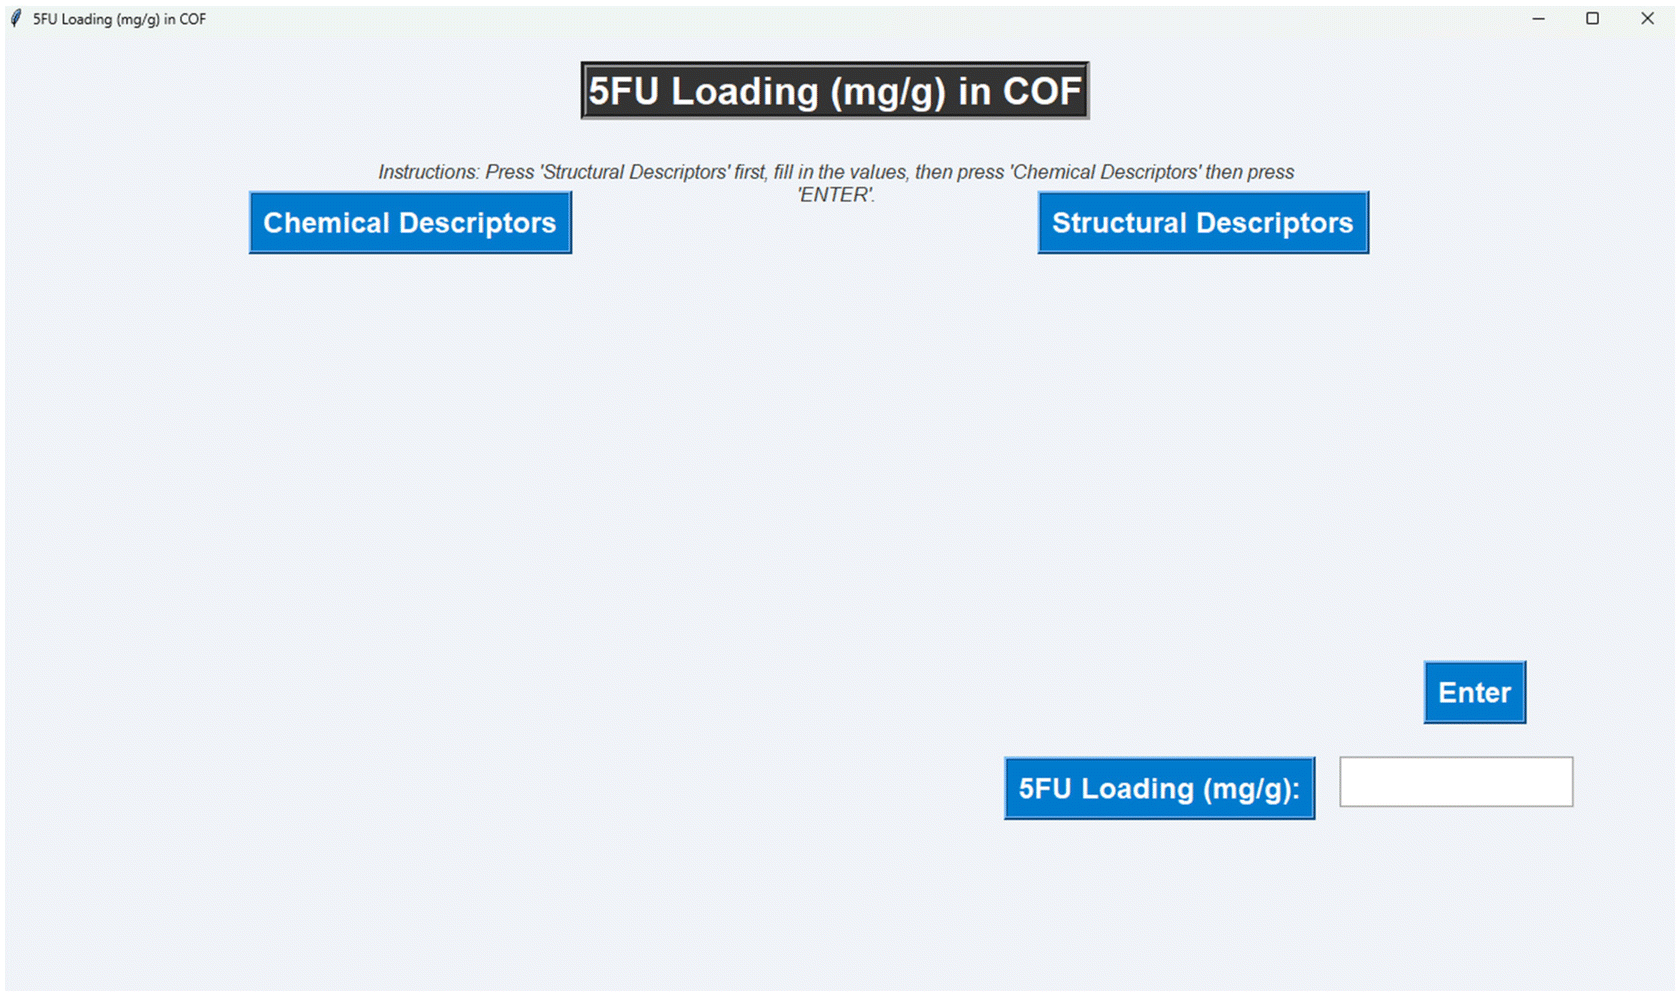
Graphical user interface
Finally, a GUI was created to help scientists predict the loading of 5-FU into COFs without running the actual code and performing experiments on drug loading. The user has to just input the chemical and structural descriptors of the COF (as given in Table 2), which predicts the 5-FU loading capacity. The main page of the GUI is shown in Fig. 15. The user has to first click the structural descriptors tab, followed by chemical descriptors and enter the values. Now the GUI requires the chemical and structural descriptors, as shown in Fig. 16. Afterwards, the user has to press the “ENTER” button which will allow the model to take the input values. Finally, the “5-FU loading (mg g−1)” tab needs to be clicked, which will lead to the model's predictions. The GUI offers a very user-friendly way of calculating the 5-FU loading for any given COF. The link to the GUI has been shared within this article: https://github.com/ashutoshy701/5FU-Loading.
 |
| | Fig. 15 The main page of the GUI. | |
 |
| | Fig. 16 The GUI page showing the chemical and structural descriptors. | |
Conclusion
This work provides a detailed GCMC simulation study on a database of COFs for the understanding of the mechanism and thermodynamics of the adsorption of the anticancer drug 5-FU. The methodology was first validated through the adsorption of 5-FU on various MOFs, since simulation data on COFs was not reported in the literature. RDF analysis and thermodynamic energy parameters revealed the importance of intermolecular interactions in appropriate drug binding and controlled release properties. The screening resulted in the shortlisting of 81 COFs from a total of 1242 COFs. There was a direct correlation between 5-FU loading and the textural properties of COFs such as PLD, surface area and void fraction in the cases of COF-102 to COF-108, and COF-112. Among the four top-performing COFs, three 2D COFs and one 3D COF were studied in detail. The total internal energy of adsorption, Ugh, was highest in the case of COF-362 (−42 × 103 kJ mol−1), followed by COF-363 (−15.94 × 10³ kJ mol−1), COF-398 (−9.40 × 10³ kJ mol−1), and COF-206 (−8.43 × 10³ kJ mol−1). These values indicate that COF-362 will exhibit the slowest release of 5-FU. This study highlights the role of molecular simulation and machine learning in the drug delivery application of advanced porous nanomaterials, i.e., COFs. In respect of machine learning, random forest, decision tree and deep neural networks were constructed from which DNN model-3 performed the best, and hence, it was chosen for further analysis. The SHapley Additive exPlanations (SHAP) analysis and feature importance chart indicate that, among the structural descriptors, i.e. Sacc, LCD, and Vf, and the chemical descriptors, i.e. C, H, and N, these factors exert the most positive influence on the model's output predictions. Finally, a GUI that is presented in this work will be very useful for predicting the 5-FU loading capacity by taking as input data the chemical and structural parameters of the COF. This will save time for users who will not need to run code and investigate preliminary experimental studies on drug loading.
Author contributions
The manuscript was written through contributions from both K. Y. and A. Y.
Data availability
An ESI† is also available with this work.
The GUI can be accessed through the following link: https://github.com/ashutoshy701/5FU-Loading.
Conflicts of interest
There are no conflicts of interest.
Acknowledgements
KY would like to thank the Anusandhan National Research Foundation (ANRF), and the Science and Engineering Research Board (SERB), DST, New Delhi, India, for supporting her with a National Postdoctoral Fellowship (NPDF) via sanction order: PDF/2022/003392.
References
- J. Q. Liu, X. F. Li, C. Y. Gu, J. C. da Silva, A. L. Barros, S. Alves-Jr, B. H. Li, F. Ren, S. R. Batten and T. A. Soares, A Combined Experimental and Computational Study of Novel Nanocage-Based Metal–Organic Frameworks for Drug Delivery, Dalton Trans., 2015, 44(44), 19370–19382, 10.1039/C5DT02171E.
- J. Liu, Z. Yang, Y. Che, Y. Zhang, Z. Zhang and C. X. Zhao, Computational Investigation of Metal Organic Frameworks as Potential Drug Carriers for Antihypertensive Amlodipine, AIChE J., 2022, 68(1), e17474, DOI:10.1002/aic.17474.
- B. Li, S. Gong, P. Cao, W. Gao, W. Zheng, W. Sun, X. Zhang and X. Wu, Screening of Biocompatible MOFs for the Clearance of Indoxyl Sulfate Using GCMC Simulations, Ind. Eng. Chem. Res., 2022, 61(19), 6618–6627, DOI:10.1021/acs.iecr.2c00283.
- Y. Chen, P. Li, J. A. Modica, R. J. Drout and O. K. Farha, Acid-Resistant Mesoporous Metal–Organic Framework toward Oral Insulin Delivery: Protein Encapsulation, Protection, and Release, J. Am. Chem. Soc., 2018, 140(17), 5678–5681, DOI:10.1021/jacs.8b02089.
- S. Liu, C. Hu, Y. Liu, X. Zhao, M. Pang and J. Lin, One-Pot Synthesis of DOX@ Covalent Organic Framework with Enhanced Chemotherapeutic Efficacy, Chem. – Eur. J., 2019, 25(17), 4315–4319, DOI:10.1002/chem.201806242.
- L. Bai, S. Z. F. Phua, W. Q. Lim, A. Jana, Z. Luo, H. P. Tham, L. Zhao, Q. Gao and Y. Zhao, Nanoscale Covalent Organic Frameworks as Smart Carriers for Drug Delivery, Chem. Commun., 2016, 52(22), 4128–4131, 10.1039/C6CC00853D.
- S. Das, T. Sekine, H. Mabuchi, T. Irie, J. Sakai, Y. Zhao, Q. Fang and Y. Negishi, Three-Dimensional Covalent Organic Framework with Scu-c Topology for Drug Delivery, ACS Appl. Mater. Interfaces, 2022, 14(42), 48045–48051, DOI:10.1021/acsami.2c15152.
- V. S. Vyas, M. Vishwakarma, I. Moudrakovski, F. Haase, G. Savasci, C. Ochsenfeld, J. P. Spatz and B. V. Lotsch, Exploiting Noncovalent Interactions in an Imine-Based Covalent Organic Framework for Quercetin Delivery, Adv. Mater., 2016, 28(39), 8749–8754, DOI:10.1002/adma.201603006.
- Y. Zhao, S. Das, T. Sekine, H. Mabuchi, T. Irie, J. Sakai, D. Wen, W. Zhu, T. Ben and Y. Negishi, Record Ultralarge-Pores, Low Density Three-Dimensional Covalent Organic Framework for Controlled Drug Delivery, Angew. Chem., Int. Ed., 2023, 62(13), e202300172, DOI:10.1002/anie.202300172.
- M. C. Bernini, D. Fairen-Jimenez, M. Pasinetti, A. J. Ramirez-Pastor and R. Q. Snurr, Screening of Bio-Compatible Metal–Organic Frameworks as Potential Drug Carriers Using Monte Carlo Simulations, J. Mater. Chem. B, 2014, 2(7), 766–774, 10.1039/C3TB21328E.
- M. Gomar and S. Yeganegi, Adsorption of 5-Fluorouracil, Hydroxyurea and Mercaptopurine Drugs on Zeolitic Imidazolate Frameworks (ZIF-7, ZIF-8 and ZIF-9), Microporous Mesoporous Mater., 2017, 252, 167–172, DOI:10.1016/j.micromeso.2017.06.010.
- L. Li, Y. Zhu, Z. Qi, X. Li, H. Pan, B. Liu and Y. Liu, GCMC Simulations to Study the Potential of MOFs as Drug Delivery Vehicles, Appl. Organomet. Chem., 2023, 37(9), e7199, DOI:10.1002/aoc.7199.
- A. T. Sose, H. D. Cornell, B. J. Gibbons, A. A. Burris, A. J. Morris and S. A. Deshmukh, Modelling Drug Adsorption in Metal–Organic Frameworks: The Role of Solvent, RSC Adv., 2021, 11(28), 17064–17071, 10.1039/d1ra01746b.
- Y. G. Proenza and R. L. Longo, Simulation of the Adsorption and Release of Large Drugs by ZIF-8, J. Chem. Inf. Model., 2019, 60(2), 644–652, DOI:10.1021/acs.jcim.9b00893.
- Y. Zhihong, Y. Ye, A. Pejhan, A. H. Nasr, N. Nourbakhsh and R. Tayebee, A theoretical study on the pure and doped ZnO nanoclusters as effective nanobiosensors for 5-fluorouracil anticancer drug adsorption, Appl. Organomet. Chem., 2020, 34, e5534, DOI:10.1002/aoc.5534.
- X. Xie, L. Zhang, W. Zhang, R. Tayebee, A. Hoseininasr, H. H. Vatanpour, Z. Behjati, S. Li, M. Nasrabadi and L. Liu, Fabrication of temperature and pH sensitive decorated magnetic nanoparticles as effective biosensors for targeted delivery of acyclovir anti-cancer drug, J. Mol. Liq., 2020, 309, 113024, DOI:10.1016/j.molliq.2020.113024.
- X. Sun, G. Huang, F. Shao, R. Tayebee, Z. Jalili and E. E. Shahri, Au-doped Fe3O4 nanoparticle as an effective nanocarrier for delivery of 5-fluorouracil anti-liver cancer drug, Inorg. Chem. Commun., 2024, 167, 112685, DOI:10.1016/j.inoche.2024.112685.
- Z. Liu, Z. Yu, L. Zhang, R. Tayebee, S. Pourmojahed, E. E. Shahri and X. Chen, Studying loading of 5-fluorouracil onto the surface of gold–silver nanocomposite utilizing DLS and UV–Vis spectroscopy, Chem. Pap., 2023, 77, 6135–6145, DOI:10.1007/s11696-023-02927-9.
- B. Ma, Y. Xu, F. Hu, L. Zhai, Y. Huang, H. Qiao, J. Xiong, D. Yang, Z. Ni, X. Zheng and L. Mi, Fluorinated Covalent Organic Frameworks for Efficient Drug Delivery, RSC Adv., 2022, 12, 31276–31281, 10.1039/d2ra05534a.
- S. Mitra, H. S. Sasmal, T. Kundu, S. Kandambeth, K. Illath, D. D. Díaz and R. Banerjee, Targeted Drug Delivery in Covalent Organic Nanosheets (CONs) via Sequential Postsynthetic Modification, J. Am. Chem. Soc., 2017, 139(12), 4513–4520, DOI:10.1021/jacs.7b00925.
- M. Tong, Y. Lan, Q. Yang and C. Zhong, Exploring the Structure-Property Relationships of Covalent Organic Frameworks for Noble Gas Separations, Chem. Eng. Sci., 2017, 168, 456–464, DOI:10.1016/j.ces.2017.05.004.
- N. M. Rodrigues and J. B. Martins, Theoretical Evaluation of the Performance of IRMOFs and M-MOF-74 in the Formation of 5-Fluorouracil@ MOF, RSC Adv., 2021, 11(49), 31090–31097, 10.1039/d1ra05068k.
- M. Gomar and S. Yeganegi, Adsorption of 5-Fluorouracil and Thioguanine Drugs into ZIF-1, ZIF-3 and ZIF-6 by Simulation Methods, Mater. Sci. Eng., C, 2019, 97, 461–466, DOI:10.1016/j.msec.2018.12.068.
- T. F. Willems, C. H. Rycroft, M. Kazi, J. C. Meza and M. Haranczyk, Algorithms and Tools for High-Throughput Geometry-Based Analysis of Crystalline Porous Materials, Microporous Mesoporous Mater., 2012, 149(1), 134–141, DOI:10.1016/j.micromeso.2011.08.020.
- D. Dubbeldam, S. Calero, D. E. Ellis and R. Q. Snurr, RASPA: Molecular Simulation Software for Adsorption and Diffusion in Flexible Nanoporous Materials, Mol. Simul., 2016, 42(2), 81–101, DOI:10.1080/08927022.2015.1010082.
- I. Goodfellow, Y. Bengio and A. Courville, Learning Deep, MIT Press, 2016, DOI:10.1007/s10710-017-9314-z.
- C. M. Bishop, Pattern Recognition and Machine Learning, Springer google schola 2006, vol. 2, pp. 1122–1128 Search PubMed, https://link.springer.com/book/9780387310732.
- R. Rengaswamy and R. Suresh, Data Science for Engineers, CRC Press, 2022, DOI:10.1201/b23276.
- S. Lundberg, A Unified Approach to Interpreting Model Predictions, arXiv, 2017, preprint, arXiv:1705.07874, DOI:10.48550/arXiv.1705.07874.
- C.-Y. Sun, C. Qin, X.-L. Wang, G.-S. Yang, K.-Z. Shao, Y.-Q. Lan, Z.-M. Su, P. Huang, C.-G. Wang and E.-B. Wang, Zeolitic Imidazolate Framework-8 as Efficient pH-Sensitive Drug Delivery Vehicle, Dalton Trans., 2012, 41(23), 6906–6909, 10.1039/C2DT30357D.
- L. Li, S. Han, S. Zhao, X. Li, B. Liu and Y. Liu, Chitosan Modified Metal–Organic Frameworks as a Promising Carrier for Oral Drug Delivery, RSC Adv., 2020, 10(73), 45130–45138, 10.1039/D0RA08459J.
- I. Erucar and S. Keskin, Computational Investigation of Metal Organic Frameworks for Storage and Delivery of Anticancer Drugs, J. Mater. Chem. B, 2017, 5(35), 7342–7351, 10.1039/C7TB01764B.
|
| This journal is © The Royal Society of Chemistry 2025 |
Click here to see how this site uses Cookies. View our privacy policy here. 
 Open Access Article
 This Open Access Article is licensed under a Creative Commons Attribution-Non Commercial 3.0 Unported Licence
 *a and
Ashutosh Yadav
*a and
Ashutosh Yadav