 Open Access Article
Polycondensation of L-lactic acid: a deeper look into solid state polycondensation†
Hans R.
Kricheldorf
*a,
Steffen M.
Weidner
 b and
Felix
Scheliga
a
aUniversität Hamburg, Institut für Technische und Makromolekulare Chemie, Bundesstraße 45, D-20146 Hamburg, Germany. E-mail: kricheld@chemie.uni-hamburg.de
bBAM – Bundesanstalt für Materialforschung und -prüfung, Richard Willstätter Straße. 11, D-12489 Berlin, Germany
First published on 23rd January 2025
Abstract
L-Lactic acid (LA) was condensed in the presence of SnCl2 or 4-toluenesulfonic acid (TSA) at 140 °C, and chain growth without cyclization was observed. In addition, poly(L-lactic acid)s (PLAs) with a degree of polymerization (DP) of 25, 50 or 100 were prepared by water-initiated ring-opening polymerization (ROP). These PLAs were annealed in the solid state at 140 °C and 160 °C in the presence of tin(II) 2-ethylhexanoate (SnOct2, SnCl2 or TSA). The changes in the molar mass distribution and in the topology were characterized by means of matrix-assisted laser desorption/ionization time-of-flight (MALDI-TOF) mass spectrometry and size exclusion chromatography (SEC). With increasing time, fewer side reactions caused higher molar masses and increasing fractions of cyclic polylactides (cPLA) were obtained. Their “saw tooth” pattern in the MALDI-TOF mass spectra indicated the formation of extended ring crystallites in the solid state. TSA was the most active catalyst and caused fewer side reactions than SnCl2, which was the least reactive catalyst. Acetylation of the CH-OH end groups hindered polycondensation and prevented the formation of cPLAs. Reaction mechanisms will be discussed.
Introduction
The first synthesis of a polymer was described by Gay-Lyssac and Pelouze, who accidentally prepared poly(D,L)-lactide (PDLA) by heating a concentrated aqueous solution of rac-D,L-lactic acid at 140 °C in vacuo.1 Of course, at that time, the authors did not understand the consequences of their experiment, as even the formula of lactic acid was not yet established. For more than 150 years, no one showed any interest in the polycondensation of D-, L- or L-lactic acid, while systematic studies of the ring-opening polymerization of L-lactide began around 1970.2,3 With the pioneering work of research groups at DuPont and Ethicon Inc (now Johnson & Johnson), interest in the medical and pharmaceutical applications of poly(L-lactic acid), PLA, and copolyesters of lactic acid grew rapidly.4–9A systematic study of the polycondensation of L-lactic acid was initiated more than 150 years later by chemists at Mitsui Chemicals Co.10–12 Their method was based on polycondensation in inert solvents with azeotropic removal of water and recycling of the liberated L-lactide. The rate of polycondensation increased with higher boiling points of the solvents, and diphenyl ether was found to be particularly useful. Different catalysts were compared, and the best results (Mw = 230![[thin space (1/6-em)]](https://www.rsc.org/images/entities/char_2009.gif) 000) were obtained with SnO and SnCl2. These polycondensation experiments were extended to different D/L-lactic acid ratios. The synthetic method of the Mitsui group has certain disadvantages, such as the need for a relatively expensive solvent, which is difficult to remove completely from the polylactides, and long reaction times compared to the ROP of LLA.
000) were obtained with SnO and SnCl2. These polycondensation experiments were extended to different D/L-lactic acid ratios. The synthetic method of the Mitsui group has certain disadvantages, such as the need for a relatively expensive solvent, which is difficult to remove completely from the polylactides, and long reaction times compared to the ROP of LLA.
In order to eliminate the solvent and to shorten the reaction time, Kimura and co-workers studied bulk polycondensation.13–18 Screening of different metal catalysts showed that SnCl2-2H2O gave the best results and an investigation of several acidic co-catalysts revealed that a 1![[thin space (1/6-em)]](https://www.rsc.org/images/entities/char_2009.gif) :
:![[thin space (1/6-em)]](https://www.rsc.org/images/entities/char_2009.gif) 1 combination with 4-toluenesulfonic acid (TSA) was the most efficient combination.14 However, even with this combination, polycondensations at 180 °C required reaction times of about 5 h to achieve Mw's up to 85
1 combination with 4-toluenesulfonic acid (TSA) was the most efficient combination.14 However, even with this combination, polycondensations at 180 °C required reaction times of about 5 h to achieve Mw's up to 85![[thin space (1/6-em)]](https://www.rsc.org/images/entities/char_2009.gif) 000, whereupon partial racemization occurred, while discoloration was avoided. In a later study SnCl2-2H2O was also combined with various metal oxides or alkoxides and Ge(OEt)4 was found to be the best partner for the tin chloride. However, these results were no better than those obtained with TSA as the co-catalyst.18 A breakthrough was achieved with a three-step process based on the SnCl2-2H2O/TSA catalyst.16,17 The first step consisted of a brief polycondensation in the melt at 180 °C to yield a low molar mass PLLA (Mw up to 13
000, whereupon partial racemization occurred, while discoloration was avoided. In a later study SnCl2-2H2O was also combined with various metal oxides or alkoxides and Ge(OEt)4 was found to be the best partner for the tin chloride. However, these results were no better than those obtained with TSA as the co-catalyst.18 A breakthrough was achieved with a three-step process based on the SnCl2-2H2O/TSA catalyst.16,17 The first step consisted of a brief polycondensation in the melt at 180 °C to yield a low molar mass PLLA (Mw up to 13![[thin space (1/6-em)]](https://www.rsc.org/images/entities/char_2009.gif) 000). The second step was crystallization at 105 °C for 2 h, followed by solid state polycondensation at 150 °C. Mw values up to 600
000). The second step was crystallization at 105 °C for 2 h, followed by solid state polycondensation at 150 °C. Mw values up to 600![[thin space (1/6-em)]](https://www.rsc.org/images/entities/char_2009.gif) 000 were achieved by this technique without significant racemization. However, annealing for 20 h was required. The original formulation of SnCl2 + TSA-catalyzed reactions in the amorphous phase published by Moon et al. is shown in Scheme S1.† A few years later Shyamroy et al. reported on polycondensations of lactic acid catalyzed by SnPh4 or tetramethyl dichlorodistannoxane.19 No solid state polycondensation (SSP) was applied and all Mw's were below 43
000 were achieved by this technique without significant racemization. However, annealing for 20 h was required. The original formulation of SnCl2 + TSA-catalyzed reactions in the amorphous phase published by Moon et al. is shown in Scheme S1.† A few years later Shyamroy et al. reported on polycondensations of lactic acid catalyzed by SnPh4 or tetramethyl dichlorodistannoxane.19 No solid state polycondensation (SSP) was applied and all Mw's were below 43![[thin space (1/6-em)]](https://www.rsc.org/images/entities/char_2009.gif) 000.
000.
In addition to homo-polylactide various co-polyesters of lactide have been prepared by SnCl2-catalyzed polycondensations. Matos et al. reported the synthesis of biodegradable and fully biosourced co-polyesters by transesterification and condensation of bishydroxyethyl-2,5-difuranate with oligo-polylactides.20 Sb2O3 and SnCl2 + TSA gave similar results, but the Mw's remained below 10![[thin space (1/6-em)]](https://www.rsc.org/images/entities/char_2009.gif) 000 despite reaction temperatures up to 210 °C. However, these temperatures may have been too high and caused degradation. Other polycondensation methods using lactide as comonomer have been reported. In addition, a paper of Katiyar and Nanavati described the synthesis of OH-terminated oligolactides followed by SSP, where uncorrected Mw's up to 228
000 despite reaction temperatures up to 210 °C. However, these temperatures may have been too high and caused degradation. Other polycondensation methods using lactide as comonomer have been reported. In addition, a paper of Katiyar and Nanavati described the synthesis of OH-terminated oligolactides followed by SSP, where uncorrected Mw's up to 228![[thin space (1/6-em)]](https://www.rsc.org/images/entities/char_2009.gif) 000 were achieved.21 The mechanism shown in Scheme S2† has been postulated, but not investigated.
000 were achieved.21 The mechanism shown in Scheme S2† has been postulated, but not investigated.
In this context, the aim of the present work was to study the polycondensation process by MALDI-TOF mass spectrometry (in addition to SEC), because this analytical technique has not been used by other research groups for the analysis of the SSP of PLA, although this technique is particularly useful to provide information on changes in functional end groups and on the formation or disappearance of cyclics. This study was performed in two steps. The first step was the polycondensation of lactic acid until the onset of crystallization. In the second step, crystalline PLAs with COOH end groups were prepared. Three samples with different number average molar masses (Mn's) were then annealed in the presence of three different catalysts and the solid-state reactions were characterized by MALDI-TOF mass spectrometry, SEC and DSC measurements.
Experimental
Materials
L-Lactide, (Corbion) was supplied by Thyssen-Uhde SE (Berlin) and recrystallized from toluene (99.98% extra dry, Thermo-Scientific Fisher, Schwerte, Germany). Tin(II) 2-ethylhexanoate (SnOct2, purity >96%), SnCl2, and 4-toluene sulfonic acid monohydrate (TSA) were also purchased from Thermo-Scientific Fisher. All catalysts were used as received.H2O-initiated syntheses of HO-PLA-COOH samples
Bu2SnO (0.08 mmol) and L-lactide (40 mmol) were weighed into a 50 mL Erlenmeyer flask under an argon blanket and a magnetic bar was added. Water (1.6 mmol) was injected as a 4 M solution in THF (0.4 mL). The reaction vessel was immersed into an oil bath thermostated at 140 °C. After 24 hours, part of the viscous reaction product was removed with a spatula. In the case of crystalline reaction products, the cold reaction product was crushed into pieces using a screwdriver. Yields of 94–96% were obtained for LA/H2O ratios >12 and yields of 92–94% for LA/H2O = 12.5, when the reaction products were dissolved in dichloromethane and precipitated into ligroin.Two analogous polymerizations were carried out with an LA/In ratio of 12.5/1 using 3.2 mmol of H2O, or with an LA/In ratio of 50/1 using 0.8 mmol of H2O.
Polycondensation of lactic acid (Table 1)
SnCl2 or TSA (0.25 mmol) and L-lactide (50 mmol) were weighed into a 100 mL round bottom flask and distilled water (50 mL) was added. This mixture was refluxed for 30 min and then gradually immersed into an oil bath thermostated at 140 °C. The reaction vessel was sealed with a glass stopper with a hole of approximately 5 mm in diameter. Most of the water was evaporated within 1 h. Heating was continued for 2 d and a sample of approx. 500 mg was taken for characterization. The residue was thermostated at 140 °C for another 4 days.Annealing experiments with lactyl/cat ratios of 250/1
SnCl2 or TSA (0.15 mmol) and PLA (5.3 g ∼37.5 mmol of lactyl units) were weighed into 50 mL Erlenmeyer flask and a magnetic bar was added. After dissolution in 50 mL of dry dichloromethane the reaction vessel was gradually immersed into an oil bath thermostated at 140 °C. After evaporation of the dichloromethane, the reaction vessel was closed with a glass stopper and steel spring. After two or six days, a portion of the sample was removed for characterization.Analogous experiments were conducted with SnOct2 which was added as a 1 M solution in toluene (0.15 mL).
Measurements
The 1H NMR measurements were performed with a Bruker AV 500 MHz FT NMR spectrometer in 5 mm sample tubes, using CDCl3 containing TMS as solvent and shift reference.The MALDI-TOF mass spectra were measured with an Autoflex Max mass spectrometer (Bruker Daltonik, Bremen, Germany). All spectra were recorded in the positive ion linear mode. The MALDI stainless steel targets were prepared from chloroform solutions of poly(L-lactide) (3–5 mg mL−1) doped with potassium trifluoroacetate (2 mg mL−1 in THF). Typically, 20 μL of the sample solution, 2 μL of the potassium salt solution and 50 μL of the matrix solution (DCTB – trans-2-[3-(4-tert-butylphenyl)-2-methyl-2-propenylidene] malononitrile, 20 mg mL−1 in CHCl3) were pre-mixed in an Eppendorf vial. A droplet (1 μL) of this solution was deposited on the MALDI target and, after evaporation of the solvent, inserted in the mass spectrometer. 8000 single spectra were recorded and accumulated from 4 different places of each spot.
The SEC measurements were performed in chloroform in a LC 1200 (Agilent, USA) instrument kept at 40 °C. The flow rate was1 mL min−1 and a refractive index detector was used. Samples were automatically injected (100 μL, 2–4 mg mL−1 in chloroform).
For instrument control and data calculation Win GPC software (Polymer Standards Service – PSS, Mainz, Germany) was applied. The calibration was performed using polystyrene standard sets (Polymer Standards Service – PSS, Mainz). The number average (Mn) and weight average (Mw) data listed in Tables 1–3 are uncorrected. SEC fractionation was performed manually by collecting of 0.5 mL of the eluent (every 30 seconds) into Eppendorf vials. After evaporation of the solvent, 25 μL of the MALDI matrix/salt solution was added to each vial. Target preparation was performed as described above.
| Exp. o. | Catalyst | Time (d) | M n (corr.) | M n (meas.) | M w (meas.) | Disp., Đ |
|---|---|---|---|---|---|---|
| a Calculated from Mn (meas.) with a correction factor of 0.68. b PLA crystallized after 6 d and had a Tm of 153.6 °C and a ΔHm of 194 J g−1. | ||||||
| 1A | SnCl2 | 2 | 540 | 800 | 3700 | 4.5 |
| 1B | SnCl2 | 6 | 950 | 1400 | 3900 | 2.8 |
| 2A | TSA | 2 | 540 | 800 | 4300 | 4.5 |
| 2Bb | TSA | 6 | 1200 | 1800 | 9300 | 5.2 |
| Exp. no. | Catalyst | Temp. (°C) | Time (d) | M n (corr.) | M n (meas.) | M w (meas.) | Disp., Đ | T m (°C) | ΔHm (J g−1) | Crystb (%) |
|---|---|---|---|---|---|---|---|---|---|---|
a Calculated from Mn (meas.) with a correction factor of 0.68. The theoretical Mn is 1800 calculated for 100% conversion.
b Calculated with a  of 115 J g−1. of 115 J g−1.
|
||||||||||
| 1 | — | 140 | 1 | 2200 | 3500 | 6400 | 1.8 | 150.2 | 58.6 | 51 |
| 2 | SnOct2 | 140 | 14 | 4000 | 6000 | 19![[thin space (1/6-em)]](https://www.rsc.org/images/entities/char_2009.gif) 500 500 |
3.2 | 168.7 | 57.4 | 50 |
| 3 | SnCl2 | 140 | 14 | 3000 | 4900 | 19![[thin space (1/6-em)]](https://www.rsc.org/images/entities/char_2009.gif) 000 000 |
3.9 | 172.4 | 54.5 | 48 |
| 4 | TSA | 140 | 14 | 4800 | 7200 | 26![[thin space (1/6-em)]](https://www.rsc.org/images/entities/char_2009.gif) 000 000 |
3.6 | 174.0 | 68.7 | 60 |
| Exp. no. | Catalyst | Temp. (°C) | Time (d) | M n (corr.) | M n (meas.) | M w (meas.) | Disp., Đ | T m (°C) | ΔHm (J g−1) | Crystb (%) |
|---|---|---|---|---|---|---|---|---|---|---|
a The theoretical Mn is 3600 calculated for 100% conversion.
b Calculated with a  of 115 J g−1. of 115 J g−1.
|
||||||||||
| 1 | — | 140 | 1 | 4700 | 7000 | 12![[thin space (1/6-em)]](https://www.rsc.org/images/entities/char_2009.gif) 200 200 |
1.7 | 161.3 | 59.0 | 51 |
| 2A | SnOct2 | 140 | 14 | 8300 | 12![[thin space (1/6-em)]](https://www.rsc.org/images/entities/char_2009.gif) 200 200 |
21![[thin space (1/6-em)]](https://www.rsc.org/images/entities/char_2009.gif) 100 100 |
1.7 | 169.8 | 72.0 | 62 |
| 2B | SnOct2 | 160 | 7 | 11![[thin space (1/6-em)]](https://www.rsc.org/images/entities/char_2009.gif) 100 100 |
17![[thin space (1/6-em)]](https://www.rsc.org/images/entities/char_2009.gif) 300 300 |
31![[thin space (1/6-em)]](https://www.rsc.org/images/entities/char_2009.gif) 000 000 |
1.8 | 174.7 | 70.1 | 60 |
| 3A | SnCl2 | 140 | 14 | 7300 | 10![[thin space (1/6-em)]](https://www.rsc.org/images/entities/char_2009.gif) 600 600 |
20![[thin space (1/6-em)]](https://www.rsc.org/images/entities/char_2009.gif) 000 000 |
1.9 | 170.1 | 83.6 | 73 |
| 3B | SnCl2 | 160 | 7 | 5500 | 7700 | 25![[thin space (1/6-em)]](https://www.rsc.org/images/entities/char_2009.gif) 000 000 |
3.3 | 172.0 | 74.1 | 64 |
| 4A | TSA | 140 | 14 | 10![[thin space (1/6-em)]](https://www.rsc.org/images/entities/char_2009.gif) 000 000 |
14![[thin space (1/6-em)]](https://www.rsc.org/images/entities/char_2009.gif) 000 000 |
25![[thin space (1/6-em)]](https://www.rsc.org/images/entities/char_2009.gif) 000 000 |
1.8 | 176.2 | 94.9 | 82 |
| 4B | TSA | 160 | 7 | 12![[thin space (1/6-em)]](https://www.rsc.org/images/entities/char_2009.gif) 000 000 |
18![[thin space (1/6-em)]](https://www.rsc.org/images/entities/char_2009.gif) 000 000 |
29![[thin space (1/6-em)]](https://www.rsc.org/images/entities/char_2009.gif) 000 000 |
1.6 | 180.5 | 101.2 | 88 |
The differential scanning calorimetry (DSC) heating traces were recorded on a Mettler-Toledo DSC-1 freshly calibrated with indium and zinc and equipped with Stare Software-11. The heating rate was 10 K min−1. Only the first heating traces were evaluated.
Results and discussion
Polycondensation of L-lactic acid
To simulate a polycondensation of lactic acid LA and SnCl2 or LA and TSA were refluxed in water for 1 h. These catalysts were selected, because they are the most widely used catalysts for polycondensations of LA and glycolide. Afterwards, the aqueous solution was concentrated at normal pressure and annealed at 140 °C (Table 1). The SEC data indicated that the low molar masses increased with longer times even when vacuum was not applied. The SEC elution curves also indicated a relatively complex polycondensation process, because up to four shoulders or maxima were found e.g. for SnCl2 (Fig. S1, ESI†). In the case of TSA this trend was less pronounced, presumably due to more efficient transesterification.A more striking difference between the two catalysts was the finding that the TSA catalyzed PLA crystallized over the course of 6 days, whereas the SnCl2-catalyzed product did not. The MALDI TOF mass spectra revealed the origin of this difference as demonstrated in Fig. 1. Whereas the TSA catalyzed sample exclusively displayed the mass peaks of the HO-CH and COOH-terminated chains (Lax), respectively of their potassium salts (HO-CH/COOK, LaxK) (Fig. 1B); the SnCl2-catalyzed product displayed three more mass peaks (masses in red, orange and violet color) indicating considerable side reactions (Fig. 1A). Peaks with Δm + 8 Da relative to the La chains can be assigned to chains with a COOSnCl end group on one side and a CH-OH group on the other side. However, no plausible assignments were found for the additional peaks with Δm + 43 or +46 Da relative to La.
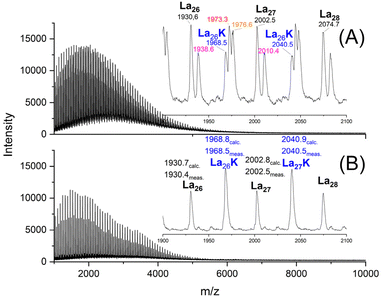 | ||
| Fig. 1 MALDI TOF mass spectra PLAs prepared by polycondensation of LA: (A) catalyzed with SnCl2 after 6 d at 140 °C (1B, Table 1), (B) catalyzed with TSA after 6 d at 140 °C (2B, Table 1). | ||
Another unexpected result was the total absence of cyclic oligomers regardless of catalyst and time.
Polycondensation of HO-PLA-12
As recently described,22 PLAs terminated with HO-CH and COOH groups were prepared by initiation with water at LA/H2O ratios of 12.5/1, 25/1 and 50/1 (HO-PLA-12, HO-PLA-25, HO-PLA-50). Bu2SnO was used as the catalyst at 140 °C, because it was found to give the lowest dispersities, at least for low LA/H2O ratios (Đ < 1.4). These PLA samples served as starting materials for annealing experiments with addition of catalysts. The MALDI-TOF mass spectra of all three samples are displayed in Fig. S2 (ESI†) for comparison with the mass spectra obtained after annealing. Characteristic is the predominance of the even-numbered chains despite the long polymerization time and the relatively high temperature. It should also be noted that the maxima of these mass spectra do not parallel the increasing molar masses. This fact is not limited to H2O-initiated PLAs, but was also observed for alcohol-initiated polymerizations in bulk at or around 120 °C. The SEC elution curves had an almost monomodal character with slight shoulders as exemplarily demonstrated in Fig. 2A. It should also be noted that these mass spectra (similar to Fig. 1 and most of the other mass spectra in this paper) are complicated by a second series of peaks representing the linear chains with potassium carboxylate (COOK) end groups resulting from the excess of K-trifluoroacetate used as MALDI dopant.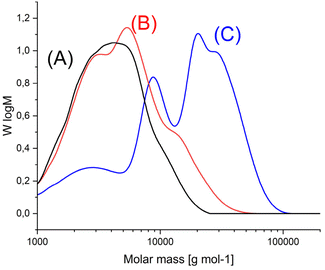 | ||
| Fig. 2 SEC mass distribution curves of (A) HO-PLA-12, (B) after annealing for 1 d at 140 °C (1, Table 2), (C) after annealing for 14 d at 140 °C in the presence of SnCl2 (3, Table 2). | ||
HO-PLA-12 was combined in solution with three different catalysts: SnOct2, SnCl2 and TSA, and after evaporation of the solvent, annealing of the solid sample was continued at 140 °C (Table 2). Additional annealing at 160 °C as performed with HO-PLA-25 and HO-PLA-50 (see below), was not feasible, because a brownish tar appeared within a few hours at 160 °C indicating melting and decomposition of a fraction of HO-PLA-12 crystals.
After annealing at 140 °C elution curves showing more pronounced shoulders or even two or three maxima (Fig. 2B) were found, indicating a non-continuous character of the molar mass distribution (MMD), or in other words, an overlapping of two or more different MMDs. Independently of this phenomenon, the SEC data clearly demonstrate that annealing at 140 °C results in a significant increase in molar mass regardless of the catalyst, but the highest number average (Mn) and weight average (Mw) values were obtained with TSA (Table 2). For the Mn values approximately a doubling of the molar masses and for Mw a tripling or even a quadrupling was observed, so that the dispersities increased significantly.
The mass spectra revealed the following features. The maximum of the mass peak distribution shifted to values almost twice as high as those of the starting material (Fig. 3) which showed a maximum around m/z 1800–2000 after annealing without catalyst at 140 °C/1 d (Fig. S2A†).
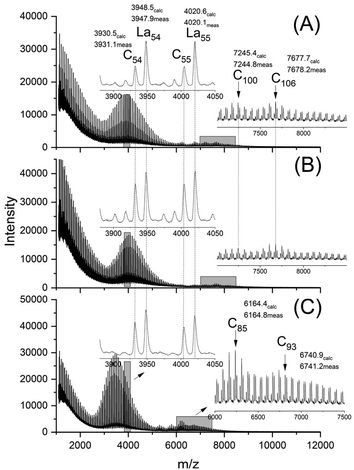 | ||
| Fig. 3 MALDI TOF mass spectra of HO-PLA-12 annealed for 14 d at 140 °C; (A) with SnOct2 (2A, Table 2), (B) with SnCl2 (3A, Table 2) and (C) with TSA (4A, Table 2). | ||
This shift was slightly more pronounced for TSA as catalyst in agreement with Mn-values. When the TSA catalyzed sample was fractionated, the mass spectra revealed higher maxima which were multiples of the maximum of the Mn of the HO-PLA-12 (Fig. 4).
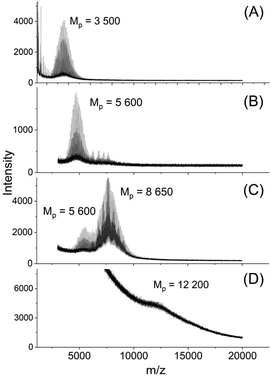 | ||
| Fig. 4 MALDI TOF mass spectra of fractionated HO-PLA-12 annealed with TSA at 140 °C for 14 d, (A)–(D) SEC fractions with decreasing elution time. | ||
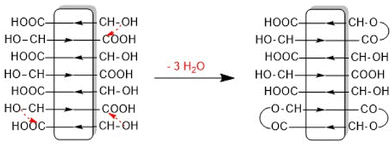
This structure of the PLA is consistent with the multimodal character of the SEC elution curve which is similar to that of Fig. 2B. An analogous sequence of multiples of the starting material slightly less pronounced was also found for both tin catalysts. This structure of the annealed PLAs suggests that the chain growth was mainly, if not exclusively, a consequence of condensation reactions across the surface of the crystallites (Scheme 1).
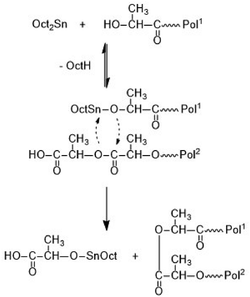
Depending on the catalyst three different esterification mechanisms may be involved. For SnOct2, which is a poor Lewis acid, and thus, a poor esterification catalyst, but an excellent transesterification catalyst, the reaction pathway formulated in Scheme 2 is the most likely mechanism.
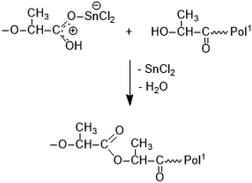
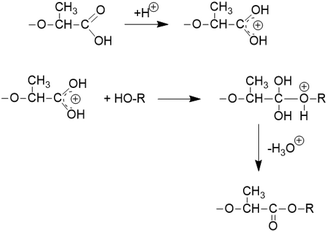
It is consistent with the coordination–insertion mechanism established for the alcohol-initiated ROP of LA. The Lewis acid SnCl2 can form a complex with the COOH group which can react with an adjacent OH group as shown in Scheme 3. Since the complexed COOH group is several orders of magnitude more acidic than the free COOH group, it can also act as a proton donor and cause the proton-catalyzed esterification mechanisms outlined in Scheme 4. For TSA, the proton-catalyzed esterification reaction formulated in Scheme 4 is certainly the most likely mechanism, as this mechanism has been established in organic chemistry for at least 70 years.
The assumption that the SSP proceeds mainly across the surface of the crystallites and not in the amorphous phase is supported by the observation that the formation of cycles was detected (Fig. 3C, inset), in contrast to the polycondensation of molten LA (Table 1 and Fig. 1). Furthermore, at least in the case of SnOct2 and TSA-catalyzed SSPs, the mass peaks of the cyclic PLAs display a characteristic “saw-tooth pattern” (STP) which has been observed by the authors for numerous annealed cyclic PLAs prepared by various catalysts. This STP is characteristic of extended-ring crystals (Scheme 5D) which, for reasons discussed in several previous publications,23–26 represent a thermodynamic optimum for PLAs with masses below 20![[thin space (1/6-em)]](https://www.rsc.org/images/entities/char_2009.gif) 000 Da. The formation of extended-ring crystallites, which show a STP in the mass spectra has recently been reported for the SSP of PLA alkyl esters. Their formation requires a combination of condensation and several transesterification reactions. The first step is the formation of loops on both sides of the crystallites by esterification or transesterification according to Schemes 2–4.† However, individual cycles within a crystallite do not yet yield an extended-ring crystal. Migration of individual cycles across the crystallite is necessary for numerous cycles to meet and form the extended ring crystal. This process certainly does not involve a migration of complete cycles, because they are fixed in the crystal lattice, but it can be explained by the migration of loops across the crystal surface (Scheme 5), which results from the reaction of loops with neighboring functional groups. The mechanisms involved in this process are the coordination–insertion mechanism formulated in Scheme 2 for tin-catalyzed transesterification or the proton-catalyzed transesterification outlined in Scheme 6. This mechanism is nothing more than an analogy to the esterification mechanism formulated in Scheme 4. The crucial role of the free OH groups is underlined by the experiments with acetylated PLAs discussed below.
000 Da. The formation of extended-ring crystallites, which show a STP in the mass spectra has recently been reported for the SSP of PLA alkyl esters. Their formation requires a combination of condensation and several transesterification reactions. The first step is the formation of loops on both sides of the crystallites by esterification or transesterification according to Schemes 2–4.† However, individual cycles within a crystallite do not yet yield an extended-ring crystal. Migration of individual cycles across the crystallite is necessary for numerous cycles to meet and form the extended ring crystal. This process certainly does not involve a migration of complete cycles, because they are fixed in the crystal lattice, but it can be explained by the migration of loops across the crystal surface (Scheme 5), which results from the reaction of loops with neighboring functional groups. The mechanisms involved in this process are the coordination–insertion mechanism formulated in Scheme 2 for tin-catalyzed transesterification or the proton-catalyzed transesterification outlined in Scheme 6. This mechanism is nothing more than an analogy to the esterification mechanism formulated in Scheme 4. The crucial role of the free OH groups is underlined by the experiments with acetylated PLAs discussed below.
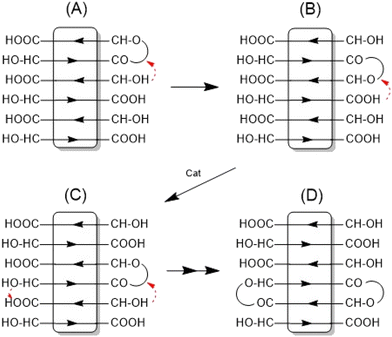 | ||
| Scheme 5 Formation of extended-ring crystallites via “wandering of loops” across the surface of crystallites. | ||
Such a process of “wandering loops” has already been postulated for the SSP of PLA alkyl esters.27 Once a nucleus of extended-ring crystals has been formed, for example in a corner of a crystallite, it acts as a thermodynamic trap for approaching cycles, because the extended-ring crystals represent a thermodynamic optimum for chains and rings with masses below 20![[thin space (1/6-em)]](https://www.rsc.org/images/entities/char_2009.gif) 000 Da. Since the esterification and transesterification mechanisms catalyzed by protons (TSA) are quite different from the tin-catalyzed transesterification mechanism studied so far, it was not predictable that the formation of extended-ring crystals could be observed for TSA-catalyzed SSPs of PLAs having a COOH end group.
000 Da. Since the esterification and transesterification mechanisms catalyzed by protons (TSA) are quite different from the tin-catalyzed transesterification mechanism studied so far, it was not predictable that the formation of extended-ring crystals could be observed for TSA-catalyzed SSPs of PLAs having a COOH end group.
Finally, it should be mentioned that the extended-ring crystals formed under the given conditions represent only a small fraction of the total sample (roughly estimated <10%) and thus, it is not expected that measurements such as DSC and small-angle X-ray scattering (SAXS), which show broad signals or reflections, will allow their detection. Furthermore, it should be noted that the α-modification is the most thermodynamically stable crystal modification of PLA above 120 °C, i.e. linear and cyclic PLAs adopt the same crystal lattice upon annealing at 140 °C, and WAXS measurement cannot monitor the changes observed by mass spectrometry.
Polycondensation of HO-PLA-25 and HO-PLA-50
Annealing at 140 °C with SSP catalyzed by the three catalysts mentioned above was also performed with HO-PLA-25 (Table 3) and HO-PLA-50 (Table 4). These experiments served two purposes. First, they were intended to test the reproducibility of the results obtained from the annealing of HO-PLA-12. Second, because of the higher melting temperature and thermal stability of the PLAs consisting of longer chains, it was expected that annealing at 160 °C might be feasible. However, it was found that when annealed at 160 °C, a brownish tar began to appear after 6 d. Therefore, these annealing experiments were not extended beyond 7 d. The trends observed for both, HO-PLA-25 and HO-PLA-50 were the same, but the individual data and spectra were slightly different. The SEC measurements of HO-PLA showed again a substantial increase of Mn and Mw after annealing at 140 °C/14 d with a doubling of the initial Mn when TSA was used as catalyst. Remarkable was the enormous increase of the dispersity after annealing at 160 °C based on a more pronounced growth of Mw relative to Mn. The complexity of the molar mass distribution resulting from the doubling tripling and quadrupling of the initial molar mass is evident from the trimodal SEC curves that were obtained with all three catalysts exemplarily illustrated in Fig. 5A. The growth of Mn was less pronounced in the case of HO-PLA-50, but the growth of Mw and dispersity was again strong. With TSA, the maximum Mw of this work (69![[thin space (1/6-em)]](https://www.rsc.org/images/entities/char_2009.gif) 000) was achieved after annealing at 160 °C, representing more than a quadrupling of the initial Mw achieved. Interestingly, the elution curves recorded at 160 °C showed a trend towards a monomodal character with weak shoulders ((Fig. 5B), representative for all three catalysts), in contrast to the trimodal character observed at 140 °C.
000) was achieved after annealing at 160 °C, representing more than a quadrupling of the initial Mw achieved. Interestingly, the elution curves recorded at 160 °C showed a trend towards a monomodal character with weak shoulders ((Fig. 5B), representative for all three catalysts), in contrast to the trimodal character observed at 140 °C.
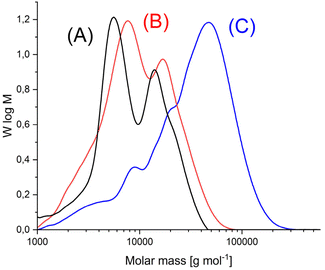 | ||
| Fig. 5 SEC mass distribution curves of (A) HO-PLA-25, (B) annealed with SnOct2, at 140 °C for 14 d (2A, Table 3), (C) annealed with SnOct2 at 160 °C for 6 d (2B, Table 4). | ||
| Exp. no. | Catalyst | Temp. (°C) | Time (d) | M n (corr.) | M n (meas.) | M w (meas.) | Disp., Đ | T m (°C) | ΔHm (J g−1) | Crystb (%) |
|---|---|---|---|---|---|---|---|---|---|---|
a The theoretical Mn is 7200 calculated for 100% conversion.
b Calculated with a  of 115 J g−1. of 115 J g−1.
|
||||||||||
| 1 | — | 140 | 1 | 7500 | 11![[thin space (1/6-em)]](https://www.rsc.org/images/entities/char_2009.gif) 100 100 |
16![[thin space (1/6-em)]](https://www.rsc.org/images/entities/char_2009.gif) 200 200 |
1.5 | 169.5 | 79.0 | 68 |
| 2A | SnOct2 | 140 | 14 | 8300 | 12![[thin space (1/6-em)]](https://www.rsc.org/images/entities/char_2009.gif) 400 400 |
25![[thin space (1/6-em)]](https://www.rsc.org/images/entities/char_2009.gif) 000 000 |
2.0 | 173.6 | 80.0 | 69 |
| 2B | SnOct2 | 160 | 7 | 6800 | 9500 | 40![[thin space (1/6-em)]](https://www.rsc.org/images/entities/char_2009.gif) 000 000 |
4.2 | 170.5 | 75.1 | 65 |
| 3A | SnCl2 | 140 | 14 | 13![[thin space (1/6-em)]](https://www.rsc.org/images/entities/char_2009.gif) 200 200 |
19![[thin space (1/6-em)]](https://www.rsc.org/images/entities/char_2009.gif) 200 200 |
32![[thin space (1/6-em)]](https://www.rsc.org/images/entities/char_2009.gif) 000 000 |
1.7 | 177.2 | 91.3 | 80 |
| 3B | SnCl2 | 160 | 7 | 10![[thin space (1/6-em)]](https://www.rsc.org/images/entities/char_2009.gif) 300 300 |
15![[thin space (1/6-em)]](https://www.rsc.org/images/entities/char_2009.gif) 500 500 |
51![[thin space (1/6-em)]](https://www.rsc.org/images/entities/char_2009.gif) 000 000 |
3.3 | 179.4 | 97.5 | 84 |
| 4A | TSA | 140 | 14 | 13![[thin space (1/6-em)]](https://www.rsc.org/images/entities/char_2009.gif) 800 800 |
19![[thin space (1/6-em)]](https://www.rsc.org/images/entities/char_2009.gif) 900 900 |
34![[thin space (1/6-em)]](https://www.rsc.org/images/entities/char_2009.gif) 800 800 |
1.8 | 179.6 | 100.1 | 86 |
| 4B | TSA | 160 | 7 | 12![[thin space (1/6-em)]](https://www.rsc.org/images/entities/char_2009.gif) 300 300 |
18![[thin space (1/6-em)]](https://www.rsc.org/images/entities/char_2009.gif) 500 500 |
69![[thin space (1/6-em)]](https://www.rsc.org/images/entities/char_2009.gif) 000 000 |
3.6 | 185.6 | 94.5 | 81 |
The MALDI-TOF mass spectra were nearly identical for both HO-PLA-25 and HO-PLA-50. Two spectra recorded from HO-PLA-25 are displayed in Fig. S3† for samples annealed at 140 °C for 14 d. Annealing at 160 °C did not cause any significant change in these spectra (Fig. S4†). Characteristic is a STP for the SnOct2 doped sample, which is barely detectable in the case of the TSA-doped experiments (Fig. S3B and S4B†). The mass spectra recorded for the HO-PLA-50 samples after annealing at 160 °C are presented in Fig. 6. They display more clearly than those of HO-PLA-25 the formation of cycles with a pronounced STP, independent of the catalyst. Since these mass peaks appear preferentially in the mass range of m/z 6000–9000 it is plausible that their formation was favored by the higher molar mass of HO-PLA-50 compared to HO-PLA-12 and HO-PLA-25. The mass range of the cyclic PLAs with STP observed in this work is in perfect agreement with the mass range observed for cyclic PLAs prepared by other methods.23–27 This observation and their increase with longer annealing times or higher temperatures underlines the conclusion that their formation is a thermodynamically favored process. Finally, it should be emphasized that the mass spectra presented in Fig. S3 and S4† clearly show a characteristic difference between SnOct2 and TSA, reflecting the different reaction mechanisms. SnOct2 favors cycle formation much more than TSA, while TSA favors chain growth.
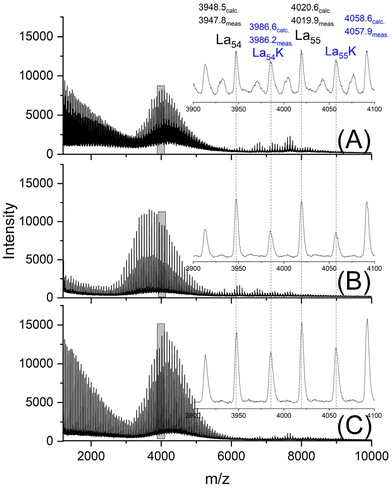 | ||
| Fig. 6 MALDI-TOF mass spectra of HO-PLA-50 annealed at 140 °C for 14 d; (A) with SnOct2 (2A, Table 4), (B) with SnCl2 (3A, Table 4), (C) with TSA (4A, Table 4). | ||
Polycondensation of acetylated HO-PLA-25
HO-PLA-25 was acetylated with acetic anhydride under conditions elaborated for PLA alkyl esters. The Ac-PLA-25 was the mixed with SnOct2 or TSA in CH2Cl2 and annealed (after evaporation) for 14 d at 140 °C quite analogous to the experiments listed in Tables 2–4. The SEC measurements revealed only a slight increase of Mn and Mw (<10%) and no cycles were detected in the mass spectra. Quite analogous results were found, when the SSP of acetylated PLA alkyl esters were investigated. Therefore, the results obtained in the present work and in a previous study28 of PLA alkyl esters demonstrate that the presence of a free OH end group is necessary for efficient transesterification and esterification reactions regardless of the catalyst.DSC measurements
The starting materials were annealed at140 °C for 1 d without the addition of catalysts to obtain melting temperatures (Tm) and melting enthalpies (ΔHm), which should serve as a basis for comparison with the results obtained by SSP. The data listed under Exp. No. 1 in Tables 2, 3 and 4 demonstrate that, as expected for low molar mass samples, both Tm and ΔHm increase with the molar mass. For all three HO-PLA samples a considerable increase of both Tm and ΔHm was observed after annealing at 140 °C for 14 d, regardless of the catalyst. When the temperature was raised to 160 °C, a brownish syrup appeared within a few hours in the case of HO-PLA-12 indicating melting and decomposition of a significant fraction of the crystallites Therefore, annealing at 160 °C was not continued in this case. Further annealing at 160 °C of HO-PLA-25 and HO-PLA-50 showed the beginning of the formation of a brownish syrup after 6 d, so that these experiments were terminated after 7 d. Due to the beginning decomposition, the influence of this additional annealing was complex. In all cases the Tm increased slightly, and the highest Tm was obtained for the sample with the highest molar mass in combination with TSA (No. 3B, Table 4). This Tm was above 180 °C, which is the upper limit for the kinetically controlled morphology of PLA. However, it has recently been shown by the authors that annealing in the presence of a polymerization (transesterification) catalyst can increase the crystal thickness and cause a smoothing of the crystal surfaces.23–26 Both modifications of the crystallites had the consequence that a thermodynamically controlled high melting morphology is formed with Tm's above 190 °C and in optimal cases, such as high molar mass cyclic PLAs, even Tm's up to 200–201 °C were reached. The results obtained in this work were still far from this optimum, but the Tm of sample No 3B (Table 4) indicated that the transformation process was underway.In this context, the DSC curves of HO-PLA-12 are remarkable. The melting endotherms displayed two tips, indicating two populations of crystallites with slightly different degrees of perfection (Fig. 7). Of particular interest is a tiny endotherm around 193 °C in the DSC trace of the TSA-catalyzed sample (Fig. 7B).
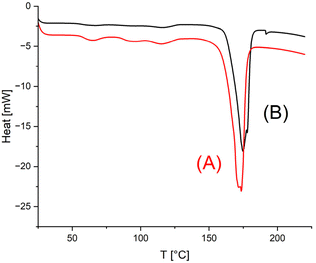 | ||
| Fig. 7 DSC traces (1st heating) of HO-PLA-12 annealed at 140 °C for 14 d: (A) with SnCl2 (3, Table 1), (B) with TSA (4, Table 2). | ||
The ΔHm values did not all increase upon annealing at 160 °C most likely as consequence of beginning degradation. Regarding the calculation of the crystallinity from the ΔHm values it should be mentioned that the authors used a  as reference for an ideal crystal of 215 J g−1, for reasons discussed in previous publications.25,26 Most of the crystallinities of PLAs reported in the literature (e.g. ref. 27 and 29) were calculated on the basis of
  of 93 J g−1.30,31 More recently, a
  of 205 J g−1 was recommended by two research groups32,33 and also used by the authors in some publications. However, all these
  values are too low and thus all the previously reported crystallinities of PLAs are 10–20% too high. Nevertheless, crystallinities above 80% were found for several samples listed in Tables 3 and 4. Remarkably, not only the highest Tm but also the highest ΔHm values were achieved with TSA. Therefore, based on the mass spectra, SEC and DSC measurements, it can be concluded that TSA was the most effective and most useful catalyst in the present study.
Conclusions
From the results of the present study, the following conclusions can be drawn. First, when compared to both tin catalysts, TSA showed the best performance in terms of high molar masses, high Tm's and high crystallinity. It also caused fewer side reactions compared to SnCl2. Second, no significant amounts of cycles were formed during the early stage of polycondensation in the melt at 140 °C. Third, cycles were formed in the solid state and crystallized separately from the linear chains in the form of extended-ring crystals. Fourth, both polycondensation and cyclization proceed primarily by the formation of loops on the surface of the crystallites. Fifth, SnOct2 favors formation of cycles, while TSA favors chain growth.Author contributions
HRK – conceptualization, investigation, methodology, writing – original draft, SMW – investigation, methodology, visualization, writing – review & editing, FS – investigation, methodology, visualization, writing – review & editing.Data availability
Data for this article are available at Zenodo at https://doi.org/10.1039/D4PY01191K.Conflicts of interest
There are no conflicts to declare.Acknowledgements
The authors wish to thank A. Myxa (BAM, Berlin) for the SEC measurements and S. Bleck (TMC, Hamburg) for the DSC measurements. The authors also thank Dr U. Mühlbauer (Thyssen-Uhde SE, Berlin) for having kindly supplied the L-lactide.References
- J. Gay-Lussac and J. Pelouze, Ann. Chim. Phys., 1833, 52, 410–424 Search PubMed.
- K. C. Frisch and S. L. Reegen, Ring-opening polymerization, M. Dekker, 1969 Search PubMed.
- V. W. Dittrich and R. C. Schulz, Angew. Makromol. Chem., 1971, 15, 109–126 CrossRef.
- E. M. Filachione, UK Pat, 550837, 1953 Search PubMed.
- N. A. Higgins, US Pat, 2767945, 1954 Search PubMed.
- C. E. Lowe, US Pat, 2668162, 1954 Search PubMed.
- A. K. Schneider, US Pat, 2703316, 1971 Search PubMed.
- D. Wassermann, US Pat, 1375008, 1971 Search PubMed.
- A. K. Schneider, US Pat, 3636956, 1972 Search PubMed.
- M. Ajioka, K. Enomoto, K. Suzuki and A. Yamaguchi, Bull. Chem. Soc. Jpn., 1995, 68, 2125–2131 CrossRef CAS.
- K. Koyanagi, T. Fukushima, Y. Sumihiro, T. Sakai and N. Hashimoto, Polym. Prepr. Jpn. Engl. Ed., 1996, 45(12), 3565–3566 Search PubMed.
- G. Shin, J. H. Kim, S. H. Kim and Y. H. Kim, Korea Polym. J., 1997, 5, 19–25 CAS.
- K. Shinno, M. Miyamoto, Y. Kimura, Y. Hirai and H. Yoshitome, Macromolecules, 1997, 30, 6438–6444 CrossRef CAS.
- S. I. Moon, C. W. Lee, M. Miyamoto and Y. Kimura, J. Polym. Sci., Part A: Polym. Chem., 2000, 38, 1673–1679 CrossRef CAS.
- S.-I. Moon, I. Taniguchi, M. Miyamoto, Y. Kimura and C.-W. Lee, High Perform. Polym., 2001, 13, S189–S196 CrossRef CAS.
- S.-I. Moon, C.-W. Lee, I. Taniguchi, M. Miyamoto and Y. Kimura, Polymer, 2001, 42, 5059–5062 CrossRef CAS.
- S. I. Moon, I. Taniguchi, M. Miyamoto, Y. Kimura and C. W. Lee, High Perform. Polym., 2001, 13, S189–S196 CrossRef CAS.
- S. I. Moon and Y. Kimura, Polym. Int., 2003, 52, 299–303 CrossRef CAS.
- S. Shyamroy, B. Garnaik and S. Sivaram, J. Polym. Sci., Part A: Polym. Chem., 2005, 43, 2164–2177 CrossRef CAS.
- M. Matos, A. F. Sousa, A. C. Fonseca, C. S. Freire, J. F. Coelho and A. J. Silvestre, Macromol. Chem. Phys., 2014, 215, 2175–2184 CrossRef CAS.
- V. Katiyar and H. Nanavati, Polym. Eng. Sci., 2011, 51, 2078–2084 CrossRef CAS.
- H. Kricheldorf and S. Weidner, J. Polym. Environ., 2024 Search PubMed (under revision).
- H. R. Kricheldorf, S. M. Weidner and A. Meyer, Macromol. Chem. Phys., 2023, 224, 2200385 CrossRef CAS.
- S. M. Weidner, A. Meyer and H. R. Kricheldorf, Polymer, 2023, 285, 126355 CrossRef CAS.
- H. R. Kricheldorf and S. M. Weidner, Polymer, 2023, 276, 125946 CrossRef CAS.
- H. R. Kricheldorf, S. M. Weidner and A. Meyer, Polymer, 2022, 263, 125516 CrossRef CAS.
- S. M. Weidner, A. Meyer, J. Falkenhagen and H. R. Kricheldorf, Polym. Chem., 2024, 15, 71–82 RSC.
- H. R. Kricheldorf, S. M. Weidner and A. Meyer, Macromol. Chem. Phys., 2024, 2400175 CrossRef CAS.
- M. L. Di Lorenzo and R. Androsch, in Advances in Polymer Science, 279, ed. M. L. Di Lorenzo and R. Androsch, Springer International Publishing, Cham, 2017 Search PubMed.
- R. A. Auras, L.-T. Lim, S. E. Selke and H. Tsuji, Poly (lactic acid): synthesis, structures, properties, processing, and applications, John Wiley & Sons, 2011 Search PubMed.
- E. Fischer, H. J. Sterzel and G. Wegner, Kolloid-Z. Z. Polym., 1973, 251, 980–990 CrossRef CAS.
- J. R. Sarasua, N. L. Rodriguez, A. L. Arraiza and E. Meaurio, Macromolecules, 2005, 38, 8362–8371 CrossRef CAS.
- H. Tsuji, F. Horii, M. Nakagawa, Y. Ikada, H. Odani and R. Kitamaru, Macromolecules, 1992, 25, 4114–4118 CrossRef CAS.
Footnote |
| † Electronic supplementary information (ESI) available. See DOI: https://doi.org/10.1039/d4py01191k |
| This journal is © The Royal Society of Chemistry 2025 |

