 Open Access Article
Creative Commons Attribution 3.0 Unported Licence
A turn-on fluorescent probe containing a β-ketoester moiety for the selective detection of intracellular hydrazine†
Akira Takagi a,
Ippei Takashima
 ab and
Kensuke Okuda
 *a
*a
aLaboratory of Bioorganic & Natural Products Chemistry, Kobe Pharmaceutical University, 4-19-1, Motoyamakita, Higashinada, Kobe, Hyogo 658-8558, Japan. E-mail: okuda@kobepharma-u.ac.jp
bInstitute of Multidisciplinary Research for Advanced Materials, Tohoku University, 2-1-1 Katahira, Aoba, Sendai, Miyagi 980-8577, Japan
First published on 3rd January 2025
Abstract
Fluorogenic probes containing the β-ketoester structure were developed for selective hydrazine detection. The probe equipped with a cyclopropane moiety, having reduced steric hindrance, showed a higher reaction rate than its dimethyl counterpart. In live cell imaging, the probe detects intracellular hydrazine with minimal cytotoxicity. This study introduces a promising tool for hydrazine detection that may assist in reducing the risks associated with hydrazine exposure in various applications.
1 Introduction
Hydrazine (N2H4) has long been widely used in many fields as a useful diamine with strong basic, reducing, and nucleophilic properties. Hydrazine can be used as a reducing agent,1,2 high-energy rocket propellant,3 precursor of pharmaceuticals,4 insecticide,5 and a raw material for industrial products such as polymers and carbon dioxide sorbents.6,7 However, despite its usefulness, hydrazine is highly toxic and is known to be hepatotoxic, neurotoxic, and mutagenic.8–10 Its use poses a risk of exposure to the environment during various stages of the manufacturing process. In humans, endogenous aminoacylase may also induce hydrolysis of hydrazine-containing drugs such as isoniazid, releasing hydrazine and/or acetylated hydrazine as a toxic metabolite.11 Given the hazardous nature of hydrazine, the sensitive and selective detection of hydrazine in environmental and biological samples is an important issue.A chemiluminescent probe,12 fluorescent probes,13–15 and other analytical methods16–19 have been developed to detect hydrazine selectively. Among them, fluorescent probes with sufficient solubility, suitable lipophilicity, and negligible toxicity are convenient for assessing hydrazine exposure in living cells, but faster probes with better sensitivity and selectivity are necessary for real applications. Therefore, there has been ongoing development of fluorescent probes that operate on novel detection mechanisms.
We have designed a novel β-ketoester-type fluorescent probe platform (OB-MU1) for detecting hydrazine. The putative mechanism for hydrazine detection is shown in Scheme 1.
First, the ketone moiety of OB-MU1 reacts with hydrazine to form a hydrazone (1). Subsequently, the amine moiety of the hydrazone reacts with the ester in an intramolecular nucleophilic attack to the ester, releasing 5-methyl-2,4-dihydro-3H-pyrazol-3-one (2), whereas the fluorophore 4-methylumbelliferone (3) is released and exhibits a fluorescent response. We expected that the combination of the strong nucleophilicity20 and the adjacent positioning of the two primary amine moieties within the same molecule could be used to distinguish hydrazine from other bisnucleophiles, including ethylenediamine and hydroxylamine. In addition, strong endogenous mononucleophiles such as ammonia and hydrogen sulfide do not undergo such ring closure reactions due to the unfavorable four-membered ring formation. Levulinic acid ester-type probes21–25 have intrinsically fluorogenic reactivity to mononucleophiles by the formation of a five-membered ring as well as to hydrazine by the formation of a six-membered ring. The detection mechanism of OB-MU1 is similar to that of levulinic acid ester-type probes, but our strategy is characterized by five-membered ring formation upon hydrazine detection, giving our probes an advantage.26 Another potential research gap with levulinic acid ester-type probes is that it also reacted with sulfite (SO32−) to form 2-methyl-5-oxotetrahydrofuran-2-sulfonate by the formation of a five-membered ring and the fluorescent product as seen in resorufin levulinate,27 which could complicate hydrazine detection. On the contrary, such a sulfite reaction is unlikely in the case of β-ketoester-type fluorescent probes because unfavorable four-membered ring formation is required for the transformation.
2 Results and discussion
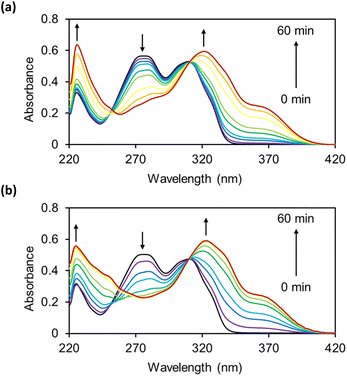
First, we attempted to synthesize OB-MU1 by the condensation reaction of 4-methylumbelliferone (3) and 3-oxobutanoic acid (4a), but the desired ester OB-MU1 was not obtained. We attribute this unsuccessful reaction to the reactivity of the active methylene, and condensation with 2,2-disubstituted 3-oxobutanoic acids 4b and 4c gave the desired β-ketoesters OB-MU2 and OB-MU3 (Scheme 2).The reactions of OB-MU2 and OB-MU3 (50 μM) with hydrazine (1 mM, 20 eq.) were monitored by UV-vis spectroscopy (Fig. 1) in 50 mM HEPES buffer (pH 7.4). Upon addition of hydrazine, the absorption of the OB-MUs around 270 nm, which is considered to be the maximum absorption of β-ketoesters, decreased in a time-dependent manner. Concomitantly, the absorption peak at around 310 nm, which is considered to be the maximum absorption of esterified 3, shifted to 320 nm, the maximum absorption wavelength of free 3.
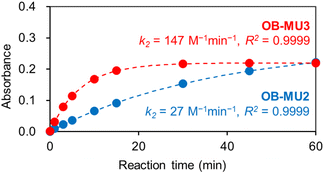
OB-MU2 (apparent k2 = 27 M−1 min−1) reacted with hydrazine more slowly than OB-MU3 (apparent k2 = 147 M−1 min−1) (Fig. 2).28,29 The reaction of OB-MU2 was not complete even after 1 hour, whereas OB-MU3 reacted faster and nearly reached completion by 30 min. Considering that the cyclopropyl moiety is less bulky than the dimethyl moiety, these differences in reaction rates are inconsistent with the Thorpe–Ingold effect for the cyclization reaction; therefore, hydrazone formation with the OB-MUs and hydrazine is likely the rate-determining step.
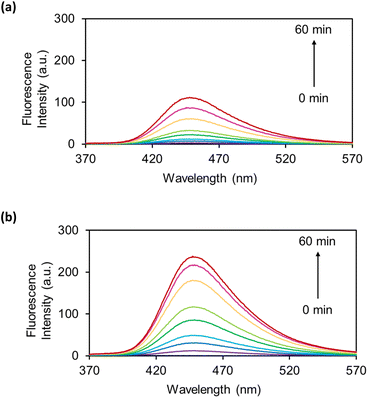
The OB-MUs were subsequently evaluated by fluorescence spectroscopy: the reaction of 10 μM OB-MU derivative with 200 μM (20 eq.) hydrazine was observed by measuring the fluorescence spectrum of 3 (Fig. 3).
Fluorescence spectroscopy also revealed a slower reaction of OB-MU2 than OB-MU3 with hydrazine, similar to the UV-vis results. These results indicate that OB-MU3 is a better fluorogenic probe for detecting hydrazine in aqueous environments.
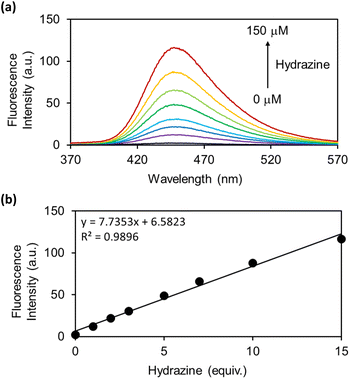
As the OB-MU3 probe reacted successfully with hydrazine, further studies were conducted to evaluate its selectivity and other properties. The fluorescence intensity was proportional to the concentration of hydrazine (Fig. 4a and b), indicating that OB-MU3 is a quantitative probe under these conditions. The detection limit of OB-MU3 was found to be 95.3 nM (Fig. 5).
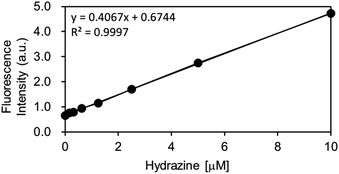 | ||
| Fig. 5 Calibration curve of hydrazine (serial dilution from 10 μM) for OB-MU3 (10 μM) in 50 mM HEPES buffer (pH 7.4, 1% acetonitrile) (λex: 323 nm, λem: 447 nm, 25 °C). | ||
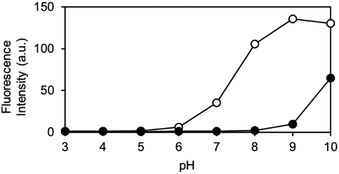
The pH-dependence of the reaction of OB-MU3 with hydrazine was also examined from pH 3 to 10. We observed that under biological conditions (pH 6–8), an increase in pH led to a faster reaction and higher signal in the presence of hydrazine (open circles), whereas nonspecific reactions (closed circles) are still negligible (Fig. 6). These data imply that the pH dependence can be simply derived from the pKa of the 3-phenol domain (pKa ∼ 7.8), whereas hydrazine and hydrazone intermediates both have sufficient nucleophilicity when the pH is above 5, according to the pKas of their conjugated acids. Above pH 8, the fluorogenic reaction by non-specific alkaline hydrolysis competes with the intended reaction with hydrazine.
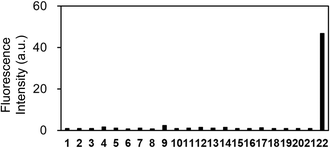
Further examination of the selectivity of OB-MU3 toward different test substances showed that the fluorescence response to various amines, amino acids, reducing substances, and metal ions was weak (Fig. 7 and S1†). As anticipated, the better selectivity of OB-MU3 for hydrazine compared to other nucleophiles including sulfite (#12) is thought to be due to the formation of a five-membered ring with two adjacent nucleophilic amines.
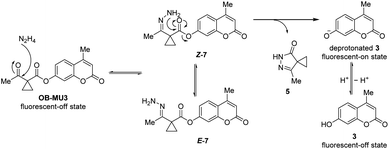
To confirm the fluorogenic reaction mechanism of OB-MU3 with hydrazine, we evaluated the product formed from the reaction when hydrazine was added to OB-MU3 on a 1 mmol scale. The addition of 10 equivalents of hydrazine dihydrochloride to OB-MU3 in an aqueous acetonitrile solution yielded 3 in quantities corresponding to OB-MU3 consumption, as well as formation of what is presumably the cyclized product 5 which likely reacts with HCl to form 6 (Scheme 3). These results suggest that the reaction of OB-MU3 with hydrazine proceeded as we expected in Scheme 1. The plausible reaction mechanism of fluorogenic OB-MU3 with hydrazine is shown in Scheme 4. First, the ketone moiety of OB-MU3 reacts with hydrazine to form a hydrazone (7). 7 exists as either the E-7 or the Z-7 isomer. Subsequently, the amine moiety of Z-7 reacts with the ester in an intramolecular nucleophilic attack to the ester, releasing 5, while the fluorophore 3 is released as the phenolate and exhibits a fluorescent response. We also state here that 6 with reactive alkyl halide may appear toxic similar to the HaloTag due to its possible modification of intracellular nucleophiles such as glutathione. However, generation of potentially toxic 6 under physiological conditions is unlikely because the chloride ion concentration is low (5 to 60 mM)30 compared to the concentrations found in our experiment (2.0 M) which comes from the use of the stable dihydrochloride form of hydrazine.
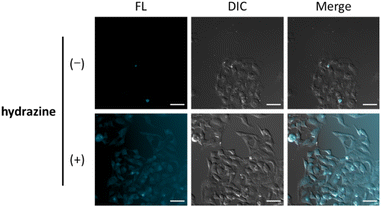
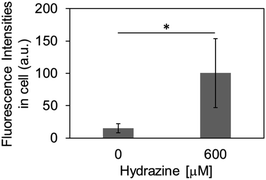
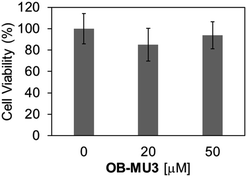
Finally, we evaluated the ability of OB-MU3 to detect hydrazine in live-cell imaging using fluorescence microscopy. After HeLa cells were treated with 20 μM OB-MU3 and washed with Hanks' balanced salt solution (HBSS)(+), they were exposed to HBSS(+) containing 600 μM hydrazine (Fig. 8). Fluorescence imaging results showed that after treatment with hydrazine, an OB-MU3-derived signal was observed throughout the cell with a fluorescence increase of ca. 7-fold (Fig. 9). Therefore, OB-MU3 is a hydrazine probe based on a novel cyclization reaction that can visualize exogenous hydrazine in live cells. Finally, we confirmed that up to 50 μM of OB-MU3 exhibited minimal acute cell toxicity (Fig. 10) and it is thought that OB-MU3 exerts a negligible influence on cells at low concentrations (20 μM). We plan to exchange 3 with a long-wavelength fluorophore like TokyoGreen for further biological applications and/or imaging within specific organelles using the same synthesis scheme as that used for OB-MU3.
3 Conclusions
In summary, we have developed novel fluorescent probes bearing the β-ketoester structure, OB-MU2 and OB-MU3, for the detection of hydrazine. Based on UV-vis and fluorescence spectroscopic measurements, the cyclopropyl moiety of OB-MU3 accelerates the response to hydrazine compared to the dimethyl structure of OB-MU2. OB-MU3 also exhibited a fluorogenic response under aqueous conditions containing 1% organic solvent (acetonitrile) at physiological pH, with up to a 54-fold increase in fluorescence. In addition, OB-MU3 demonstrated a very strong hydrazine-selective response, showing little reaction to many nucleophiles and reducing agents, with hydroxylamine and hydrogen sulfide as notable examples. Moreover, OB-MU3 can visualize intracellular hydrazine. Coumarin-based OB-MU3, which has short excitation and emission wavelengths, has drawbacks for bioimaging applications such as limited imaging depth and interference from the autofluorescence from biological substances.31 The moderate signal-to-noise ratio of OB-MU3 (Fig. 8 and 9) was caused by low intracellular retention of released 3. Therefore, the signal-to-noise ratio can be improved by replacing 3 with a hydrophilic fluorophore with better intracellular retention. In the future, β-ketoester structures will be combined with long-wavelength fluorescent dyes that are more suited than 7-hydroxycoumarin for bioimaging applications to develop probes that can similarly detect intracellular hydrazine with high sensitivity.4 Experimental
4.1. General information for synthetic procedures
Reagents: all reactions were carried out under an inert atmosphere in a round bottom flask containing a stir-bar with a rubber septum except as noted otherwise. Anhydrous dichloromethane (CH2Cl2) was purchased from FUJIFILM Wako Pure Chemical Co. and used without further purification. All other reagents were purchased from Tokyo Chemical Industry Co., Nacalai Tesque Inc., or FUJIFILM Wako Pure Chemical Co. and used without further purification. SiliaFlash® F60, 40–63 μm, #R10030B (Silicycle Inc., Quebec, Canada) or Chromatorex PSQ60B (Fuji Silysia Chemical Ltd., Kasugai, Japan) was used for silica gel flash chromatography.4.2. Analytical methods
All reactions were monitored by thin-layer chromatography with E. Merck silica gel 60 F254 pre-coated plates (0.25 mm) and were visualized by UV (254 nm). IR spectra were obtained on a PerkinElmer Spectrum One. 1H NMR and 13C NMR spectra were recorded on a JEOL ECZ400S spectrometer (1H: 400 MHz, 13C: 100 MHz) instrument. Chemical shifts are reported in ppm relative to the carbons of deuterated solvents (CDCl3: 77.0 ppm, DMSO-d6: 39.5 for 13C) or the internal standard tetramethylsilane (CDCl3 and DMSO-d6: 0.00 ppm for 1H). The mass spectra were measured on a Thermo Fisher Scientific LTQ Orbitrap Discovery. Melting points were determined with a Yanaco micro melting point apparatus MP-J3. Yields refer to isolated yields of compounds greater than 95% purity as determined by 1H NMR analysis. All new products were characterized by 1H NMR, 13C NMR, IR, and HRMS. UV-vis spectroscopy was recorded by Cary 8454 (Agilent). Fluorescence spectroscopy was recorded by Duetta (HORIBA) and SpectraMax iD5 multiplate reader (Molecular Devices).4.3. Procedure for synthesis of probes
![[thin space (1/6-em)]](https://www.rsc.org/images/entities/char_2009.gif) :
:![[thin space (1/6-em)]](https://www.rsc.org/images/entities/char_2009.gif) 1): 0.63. Mp: 90–91 °C. 1H NMR (400 MHz, CDCl3) δ: 7.62 (d, J = 8.0 Hz, 1H), 7.11 (d, J = 2.5 Hz, 1H), 7.06 (dd, J = 8.0, 2.5 Hz, 1H), 6.29 (d, J = 1.5 Hz, 1H), 2.44 (d, J = 1.5 Hz, 3H), 2.31 (s, 3H), 1.55 (s, 6H). 13C NMR (100 MHz, CDCl3) δ: 205.1, 171.5, 160.2, 154.0, 152.8, 151.8, 125.5, 117.9, 117.6, 114.5, 110.0, 56.1, 25.5, 21.7, 18.6. IR (KBr) 3073, 2976, 1761, 1726, 1709, 1616 cm−1. HRMS (ESI) m/z calcd for [C16H16O5 + Na+] 311.0890, found 311.0884.
1): 0.63. Mp: 90–91 °C. 1H NMR (400 MHz, CDCl3) δ: 7.62 (d, J = 8.0 Hz, 1H), 7.11 (d, J = 2.5 Hz, 1H), 7.06 (dd, J = 8.0, 2.5 Hz, 1H), 6.29 (d, J = 1.5 Hz, 1H), 2.44 (d, J = 1.5 Hz, 3H), 2.31 (s, 3H), 1.55 (s, 6H). 13C NMR (100 MHz, CDCl3) δ: 205.1, 171.5, 160.2, 154.0, 152.8, 151.8, 125.5, 117.9, 117.6, 114.5, 110.0, 56.1, 25.5, 21.7, 18.6. IR (KBr) 3073, 2976, 1761, 1726, 1709, 1616 cm−1. HRMS (ESI) m/z calcd for [C16H16O5 + Na+] 311.0890, found 311.0884.![[thin space (1/6-em)]](https://www.rsc.org/images/entities/char_2009.gif) :
:![[thin space (1/6-em)]](https://www.rsc.org/images/entities/char_2009.gif) 1): 0.59. Mp: 129–130 °C. 1H NMR (400 MHz, CDCl3) δ: 7.63 (d, J = 8.5 Hz, 1H), 7.12 (d, J = 2.5 Hz, 1H), 7.07 (dd, J = 8.5, 2.5 Hz, 1H), 6.30 (d, J = 1.5 Hz, 1H), 2.58 (s, 3H), 2.45 (d, J = 1.5 Hz, 3H), 1.78–1.70 (m, 4H). 13C NMR (100 MHz, CDCl3) δ: 201.8, 169.2, 160.3, 154.2, 152.5, 151.8, 125.5, 118.1, 117.8, 114.7, 110.3, 34.9, 29.9, 20.4, 18.7. IR (KBr) 3077, 1752, 1730, 1700, 1612 cm−1. HRMS (ESI) m/z calcd for [C16H14O5 + H+] 287.0914, found 287.0911.
1): 0.59. Mp: 129–130 °C. 1H NMR (400 MHz, CDCl3) δ: 7.63 (d, J = 8.5 Hz, 1H), 7.12 (d, J = 2.5 Hz, 1H), 7.07 (dd, J = 8.5, 2.5 Hz, 1H), 6.30 (d, J = 1.5 Hz, 1H), 2.58 (s, 3H), 2.45 (d, J = 1.5 Hz, 3H), 1.78–1.70 (m, 4H). 13C NMR (100 MHz, CDCl3) δ: 201.8, 169.2, 160.3, 154.2, 152.5, 151.8, 125.5, 118.1, 117.8, 114.7, 110.3, 34.9, 29.9, 20.4, 18.7. IR (KBr) 3077, 1752, 1730, 1700, 1612 cm−1. HRMS (ESI) m/z calcd for [C16H14O5 + H+] 287.0914, found 287.0911.4.4. Analysis of the reaction of OB-MU3 with hydrazine
To a solution of OB-MU3 (282 mg, 0.985 mmol) in acetonitrile (5 mL) and sodium phosphate buffer (100 mM, pH = 7.5, 5 mL), hydrazine dihydrochloride (1.04 g, 9.91 mmol) was added and stirred for 24 hours at room temperature. Reaction mixture was diluted with EtOAc and washed with aqueous NaHCO3. The aqueous layer was extracted with EtOAc twice. The combined organic layers were dried over Na2SO4 and filtered and solvents were removed under reduced pressure. The residue was purified by column chromatography (SiO2, CHCl3/MeOH = 10![[thin space (1/6-em)]](https://www.rsc.org/images/entities/char_2009.gif) :
:![[thin space (1/6-em)]](https://www.rsc.org/images/entities/char_2009.gif) 1 to 4
1 to 4![[thin space (1/6-em)]](https://www.rsc.org/images/entities/char_2009.gif) :
:![[thin space (1/6-em)]](https://www.rsc.org/images/entities/char_2009.gif) 1) to give the unreacted OB-MU3 (78.4 mg, 28%), concomitant with fluorescent 3 (125.5 mg, 72%) as a colorless solid, 5 (19.1 mg, 15%) as a colorless solid, and 6 (22.1 mg, 14%) as a colorless solid.
1) to give the unreacted OB-MU3 (78.4 mg, 28%), concomitant with fluorescent 3 (125.5 mg, 72%) as a colorless solid, 5 (19.1 mg, 15%) as a colorless solid, and 6 (22.1 mg, 14%) as a colorless solid.
![[thin space (1/6-em)]](https://www.rsc.org/images/entities/char_2009.gif) :
:![[thin space (1/6-em)]](https://www.rsc.org/images/entities/char_2009.gif) 1): 0.58. Mp: 136–138 °C (lit. 140–141 °C).34 1H NMR (400 MHz, DMSO-d6) δ: 11.1 (s, 1H), 1.80 (s, 3H), 1.70 (q, J = 4.0 Hz, 2H), 1.35 (q, J = 4.0 Hz, 2H). 13C NMR (100 MHz, DMSO-d6) δ: 176.1, 159.3, 31.4, 17.0 (2C), 12.3. HRMS (ESI) m/z calcd for [C6H8ON2 + Na+] 147.0523, found 147.0523.
1): 0.58. Mp: 136–138 °C (lit. 140–141 °C).34 1H NMR (400 MHz, DMSO-d6) δ: 11.1 (s, 1H), 1.80 (s, 3H), 1.70 (q, J = 4.0 Hz, 2H), 1.35 (q, J = 4.0 Hz, 2H). 13C NMR (100 MHz, DMSO-d6) δ: 176.1, 159.3, 31.4, 17.0 (2C), 12.3. HRMS (ESI) m/z calcd for [C6H8ON2 + Na+] 147.0523, found 147.0523.![[thin space (1/6-em)]](https://www.rsc.org/images/entities/char_2009.gif) :
:![[thin space (1/6-em)]](https://www.rsc.org/images/entities/char_2009.gif) 1): 0.23. Mp: 167–168 °C (lit. 170–171 °C).34 1H NMR (400 MHz, DMSO-d6) δ: 10.44 (br s, 1H), 3.57 (t, J = 7.5 Hz, 2H), 2.63 (t, J = 7.5 Hz, 2H), 2.06 (s, 3H). 13C NMR (100 MHz, DMSO-d6) δ: 159.7, 137.6, 97.2, 44.5, 25.6, 9.9. HRMS (ESI) m/z calcd for [C6H9ON235Cl + H+] 161.0476, found 161.0477, calcd for [C6H9ON237Cl + H+] 163.0447, found 163.0447.
1): 0.23. Mp: 167–168 °C (lit. 170–171 °C).34 1H NMR (400 MHz, DMSO-d6) δ: 10.44 (br s, 1H), 3.57 (t, J = 7.5 Hz, 2H), 2.63 (t, J = 7.5 Hz, 2H), 2.06 (s, 3H). 13C NMR (100 MHz, DMSO-d6) δ: 159.7, 137.6, 97.2, 44.5, 25.6, 9.9. HRMS (ESI) m/z calcd for [C6H9ON235Cl + H+] 161.0476, found 161.0477, calcd for [C6H9ON237Cl + H+] 163.0447, found 163.0447.4.5. Absorption and fluorescence measurement of probes
 | (1) |
| [P]t = [U]0 − [U]t | (2) |
The estimated absorbance (A365–375: average of absorbance at 365–375 nm) was calculated with [U]t and [P]t given by eqn (1) and (2), respectively, and the absorption constants (average of extinction coefficients at 365–375 nm). The apparent k2 was obtained by least squares curve fitting between the measured and estimated absorbance with scanning of k2 value in eqn (1).
Additionally, using the following equation DL = K × Sb1/S; the detection limit (DL) of OB-MU3 (10 μM) by fluorescence (λex: 323 nm, λem: 447 nm, 25 °C) for hydrazine (serial dilution from 10 μM) in 50 mM HEPES buffer (pH 7.4, 1% acetonitrile) was calculated, where K = 3; Sb1 is the standard deviation of the blank solution; and S is the slope of the calibration curve. Sb1 = 0.01292, S = 0.4067, ∴DL = 95.3 nM.
4.6. Cellular experiments
| Abs = Abs450 − Abs650. |
Data availability
The data underlying this study are available in the published article and its ESI.†Author contributions
KO conceived the project. All authors designed the experiments. AT and KO performed the experiments. All authors analyzed the data and contributed to manuscript preparation and revision.Conflicts of interest
There are no conflicts to declare.Acknowledgements
This work was supported by JSPS KAKENHI Grant Number 19K16341 (A. T.), 19K07035 (K. O.), The NOVARTIS Foundation (Japan) for the Promotion of Science (K. O.), Takahashi Industrial and Economic Research Foundation (K. O.), and the Vehicle Racing Commemorative Foundation Grant Number 6110, 6231, 6297 (K. O.). We are thankful to Ms. Haruka Shigematsu (Laboratory of Bioorganic & Natural Products Chemistry, Kobe Pharmaceutical University) for her preliminary experiments on probe synthesis and its evaluation, and Ms. Yuka Iio (Laboratory of Bioorganic & Natural Products Chemistry, Kobe Pharmaceutical University) for performing the WST-8 assay experiment.Notes and references
- W. Shen, Q. Qiu, Y. Wang, M. Miao, B. Li, T. Zhang, A. Cao and Z. An, Macromol. Rapid Commun., 2010, 31, 1444–1448 CrossRef CAS PubMed.
- N. Nobari, M. Behboudnia and R. Maleki, Appl. Surf. Sci., 2016, 385, 9–17 CrossRef CAS.
- A. Serov and C. Kwak, Appl. Catal. B Environ., 2010, 98, 1–9 CrossRef CAS.
- L. Ling, L. J. Urichuk, B. D. Sloley, R. T. Coutts, G. B. Baker, J. J. Shan and P. K. T. Pang, Bioorg. Med. Chem. Lett., 2001, 11, 2715–2717 CrossRef CAS PubMed.
- Y. Wang, F. Xu, G. Yu, J. Shi, C. Li, A. I. Dai, Z. Liu, J. Xu, F. Wang and J. Wu, Chem. Cent. J., 2017, 11, 50 CrossRef PubMed.
- T. W. Campbell, V. S. Foldi and J. Farago, J. Appl. Polym. Sci., 1959, 2, 155–162 CrossRef CAS.
- K. H. Lee, B. Lee, J. H. Lee, J. K. You, K. T. Park, I. H. Baek and N. H. Hur, Int. J. Greenhouse Gas Control, 2014, 29, 256–262 CrossRef CAS.
- S. Garrod, M. E. Bollard, A. W. Nicholls, S. C. Connor, J. Connelly, J. K. Nicholson and E. Holmes, Chem. Res. Toxicol., 2005, 18, 115–122 Search PubMed.
- J. Baló, in Advances in Cancer Research, ed. G. Klein and S. Weinhouse, Academic Press, 1979, vol. 30, pp. 151–164 Search PubMed.
- H. N. Nguyen, J. A. Chenoweth, V. S. Bebarta, T. E. Albertson and C. D. Nowadly, Mil. Med., 2021, 186, e319–e326 Search PubMed.
- G. A. Ellard and P. T. Gammon, J. Pharmacokinet. Biopharm., 1976, 4, 83–113 Search PubMed.
- J. Liu, J. Jiang, Y. Dou, F. Zhang, X. Liu, J. Qu and Q. Zhu, Org. Biomol. Chem., 2019, 17, 6975–6979 RSC.
- X.-Y. Zhang, Y.-S. Yang, W. Wang, Q.-C. Jiao and H.-L. Zhu, Coord. Chem. Rev., 2020, 417, 213367 CrossRef CAS.
- E. Wang, H. Ma, J. Lu, F. Wang and J. Ren, Tetrahedron, 2022, 124, 132989 CrossRef CAS.
- K. H. Nguyen, Y. Hao, W. Chen, Y. Zhang, M. Xu, M. Yang and Y.-N. Liu, Luminescence, 2018, 33, 816–836 CrossRef PubMed.
- H. E. Malone, Anal. Chem., 1961, 33, 575–577 CrossRef CAS.
- F. Gao, Q. Wang, N. Gao, Y. Yang, F. Cai, M. Yamane, F. Gao and H. Tanaka, Biosens. Bioelectron., 2017, 97, 238–245 CrossRef CAS PubMed.
- A. D. Smolenkov and O. A. Shpigun, Talanta, 2012, 102, 93–100 CrossRef CAS PubMed.
- J.-W. Mo, B. Ogorevc, X. Zhang and B. Pihlar, Electroanalysis, 2000, 12, 48–54 CrossRef CAS.
- T. A. Nigst, A. Antipova and H. Mayr, J. Org. Chem., 2012, 77, 8142–8155 CrossRef CAS PubMed.
- M. G. Choi, J. Hwang, J. O. Moon, J. Sung and S.-K. Chang, Org. Lett., 2011, 13, 5260–5263 CrossRef CAS PubMed.
- L. Tang, L. Zhou, A. Liu, X. Yan, K. Zhong, X. Liu, X. Gao and J. Li, Dyes Pigments, 2021, 186, 109034 CrossRef CAS.
- S. Yu, S. Wang, H. Yu, Y. Feng, S. Zhang, M. Zhu, H. Yin and X. Meng, Sens. Actuators B Chem., 2015, 220, 1338–1345 CrossRef CAS PubMed.
- M. Xing, K. Wang, X. Wu, S. Ma, D. Cao, R. Guan and Z. Liu, Chem. Commun., 2019, 55, 14980–14983 RSC.
- M. Li, H. Chen, X. Liu, Y. Wang, N. Zhang and K. Zheng, Tetrahedron Lett., 2019, 60, 151219 CrossRef CAS.
- M. A. Casadei, C. Galli and L. Mandolini, J. Am. Chem. Soc., 1984, 106, 1051–1056 CrossRef CAS.
- M. G. Choi, J. Hwang, S. Eor and S.-K. Chang, Org. Lett., 2010, 12, 5624–5627 CrossRef CAS PubMed.
- T. J. Thurston and R. G. Brereton, Analyst, 2002, 127, 659–668 RSC.
- J. H. Espenson, in Chemical Kinetics and Reaction Mechanisms, McGraw-Hill, New York, 2nd edn, 1995, ch. 2 Search PubMed.
- J. Glykys, V. Dzhala, K. Egawa, T. Balena, Y. Saponjian, K. V. Kuchibhotla, B. J. Bacskai, K. T. Kahle, T. Zeuthen and K. J. Staley, Science, 2014, 343, 670–675 CrossRef CAS PubMed.
- Y. Jung, J. Jung, Y. Huh and D. Kim, J. Anal. Methods Chem., 2018, 2018, 5249765 Search PubMed.
- A. V. Ignatchenko, M. E. Springer, J. D. Walker and W. W. Brennessel, J. Phys. Chem. C, 2021, 125, 3368–3384 CrossRef CAS.
- Y. Imaeda, T. Wakabayashi, E. Kimura and K. Tokumaru, in Thiazole derivative, WO2011093352 A1, 2011.
- E. Magnien and W. Tom, J. Org. Chem., 1967, 32, 1229–1230 CrossRef CAS.
Footnote |
| † Electronic supplementary information (ESI) available: Supplementary figure, copies of NMR, IR, and HRMS spectra. See DOI: https://doi.org/10.1039/d4ra06525e |
| This journal is © The Royal Society of Chemistry 2025 |


