DOI:
10.1039/D4RA06676F
(Paper)
RSC Adv., 2025,
15, 301-311
Stabilization of small organic molecules on V2C and V2CO2 MXenes: first-principles insights into the performance of van der Waals functionals and the effect of oxygen vacancies†
Received
15th September 2024
, Accepted 18th December 2024
First published on 2nd January 2025
Abstract
The adsorption of small organic molecules on pristine V2C MXene and its derivatives is investigated by first-principles density functional theory calculations. By employing state-of-the-art van der Waals (vdW) density functionals, the binding affinity of studied molecules, i.e., CH4, CO2, and H2O on MXene adsorbents is well described by more recent vdW functionals, i.e., SCAN-rvv10. Although both CH4 and CO2 are nonpolar molecules, on pristine and oxygen-vacancy surfaces, they show a different range of adsorption energies, in which CH4 is more inert and has weaker binding than CO2. CO2 stays intact in its molecular forms for most of the tested functionals, except for the case of the vdW-DF functional, where CO2 exhibits a dissociation regardless of its initial adsorption geometry. For full surface terminations, the adsorption affinity of all involved species is comparable within the same range, varying from −0.10 to −0.20 eV, attributed to either weak dispersion interactions or hydrogen bonds. The binding of H2O is much more pronounced compared to CO2 and CH4 in the presence of oxygen vacancies with the highest adsorption energy of −1.33 eV, vs. −0.67, and −0.20 eV obtained for H2O, CO2, and CH4 respectively. H2O can dissociate with a small activation energy barrier of 0.40 eV, much smaller than its molecular adsorption energy, to further saturate itself on the surface. At high oxygen-vacancy concentrations, stronger bindings of adsorbates are found due to a preferred attachment of adsorbates to induced undercoordinated metal sites. The findings propose a potential scheme for greenhouse gas separation based on the surface modification of novel two-dimensional structures.
1. Introduction
The interactions of organic molecules with metal surfaces are of great interest for both fundamental understanding and practical regulation, concerning many urgent adsorption and detection technology applications.1–4 However, small organic molecules often encounter technical difficulties in adsorptive practices due to their inert properties. The binding of molecules onto the surface relies on both physical and chemical adsorption mechanisms.5,6 Particularly, physisorption through van der Waals (vdW) interaction is known to be relevant for the attachment of nonpolar molecules,7 in reverse to the binding of actively polar species relying on the exposure of chemical bonds. The treatment of such interactions is well-established for fist-principles calculations via the introduction of vdW functionals with either pairwise-additive vdW corrections,8,9 or truly nonlocal vdW functionals.10 Both approaches are successful in interpreting structures from biological molecules to layered compounds, as well as their physicochemical interactions.11 Molecular binding affinities strongly depend on the activity of both the adsorbed molecules and the adsorbents, i.e., the binding sites. Searching for suitable adsorbents for specific adsorbates is an indispensable prerequisite for advanced applications.
MXenes are novel layered materials emerging for relevant technologies based on their diverse structural compositions and stoichiometries, along with intriguing physical-chemical properties.12 Those graphene-like structures can be experimentally synthesized via the exfoliation of “A” layer metals from its parent MAX phase Mn+1AXn by HCl or HF acids, followed by a sonification treatment to separate layers by layers.13–15 The derived MXene surfaces are usually covered by terminal groups such as O, OH, or F in wet etching environments during the synthesis.14,15 The chemical formula of a monolayer MXene is Mn+1XnTx, with X being the carbon C or nitrogen N sandwiched by early transition metals M (Sc, Ti, V, Mo, etc., n = 1, 2, 3), and Tx (T = F, O, OH, x = 0, 1, 2) is the terminal groups. Those functional groups could be removed from the surface via chemical washing or thermal methods to obtain clean, pristine structures.16,17 Featuring as high chemical and thermal stabilities, electrical conductivities, high surface areas, and abundant functional groups, MXenes are extensively studied for a variety of applications, especially for energy storage,18–22 spintronics,23 gas separation,4 carbon capture,24,25 gas sensors,26–28 and catalysts.29
V2C, a family member of carbon-based MXenes, has been known to be stable at 150 °C.30 V2CTx, a functionalized form of V2C, shows much superior by its high thermal stability, up to 300 °C in both oxidative and reductive environments, or up to 600 °C in inert environments.16 Compared to the well-studied Ti3C2Tx counterparts,4,14,31 V2CTx benefits from its high surface area per mass and chemical activity relying on multiple oxidation states of V against Ti metal atoms.32 V2CTx structures are widely studied as sensing materials to volatile organic compounds,33,34 methane,35 ammonia,36 methylamine adsorption,37 methylene blue removal,38 carbon dioxide capture,24,39 catalysts for hydrocarbon conversion,40 or water dissociation.41 Lee et al. experimentally reported an ultrahigh sensitivity of methane on V2CTx at room temperature provided that the functional groups are active sites for physical or chemical interactions.35 A large number of M2C (M = Ti, Zr, Hf, V, Nb, Ta, Cr, Mo, W) MXenes show strong bindings with carbon dioxide molecules compared to zeolites or graphene oxides.39 Gouveia et al. computationally demonstrated that water can be dissociated on almost all pristine M2X (M = Ti, Zr, Hf, V, Nb, Ta, Cr, Mo, and W) with low activation energy barriers.41 Though many seminal works on the adsorption of organic molecules over V-based MXene structures can be found, bare MXene structures as adsorbents for small organic molecules are much more focused than the structures with the presence of explicit terminal groups or the existence of surface defects. The partial missing of terminating groups and the presence of other surface vacancies are inevitable in strongly acidic etching environments during the synthesis or in high thermal conditions for post-synthesis MXenes.17,42,43 For example, terminal oxygens are most abundant, occupied about 84% terminations, among other functional groups on Ti3C2 MXene under synthesis conditions.44 As a result, oxygen vacancies can be generated via multiple routes such as an incompletion termination during the synthesis, the chemical washing, or the thermal removal as post-synthesis modifications. Additionally, oxygen vacancies can also be produced and controlled by the oxidation of carbon monoxide on the MXene surface, under the presence of H2, via the chemical reaction, CO + H2 + MXene → HCOOH + MXene_Ov, proposed by Zhang and coworkers.45 In this work, the oxygen vacancy on Ti2CO2 plays the role of a catalytic site for capturing and driving CO2 reduction. To enhance the catalytic activity, single transition-metal atoms are deposited to the oxygen-vacant sites featuring the efficiency of oxygen evolution reactions46 on Mo2CO2 and the methane-to-methanol conversion on V3C2O2.47 It has been known that bare MXenes without terminations are very active in capturing most of the molecules by chemical bonds relying on top-layer transition metals.25,41 Besides, functionalized MXenes, as V2CTx, characterize rich surface chemistry exhibiting hydrophilic features due to their O- or OH-terminated groups, favoring hydrogen bondings or weak vdW interactions.48,49 The presence of surface defects on functionalized structures proposes more active sites at realistic conditions. The hybrid of multiple phases by surface engineering is advantageous for the efficient treatment of mixed gases.
Systematic insights into the response of V2CTx MXenes against small organic molecules, i.e., greenhouse gases, regarding their adsorption mechanisms and affinities are fundamentally and technologically important. This work provides the interaction trends of both polar and nonpolar molecules with the V2CTx MXenes focusing on their adsorption performances on either the pristine, functionalized, or defective surfaces. Based on first-principles calculations, we attempt to benchmark the stability of adsorbed molecules at their binding sites concerning the choice of van der Waals functionals. The more advanced vdW functionals will be used for further calculations. The functionalizations and defect modifications allow us to better determine the selectivity of various target molecules. Following the adsorption, the calculated dissociation processes are the key signals showing the activity of the induced surface sites, in which the oxygen vacancies play a paramount importance role.
2. Computational method
Calculations based on density functional theory (DFT) are performed on the simulation suite Vien Ab initio Simulation Package (VASP 5.4.4).50 The project augmented wave (PAW) pseudopotential51 with a cutoff kinetic energy of 500 eV is chosen for all atoms. The lattice parameters of the host structures and adsorption affinities of gas molecules are evaluated under the light of generalized gradient approximation (GGA) functionals of Perdew, Burke, and Ernzerhof (PBE),52,53 and PBE with a D3 correction scheme.8 The nonlocal van der Waals functionals of optPBE-vdW,54 optB88-vdW,54 vdW-DF,55 and rev-vdW-DF2 (ref. 56) are also included to improve long-range interactions of adsorbates. In addition, the meta-GGA functional of SCAN-rvv10 (ref. 57) is also used to benchmark either the intralayer lattice constants or the long-range binding of molecular adsorptions. For optimizations, the atoms are allowed to relax until the atomic force exerted on each atom balances at 0.01 eV Å−1 and the convergence of the total energy of 10−5 eV.
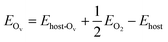
Spin-polarization is applied for all calculated structures to account for the magnetic feature of the vanadium atoms. We first benchmark the primitive cells 1 × 1 of V2C and V2CO2 using 9 × 9 × 1 k-point meshes within the Gamma sampling scheme. For the adsorption study, structures of 3 × 3 are directly generated from the previous pre-optimized primitive cells, shown in Fig. 1. For all calculations, a vacuum slab of at least 17 Å is chosen, which is sufficiently large to ignore spurious interactions. The oxygen-vacancy V2CO2_Ov configuration is also produced by removing one functionalized-oxygen atom. The k-point meshes of 3 × 3 × 1 are now used for all the adsorption calculations. The electron configurations of involving atoms are as follows V: [Ar] 4s2 3d3, C: [He] 2s2 2p2, O: [He] 2s2 2p4, and H: 1s1. The isolated gas molecules CH4, H2, CO2, and H2O are modeled in a cubic box of 20 Å length in each dimension. The adsorption energy Eads of a molecule M is defined as eqn (1),
| | |
Eads = EM-host − EM − Ehost
| (1) |
where
EM-host,
EM, and
Ehost stand for the total energies of the structures of the host with the adsorbed molecule, isolated molecule, and pristine structure, respectively. Excluding a surface oxygen atom costs an amount of energy as follows
eqn (2),
| |
 | (2) |
where
Ehost-Ov,
EO2, and
Ehost are the total energies of the oxygen-vacancy structure, isolated molecular oxygen, and pristine structure, respectively. The Mulliken charge analysis employed in LOBSTER code
58 (Local Orbital Basis Suite Towards Electronic-Structure Reconstruction) is used to evaluate atomic charges of the structures before and after adsorptions. The VESTA visualizing program, version 3.5.7,
59 is exploited to display all geometries. The transition state search is performed under the climbing-image nudged elastic band (CINEB) method.
60 Accordingly, nine intermediate images along the reaction path are generated and optimized. The obtained transition state is further confirmed by the fact that there is only one imaginary frequency corresponding to the transition mode of the interested reaction channel.
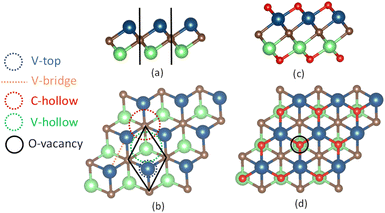 |
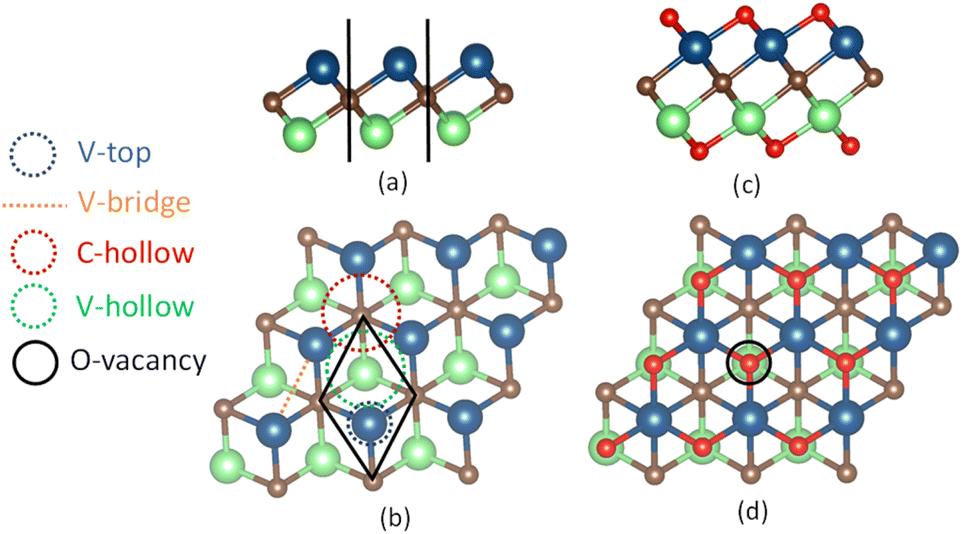
| | Fig. 1 Monolayers of 3 × 3 sizes are displayed in the side-view and top-view for the pure V2C, in (a) and (b), and functionalized V2CO2, in (c) and (d), respectively. The spheres in blue, green, brown, and red correspond to vanadium V on the top layer, V on the bottom layer, carbon C, and oxygen O atoms. The adsorption sites on the surface are denoted as V-top, V-bridge, C-hollow, V-hollow, and O-vacancy (Ov). The C-hollow and V-hollow sites are located in the center of three V atoms with the underneath C and V atoms, respectively. The black lines in (a) and rhombus in (b) define the boundaries of the primitive cell in the side and top view, respectively. | |
3. Result and discussion
3.1 Geometry optimization
Monolayer pristine V2C is obtained by manually eliminating atomic aluminum layer “Al” from the MAX phase V2AlC unit cell, a layered hexagonal cell of the P63/mmc space group (space group number 194).31,61 The V2C primitive cell, shown in Fig. 1(a) and (b), is composed of three atoms arranged in ternary atomic layers, where carbon atoms are sandwiched between top and bottom vanadium atoms. The primitive cell is optimized in the way that lattice constants “a” and “b” are simultaneously increased or decreased, followed by the relaxation of atomic positions, until its optimal total energy is found. The lattice constants for the primitive cells of both pristine V2C and V2CO2 are calculated within various functionals, including references to the previous work,62 as the results are shown in Table 1. For V2C, it was found that the first four used functionals, i.e., PBE, PBE-D3, optPBE-vdW, and optB88-vdW, have similar lattice constants of about 2.89–2.90 Å and V–V distances of 2.16–2.17 Å, while vdW-DF predicts those values as high as 2.92 Å and 2.21 Å, respectively. Conversely, the functionals rev-vdW-DF2 and SCAN-rvv10 provide smaller values of only 2.87–2.88 Å and 2.18–2.19 for the lattice constants and V–V distances, respectively. For V2CO2, we have seen that “a” and “b” are almost unchanged or slightly increased for all functionals. The expansion of the intra-atomic layers in the “c” direction, or the functionalized orientation, is obvious by the increase of V–V distances of around 0.19–0.26 Å (∼10%) compared to ones for V2C for all the functionals, see Table 1, V2CO2, dV–V. Among benchmarked functionals, vdW-DF shows its highest lattice parameters and atomic-layer distances, while SCAN-rvv10 is on the reverse. This also implies that bond lengths described by vdW-DF are more elongated and debilitated than others. Accordingly, as shown in Table 1, the average V–O bond lengths, dV–O, for vdW-DF is the longest, about 1.98 Å compared to other functionals. SCAN-rvv10 predicts this bond length is only 1.94 Å, which is the shortest one.
Table 1 Optimized parameters with different exchange–correlation functionals for the primitive cell, a tetragonal geometry. Lattice constants “a” and “b” are equal. The expansion of intra-atomic layers is determined by the distance between the top and bottom V atoms dV–V. The bond length dV–O is defined as the average distance of the V atom to the three connected surface oxygen atoms
| Lattice constant (Å) |
vdW functional |
| PBE |
PBE-D3 |
optPBE-vdW |
optB88-vdW |
vdW-DF |
Rev-vdW-DF2 |
SCAN-rvv10 |
Ref. 62 |
| Calculated with a PBE method.62 |
| V2C |
a = b |
2.90 |
2.89 |
2.90 |
2.90 |
2.92 |
2.88 |
2.87 |
2.89a |
| dV–V |
2.16 |
2.17 |
2.16 |
2.16 |
2.21 |
2.19 |
2.18 |
2.18a |
| V2CO2 |
a = b |
2.90 |
2.89 |
2.90 |
2.90 |
2.94 |
2.89 |
2.87 |
2.90a |
| dV–V |
2.38 |
2.37 |
2.42 |
2.41 |
2.45 |
2.38 |
2.39 |
2.38a |
| dV–O |
1.95 |
1.95 |
1.96 |
1.96 |
1.98 |
1.95 |
1.94 |
N/A |
Obtaining the most compact V2CTX structures by SCAN-rvv10 is important to distinguish their energetic performances related to structural modifications.
3.2 Adsorption of CH4, CO2 and H2O
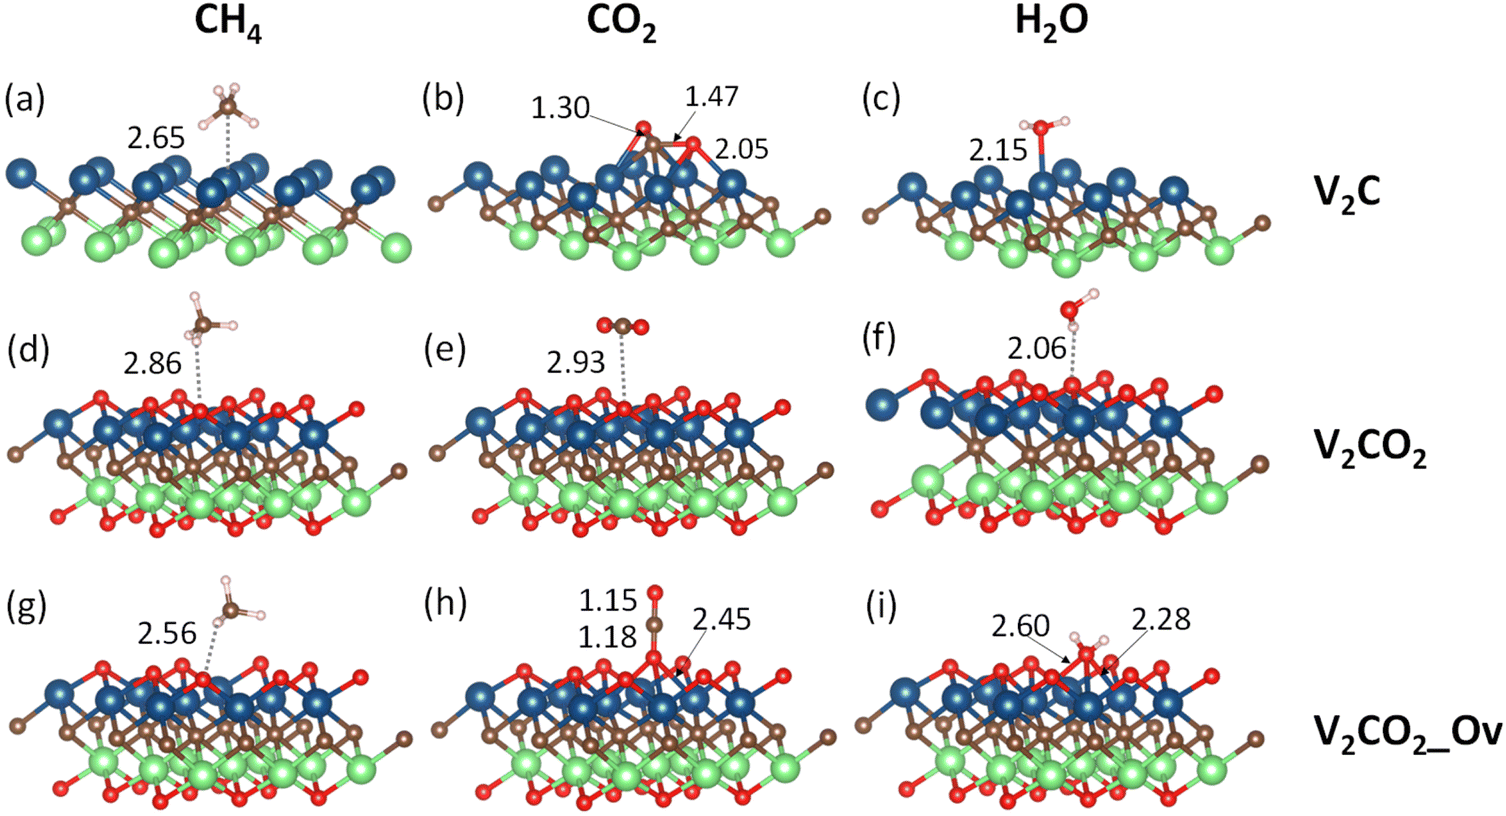
Terminated by V1+ atoms, V2C adsorbate is very active in the binding of small gas molecules through different adsorption mechanisms. Functionalizing of V2C with –O groups causes a reduction of V1+ to V2+ due to the strong negativity of surface oxygen atoms. The surface chemistry of V2CO2 is subsequently dominated by the presence of terminated groups O1−. Fig. 2 shows all the adsorption geometries of small molecules over both V2C and V2CO2. The atomic positions for each structure are provided in the ESI, Section S1.†
 |
| | Fig. 2 Most stable adsorption configurations are shown for all investigated molecules. The labels (a and b), and (c–e), and (f–i) denote the adsorption of target molecules on V2C, V2CO2, and V2CO2_Ov, respectively. The displayed numbers (in Å), calculated via SCAN-rvv10, show either the bond lengths or nearest distances (dash lines) between the molecules and surface atoms. | |
3.2.1 Adsorption affinity.
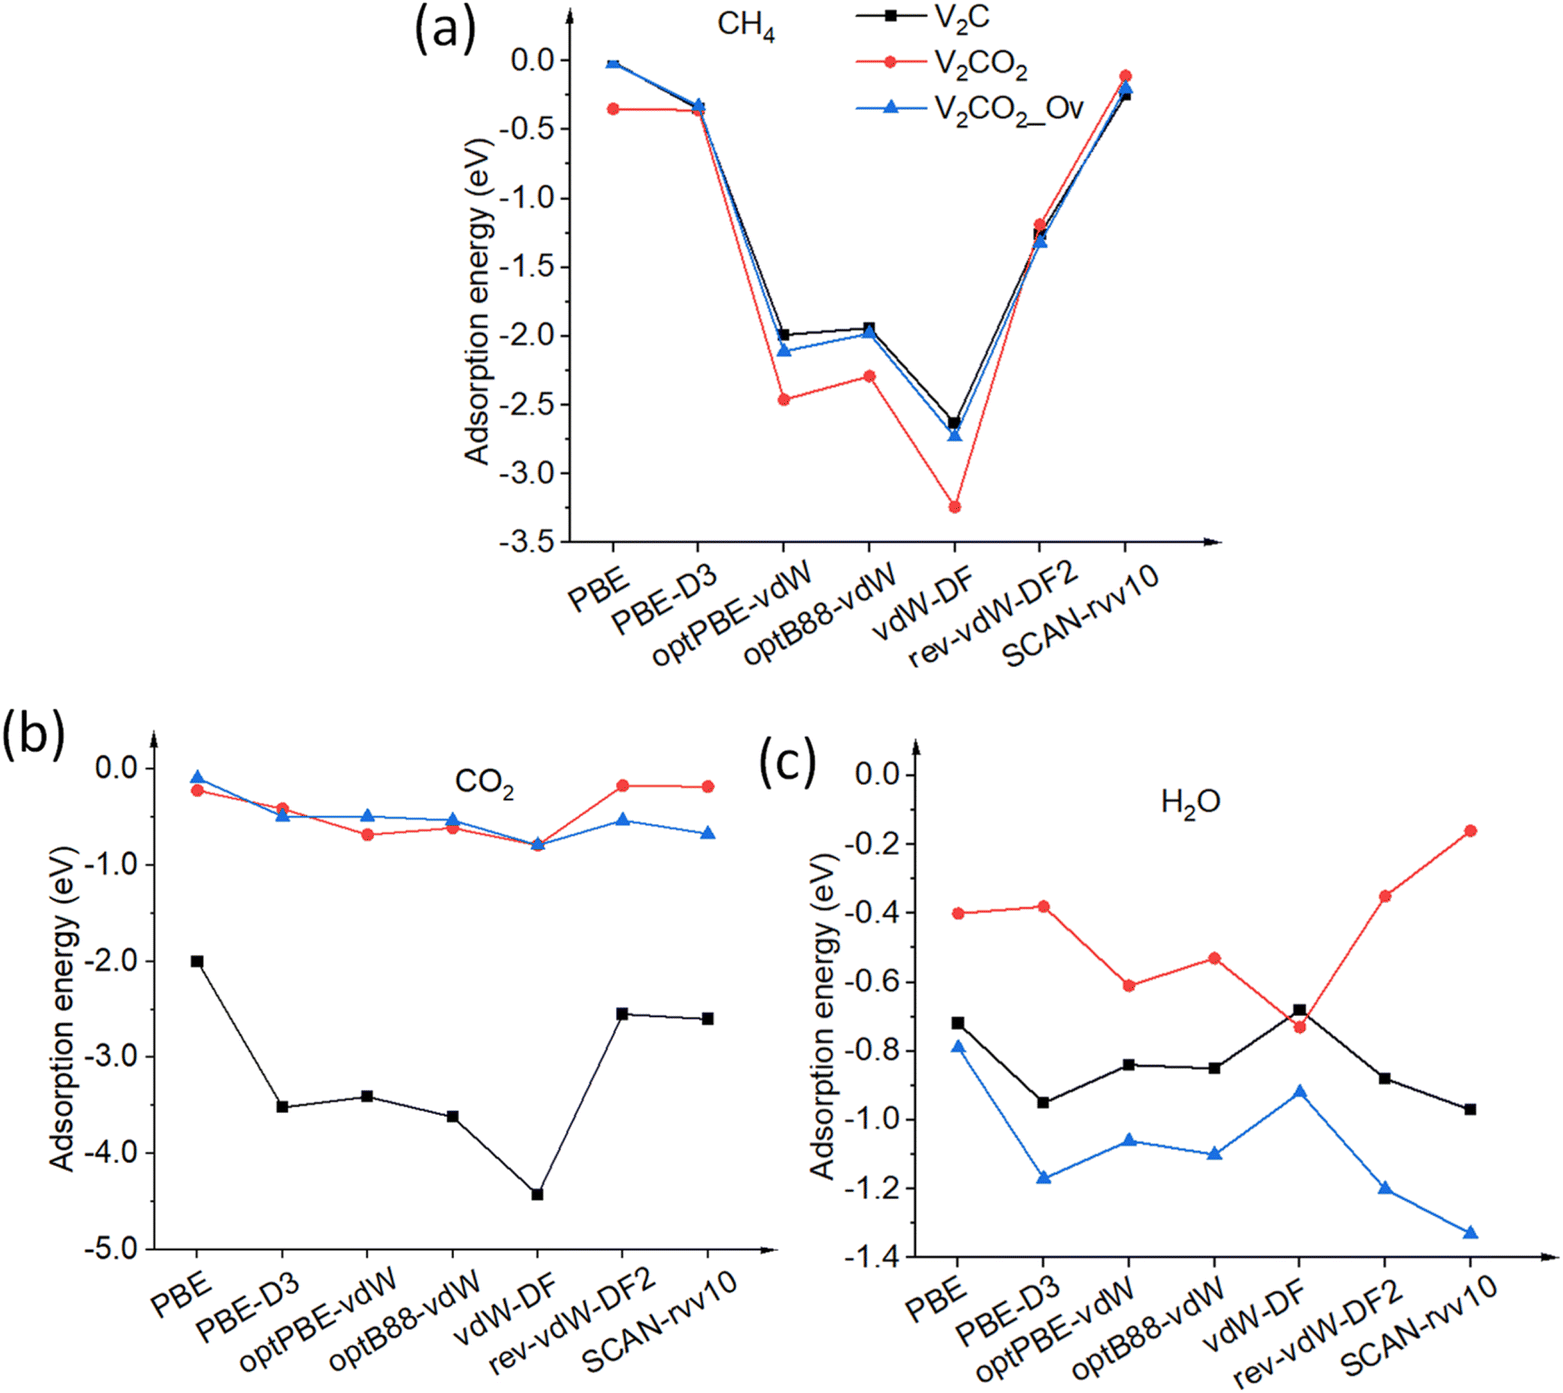
3.2.1.1 CH4. CH4, a nonpolar molecule, is inactive for binding to many materials. CH4 molecules can be captured by metal atoms via an electrostatic interaction.63–65 Here, CH4 molecules prefer binding to V-top atoms on the V2C surface with a η2 mode, see Fig. 2(a). This adsorption geometry agrees well with previous works, where CH4 resides on top of single metal atoms.64–66 The electrostatic attraction arises from the surface V1+ atom and a partially negative charge of carbon C of the CH4 molecule. The adsorption energies vary from a weak binding of less than 0.10 eV to a few eV depending on the performance of functionals, as shown in Table 2, entry 1, and Fig. 3(a). It can be seen that there is a large discrepancy in values derived from different functionals. Similar adsorption energies could be found in groups of PBE, PBE-D3, and SCAN-rvv10 functionals, while the other functionals show overbinding of CH4 being larger than unity. On V2CO2, CH4 molecules attach to the C-hollow site with three hydrogen atoms pointing towards surface oxygens, so-called a η3-like mode, see Fig. 2(d). There is another configuration, i.e., a η2-like mode, in which the energy is only about 2 meV smaller than the η3-like one accounted for SCAN-rvv10. The adsorption energies are higher for most of the functionals upon the functionalization compared to ones on the pristine, except for rev-vdW-DF2 and SCAN-rvv10. Considering equilibrium distances between CH4 and the V2CO2 surface, it has been found that SCAN-rvv10 estimated a shortest distance of 2.90 Å, compared to the values of greater than 3.0 Å for the others. Expectedly, SCAN-rvv10 provides the upper limit with a small binding energy of 0.11 eV for CH4 against various vdW-corrected functionals, cf. Table 2, entry 2. For the presence of Ov, the overall trend is inverse, as shown in Fig. 3(a), adsorption energies are enhanced for rev-vdW-DF2 and SCAN-rvv10 (see Table 2, entry 3), while it shows decreasing for other functionals.
Table 2 Adsorption energies (in eV) for the most stable adsorption configurations. The adsorbed species retain their molecular states on the V2CTx surface unless otherwise noted. On the pristine V2C surface, CH4 binds to the V atom via a η2 mode, H2 resides on the V-top site with a side-on geometry, CO2 prefers bridging configuration, while H2O prefers V-top configuration. Three entries in each molecule correspond to the adsorption of that molecule on the pristine V2C, V2CO2, and V2CO2_Ov, respectively
| Gas/V2CTx |
vdW functional |
| PBE |
PBE-D3 |
optPBE-vdW |
optB88-vdW |
vdW-DF |
rev-vdW-DF2 |
SCAN-rvv10 |
| Dissociated into CO and O fragments. |
| CH4 |
1 |
−0.01 |
−0.35 |
−1.99 |
−1.94 |
−2.63 |
−1.26 |
−0.25 |
| 2 |
−0.35 |
−0.36 |
−2.46 |
−2.29 |
−3.24 |
−1.19 |
−0.11 |
| 3 |
−0.02 |
−0.33 |
−2.11 |
−1.98 |
−2.73 |
−1.32 |
−0.20 |
| CO2 |
4 |
−2.00 |
−3.52 |
−3.41 |
−3.62 |
−4.43a |
−2.55 |
−2.60 |
| 5 |
−0.22 |
−0.41 |
−0.68 |
−0.61 |
−0.79 |
−0.17 |
−0.18 |
| 6 |
−0.09 |
−0.49 |
−0.49 |
−0.53 |
−0.79 |
−0.53 |
−0.67 |
| H2O |
7 |
−0.72 |
−0.95 |
−0.84 |
−0.85 |
−0.68 |
−0.88 |
−0.97 |
| 8 |
−0.40 |
−0.38 |
−0.61 |
−0.53 |
−0.73 |
−0.35 |
−0.16 |
| 9 |
−0.79 |
−1.17 |
−1.06 |
−1.10 |
−0.92 |
−1.20 |
−1.33 |
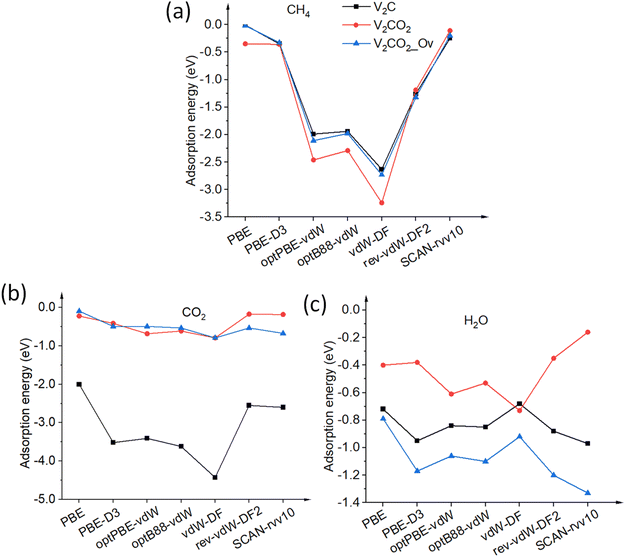 |
| | Fig. 3 Adsorption energies Eads of molecules (a) CH4, (b) CO2, and (c) H2O on pristine V2C and its functionalized structures are calculated with various van der Waals functionals. The solid lines connected points to points are for eye guidance. | |
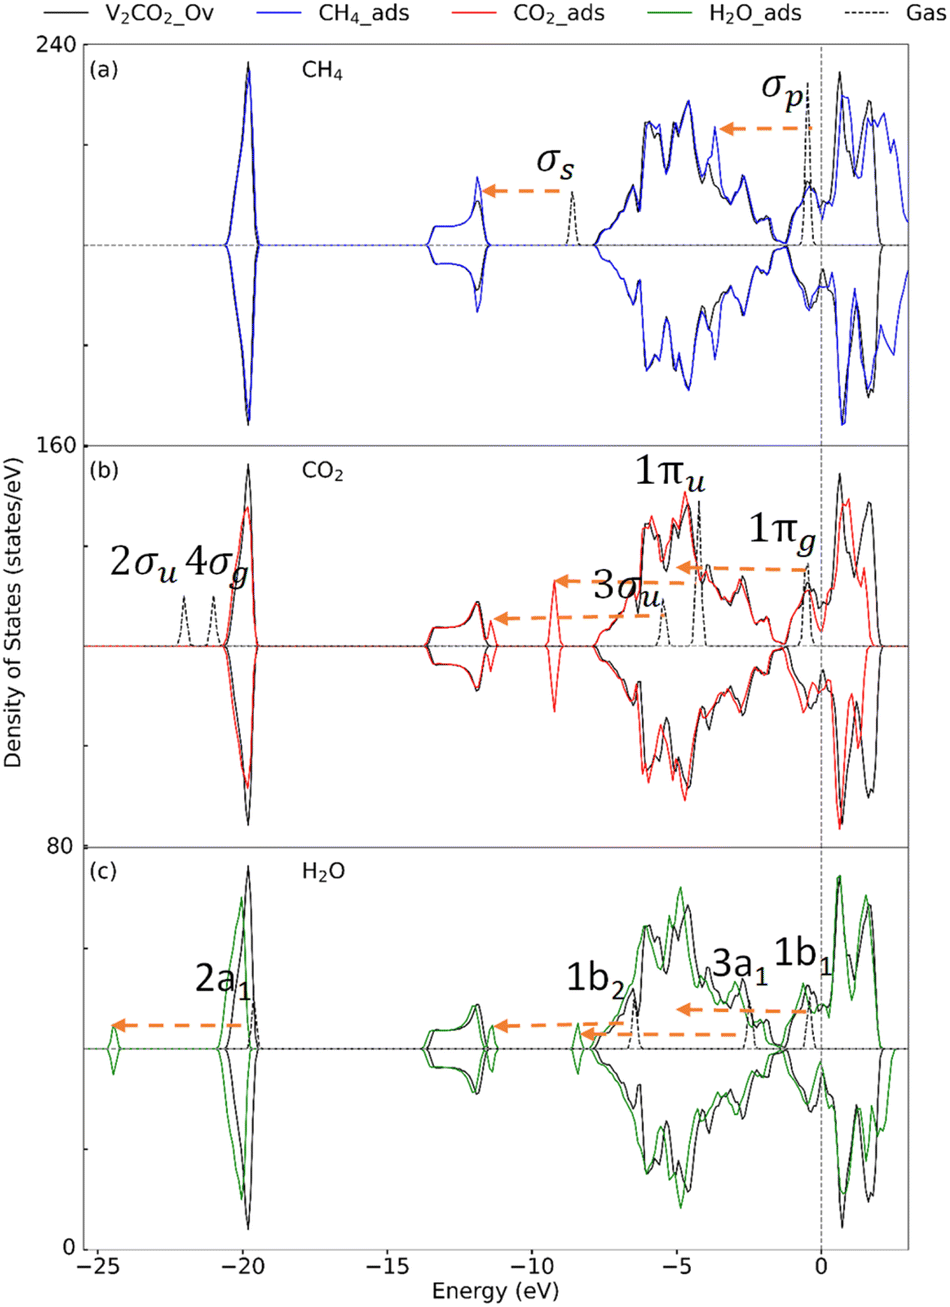
3.2.2 Insight into the electronic property. To determine the effect of adsorption on the electronic structure of host structures, the density of states (DOS) is plotted, as shown in Fig. 4–6, for V2C, V2CO2, and V2CO2_Ov, respectively. Compared to the gas phase, the DOS of bonding states are shifted to lower energy regions. The shift is larger for stronger bindings and vice versa. For CH4 adsorption, the pristine V2C surface noticeably modifies σp rather than σs, as can be seen in Fig. 4(a). Accordingly, σp is broader in the adsorbed state compared to the one near the Fermi level in the gas phase. This electronic structure modification is because of a transferring of 0.16e from the surface to CH4, as presented in Table 3. For CH4 adsorbed on V2CO2 and V2CO2_Ov, weak binding of CH4 is exhibited by a relative shifting of peaks without the influence of the hosts, as plotted in Fig. 5(a) and 6(a), respectively. For CO2, high charge transferring from the V2C, about 1.34e, see Table 3, causes a broadening of the 1πu peak in the adsorbed state, at around −7.5 eV, along with a strong reduction of DOS of the host V2C near the Fermi level, as plotted in Fig. 4(b). There is also a strong fluctuation of DOS near the Fermi level due to the preferable binding of CO2 at the vacant site on V2CO2_Ov, see Fig. 6(b), compared to the unchanged state on V2CO2, shown in Fig. 5(b). For H2O adsorption, we see that the DOS of the systems are almost similar on V2C and V2CO2 before and after adsorption, while there is a clear lowering shift of the DOS on V2CO2_Ov in response to a saturation of adsorbed H2O at the vacant site.
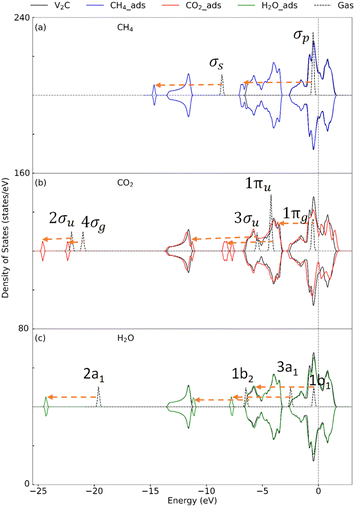 |
| | Fig. 4 Density of state for the adsorption of (a) CH4, (b) CO2, and (c) H2O on V2C. Dashes arrows indicate shifting of the peaks. | |
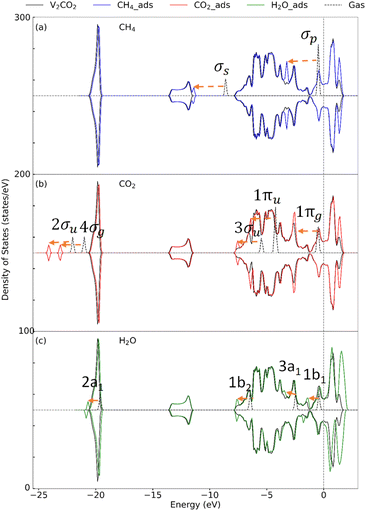 |
| | Fig. 5 Density of state for the adsorption of (a) CH4, (b) CO2, and (c) H2O on V2CO2. Dashes arrows indicate shifting of the peaks. | |
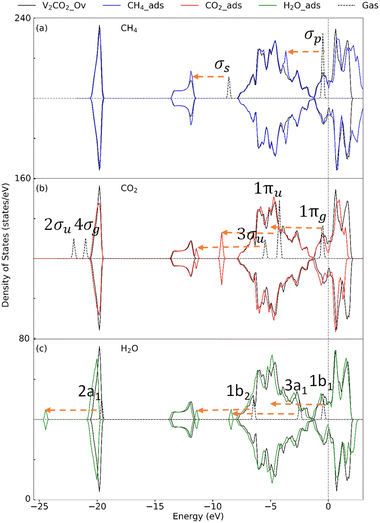 |
| | Fig. 6 Density of state for the adsorption of (a) CH4, (b) CO2, and (c) H2O on V2CO2_Ov. Dashes arrows indicate shifting of the peaks. | |
Table 3 The charge transfer between the V2CTX surfaces and adsorbed molecules. The positive and negative values indicate the charge donating from the surface to the adsorbate and vice versus, respectively
| V2CTX |
Charge transfer (e) |
| CH4 |
CO2 |
H2O |
| V2C |
0.16 |
1.34 |
−0.03 |
| V2CO2 |
0.02 |
0.01 |
0.00 |
| V2CO2_Ov |
0.09 |
−0.06 |
−0.09 |
3.3 Oxygen-vacancy effects
3.3.1 Vacancy formation energy. We first determine whether chemical bond strengths depend on the choice of functionals or not by considering the energy cost, or formation energy of vacancy, of eliminating one functional oxygen atom. The calculated result is shown in Fig. 7. All the obtained formation energies are over 2 eV, indicating chemical bonds are formed between surface oxygen and the underlying vanadium atoms. It can be seen that PBE and vdW-DF provide similar formation energies of around 2.65 eV, well in agreement with the literature,17 of which are smaller than other tested functionals. Formation energy values for PBE-D3, optPBE, and optB88 together distribute over a higher range from 2.90 to 3.10 eV, while ones for rev-vdW-DF2 and SCAN-rvv10 are most pronounced at about 3.20–3.30 eV. Higher formation energies obtained by rev-vdW-DF2 and SCAN-rvv10 are consistent with the fact that V–O bond lengths of these structures are nearest, as mentioned in Section 3.1, leading to stronger binding of O atoms. The trend of formation energy found here also reflects an overestimation of lattice constants and atomic distances of vdW-DF functional, where the bond lengths and bond strengths between atoms are longer and weaker. The bond lengths are improved by other functionals in the tested group, particularly for SCAN-rvv10, and so for the binding of terminal oxygen atoms.
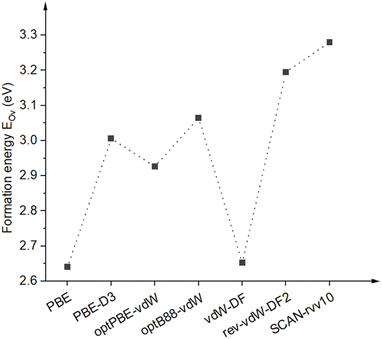 |
| | Fig. 7 Formation energies of oxygen vacancy EOv were calculated for different van der Waals functionals. The dashed line is for eye guidance. | |
3.3.2 High vacancy regime. The second and third oxygen atoms are further removed from the surface to generate double- and triple-oxygen vacancies. Here, only the nearest neighbors are considered resulting in two- and three-body cluster defects. The calculated formation energies of single-, double-, and triple-oxygen vacancies obtained by SCAN-rvv10 are 3.28, 3.59, and 4.05 eV, respectively. This implies the formation energies tend to increase for higher defect concentrations. Regarding the adsorption, Table 4 shows the influence of vacancy concentration, i.e., 1/9, 2/9, and 3/9 ML, on the adsorption affinity. As higher oxygen vacancy densities, the adsorption energies of all adsorbates significantly increase, about −0.20 to −0.40 eV, at the highest concentration of 3/9 ML, in response to binding preference to undercoordinated vanadium atoms induced by removing the functional groups. Accordingly, for 3/9 ML, CH4 molecules retain their η2 binding modes, similar to the one on the pristine V2C, while CO2 and H2O molecules attach atop under-coordinated surface vanadiums through monodentate configurations. Those adsorption geometries are provided in the ESI, Section S2.† For 2/9 ML, a slight decrease in the binding of CO2 and H2O is found, which might be the competition between the structural change and the adsorption.
Table 4 Adsorption energy (eV) at high vacancy concentrations. The single, double, and triple oxygen vacancies are denoted as 1/9 ML, 2/9 ML, and 3/9 ML, respectively. ML stands for “monolayer”. 9 is the total number of identical adsorption sites on the investigation surface
| Gas |
Oxygen-vacancy concentration |
| 1/9 ML |
2/9 ML |
3/9 ML |
| CH4 |
−0.20 |
−0.22 |
−0.64 |
| CO2 |
−0.67 |
−0.52 |
−0.87 |
| H2O |
−1.33 |
−1.27 |
−1.58 |
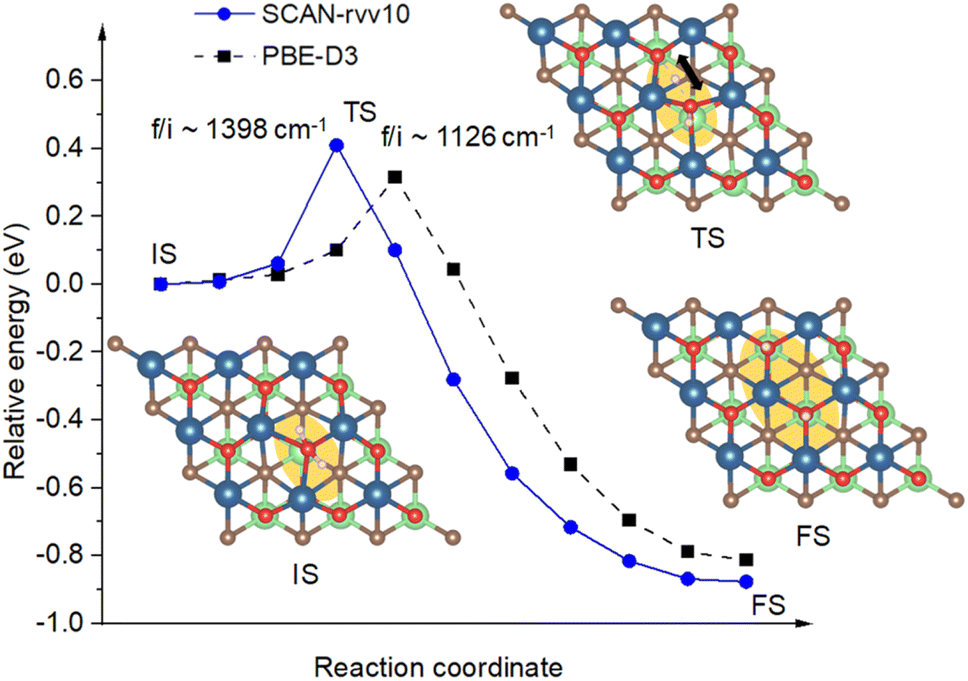
3.3.3 Adsorption and dissociation of adsorbed H2O molecules. It has been introduced in the previous section that the absence of surface atomic oxygen creates dangling bonds as active sites for the capturing of target molecules. Among investigated species, H2O, followed by CO2, show their highest affinities towards the Ov sites to saturate undercoordinated vanadium atoms. Calculated by SCAN-rvv10 functional, there is a significant energy shift from −0.16 eV to −1.33 eV via the hydrogen-to-chemical bond concerning before and after the presence of Ov, respectively. This adsorption could be characterized by considering the vibrational modes of H2O before and after binding. Accordingly, we have obtained a lowering of about 200 cm−1 for asymmetry and symmetry stretching modes of adsorbed H2O compared to its isolated gas-phase counterpart, i.e., 3698 and 3606 vs. 3963 and 3848 cm−1, respectively, while the bending modes are unaffected. This happens in response to the small elongation of O–H bond lengths from 0.96 to 0.97 Å for adapting from the isolated-to-adsorbed states. Moreover, upon binding to undercoordinated vanadium atoms, adsorbed H2O reveals a weak charge withdrawal of about 0.09 e from surface V atoms for its stabilization. Through first-principles molecular dynamics simulations, the early work on Ti3C2O2, a family of V2CTx, showed that H2O can recover the oxygen at the oxygen-vacancy site by its decomposition reaction, however, it did not address the dissociative barrier.68 In this work for V2CO2, Fig. 8 shows the calculated energy path along the dissociation channel for H2O with the intrinsic energy barrier. Adsorbed at Ov site, or IS, one of the hydrogen atoms of H2O leaves its bonding state and hops to the available neighboring oxygen site, depicted as transition state (TS) and final state (FS) geometries in Fig. 8. For the TS, the activation barrier for this dissociation is small at 0.40 eV, approximately corresponding to the temperature activation of 140 K by heating or electron exposure,69 calculated by SCAN-rvv10 functional, while it is found to be 0.30 eV by PBE-D3 as a reference. The imaginary frequency is approximately 1400 cm−1 in magnitude for SCAN-rvv10, compared to 1126 cm−1 obtained by PBE-D3, corresponding to a stretching vibration of the hydrogen atom. This relatively low energy is attributed to a pre-elongation of the H–O bond of adsorbed H2O and the presence of the nearby functionalized active center –O for the stabilizing of the dissociated-unbound hydrogen atom.
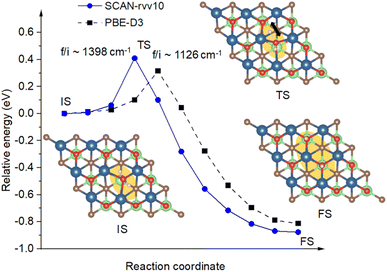 |
| | Fig. 8 The energy paths, calculated with SCAN-rvv10, with a reference via PBE-D3, are shown for the dissociation of H2O initiated at Ov sites. It also includes the geometries of adsorption/initial state (IS), transition state (TS), and final state (TS). The orange background highlights the active region of H2O on the surface for a top view. The imaginary frequencies denoted as “f/i” are provided for transition states. The black arrow indicates the vibrational direction of the dissociated hydrogen atom at the TS. | |
Fig. 9 displays the density of state (DOS) for the structures before and after functionalization, the structure with an oxygen vacancy, and the adsorbed H2O. Compared between Fig. 9(a) and (b), it can be seen that the oxygen functionalization results in the shift of the entire bonding region around the Fermi level, down to −5.0 eV, because more bondings are formed between V and surface oxygen at the Ov site. The DOS of V atoms becomes broadened for both bonding and antibonding states upon missing surface oxygen at that site, see Fig. 9(c). This is beneficial for the adsorption of water molecules, which its DOS is plotted in Fig. 9(d). The O_p orbital of the O atom in H2O replaces the role of Ov, however, it shows a weaker binding to V than Ov with fewer bonding states around the Fermi level. We can see here that three more peaks, i.e., p1, p2, and s, appear concerning the hybridizations of O_s and O_p orbitals of H2O with the s orbital of H. One of the O_p peaks, i.e. p1, is higher in energy, and closer to the Fermi level, than the others. At the TS state, Fig. 9(e), the peak p1 is broadened and smaller, showing the weakening of the O–H bond in water. For the final state, the DOS is shown in Fig. 9(f), a new p3 state appears in between p1 and p2 in energy corresponding to the formation of the surface O–H bonding states. The closer orbital energy of the p1 peak against the Fermi level, or in other words closer to DOS of nearby oxygens, enhances the dissociation of water with a small barrier aforementioned and further stabilizes surface oxygens. This is important in showing the potential vacancy-adsorption site for actively catalytic occurrences.
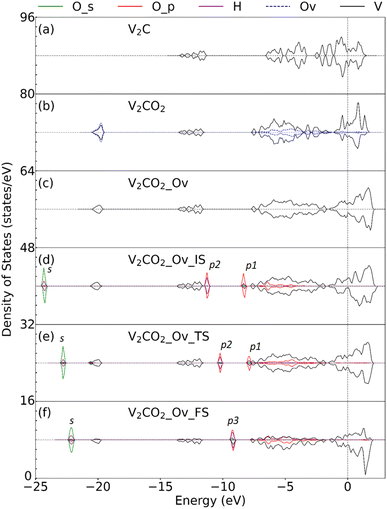 |
| | Fig. 9 The projected density of state (PDOS) represents the change in molecular states upon the adsorption and dissociation of H2O molecules. The subfigure (a)–(c) are the PDOS for the pristine V2C, O-functionalized V2CO2, and oxygen vacancy V2CO2_Ov, respectively. The PDOS of H2O at the Ov site is plotted in (d)–(f) for the adsorption, transition, and final states, respectively. O_s, O_p, and H correspond to the s and p orbitals of O, and the hydrogen atom in H2O. Ov represents the functionalized oxygen atom at the vacancy site. Here, we only consider the DOS of three V atoms connected to Ov, presented by the black line. The vertical dash line at 0 eV indicates the Fermi level. | |
4. Conclusions
We study the stability and energetic performances of small organic molecules over V2C and V2CTx by employing first-principles DFT-based calculations. It was demonstrated that commonly used pairwise-additive and nonlocal vdW functionals can similarly describe the adsorption affinity of both polar and nonpolar molecules on V2CTx. Recently developed van der Waals functionals, i.e., rev-vdW-DF2 or SCAN-rvv10, are more rational for energetic performances by lessening or enhancing the binding of nonpolar and polar molecules such as CH4 and H2O, respectively. The early vdW functional, i.e., vdW-DF, obviously overestimates the atomic bond lengths of both host and target molecules resulting in the adsorption dissociations of extremely stable CO2 molecules on the pristine surface. For full terminations, adsorption energies, i.e., less than −0.20 eV, are on the same scale for the studied gases showing the binding strengths of weak vdW or hydrogen bonding types. High selectivity is observed for oxygen-vacancy structures with the preferred binding of H2O at the vacant sites via the chemical bonds. Upon the adsorption, the charges are found to be transferred from the surface to the adsorbed molecules for the pristine V2C and in an opposite direction for the oxygen vacancy surfaces. The adsorption causes shifting of the DOS toward a lower energy range, resulting in more stable configurations and strong changes in the density of states near the Fermi levels. Higher oxygen-vacancy concentrations offer stronger bindings of all adsorbates relying on the coordination at the vacancy-induced vanadium sites. Preadsorbed single water molecule proceeds a dissociation channel with a small activation barrier, about 0.40 eV, in response to the close orbital overlaps of adsorbed and functionalized atoms. The oxygen-vacancy site serves as an active center for both capturing and activating such dissociation reactions. The different energetics for specific structural phases of adsorptions suggest that CH4, CO2, and H2O respond similarly in full termination surfaces. However, a small number of single-atom defects presented, i.e., oxygen vacancies, enhance the adsorption of H2O, followed by CO2. Further removing functional groups, resulting in a pristine surface, is beneficial for the capture of CO2 only. Our work provides a potential scheme for greenhouse gas separation applications provided that control of the surface chemistry is pivotal in realistic conditions. Certainly, the positions and concentrations of vacancies should be considered and manipulated completely on purpose. In such circumstances, experimental validation is highly valuable not only for greenhouse gas treatment as in this study but also for activating other adsorbates. The engineering of functionalized MXene surfaces paves the way for the enhancement of its chemical activities regarding its multiple roles as binding sites, catalysts, or catalyst beds. Consequently, it is essential to establish an intrinsic correlation between vacancy density and catalytic activity. The co-adsorption of target molecules is also another issue in practice. For example, the clustering of water molecules might happen to the hydrophilic MXene surfaces, influencing either the adsorptive affinity or catalytic activity, which has been disregarded in the current work. All these factors are greatly attributed to both fundamental understandings and practical performances that should be carefully taken into account.
Data availability
The data supporting this article have been included as part of the ESI.†
Conflicts of interest
There are no conflicts to declare.
Acknowledgements
The authors greatly acknowledge the Center for Innovative Materials and Architectures, Vietnam National University Ho Chi Minh City, Vietnam, Institute for Materials Research, Tohoku University, Japan, and the Institute of Atomic and Molecular Sciences, Academia Sinica, Taiwan for providing authorized computational packages, as well as high-performance computing resources. T. N. M. L. would like to thank Dr Jer-Lai Kuo at the Institute of Atomic and Molecular Sciences, Academia Sinica, Taiwan for the assistance.
References
- W. Liu, A. Tkatchenko and M. Scheffler, Acc. Chem. Res., 2014, 47, 3369–3377 CrossRef CAS PubMed.
- W. Liu, F. Maass, M. Willenbockel, C. Bronner, M. Schulze, S. Soubatch, F. S. Tautz, P. Tegeder and A. Tkatchenko, Phys. Rev. Lett., 2015, 115, 036104 CrossRef PubMed.
- S. Mehdi Aghaei, A. Aasi and B. Panchapakesan, ACS Omega, 2021, 6, 2450–2461 CrossRef CAS PubMed.
- S. Massoumilari and S. Velioglu, ACS Omega, 2023, 8, 29859–29909 CrossRef PubMed.
- A. Tkatchenko, L. Romaner, O. T. Hofmann, E. Zojer, C. Ambrosch-Draxl and M. Scheffler, MRS Bull., 2011, 35, 435–442 CrossRef.
- J. E. Lennard-Jones, Trans. Faraday Soc., 1932, 28, 333–359 RSC.
- K. Berland, C. A. Arter, V. R. Cooper, K. Lee, B. I. Lundqvist, E. Schroder, T. Thonhauser and P. Hyldgaard, J. Chem. Phys., 2014, 140, 18A539 CrossRef.
- S. Grimme, S. Ehrlich and L. Goerigk, J. Comput. Chem., 2011, 32, 1456–1465 CrossRef CAS PubMed.
- N. Marom, A. Tkatchenko, M. Rossi, V. V. Gobre, O. Hod, M. Scheffler and L. Kronik, J. Chem. Theory Comput., 2011, 7, 3944–3951 CrossRef CAS PubMed.
- D. Chakraborty, K. Berland and T. Thonhauser, J. Chem. Theory Comput., 2020, 16, 5893–5911 CrossRef CAS PubMed.
- K. Berland, V. R. Cooper, K. Lee, E. Schroder, T. Thonhauser, P. Hyldgaard and B. I. Lundqvist, Rep. Prog. Phys., 2015, 78, 066501 CrossRef PubMed.
- Y. Gogotsi and B. Anasori, ACS Nano, 2019, 13, 8491–8494 CrossRef CAS PubMed.
- M. Naguib, V. N. Mochalin, M. W. Barsoum and Y. Gogotsi, Adv. Mater., 2014, 26, 992–1005 CrossRef CAS PubMed.
- A. Iqbal, J. Hong, T. Y. Ko and C. M. Koo, Nano Convergence, 2021, 8, 9 CrossRef CAS.
- V. Shukla, Mater. Adv., 2020, 1, 3104–3121 RSC.
- R. Thakur, A. VahidMohammadi, J. Moncada, W. R. Adams, M. Chi, B. Tatarchuk, M. Beidaghi and C. A. Carrero, Nanoscale, 2019, 11, 10716–10726 RSC.
- J. D. Gouveia and J. R. B. Gomes, Phys. Rev. Mater., 2022, 6, 024004 CrossRef CAS.
- Z. Xu, X. Lv, J. Chen, L. Jiang, Y. Lai and J. Li, Phys. Chem. Chem. Phys., 2017, 19, 7807–7819 RSC.
- L. Wang, D. Liu, W. Lian, Q. Hu, X. Liu and A. Zhou, J. Mater. Res. Technol., 2020, 9, 984–993 CrossRef CAS.
- K. Han, Y. Ji, Q. Hu, Q. Wu, D. Li and A. Zhou, Phys. Chem. Chem. Phys., 2024, 26, 18030–18040 RSC.
- Q. Wu, Z. Wang, Q. Hu, Y. Ji, D. Li, J. Wang, Q. Xia, L. Wang and A. Zhou, Phys. Chem. Chem. Phys., 2023, 25, 14406–14416 RSC.
- Q. Hu, Y. Ji, D. Li, Z. Wang, K. Han, Q. Wu, J. Wang, Q. Xia, L. Wang and A. Zhou, Phys. Chem. Chem. Phys., 2023, 25, 9428–9436 RSC.
- S. Li, Y. Wang, Y. Wang, S. Sanvito and S. Hou, J. Phys. Chem. C, 2021, 125, 6945–6953 CrossRef CAS.
- I. Persson, J. Halim, H. Lind, T. W. Hansen, J. B. Wagner, L. A. Naslund, V. Darakchieva, J. Palisaitis, J. Rosen and P. O. A. Persson, Adv. Mater., 2019, 31, e1805472 CrossRef PubMed.
- R. Morales-Salvador, J. D. Gouveia, Á. Morales-García, F. Viñes, J. R. B. Gomes and F. Illas, ACS Catal., 2021, 11, 11248–11255 CrossRef CAS.
- D. H. Ho, Y. Y. Choi, S. B. Jo, J. M. Myoung and J. H. Cho, Adv. Mater., 2021, 33, e2005846 CrossRef.
- J. T. Mazumder and R. K. Jha, Sens. Actuators Rep., 2023, 6, 100174 CrossRef.
- Q. Hu, W. Liu, D. Li, Q. Wu, Y. Chang, J. Wang, Q. Xia, L. Wang and A. Zhou, Mater. Today Commun., 2024, 40, 109467 CrossRef CAS.
- M. Keyhanian, D. Farmanzadeh, Á. Morales-García and F. Illas, J. Mater. Chem. A, 2022, 10, 8846–8855 RSC.
- M. Wu, B. Wang, Q. Hu, L. Wang and A. Zhou, Mater., 2018, 11, 2112 CrossRef.
- M. Naguib, M. Kurtoglu, V. Presser, J. Lu, J. Niu, M. Heon, L. Hultman, Y. Gogotsi and M. W. Barsoum, Adv. Mater., 2011, 23, 4248–4253 CrossRef CAS PubMed.
- K. Matthews, T. Zhang, C. E. Shuck, A. VahidMohammadi and Y. Gogotsi, Chem. Mater., 2021, 34, 499–509 CrossRef.
- M. Wu, Y. An, R. Yang, Z. Tao, Q. Xia, Q. Hu, M. Li, K. Chen, Z. Zhang, Q. Huang, S.-h. Ma and A. Zhou, ACS Appl. Nano Mater., 2021, 4, 6257–6268 CrossRef CAS.
- S. M. Majhi, A. Ali, Y. E. Greish, H. F. El-Maghraby and S. T. Mahmoud, Sci. Rep., 2023, 13, 3114 CrossRef CAS.
- E. Lee, A. VahidMohammadi, Y. S. Yoon, M. Beidaghi and D. J. Kim, ACS Sens., 2019, 4, 1603–1611 CrossRef CAS PubMed.
- N. Liu, J. Li, S. Ma and Z. Jiao, Phys. E, 2023, 148 Search PubMed.
- N. Salami, Appl. Surf. Sci., 2022, 581, 152105 CrossRef CAS.
- H. Lei, Z. Hao, K. Chen, Y. Chen, J. Zhang, Z. Hu, Y. Song, P. Rao and Q. Huang, J. Phys. Chem. Lett., 2020, 11, 4253–4260 CrossRef CAS PubMed.
- Á. Morales-García, A. Fernández-Fernández, F. Viñes and F. Illas, J. Mater. Chem. A, 2018, 6, 3381–3385 RSC.
- R. Thakur, M. Hoffman, A. VahidMohammadi, J. Smith, M. Chi, B. Tatarchuk, M. Beidaghi and C. A. Carrero, ChemCatChem, 2020, 12, 3639–3643 CrossRef CAS.
- J. D. Gouveia, Á. Morales-García, F. Viñes, F. Illas and J. R. B. Gomes, Appl. Catal., B, 2020, 260, 118191 CrossRef CAS.
- A. Bandyopadhyay, D. Ghosh and S. K. Pati, Phys. Chem. Chem. Phys., 2018, 20, 4012–4019 RSC.
- R. Ibragimova, P. Rinke and H.-P. Komsa, Chem. Mater., 2022, 34, 2896–2906 CrossRef CAS.
- M. A. Hope, A. C. Forse, K. J. Griffith, M. R. Lukatskaya, M. Ghidiu, Y. Gogotsi and C. P. Grey, Phys. Chem. Chem. Phys., 2016, 18, 5099–5102 RSC.
- X. Zhang, Z. Zhang, J. Li, X. Zhao, D. Wu and Z. Zhou, J. Mater. Chem. A, 2017, 5, 12899–12903 RSC.
- S. Ram, G. H. Choi, A. S. Lee, S.-C. Lee and S. Bhattacharjee, J. Phys. Chem. C, 2023, 127, 12576–12585 CrossRef CAS.
- J. Xu, T. Wang, C. Geng, Y. Zhen, M. Lin, Z. Huang, Y. Shi, L. Zhao and W. Xing, ACS Appl. Nano Mater., 2024, 7, 20974–20984 CrossRef CAS.
- S. Jung, U. Zafar, L. S. K. Achary and C. M. Koo, EcoMat, 2023, 5, e12395 CrossRef CAS.
- A. Junkaew and R. Arroyave, Phys. Chem. Chem. Phys., 2018, 20, 6073–6082 RSC.
- G. Kresse and J. Hafner, Phys. Rev. B:Condens. Matter Mater. Phys., 1993, 47, 558–561 CrossRef CAS PubMed.
- P. E. Blochl, Phys. Rev. B:Condens. Matter Mater. Phys., 1994, 50, 17953–17979 CrossRef PubMed.
- J. P. Perdew, K. Burke and M. Ernzerhof, Phys. Rev. Lett., 1996, 77, 3865–3868 CrossRef CAS PubMed.
- J. P. Perdew, K. Burke and M. Ernzerhof, Phys. Rev. Lett., 1997, 78, 1396 CrossRef CAS.
- J. Klimes, D. R. Bowler and A. Michaelides, J. Phys.:Condens. Matter, 2010, 22, 022201 CrossRef PubMed.
- M. Dion, H. Rydberg, E. Schroder, D. C. Langreth and B. I. Lundqvist, Phys. Rev. Lett., 2004, 92, 246401 CrossRef CAS PubMed.
- I. Hamada, Phys. Rev. B:Condens. Matter Mater. Phys., 2014, 89, 121103(R) CrossRef.
- H. Peng, Z.-H. Yang, J. P. Perdew and J. Sun, Phys. Rev. X, 2016, 6, 041005 Search PubMed.
- S. Maintz, V. L. Deringer, A. L. Tchougreeff and R. Dronskowski, J. Comput. Chem., 2016, 37, 1030–1035 CrossRef CAS PubMed.
- K. Momma and F. Izumi, J. Appl. Crystallogr., 2011, 44, 1272–1276 CrossRef CAS.
- G. Henkelman, B. P. Uberuaga and H. Jónsson, J. Chem. Phys., 2000, 113, 9901–9904 CrossRef CAS.
- M. Naguib, O. Mashtalir, J. Carle, V. Presser, J. Lu, L. Hultman, Y. Gogotsi and M. W. Barsoum, ACS Nano, 2012, 6, 1322–1331 CrossRef CAS PubMed.
- A. Champagne, L. Shi, T. Ouisse, B. Hackens and J.-C. Charlier, Phys. Rev. B, 2018, 97, 115439 CrossRef CAS.
- G. W. Roffe and H. Cox, J. Phys. Chem. A, 2013, 117, 3017–3024 CrossRef CAS PubMed.
- O. V. Lushchikova, S. Reijmer, P. B. Armentrout and J. M. Bakker, J. Am. Soc. Mass Spectrom., 2022, 33, 1393–1400 CrossRef CAS PubMed.
- T. N.-M. Le, T. B. N. Le, P. T. Nguyen, T. T. Nguyen, Q. N. Tran, T. T. Nguyen, Y. Kawazoe, T. B. Phan and D. M. Nguyen, RSC Adv., 2023, 13, 15926–15933 RSC.
- S. Impeng, P. Khongpracha, J. Sirijaraensre, B. Jansang, M. Ehara and J. Limtrakul, RSC Adv., 2015, 5, 97918–97927 RSC.
- V. Parey, B. M. Abraham, S. H. Mir and J. K. Singh, ACS Appl. Mater. Interfaces, 2021, 13, 35585–35594 CrossRef CAS.
- H. Song and D. E. Jiang, Nanoscale, 2023, 15, 16010–16015 RSC.
- S. Maier and M. Salmeron, Acc. Chem. Res., 2015, 48, 2783–2790 CrossRef CAS PubMed.
|
| This journal is © The Royal Society of Chemistry 2025 |
Click here to see how this site uses Cookies. View our privacy policy here. 
 Open Access Article
 This Open Access Article is licensed under a Creative Commons Attribution-Non Commercial 3.0 Unported Licence
 *ab,
Thong Le Minh Pham
*ab,
Thong Le Minh Pham