
 Open Access Article
 This Open Access Article is licensed under a
 Creative Commons Attribution 3.0 Unported Licence
Crafting the architecture of biomass-derived activated carbon via electrochemical insights for supercapacitors: a review
T. Manimekalaa,
R. Sivasubramanian b,
Mushtaq Ahmad Darc and
Gnanaprakash Dharmalingam*d
b,
Mushtaq Ahmad Darc and
Gnanaprakash Dharmalingam*d
aElectrochemical Sensors and Energy Materials Laboratory, Department of Nanoscience and Technology, PSG Institute of Advanced Studies, Peelamedu, Coimbatore-641 004, Tamilnadu, India
bDepartment of Chemistry, Amrita School of Physical Sciences, Amrita Vishwa Vidyapeetham, Amaravati, Andhra Pradesh, India
cCenter of Excellence for Research in Engineering Materials, Deanship of Scientific Research (DSR), King Saud University, Riyadh 11421, Saudi Arabia
dPlasmonic Nanomaterials Laboratory, Department of Nanoscience and Technology, PSG Institute of Advanced Studies, Peelamedu, Coimbatore-641 004, Tamilnadu, India. E-mail: dgp@psgias.ac.in
First published on 24th January 2025
Abstract
Escalating energy demands have often ignited ground-breaking innovations in the current era of electrochemical energy storage systems. Supercapacitors (SCs) have emerged as frontrunners in this regard owing to their exclusive features such ultra-high cyclic stability, power density, and ability to be derived from sustainable sources. Despite their promising attributes, they typically fail in terms of energy density, which poses a significant hindrance to their widespread commercialization. Hence, researchers have been exploring different cutting-edge technologies to address these challenges. This review focuses on biomass-derived activated carbon (BDAC) as a promising material for SCs. Initially, the methodology and key factors involved in synthesising BDAC, including crafting the building blocks of SCs, is detailed. Further, various conventional and novel material characterization techniques are examined, highlighting important insights from different biomass sources. This comprehensive investigation seeks to deepen our understanding of the properties of materials and their significance in various applications. Next, the architectural concepts of SCs, including their construction and energy storage mechanisms, are highlighted. Finally, the translation of the unravelled BDAC metrics into promising SCs is reviewed with comprehensive device-level visualisations and quantifications of the electrochemical performance of SCs using various techniques, including cyclic voltammetry (CV), galvanostatic charge–discharge test (GCD), electrochemical impedance spectroscopy (EIS), cyclic tests (CT), voltage holding tests (VHT) and self-discharge tests (SDT). The review is concluded with a discussion that overviews peanut-shell-derived activated carbon as it is a common and promising source in our geographical setting. Overall, the review explores the current and futuristic pivotal roles of BDAC in the broad field of energy storage, especially in SC construction and commercialisation.
1 Introduction
The depletion of fossil fuels and environmental pollution propel the development of efficient and environment-friendly green energy storage devices.1,2 In this realm, supercapacitors (SCs) are efficient electrochemical storage devices that can store electrical energy via electrostatic interactions, with high power densities (Pd) (>10 kW kg−1), long cycle lives, rapid carbon charging/discharging rates, good reversibility, and wide operating temperatures (−40 °C to 70 °C).3–6 Thus, they are apt for applications with high power requirements, such as hybrid electric vehicles, portable electronic equipment, energy and power sectors, military and defence, aerospace, and aviation.7–9 Worldwide, as the demand for SCs is expected to rise rapidly at a CAGR of 20.17% during 2023–2032, reaching a market value of US $ 27.7 billion by 2032, a myriad of companies have invested in propelling SC research and commercialisation.10 Conventional capacitors have mF- or μF-scale capacitance, which depends largely on the area and distance between the electrodes.11 SCs comprise two electrodes sandwiched between electrolyte-soaked ion separators. Electrolytes that contain solvated ions and a thin, ion-permeable, microporous membrane separator permit the free passage of ions between them.12 This leads to higher Pd than those of batteries, and batteries involve slower electrochemical reactions. Hence, the energy density (Ed) of SCs is relatively higher than those of conventional capacitors, but their Pd is vastly superior to those of batteries.13,14 Thus, they serve in part to bridge the gap between rechargeable batteries and conventional capacitors.15,16The electrochemical performance of SCs relies on the type of electrode material (i.e., carbon/metal oxide/polymer-based)17–19 and their mass loading,20 type (i.e. aqueous, non-aqueous, or solid-state)21–23 and molar concentration of the electrolyte,24,25 operating potential window,26 binders,27 current collectors (i.e. foil, foam, cloth, or sheet),28–30 type of separators,31,32 cell type (symmetric or asymmetric),33,34 cell assembly type (coin cell, cylindrical cell, prismatic cell or pouch cell),35,36 etc. However, SCs are limited by their low Ed, which is dictated by their specific capacitance (Cs). Current SC research focuses on multiple aspects, such as the design and fabrication of separators,31 development of electrolytes,37 examining the ageing properties of SC cell components via in situ and ex situ techniques38 and developing electrode materials from widely available sources, such as biomass, to enhance the Ed.
The emergence of flexible and portable electronic devices has created a high demand for electrochemical energy storage systems with exceptional energy density and power density. A primary obstacle in this domain is the development of flexible electrodes capable of meeting the energy density requirement. A promising solution to this challenge involves fabricating 3-D interconnected hybrid nanostructures that can serve as flexible current collectors. This structure offers a high surface-to-volume ratio, enabling high mass loadings of electroactive materials while maintaining excellent ohmic contact between the electrodes and current collectors.34 Other key challenges are in selecting novel electrode materials in the nanoscale, designing electrodes, understanding the fundamental differences between electrochemical capacitors and battery-type materials, and developing basic techniques to analyse capacitive and pseudocapacitive behaviours.39
Carbon has different allotropes, such as graphite, diamond in the bulk phase and fullerene, carbon nanotubes (CNT), and graphene, in the nanoscale. Among carbonaceous materials, Biomass-Derived Activated Carbon (BDAC) is deemed to be crucial for commercial applications primarily due to its easy availability and low-cost production with a high yield compared with other carbon sources, such as carbide-derived carbon,40 graphene,41 and metal–organic frameworks.42 BDAC from various biomass sources have been extensively investigated for sustainable energy storage because of their meritorious physicochemical properties, such as high surface area, tunable porosity, chemical stability, good electrical conductivity, environment friendliness, and outstanding cycling stability.43
This review aims to provide an overview of the research on BDAC-based SCs. Due to the prevalence of biomass and the focus on SCs based on carbonaceous materials, here, we have reviewed different viewpoints and aspects of SCs based on carbonaceous materials, such as the significance of biomass, different sources, tuning material properties, BDAC-relevant SC configurations and understanding the relationship between BDAC and the electrochemical performance using powerful instrumentational techniques. We also comprehensively discuss peanut shells as a source of biomass-derived carbon that is prevalent in our geography and surmise the exclusive benefits of peanut shell-derived activated carbon (PSAC).
Contextually, this review is divided into three broad sections. The first section is on BDAC, starting from the interest in carbon materials for SC applications and BDAC metrics relevant to SCs, such as surface area (m2 g−1), specific capacitance (Cs) (F g−1), Ed (W h g−1), Pd (W g−1), capacitance retention (%) and post device cycling, reported so far. It further focuses on the synthesis, types, and activation mechanisms (Subsection 2), while BDAC characterization techniques are reviewed in Subsection 3. The second section of the review explains the applicability of BDAC in SCs (Subsection 4), including generic SC principles, SC construction, the working mechanisms, and specific characterization techniques for SCs that have been integrated with BDAC materials. The third and final broad section of the review concentrates on an essential subset of BDAC that is directly relevant to the geographical location of our group, namely the peanut shell-derived activated carbon (PSAC) (Subsection 5).
2 Carbon for SCs and carbon derived from nature: exploring BDAC
2.1 Architectures and morphologies of BDAC for optimal SC performance
In a SC, low tortuosity and a 3-dimensional (3D) hierarchical pore structure provide an optimal avenue for hydrated ions to move through the active material, resulting in improved performance, while uniform pore size distribution (PSD) offers consistent and shorter channels for the diffusion of the hydrated ions. The presence of performance-enhancing functionalities, such as functional groups that can be activated to enhance adsorption and charge mediation, is also a vital factor. For instance, an oxygen-containing functional group on the surface of the BDAC will enhance the hydrophilicity and the wettability of the electrode.44,45 Hence, it can be intuitively proposed that a biomass source with high carbon content (and consequently lower ash content), a 3D hierarchical porous structure and surface-enhancing functionalities are beneficial for SC applications.46,47A 3D interconnected hierarchical porous activated carbon (HPAC) is a complex material characterised by pores of different sizes across multiple length scales, forming a three-dimensional interconnected framework. It usually contains various kinds of pores, such as micropores, mesopores, and micropores.48 Typically, 3D interconnected HPAC allows fast charge transfer, which acts as an avenue for the solvated ions in the electrolyte. One of the essential criteria of an electrode material is the availability of a large surface area that facilitates abundant electroactive surface sites.49 Hence, hierarchical pore formation offers higher capacitance than homogenous pores. Mainly, micropores (<2 nm) can store electric charges, mesopores (2–50 nm) provide diffusion pathways for ions, and macropores (>50 nm) act as reservoirs.50 Moreover, surface defects on BDAC provide dangling bonds that serve as electrochemically reactive sites for the solvated ions in the electrolyte.51 A thorough exploration of 3D interconnected HPAC and its importance by Yan et al. is considered a considerably important publication in the field of BDAC-derived SCs.52 For example, angstrom-sized HPAC has been derived from onions through a direct pyrolysis method. Its N2 adsorption–desorption showed a type-I isotherm, which indicates a large number of micropores. Moreover, a sharp peak at 0.7 nm indicated a very short micropore distribution.48 Nanoporous structures with a 3D interconnected hierarchical porous architecture were obtained from cow dung at varying activation temperatures, with a substantial surface area of 2457 m2 g−1. This enhanced porosity is attributed to the removal of the dangling bonds and volatile components from the aromatic structure, resulting in a combination of nanopores and mesopores.53 Although template-assisted methods are preferred for generating ordered porous carbon, their practical implementation is hampered by complicated processing steps, the use of substantial amounts of activating agents, and template dependence.
Yet, morphologies that differ from the proposed combinations have demonstrated high performance as well; for example, a sheet-like structure facilitates direct pathways for ions to diffuse through the electrode material, effectively shortening the diffusion pathway, which leads to faster ion kinetics. A balanced combination of high surface area and mesopore volume can also be achieved by carefully choosing processing conditions, such as pre-carbonization of wheat husk using a salt sealing technique in the air followed by KOH activation. The combination of molten KCl and NaCl salts played a dual role in the pre-carbonization step, acting both as a template to generate mesopores and a shielding agent that mitigated oxidation in the carbon network at high temperatures. Scanning Electron Microscopy (SEM) images indicated the presence of discontinuous graphite stripes formed owing to the strong etching of Cl− ions in the molten salt mixture. The sample prepared at 700 °C had the largest surface area of 2721 m2 g−1 and a mesopore volume of 0.87 cm3 g−1, and this material exhibited a Cs of 346 F g−1 at 1.0 A g−1 and retained 98.59% of the initial capacitance after 30![[thin space (1/6-em)]](https://www.rsc.org/images/entities/char_2009.gif) 000 cycles at 5.0 A g−1.54
000 cycles at 5.0 A g−1.54
2.2 Engineering biomass into activated carbon
BDAC is broadly synthesized by a two-step process involving carbonization and activation. Differing sub-processes are usually employed to manipulate parameters like the carbonization and activation temperature, heating rate, residence time, activating agents, impregnation ratio, impregnation time, and heteroatom dopant to different degrees. Fig. 1 represents the important processes and sub-process modifications involved in the synthesis of BDAC. | ||
| Fig. 1 A detailed protocol on crafting high-performance BDACs. | ||
A single-step chemical activation combines the carbonization (pyrolysis) and activation steps. The biomass precursor is directly impregnated in the chemical activating agents via cleavage of the aryl-ether bonds and the release of volatile by-products that leave pores in the carbon skeleton.55 Higher activation temperatures may lead to high surface areas and pore volumes, but exceeding the limits has been reported to cause pore collapse. This is due to the decomposition of carbon at high temperatures and the rapid release of volatile molecules that had been a part of the pore structure. Another major cause of pore collapse is high heating rates; slower rates permit a more controlled release of volatile gases and can reduce pore collapse.52
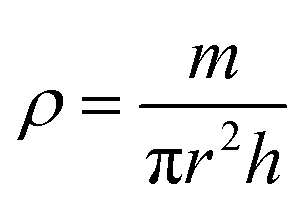
BDAC synthesized via one-step activation typically has low packing density and yield (the latter is mitigated by ensuring proper deoxygenation during the activation protocols56). The electrode packing density can be calculated using the following eqn (1),
 | (1) |
In dual-step activation, carbonization followed by activation enhances the carbon content and decreases the ratio of oxygen to carbon. During the activation step, fewer oxidizing gases escape from the carbon structure, leading to the formation of a controlled porous network.58,59
2.3 Critical factors in BDAC synthesis
Swelling-assisted synthesis for biomass cellulose is another strategy to produce HPAC. Using this pre-treatment, HPAC was produced from cotton by soaking it in NaOH/urea solution. This was followed by a carbonization process that resulted in swelling of the cellulose, which significantly destroyed its inter and intra-hydrogen molecular bonding, thus reducing the degree of polymerisation and increasing the surface area of the resultant HPAC. This is attributed to multiple reasons in studies that detail the mechanism of cellulose degradation, such as the ability of Na+ ions to infiltrate easily into cellulose owing to the low ionic radius of and high charge density, the tendency of the urea hydrates formed during the dissolution process to prevent cellulose chains from approaching each other and hence retaining their dispersed state, and the electron lone pairs that facilitate solvent ion exchange interactions.61,62 In biomass precursors with significant proportions of lignin in addition to cellulose, however, H3PO4 is the molecule of choice as it can cause effective degradation through the formation of pyrophosphates that are highly corrosive and oxidizing, thereby maximizing pore formation.63
Broadly, chemical activating agents can be categorized as alkaline (KOH, NaOH), acidic (H2SO4, H3PO4), oxidizing (H2O2, KMnO4, K2FeO4) and salts (K2CO3, FeCl3, FeCl2, KHCO3, ZnCl2).63 KOH is a suitable activating agent since it is eco-friendly relative to other activating agents and can also develop good porosity along with a narrow pore size distribution. The possible functional groups found on the surface of BDAC post-KOH activation are aromatic rings, primary alcohols, phenols, aldehydes, and carboxylic acids. The presence of surface functional heteroatomic groups, such as nitrogen (N2), oxygen (O2), and sulfur (S), can enhance the surface hydrophilicity, especially in aqueous electrolytes, thereby promoting charge transfer at the electrode/electrolyte interface. The KOH-to-biomass ratio is also a key factor in deciding the PSD.65
The activation process of BDAC using KOH is preferred as the activating agent is similar to an electrolyte. Therefore, the pore size of the electrode material becomes comparable to the ionic radius of the electrolyte ions, facilitating enhanced charge storage and transfer processes.65,66 Additionally, KOH removes lignin and hemicellulose components partially from the base biomass, intercalates into the carbon lattice, and acts as an electron donor, enhancing the gasification reaction (as shown in eqn (2)–(8)) that is responsible for the generation of pores within the carbon matrix.67 In these reactions, the consumption of carbon by O2 is catalyzed by the alkali metal, producing carbon monoxide and carbon dioxide. The detailed mechanism of pore formation during KOH activation is yet to be unravelled. Based on insights from published research, the following reactions elucidate the possible pathways of KOH activation.68,69 To begin with, at 400 °C, KOH dehydrates to K2O. Then water interacts with the carbon to produce CO, which further reacts with water and produces hydrogen (H2) and CO2. A reaction between K2O and CO2 takes place to form K2CO3.70,71
| 2KOH → K2O + H2O | (2) |
| C + H2O → CO + H2 | (3) |
| CO + H2O → CO2 + H2 | (4) |
| CO2 + K2O → K2CO3 | (5) |
A secondary reaction also happens to produce metallic K and K2CO3.
| 6KOH + C → 2K + 3H2 + 2K2CO3 | (6) |
As temperature increases to 700 °C, K2CO3 is decomposed to K2O and CO2 which is further reduced to CO.
| K2CO3 → K2O + CO2 | (7) |
| CO2 + C → 2CO | (8) |
The gaseous by-products of KOH decomposition, such as H2O, CO, and CO2, formed during the etching of the carbon matrix create varying degrees of porosity on and within the BDAC surface. Hence, two processes happen during the production of activated carbon via KOH activation. The reduction of hydroxides to produce free metallic potassium ions (K+), their penetration into the carbon lattice to form intercalated K+, and the eventual removal of K+ from the carbon matrix results in the creation and expansion of the pore network, improving the surface area and porosity. During KOH decomposition, O2 and O2-containing groups (such as H2O, CO, and CO2) chemically etch the carbon, introducing detrimental defects and disorder in the carbon structure. The existing covalent bonds are broken by the O2-containing compounds, polymerized monomers, and dangling bonds. Notably, while the thrusting process of electrolyte decomposition is facilitated by unpaired electrons, parasitic faradaic reactions also occur at the oxidized carbon sites, which can considerably influence the final morphology.72
The degree of activation depends on the KOH:BDAC weight ratio and the activation temperature,73 of which the latter plays a role in pore formation and increasing the specific surface area. However, pore formation and the increase in specific surface area do not scale with the temperature, and in fact, detrimentally high activation temperatures lead to pore shrinkage and lower yield74 due to increased release of the as-formed volatile aromatic molecules that readily escape from the carbonized char.75 The pore size of a BDAC material must be comparable to the size of the solvated electrolyte ions, along with a high specific surface area and narrow size distribution, which can be achieved by using BDAC precursors that have high cellulose and low lignin content.59 Micropores often lead to a significant fall in Pd as they elevate the equivalent series resistance (ESR), particularly in organic and ionic liquid electrolytes that offer high working voltage windows and hence can enhance charge migration better than those with lower working voltages. Furthermore, the electrolyte species can easily be accommodated in the micropore volume, limiting the operating potential and Ed. Mesopores can store more ions than micropores, as the ESR brought on by the desolvation process may cancel out, resulting in good rate capability. Nevertheless, excessively large mesopores can reduce the specific surface area of the BDAC, directly correlating with the electric double-layer capacitance (EDLC) performance. Hence, an effective way to boost reversible capacity and raise rate capability is by narrowing the PSD since it greatly reduces undesired ion scattering and improves the kinetics of the electrode reactions.76
CaCl2 is another chemical activating agent that has been used for the production of nitrogen-rich porous three-dimensional AC (3D-NPC) from sugarcane bagasse via a single-step activation in the presence of urea, which acts as an expanding agent and N2 source.77 In another work, cotton-stalk-based BDAC with an interconnected hierarchical porous structure with balanced mesopores and micropores was realised by a simultaneous activation strategy using KMnO4 and KOH. The intense interaction between KMnO4 and lignocellulose led to bond breakage at the ether aldehyde and hydroxyl groups to modify their architecture, resulting in two distinct pore size distributions, viz. 0.5–2 nm and 4–20 nm, with a mean pore width of 3.5 nm.78
ZnCl2 treatment has been proven effective for banana fibres, yielding a surface area of 1097 m2 g−1, which exceeds those of KOH-treated samples. As ZnCl2 has a melting point (275 °C) lower than that of KOH (360 °C), it may more easily penetrate the carbon matrix. The dehydrating property of ZnCl2 plays a crucial role in the activation process, promoting the formation of a more developed carbon structure. Due to the presence of an incomplete electron orbital, the Zn atom is positively charged and readily attracts the lone pair of electrons on the O2 atom of the hydroxyl group. The key to removing moisture lies in the interaction of ZnCl2 with the carbon matrix, which weakens the bonds between the H2 and O2 atoms within the hydroxyl groups, making it easier to remove water molecules from the biomass. The dehydrating effect not only removes water but also promotes the formation of a more aromatic carbon structure by eliminating O-containing functional groups, which causes reshuffling of the carbon atoms and remaining H2 atoms within the carbon matrix. This results in denser cyclic structures, with alternating single and double bonds between the carbon atoms.79 However, a significant drawback of using ZnCl2 is that it necessitates the elimination of metal chloride residues in the post-activation step. Moreover, the yield of ZnCl2-treated BDAC is low compared with KOH treatment because it burns off a large amount of carbon during the activation process.
Among heteroatoms, N is widely used as a doping agent in carbon matrixes because of its easy integration into the carbon structure and higher electronegativity than those of carbon and hydrogen atoms.82 Pyridinic and pyrrolic nitrogen from the resulting N-containing functional groups stimulate a positive charge on the adjacent carbon atoms, increasing the number of electroactive sites on the surface of the carbon material to adsorb more solvated ions and promote electrode wettability.83 N doping in a carbon skeleton will also lead to the formation of defects that further elevate the number of active sites.84 N-doped carbon can be synthesized by incorporating nitrogen-containing precursors, such as urea, melamine, polypyrrole, and polyaniline, through in situ doping. These N-rich compounds are directly activated by the carbonaceous material or through ex situ doping, that is, the N source is introduced after the activation process, i.e., during the thermal process. While in situ doping offers a more direct approach, it often results in a lower concentration of oxygenated nitrogen functional groups due to the need for higher activation temperatures as thermodynamics favour endothermic molecule/phase/morphology-forming reactions in tandem with the reactions responsible for doping.
Single-step carbonization of nitrogen-doped honeycomb-like porous carbon (NPC-K) sourced from dumpling flour using KOH as an activating agent and urea as the N2 source led to a high surface area of 2856.3 m2 g−1 alongside a high Cs of 311 F g−1.83
Urea can serve as a low-cost nitrogen source and provide a more compact carbon structure than other sources. Cellulose-derived N-doped porous carbon was produced using urea at various molar ratios with respect to H2O. The surface area decreased from 552 to 450 m2 g−1 with increasing urea concentration. Nitrogen and carbon elements in urea lead to pore shrinkage and decrease the surface area. However, N-doped porous carbon with 3.61% N content exhibited higher Cs (179 F g−1) than N2-free porous carbon (129 F g−1). This led to the conclusion that nitrogen functional groups significantly increase the Cs even with a lower surface area by providing a hydrophilic environment and increasing wettability.85
Three different N-containing molecules (NH4Cl, (NH4)2CO3, and urea) were employed as porogens and dopants to prepare N-doped hierarchical porous carbon materials from camellia pollen. Since urea has the highest nitrogen content, it was theorized to produce the highest Cs of 300 F g−1 at 1 A g−1. This indicates that N-containing species and O2 species on the surface of the carbon framework contribute chiefly to pseudocapacitance response. Based on this, urea can be considered an excellent porogen and N2-dopant because it resulted in the best Ed to the tune of 14.3 W h kg−1 in the symmetrical configuration.86 For the preparation of orange peel-derived BDAC via KOH activation, melamine was incorporated as the nitrogen source. When N-doped carbon was mixed with KOH for further activation at an impregnation ratio of 1:2, the melamine-doped material achieved the highest surface area of 1577 m2 g−1.87
Theoretical models have been employed to delve deeper into N-doping mechanics in carbon-based SCs. A prediction of synergistic interactions of the anions (BF4−) and cations (TEA+) of an organic electrolyte (tetraethyl ammonium tetrafluoroborate) with various carbon surface constructions, including pristine carbon surface, pyrrolic N-modified carbon surface, graphitic N-modified carbon surface, and pyridine N-modified carbon surface, was confirmed based on the observation that N-doping alters the electron distribution within the carbon structure. It creates more electron-rich or electron-deficient regions near the doping sites, leading to an increase in the overall dipole moment. For anions, the adsorption energy increased from the pristine surface (−41.1 kJ mol−1) to the pyridinic N-modified surface (−66.6 kJ mol−1), and for cations, the adsorption energy increased from the pristine surface (−13.3 kJ mol−1) to the pyridinic N2-modified surface (−85.5 kJ mol−1). These findings demonstrate that doped N significantly interacts with the carbon surface and the electrolyte.88
In situ self-activation has recently emerged as an attractive method of producing porous biomass carbon. Without an extrinsic activating agent, cellulose-rich sources can be transformed directly into activated carbon, for example, by the etching effect of CO2, H2, and H2O emissions when higher carbonization temperatures (>600 °C) are employed. N-doped micro-porous carbon from celery has thus been prepared via one-step in situ self-activation using this approach, and the etching effect facilitated the development of micropores, leading to a hierarchical porous structure.89
Similarly, O is also an attractive heteroatom dopant to improve hydrophilicity in BDAC with hydrophobic properties that impede interactions between the electrode material and the cations and anions of the electrolyte.90
![[double bond, length as m-dash]](https://www.rsc.org/images/entities/char_e001.gif) O) of hemicellulose and lignin were removed, while the C–O groups in the cellulose component increased, as evidenced by the increasing hydroxyl (–OH) and ester (C–O–C) group concentrations. This led to the highest structural defect (ID/IG = 0.98) proportion compared with other impregnation durations, reducing the crystallinity of cellulose and promoting the hierarchical porous network. Notably, excessive impregnation durations (48 h) in the activating agent resulted in a decrease in micropore volume due to pore collapse, which detrimentally influenced the capacitive behaviour despite a minor increase in mesopore volume (10–40 nm).91 Crucially, this was attributed to the loss of interconnectivity between the pores after pore collapse, which reverses the expected enhancement in capacitive behaviour due to an increase in mesopore volume. This proves that the impregnation time can be tuned to tailor the structural and surface properties of BDAC and, importantly, pore interconnectivity.
O) of hemicellulose and lignin were removed, while the C–O groups in the cellulose component increased, as evidenced by the increasing hydroxyl (–OH) and ester (C–O–C) group concentrations. This led to the highest structural defect (ID/IG = 0.98) proportion compared with other impregnation durations, reducing the crystallinity of cellulose and promoting the hierarchical porous network. Notably, excessive impregnation durations (48 h) in the activating agent resulted in a decrease in micropore volume due to pore collapse, which detrimentally influenced the capacitive behaviour despite a minor increase in mesopore volume (10–40 nm).91 Crucially, this was attributed to the loss of interconnectivity between the pores after pore collapse, which reverses the expected enhancement in capacitive behaviour due to an increase in mesopore volume. This proves that the impregnation time can be tuned to tailor the structural and surface properties of BDAC and, importantly, pore interconnectivity.The following section discusses the characterization of synthesized BDAC, after which a subset of BDAC, namely PSAC for SC applications, has been reviewed.
2.4 Impact of key characteristic on BDAC: a path to better SC
Key factors that contribute to the enhancement of the SC behaviour of BDAC are: the selection of biomass precursors rich in carbon content and low in ash content to enhance conductivity; careful selection of chemical (KOH, ZnCl2) or physical (CO2, steam) activating agents to achieve a high density of active sites for ion adsorption; careful control of the activation temperature and residence time to achieve a high specific surface area and favorable porous structure, for example, a 3D interconnected structure with a balanced proportion of meso, micro and macropores that can facilitate faster ion kinetics; modifying the surface with functional groups (in the carbon exoskeleton) and heteroatoms in the lattice to generate redox active sites, enhance wettability and improve electrolyte penetration into the pores; introduction of conductive polymers or metal oxides into the carbon network for better enhancement of capacitance, energy density, and power density. Proper washing and drying are necessary to remove impurities and chemical residuals and ensure the stability of the activated carbon.3 Unravelling the internal structure of BDAC
In the subsequent segments, we summarise the major characterisation tools and techniques that reveal the internal structure and performance metrics of BDAC, including but not limited to the morphology, porosity, and electrical metrics, as well as the lattice-level organization, which manifest significantly differently depending on the source of the BDAC.3.1 Thermal analyses
Thermogravimetric analysis (TGA) and differential scanning calorimetry (DSC) can thoroughly analyse the thermal properties of the raw biomass sample and/or the BDAC.92 TGA helps identify the temperature ranges at which biomass components, such as cellulose, hemicellulose, and lignin, decompose. This helps in tuning the carbonization temperature and heating rate to achieve the required porosity levels and surface areas in the final BDAC. For example, rice husk-derived activated carbon materials prepared at different activating temperatures were characterized by TG-DTA in the temperature range of 80 to 650 °C, as illustrated in Fig. 2a. The carboxyl and lactonic groups present on the surface of the activated carbon led to the initial weight loss at around 350 °C. A more drastic weight loss was observed in the temperature range of 350 to 620 °C due to the oxidation of carbon, as represented by the exothermic peak at 550 °C in the DTA curves. After 620 °C, no weight loss was observed, and the cumulative weight loss in all samples was more significant than 93%.93 The TGA-DTG data of rice husk-derived activated carbon tested in an O2 environment at a heating rate of 10 °C min−1 are displayed in Fig. 2b. The curves show that 45% of the sample was lost in the temperature range of 30–166 °C due to moisture evaporation, and release of organic volatile components, and a second weight loss at 166–358 °C was due to the removal of cellulose and hemicellulose. Between 357 °C and 920 °C, the final weight loss (37.60%) occurred due to the decomposition of the lignin component.94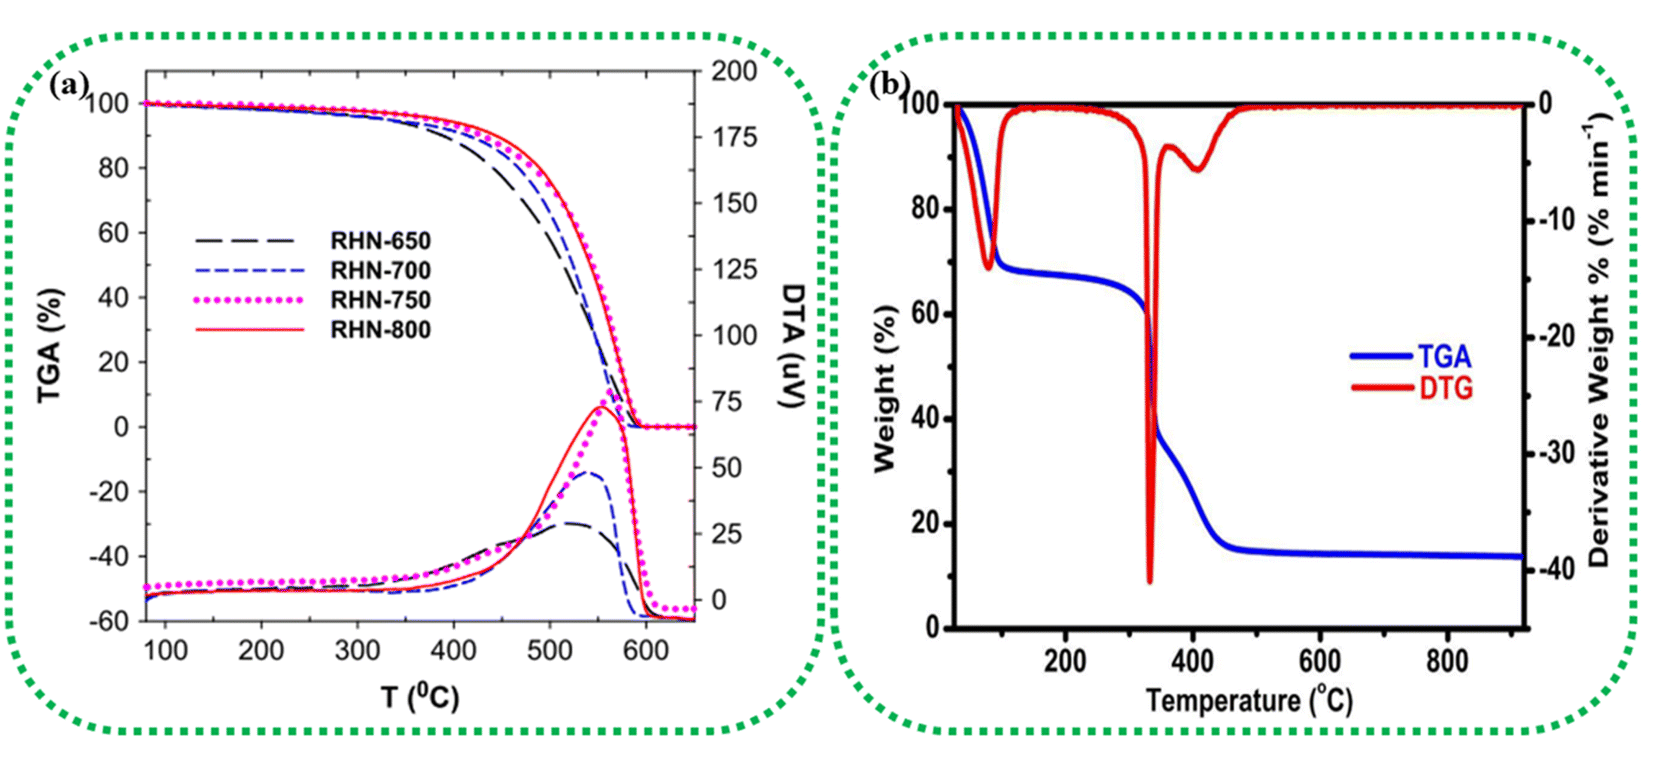 | ||
| Fig. 2 (a) TGA/DTA analysis of pinewood-derived activated carbon using different activating agents, such as H3PO4, KOH, and H2O2, and heat-only treatments. Reprinted with permission from ref. 93, copyright 2014, Elsevier. (b) TGA/DTG analysis of activated carbon prepared from rice husk at 850 °C under an O2 atmosphere. Reprinted with permission from ref. 94, copyright 2016, Elsevier. | ||
An okra powder sample exhibited three stages of weight loss due to the evaporation of water content, thermal decomposition of lignocellulose, and combustion in the final stage, at which the TGA curve stabilized because of the gradual decomposition of the residual sample into ash and carbon. From these results, the pyrolysis temperature was determined to be 600 °C. Two endothermic DSC peaks were observed at 319.8 °C and 542.8 °C, revealing the decomposition of its common functional groups, including carboxylic acids, alcohols, and esters.95
3.2 X-ray diffraction (XRD)
XRD gives information about the amorphous/crystalline structure, graphitic composition, lattice strains, modifications, etc.96 Typically, a broad peak at 23° corresponds to the (002) plane and indicates amorphous nature with a small crystalline region, and a narrower peak at 43° corresponds to both the (100) and (101) planes (typically denoted as (10) or (10l)), indicating graphitic nature.97 Diminished intensity and broadening of the peaks, therefore, indicate a decrease in the degree of graphitization of BDAC49 or higher content of amorphous carbon.Generally, strain can originate from microstrain due to grain size effects and defects, such as vacancies, interstitials, dopants, and dislocations. BDAC is largely amorphous and turbostratic, so strain measurement is challenging. However, techniques like the Williamson–Hall method provide a semi-quantitative measure of strain from XRD data.98,99 High defect density in the carbon matrix has been shown to provide abundant active sites for improved EDLC behaviour.100
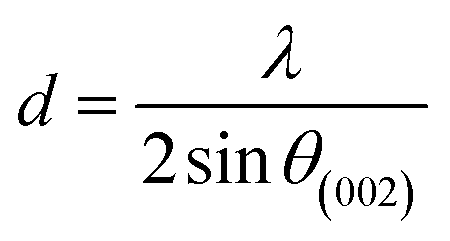
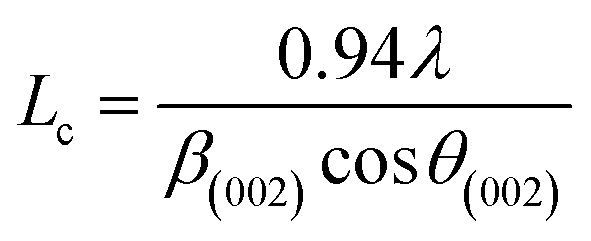
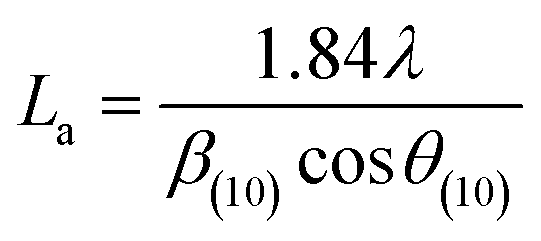
More often than not, the turbostratic (disorganized) BDAC carbon structure consists of sheets of carbon atoms (similar to graphite) stacked randomly and in a periodic fashion. The Braggs law and the Scherer equation hence become relevant, as in eqn (9). An inter-layer spacing (d002) describes the distance between the aromatic layers and N their number as in eqn (10).101 The total height of the stacked aromatic layer (the aromatic layer stacking height (Lc)) is given by eqn (11), and the average crystallite size (La) and number of layers is calculated using eqn (12) & (13).102 The peaks corresponding to the presence of just the single element are usually found at typical locations. One at 23°, which corresponds to a set of (002) planes, is used to calculate Lc and d002, and that at 43°, which corresponds to (10), can be used to deduce La using eqn (9).103–106
|
nλ = 2d002sin(θ002)
| (9) |
 | (10) |
 | (11) |
 | (12) |
 | (13) |
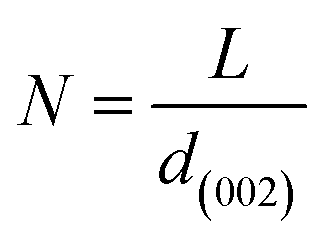
Fig. 3a represents the XRD analysis of orange peel-derived activated carbon (OPAC) subjected to different activation temperatures. As the activation temperature increases from 600 °C to 800 °C, the (002) plane shows a slight shift toward the higher diffraction angles, denoting an increase in the graphitic properties.108 This increase in graphitic nature enhances the electrical conductivity of the BDAC materials, an important inference for designing BDAC synthesis protocols.53
 | ||
| Fig. 3 (a) XRD patterns of OPAC, demonstrating the influence of activation temperatures ranging from 600 °C to 800 °C on peak intensities. Reprinted with permission from ref. 108, copyright 2017, John Wiley and Sons. XRD profiles of (b) hydrochar produced by hydrothermal carbonization (HTC) at varying temperatures (180 °C, 240 °C, and 300 °C) (c) pyrochar produced by the traditional pyrolysis (TP) method at varying temperatures (180 °C, 240 °C, and 300 °C). Reprinted with permission from ref. 109 under a CC-BY-NC-ND. | ||
The (002) and (10) planes linearly weaken with increasing hydrothermal temperature, and this is due to the formation of an aliphatic structure due to the breaking of the polymer chains in the crystalline structure, as seen in Fig. 3b, thus giving compositional insights regarding the BDAC. As an example, the weak diffraction of the asymmetrical peak at (002) for HLH (Huolinhe lignite) is shown in Fig. 3c, which denotes a high proportion of aliphatic structures. In contradiction to this diffraction weakening phenomenon, the peaks of the (002) and (10) planes of pyrochar-derived BDAC linearly strengthen with increasing temperature in Fig. 3c. This can be correlated to polymerization of the oxygen-containing groups by cross-linkage, which offsets the accompanying breakage of the aliphatic structure and creation of free-radical fragments. This aromatization reaction significantly promotes the formation of aromatic units found in pyrochar.102,109
3.3 Fourier transform infrared spectroscopy (FTIR)
FTIR is indispensable for SC research because of its significant merits of being non-destructive, sensitive, quantitative, and cost-effective, which are favorable to elucidating the surface and bulk properties of BDAC.110 Common oxygen-containing functional groups present on BDAC include carboxylic acids (COOH), ketones (CO), ethers (C–O–C), and lactones (cyclic esters), which enhance ion adsorption by wetting the electrode surface. Amines (NH2), pyridinic nitrogen, and amides (CONH2) are examples of N-containing functional groups that can contribute to pseudocapacitance behaviour.
Table 1 depicts the important functional groups in BDAC that are typically analysed using FTIR.
| Source | Peak position (cm−1) | Modes of vibrations | Reference |
|---|---|---|---|
| Willow catkins | 3420 (broad peak) | N–H symmetric stretching vibration or hydrogen-bonded hydroxyl | 111 |
| 2925 & 2854 | Aliphatic C–H stretching vibration (i.e. –CH3 and –CH2 in the alkyl group) | ||
| 1740 | CO stretching (carbonyl, quinone, ester and carboxyl group) |
||
| 1604 | C–H deformation vibration | ||
| 1460 & 1385 | C–N stretching vibration | ||
| 1246 (broad peak) | NH in-plane deformation or CC stretching vibration |
||
| 1162 | C–O vibrations in phenols, ethers, or esters | ||
| Rice husk | 3400–3500 | O–H stretching | 94 |
| 1570–1580 | Aromatic CC bonds |
||
| 1380 (sharp peak) | Traces of nitrate ions | ||
| 1096 | C–O bonds from esters and ethers | ||
| Orange peel | 3700–3100 | O–H stretching vibrations of cellulose, hemicellulose, lignin, pectin, and absorbed water | 112 |
| 3003 | Aliphatic saturated C–H stretching vibrations | ||
| 1722 | CO stretching vibration of carboxyl groups of lignin, cellulose, and hemicellulose |
||
| 1600 (weak peak) | CC stretching vibration of aromatic or benzene rings in lignin |
||
| 1500–1000 | C–O structure (carbonyl, hydroxyl, ester, phenol, ether and methoxy group, carboxylate ion, ash content) | ||
| 1463–1398 | Aliphatic and aromatic groups in the plane deformation vibrations of methoxy, methyl, and methylene groups | ||
| 1300–1000 | C–O stretching vibration of carboxylic acids and alcohols | ||
| 700 and 900 | C–H bending with various degrees of substitution | ||
| Vetch | 3200–3800 | O–H stretching vibration of the hydroxyl group | 113 |
| Oil palm kernel shell | 3418 (broad & strong) | O–H stretching | 114 |
| 2924 & 2848 | Asymmetric & symmetric C–H stretching | ||
| 1748 | Stretching of CO |
||
| 1580 | Stretching mode of CC |
||
| 1386 | Deformation mode of the C–H group | ||
| 1070 | C–O–C stretching mode |
3.4 Raman analysis
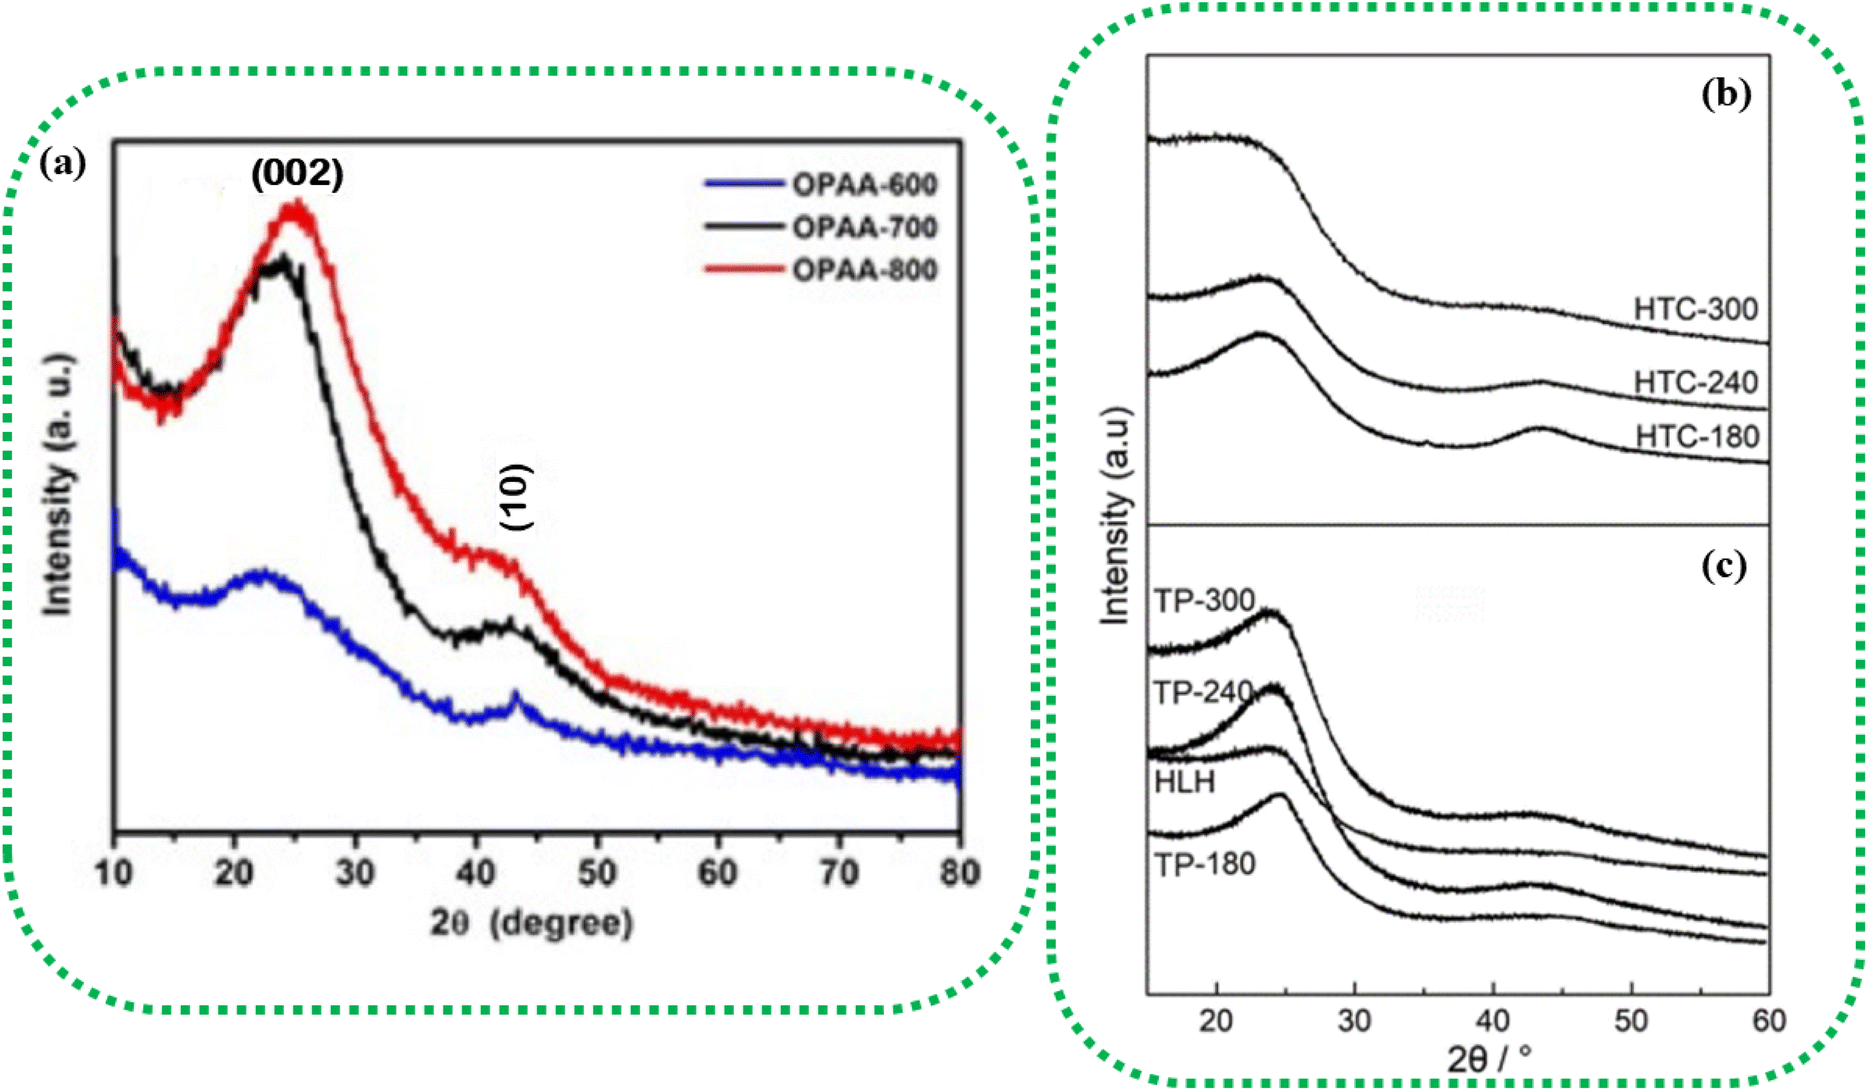
Raman spectroscopy can investigate the molecular structure, crystallinity, textural defects, and graphitization degree of BDAC.115 For BDAC, four characteristic bands in the region of 1800–1000 cm−1 are usually observed. The ratio between the D-band intensity to the G-band intensity (R = ID/IG) denotes the graphitization degree, and the crystallite size (La) is extracted from the reciprocal of the R-value using eqn (14).116 A lower ID/IG indicates a higher graphitization degree and thereby good electrical conductivity, while a higher ratio of ID/IG indicates more amorphisation and correspondingly lower conductivity.65,117
 | (14) |
The D band represents the defect/disorder sites on the BDAC and appears between 1327 and 1360 cm−1, while the G band represents graphitic carbon and appears between 1572 and 1600 cm−1.118–120 The combination of D and G bands indicates multiple defects in the structure.121,122 Apart from these bands, Raman studies can reveal other BDAC signatures, including an I peak that originates from ionic impurities and defects (caused by heteroatom doping or heteroatom adsorption, for example) and a D′ peak arising from in-plane or stacking faults.100
Representative spectra are displayed in Fig. 4(a and b), which are the Raman spectra of switchgrass-derived BDAC with sharper G1 and D2 peaks (indicating winding short basal planes with ordered bond angles) and broader G2 and D2 peaks (arising from the amorphous sp2 cluster with a disordered bond angle).123 Fig. 4c shows the Raman spectrum of lotus-root-derived AC, comprising of D and G bands, which vary based on the different weight ratios of the lotus root powder, activating agent (MgCl2), and urea (N2-doping source), as well as pyrolysis temperature. An increase in the weight ratio of the activating agent and the introduction of N from urea increased the intrinsic defects, whereas, with rising temperature, the ID/IG ratio increased because of an increase in the concentration of MgCl2.124
 | ||
| Fig. 4 Raman spectra of different BDAC derived from (a and b) switchgrass; reprinted with permission from ref. 123, copyright 2020, Elsevier, (c) lotus root; reprinted with permission from ref. 124 copyright (2020), the American Chemical Society, and (d and e) tree bark; reprinted with permission from ref. 125, copyright (2017), Springer. | ||
Fig. 4(d and e) show the Raman spectra of AC from Acacia auriculiformis tree bark with the expected D and G bands. On deconvolution, the D1 peak can be seen originating from the edge of the carbon atom and the edge planes of the graphitic material, which are orthogonal to the single carbon sheets. The D2 peak (attributed to lattice vibrations), D3 peak (arising from amorphous carbon at the interstitial sites), and D4 peak (lattice vibrations from sp2–sp3) are also shown.
Table 2 provides a more comprehensive summary of similar findings from Raman analyses, highlighting the intricate levels of control possible in BDAC materials.
| Source | Activating agent | Temperature (°C) | ID/IG ratio | Degree | Graphitization | Reference |
|---|---|---|---|---|---|---|
| Garlic sprouts | KOH | 800 | 1.05 | — | Highest graphitization | 46 |
| Willow catkins | KOH | 600 | 0.79 | sp2 | Highest graphitization | 111 |
| Bean dregs | KOH | 700 | 1.19 | — | Disordered carbon | 126 |
| Tobacco waste | KOH | 800 | 1.10 | — | Amorphous carbon | 127 |
| Loofah sponge | KOH | 800 | 1.00 | — | Disorder and defects | 128 |
| Palmyra palm flower | KOH | 900 | 0.89 | sp2 | Disorder and defects | 129 |
| Banana peel | Hydrothermal | 200 | 0.84 | — | Highly amorphous | 130 |
| Onion husk | K2CO3 | 800 | 1.01 | — | Disorder and defects | 131 |
| Java plum | CO2 | 700 | 0.99 | sp2, sp3 | Amorphous carbon | 132 |
| Poovan Kottai | CO2 | 700 | 0.99 | sp2 | Ordered graphitic structure with defective sites | 133 |
| Coconut shell | KOH, ammonium persulfate | 700 | 0.79 | — | Highest graphitization | 134 |
From Table 2, it is worth noting that, for SCs, materials having ID/IG ratios between 0.5 and 1.5 are often thought to be promising because conductivity losses and defect concentrations are well-balanced in this range. Values less than 0.5 denote an inadequate number of active sites, whereas values greater than 1.5 indicate high defect concentrations but with limited conductivity.
3.5 SEM
SEM reveals the surface morphology of BDAC, providing key insights into the presence and distribution of pores and their size, shape and connectivity. The size and shape of pores determine the adsorption kinetics and mass transfer properties, which allows the indirect assessment of the impact of BDAC preparation conditions, such as different activating agents, the carbonization/activation temperature, and the mass ratio of the activating agent to raw material, on pore development.Fig. 5a shows the SEM image of an activated sample derived from garlic sprouts after acid pickling. The material displays a hierarchical pore structure that resembles the vascular bundle and remains intact even after activation and acid pickling. Such hierarchical porous structures can effectively boost the electrochemical performance of the resultant electrodes.46
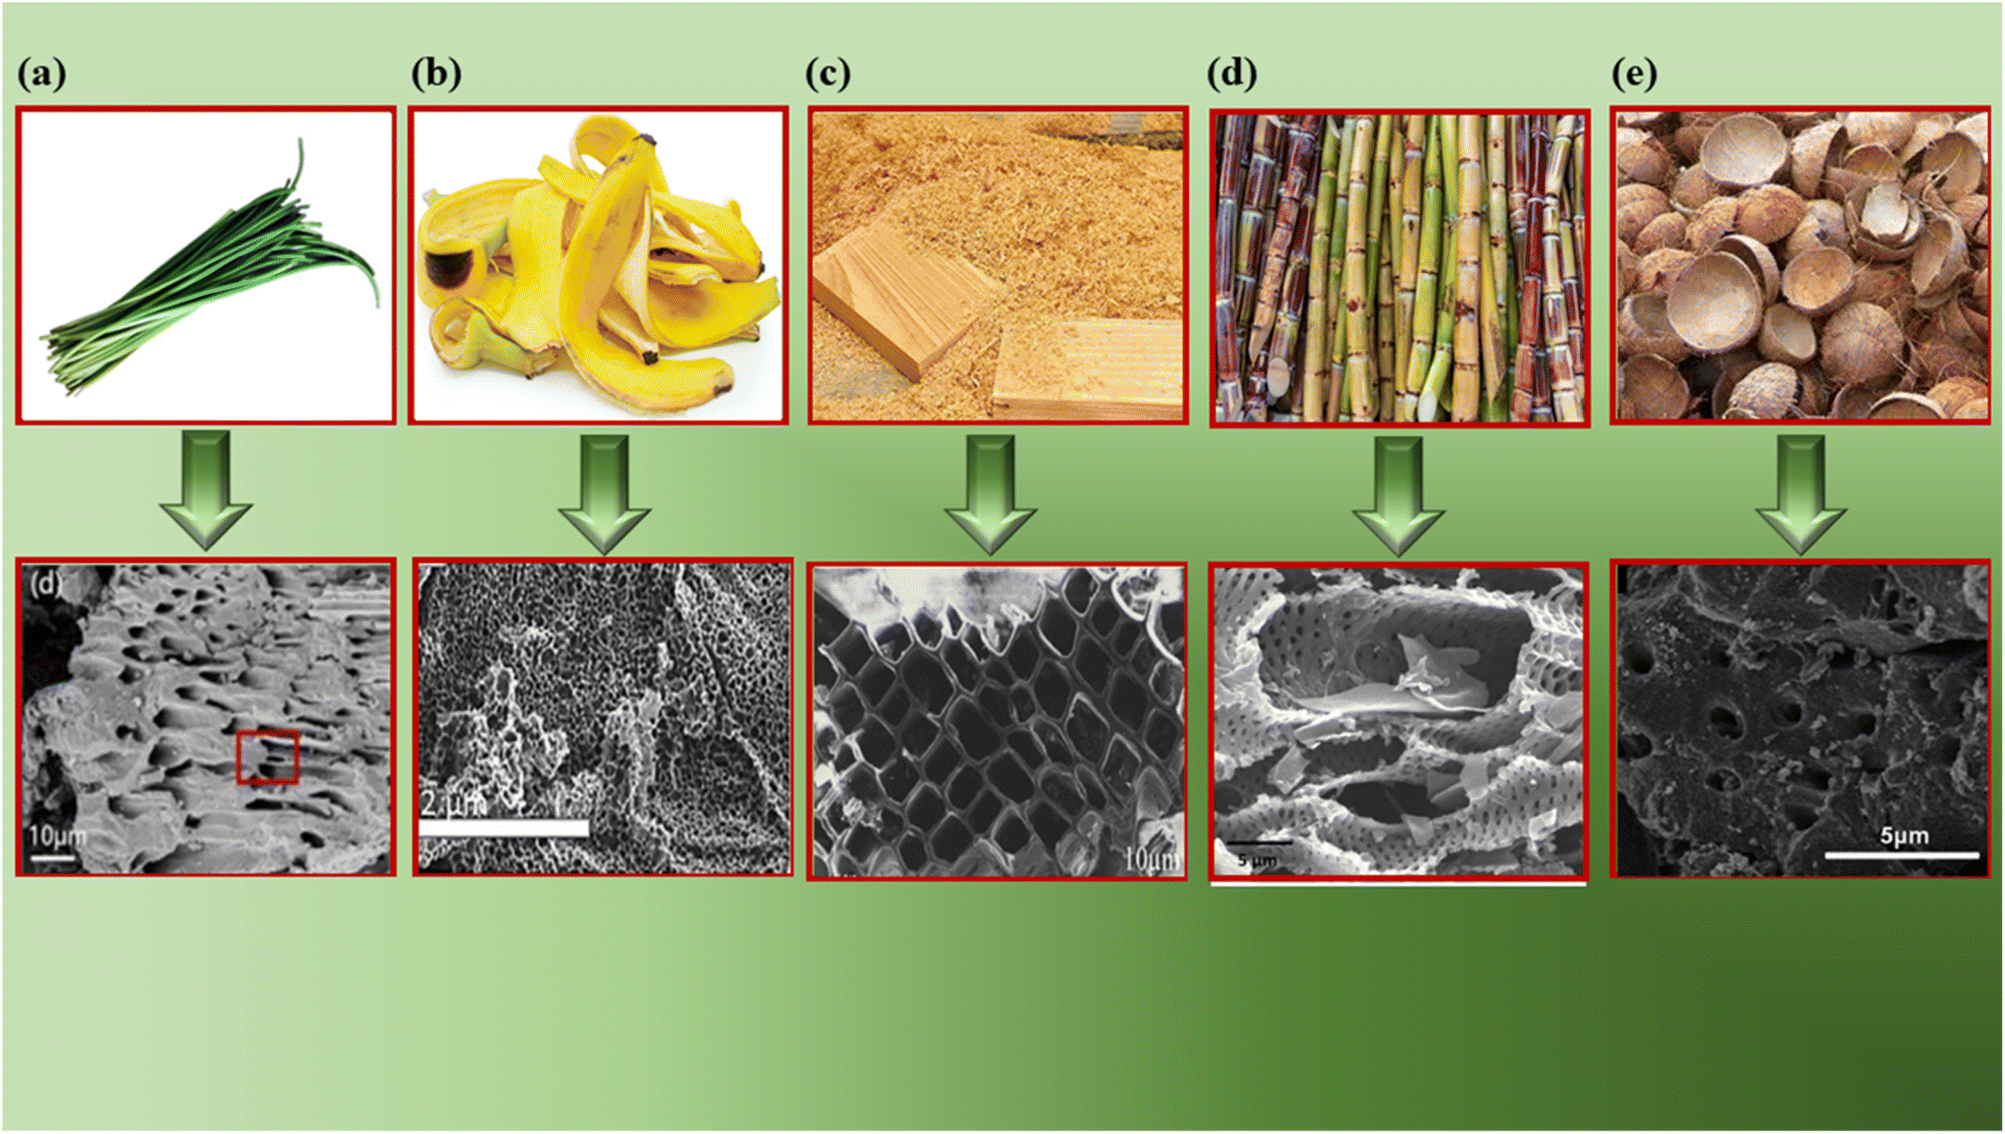 | ||
| Fig. 5 SEM images of different BDAC materials derived from: (a) onion husk (reprinted from ref. 46 under the terms of the Creative Commons CC BY license), (b) banana peel (reprinted with permission from ref. 72 copyright (2020), Elsevier), (c) saw dust (reprinted with permission from ref. 135 copyright (2018), Elsevier), (d) sugarcane bagasse (reprinted with permission from ref. 136 copyright (2018), Elsevier) and (e) coconut shells (reprinted with permission from ref. 137 copyright (2012), the American Chemical Society). | ||
Fig. 5b shows a honeycomb structure of an activated sample derived from the plant cell walls in sawdust.72 Fig. 5c displays a uniform 3D porous structure derived from banana peels activated at 900 °C, with mesopores and micropores.133 Fig. 5d represents a microporous carbon structure with folds and pits derived from sugarcane bagasse. These pores were created using an activation temperature of 600 °C, which leads to the specific volatilization of organic components, along with the action of the activating agent (H3PO4) during impregnation.136 Fig. 5e illustrates activated carbon derived from coconut shells with a non-uniform and rough surface.137
3.6 Transmission electron microscopy/high-resolution transmission electron microscopy (TEM/HRTEM)
TEM enables visualization of the internal structures, such as occupancy of the graphitic domains, dislocations, and other disorders.Fig. 6a demonstrates the activated carbon nanosheets derived from wheat straw; the arrows indicate micropores, and the circles indicate mesopores measuring 3–5 nm.138 Fig. 6b shows a 3D interconnected network structure of activated carbon derived from orange peel, revealing a wrinkled surface at the outer edges along with few-layered graphene-like areas.139 Fig. 6c represents the TEM of corn-cob-derived activated carbon with many interconnected micropores and macropores,140 and Fig. 6d denotes a hierarchical porous structure with disorder present in activated carbon derived from rice husk. The white spots between the disordered carbon layers indicate the existence of micropores and mesopores.141 Fig. 6e is an HRTEM image of activated carbon prepared from pistachio nutshells, showing a highly interconnected pore structure with pore sizes in the 0.5–1 nm range.142 Hence TEM can help de-convolute and corroborate SEM findings, as well as aid in determining the consistent and uniform internal structure of BDAC.
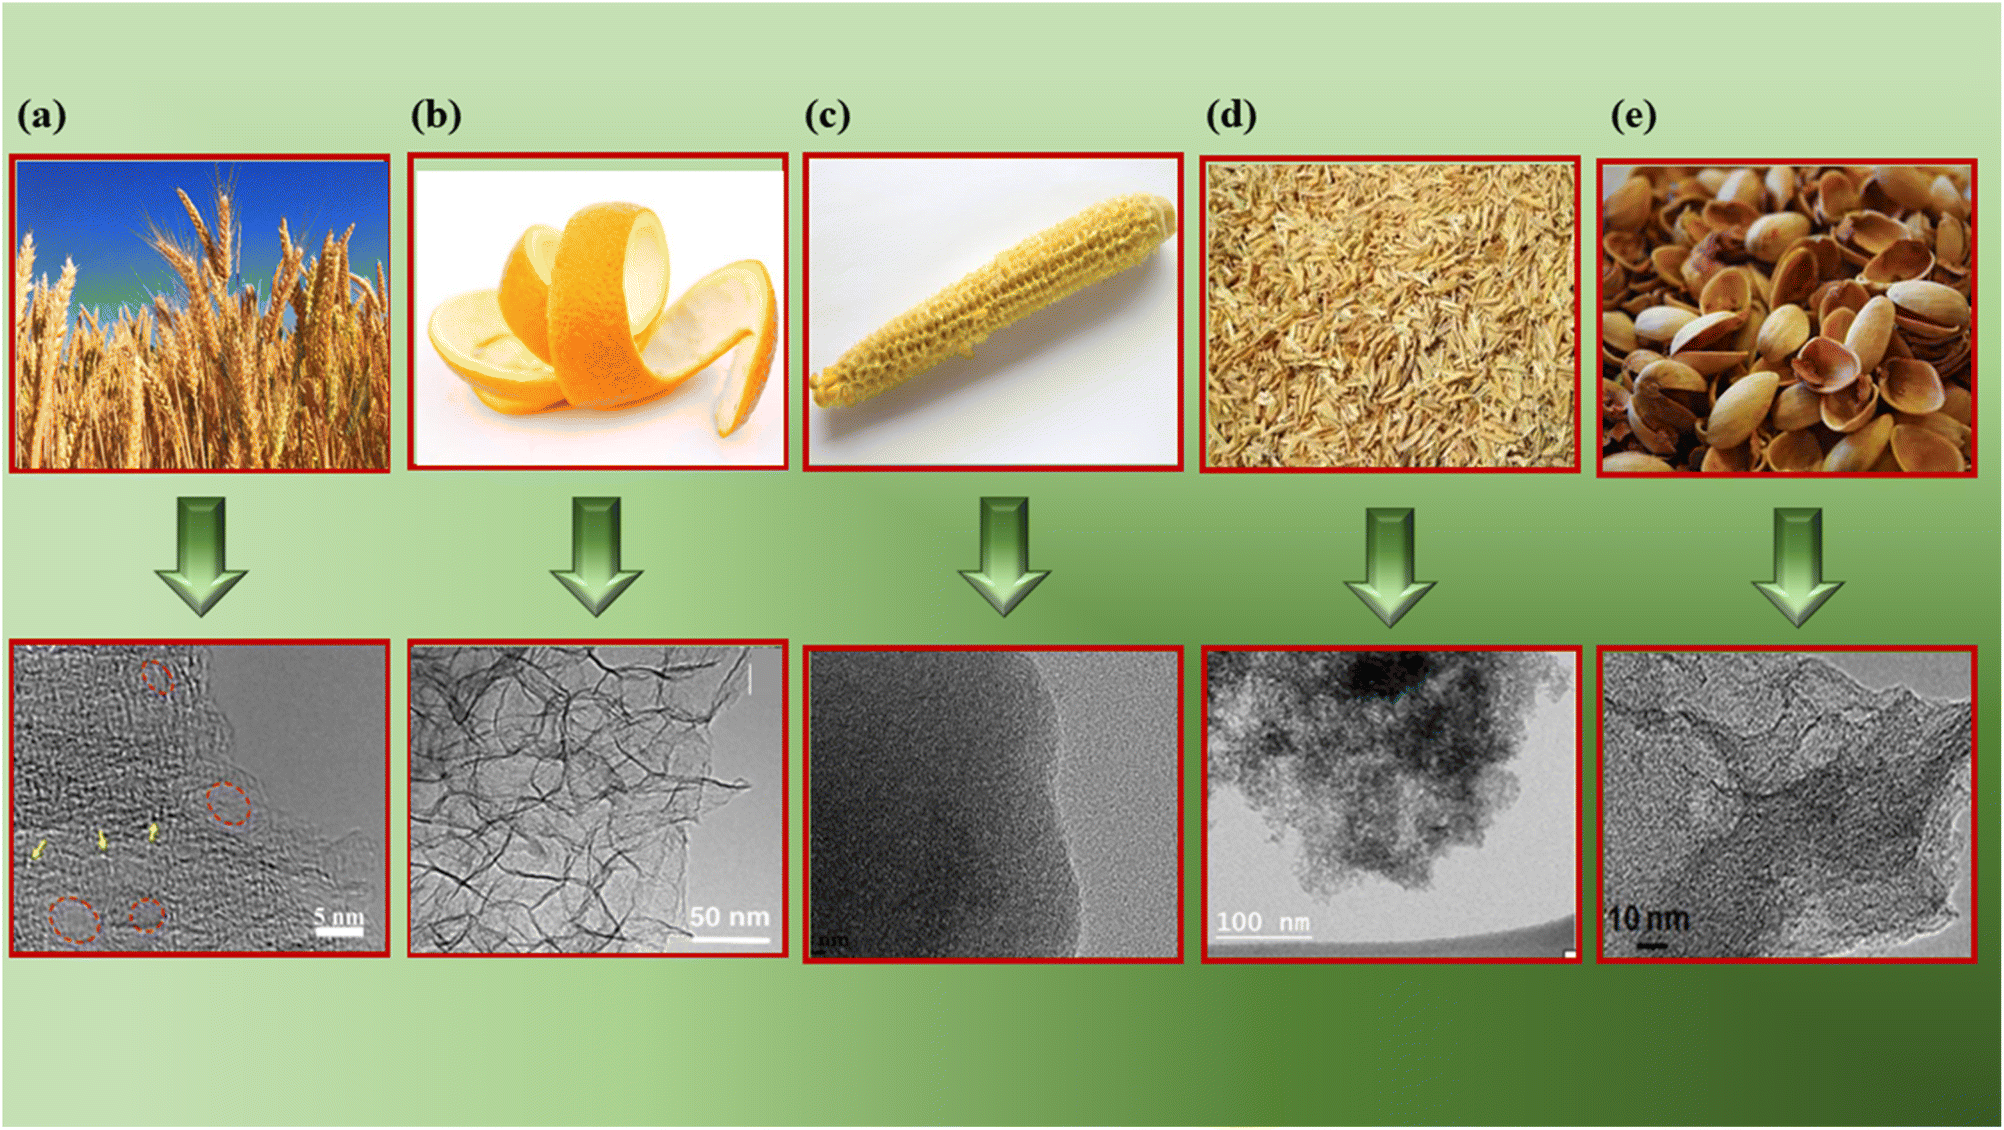 | ||
| Fig. 6 TEM/HRTEM images of various BDAC materials derived from (a) wheat straw (reprinted with permission from ref. 138 copyright (2021), the American Chemical Society), (b) orange peel (reprinted with permission from ref. 139 under a Creative Commons Attribution CC BY 3.0 licence), (c) corn cobs (reprinted with permission from ref. 140 under a Creative Commons Attribution CC BY 3.0 licence), (d) rice husk (reprinted with permission from ref. 141 under a Creative Commons Attribution-Non-commercial 3.0 Unported Licence), and (e) pistachio shells (reprinted with permission from ref. 142 under a Creative Commons Attribution-Non-commercial-No Derivs 4.0 International License). | ||
3.7 The Brunauer–Emmett–Teller (BET) technique
BET is crucial for understanding properties, such as surface area, pore size distribution, type of pores, pore volume, and pore diameter.Of the different types of adsorption isotherms, type I is the Langmuir isotherm, which denotes that adsorption occurs by filling a single monolayer of adsorbate molecules on the adsorbent surface that typically has pores <2 nm.143 Type II and III isotherms indicate strong and weak fluid–solid interactions, respectively, for non-porous or macroporous adsorbents. Type-IV and V isotherms exhibit a palpable hysteresis loop due to capillary condensation, indicating that the adsorbent possesses a mixture of mesoporous and microporous regions. Finally, the type-VI adsorption isotherm usually represents a nonporous and highly uniform surface.
According to IUPAC, the hysteresis loop is classified into four parts: H1, H2, H3, and H4. The adsorption and desorption branches in H1 are parallel and almost vertical over a wide range of relative pressures (P/P0), indicating uniform mesopores. H2 has a sharp desorption branch near the lower pressure limit for adsorption–desorption and is triangular, usually exhibited by materials with complex pore structures and non-uniform pore sizes. As for H3, the desorption branch exhibits a steep slope towards the ultimate stages of loop closure, which indicates macropores, whereas H4 possesses parallel and horizontal branches and is exhibited by micro-mesoporous carbon.144
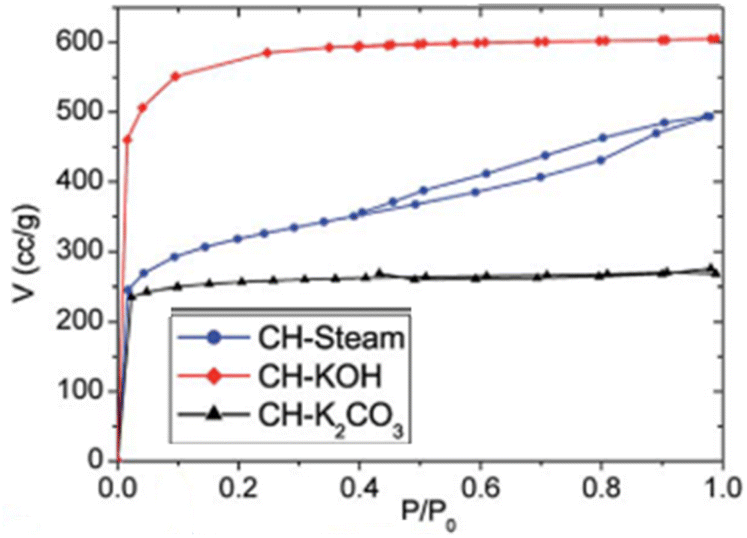
The complex nature of such interpretations establishes that a combination of isotherm types and hysteresis profiles are commonly observed rather than distinct manifestations (as shown in Fig. 7a and b).49,145 Among the few BDAC examples investigated, a type II isotherm with an H4 hysteresis loop indicated the presence of a combination of meso and micropores.42 Likewise, a type IV with an H3 hysteresis loop demonstrates the dominance of micropores, and a type IV with an H4 loop indicates hierarchical porosity with macro, meso, and micropores86,146 manifested by capillary condensation after monolayer–multilayer adsorption. In all BET investigations, the wider the pore size distribution, the higher the adsorbed volume; for instance, a BDAC with a higher number of mesopores correlated with Barrett–Joyner–Halenda (BJH) measurements, which estimated the pore size distributions.117
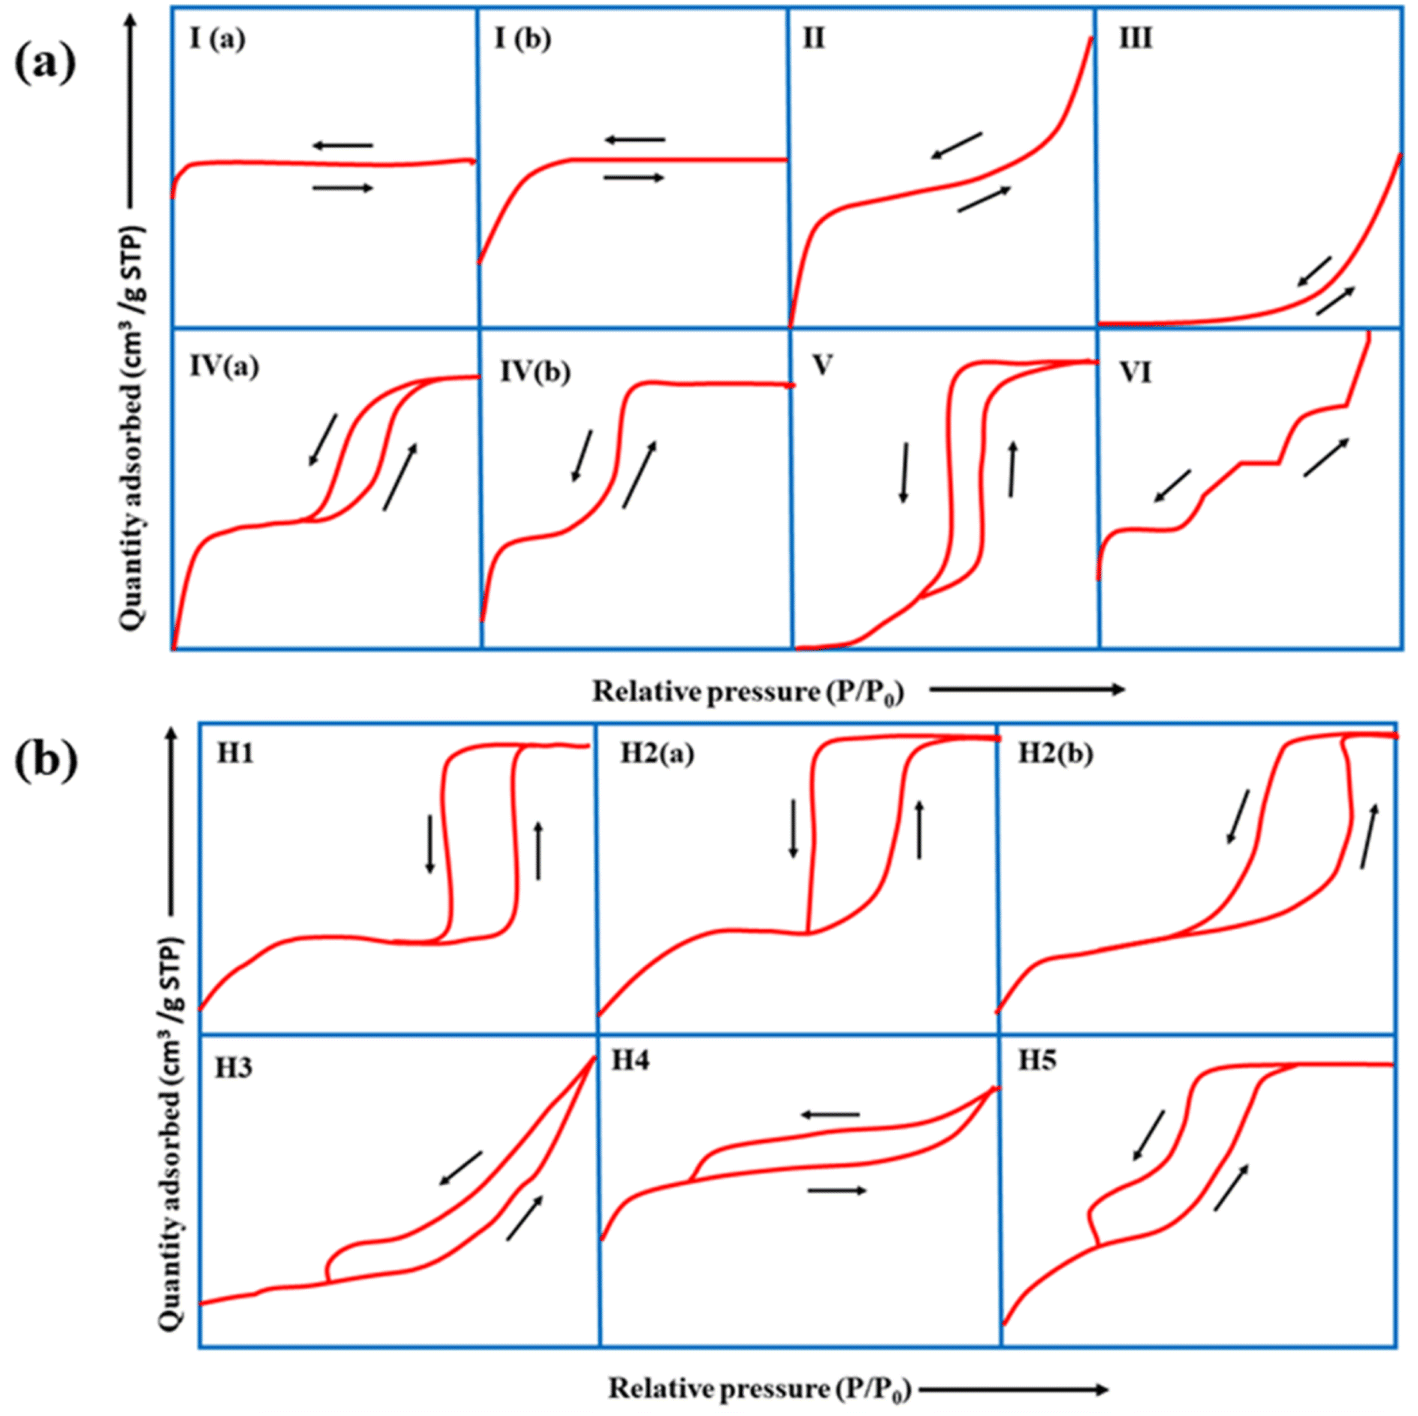 | ||
| Fig. 7 (a) Classification of physisorption isotherms according to IUPAC standards using BET analysis. (b) Types of hysteresis loops as defined by IUPAC standards. | ||
Tables 3 and 4 present an overview of relevant research works, highlighting porosity variations in BDAC, as determined by BET studies.
| N2 isotherm curve | Types of isotherm | Inferences |
|---|---|---|
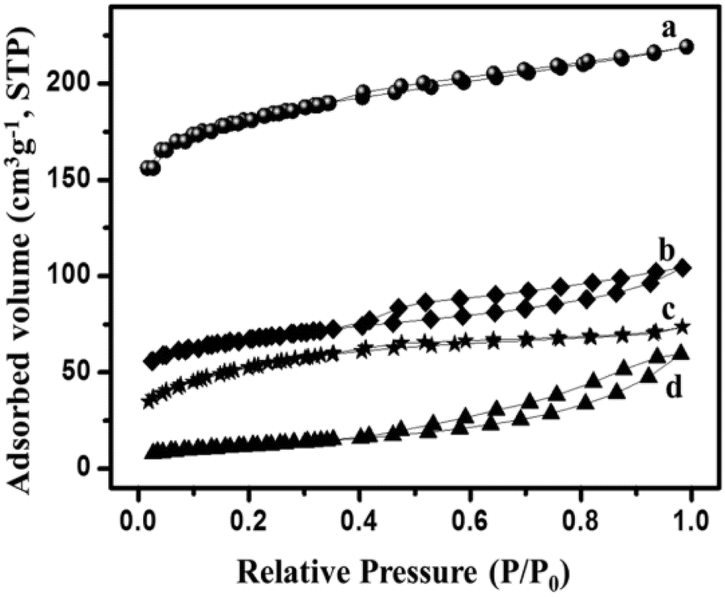 |
Type IV | (a) Microporosity at P/P0 < 0.45 |
| Type IV | (b) Macroporosity at P/P0 = 1 | |
| Type IV | (c) High hysteresis at higher relative pressures (>0.4 P/P0)147 | |
| Type IV, H3 | ||
 |
(a) KOH & K2CO3 – type I | (a) Microporous texture |
| (b) Steam – type IV, H3 | (b) Micro and mesoporous regions are prevalent116 | |
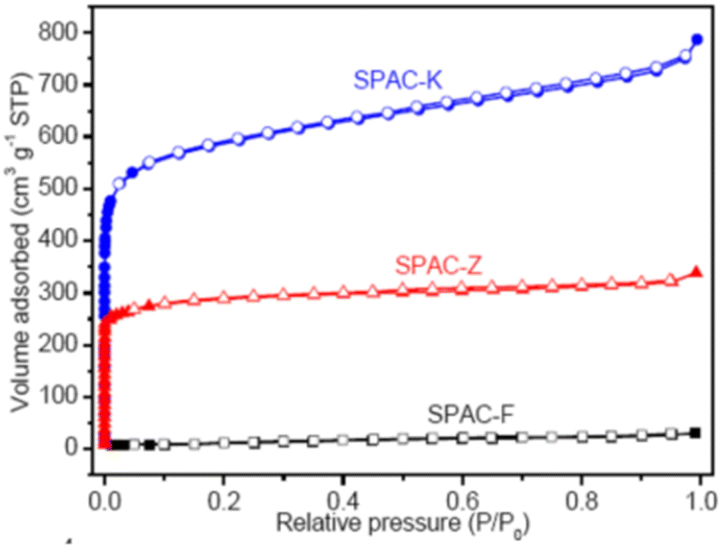 |
(a) SPAC-F – non-porous material without any adsorption | (a) Non-porous material without any N2 adsorption |
| (b) SPAC-Z – type I, H2 loop | (b) 0.4 to 0.7 has mesopores | |
| (c) SPAC-K – hybrid – not conformal to a specific isotherm | (c) 0.1 region reveals micropores. 0.4 to 0.9 with an H2-type hysteresis loop indicates mesopores with different sizes. High relative pressures of 0.9–1.0 indicate macropores148 | |
 |
Type II with H3 hysteresis for all samples | Micropores and mesopores without any adsorption even at high relative pressures125 |
| Source | AA* | Type of isotherm and hysteresis loop | Surface area (m2 g−1) | Ref. |
|---|---|---|---|---|
| a AA*-activating agent. | ||||
| Dragon fruit | KOH, melamine | Type IV with H4 | 2994 | 149 |
| Orange peel | H3PO4 | Type I | 2209.7 | 150 |
| Thespesia populnea seeds | KOH | Type IV | 1000 | 151 |
| Pine cone | KOH | Type II with H4 | 1515 | 152 |
| Banana fibre | ZnCl2 | — | 1097 | |
| Coconut shell | Steam | Type IV | 1559 | 137 |
| Oil palm kernel shell | Steam | — | 730 | 153 |
Through these mainstream characterization tools, the performance capabilities of the myriad BDAC compositions can be universally analysed and benchmarked, aiding the process of continuous property improvement, as displayed in Fig. 8. With these core techniques of material characterization summarised, we delve into the device-level metrics of SCs based on BDACs in the subsequent sections of the review.
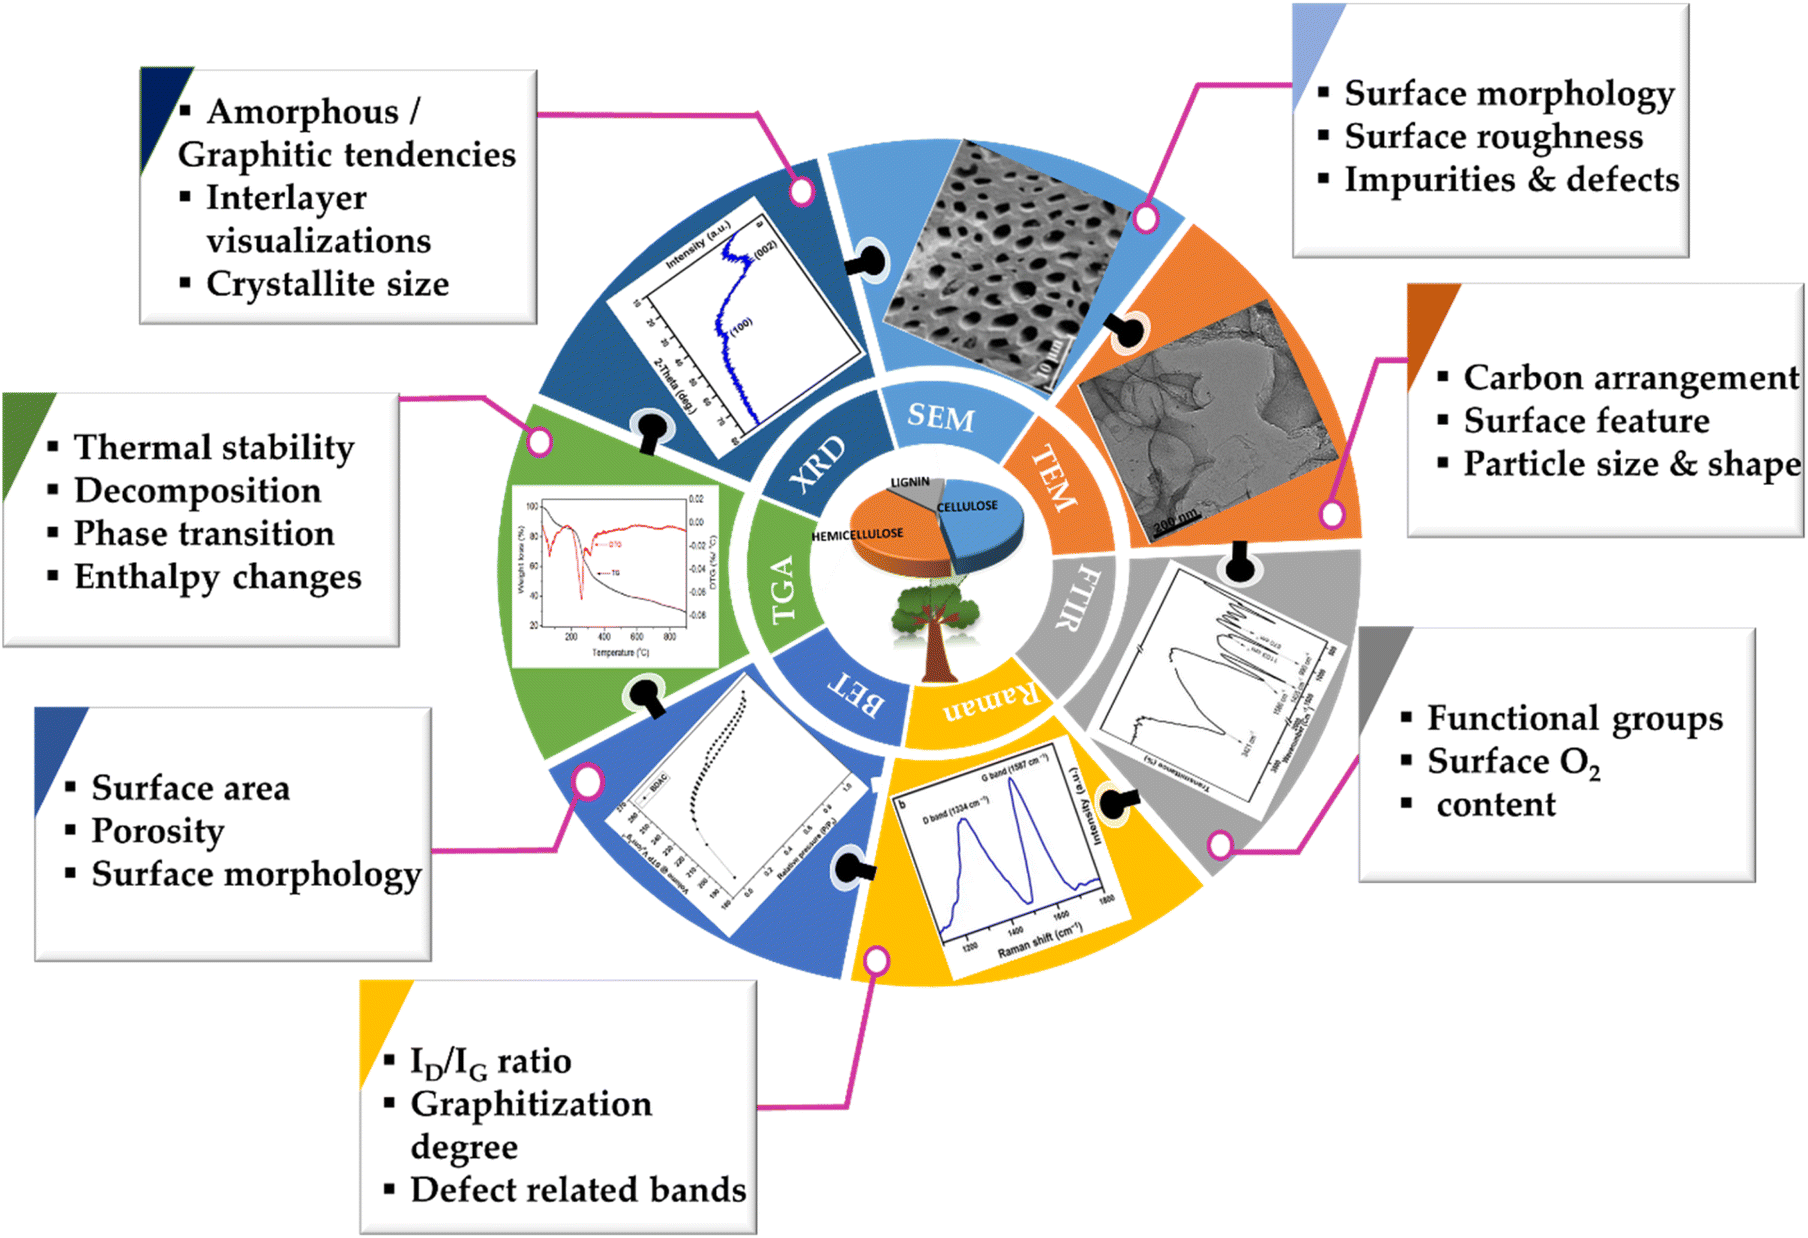 | ||
| Fig. 8 Schematic of multiple techniques used for characterizing BDAC materials. | ||
4 SCs and their characterization
In this part of the review, we discuss the protocols and metrics upon which SCs based on BDAC are constructed and evaluated; this segment is divided broadly into (4.1) generic construction and energy storage mechanisms of SCs and (4.2) the characterization techniques specialized for their evaluation.4.1 Generic principles of SCs
SCs generally store energy based on at least two established mechanisms (with the dominant one being dependent on the electrode material used and the type of configuration of the SC): the adsorption/desorption of ions at the electrode/electrolyte interface (termed as the EDLC mechanism) and charge transfer at the bulk near the surface of the electrode (pseudocapacitance-based).90,154 Fig. 9(a and b) illustrate the fundamental structure of a dielectric capacitor and the corresponding SC.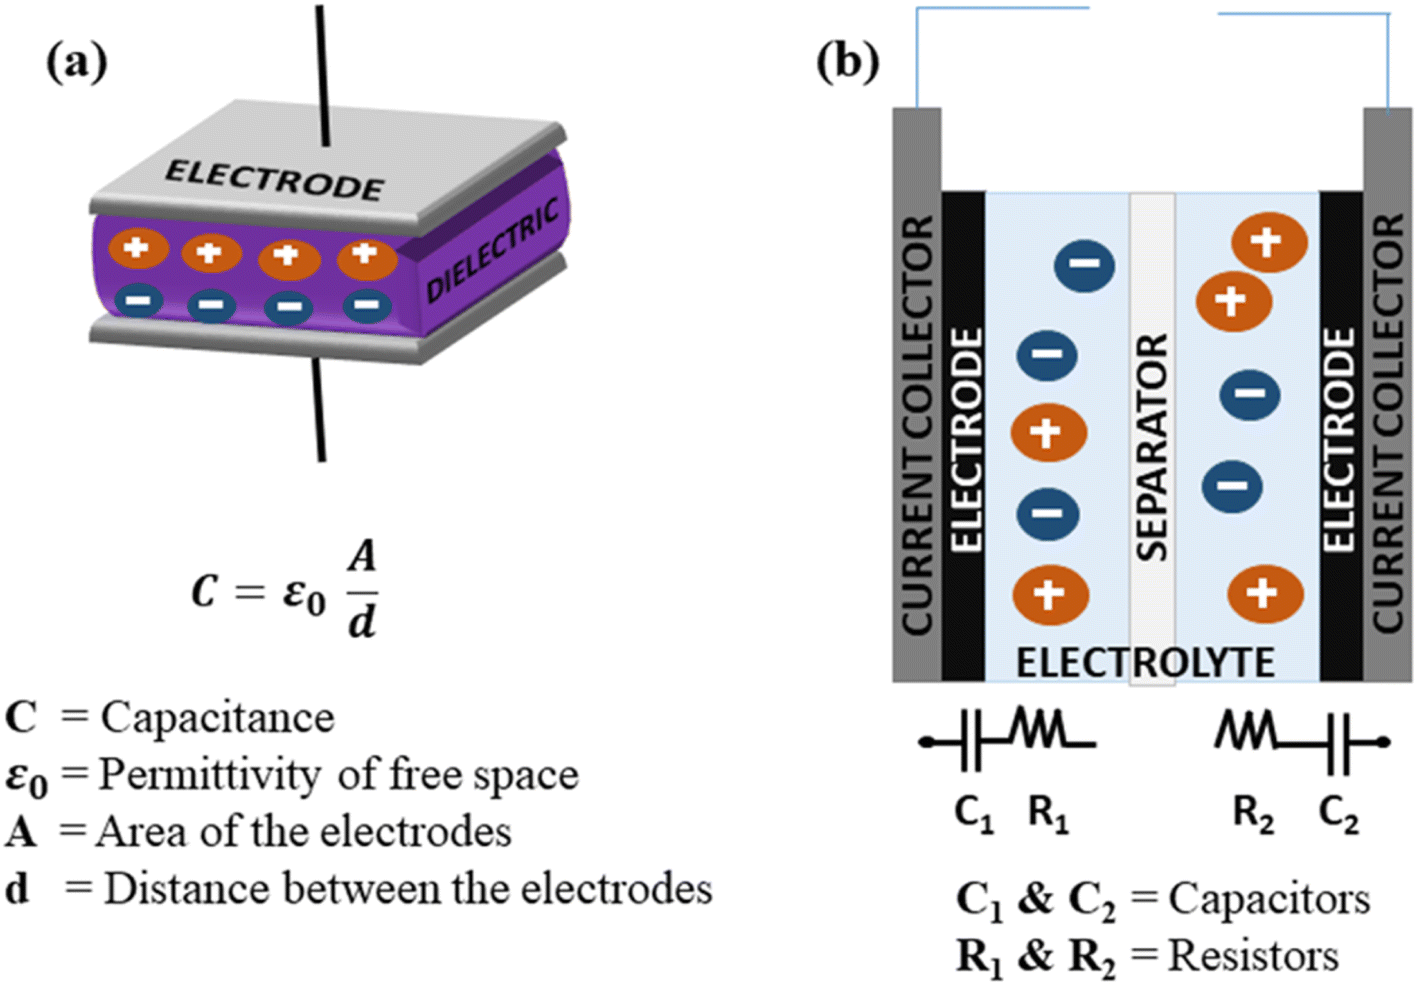 | ||
| Fig. 9 Schematic of the configurations of (a) a dielectric capacitor and (b) an SC component. | ||
An electric double layer is formed at the electrode interface via the physical adsorption of electrolyte ions.155,156 Generally, carbon-based materials like activated carbon, carbon aerogels, carbon nanotubes (CNT), carbide-derived carbons (CDC), and graphene show largely EDLC-based charge storage mechanisms, with little pseudocapacitive behaviour at the surface due to the presence of some O2-containing functional groups. However, their pseudocapacitive contribution is less compared with metal oxides or conducting polymers. Carbon materials also have a lower density of active sites and lack multiple oxidation states, which hinder surface redox reactions within the typically limited potential windows that can enhance pseudocapacitive behaviour. EDLC-based SCs exhibit high Pd and excellent cyclic stability but limited Ed.157
Pseudocapacitance-based storage is dominant in SCs made of metal oxides, conducting polymers, transition metal nitrides, transition metal sulfides, perovskites, etc.158,159 Typically, this behaviour is characterized by redox reactions or reversible faradaic processes that involve electron transfer reactions at the electrode–electrolyte interface.160,161 Unlike battery-type materials, this process does not involve any bulk phase changes during charging/discharging.39 Since metal oxides have many oxidation states, which can be readily accessed to participate in redox reactions even within the limited potential windows, they predominantly exhibit this behaviour in comparison to the EDLC characteristic, resulting in high Ed and higher Cs but low Pd.162,163
Apart from SCs that operate exclusively on either of these mechanisms, hybrid SCs that employ both faradaic (pseudo-capacitance) and non-faradaic (EDLC) based processes to store charge have also been designed. Hence, the advantages include a wide operating voltage window and significant improvement in the Ed and Pd of the electrochemical device.164,165 Fig. 10 shows the mechanisms by which electric charge is stored in an SC.
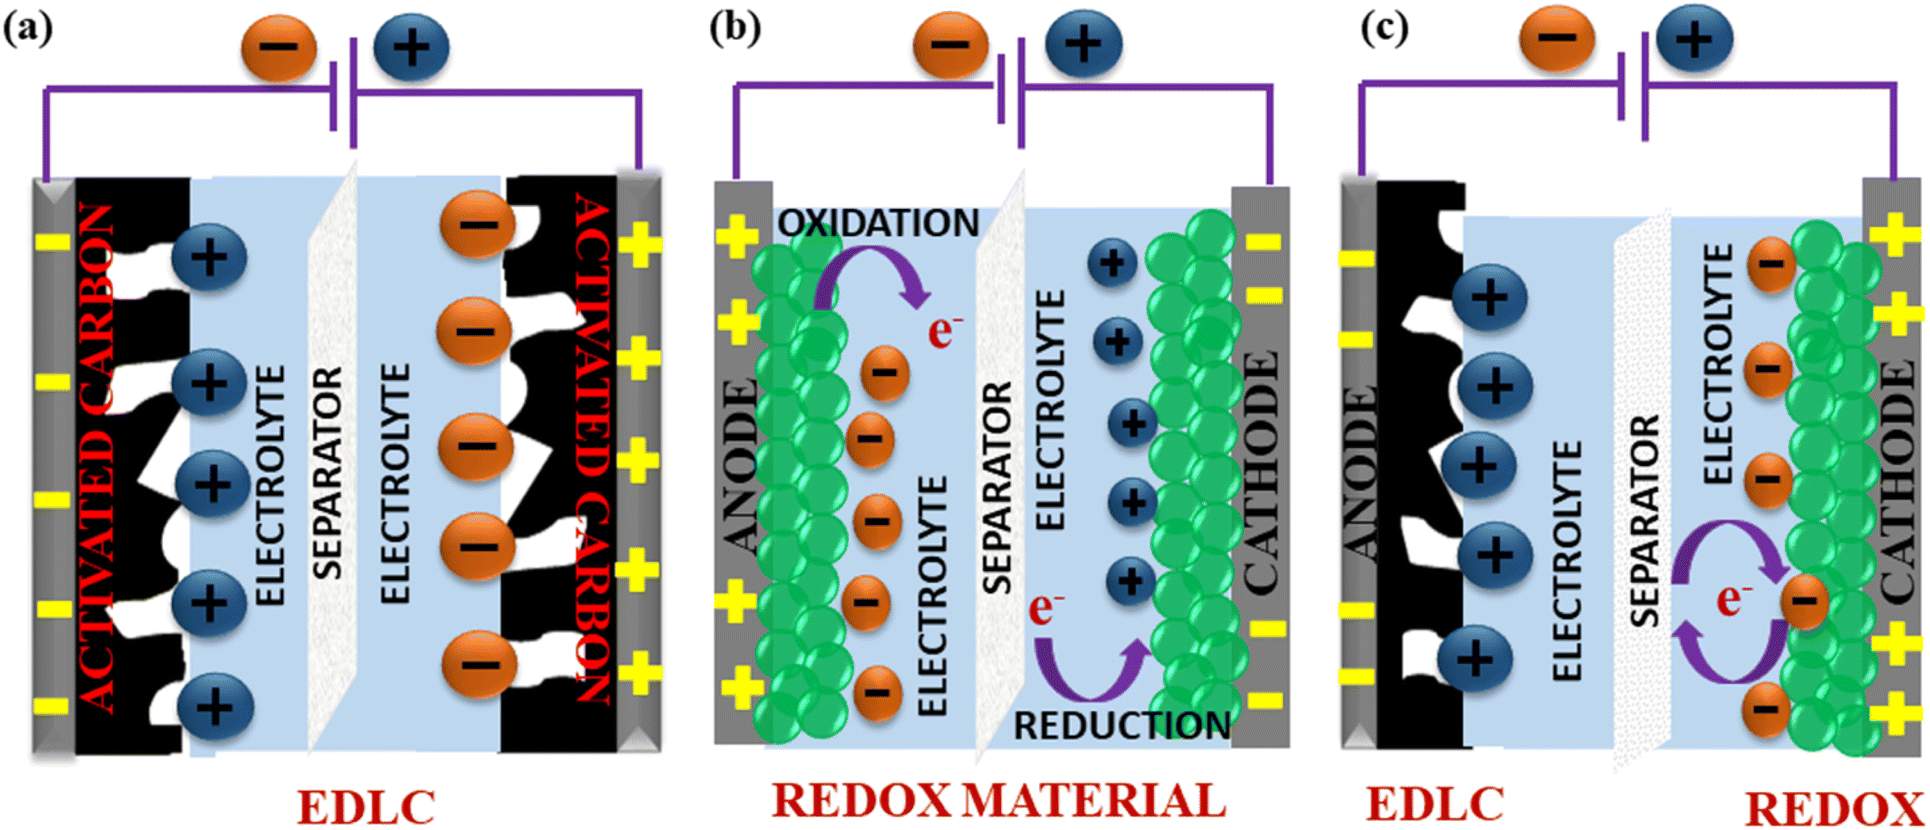 | ||
| Fig. 10 Schematic of the energy storage mechanisms in SCs: (a) EDLC through surface adsorption/desorption, (b) pseudocapacitance based on the surface redox reaction and (c) hybrid SCs with a combination of non-faradaic and faradaic reactions. | ||
4.2 SC evaluations
The elementary understanding of an SC can be obtained using generic metrics like voltage, current, and time via electrochemical studies. These studies can be conducted using the following techniques: Cyclic Voltammetry (CV), galvanostatic charge–discharge (GCD), and Electrochemical Impedance Spectroscopy (EIS), the characteristics profiles of which are illustrated in Fig. 11(a–c). These techniques describe multiple parameters, such as operating potential, Cs, ESR, Pd, Ed, capacitance retention, coulombic efficiency, and rate capability. Herein, we briefly explain the mechanisms and principles based on which these characterization techniques allow the calculation of said parameters.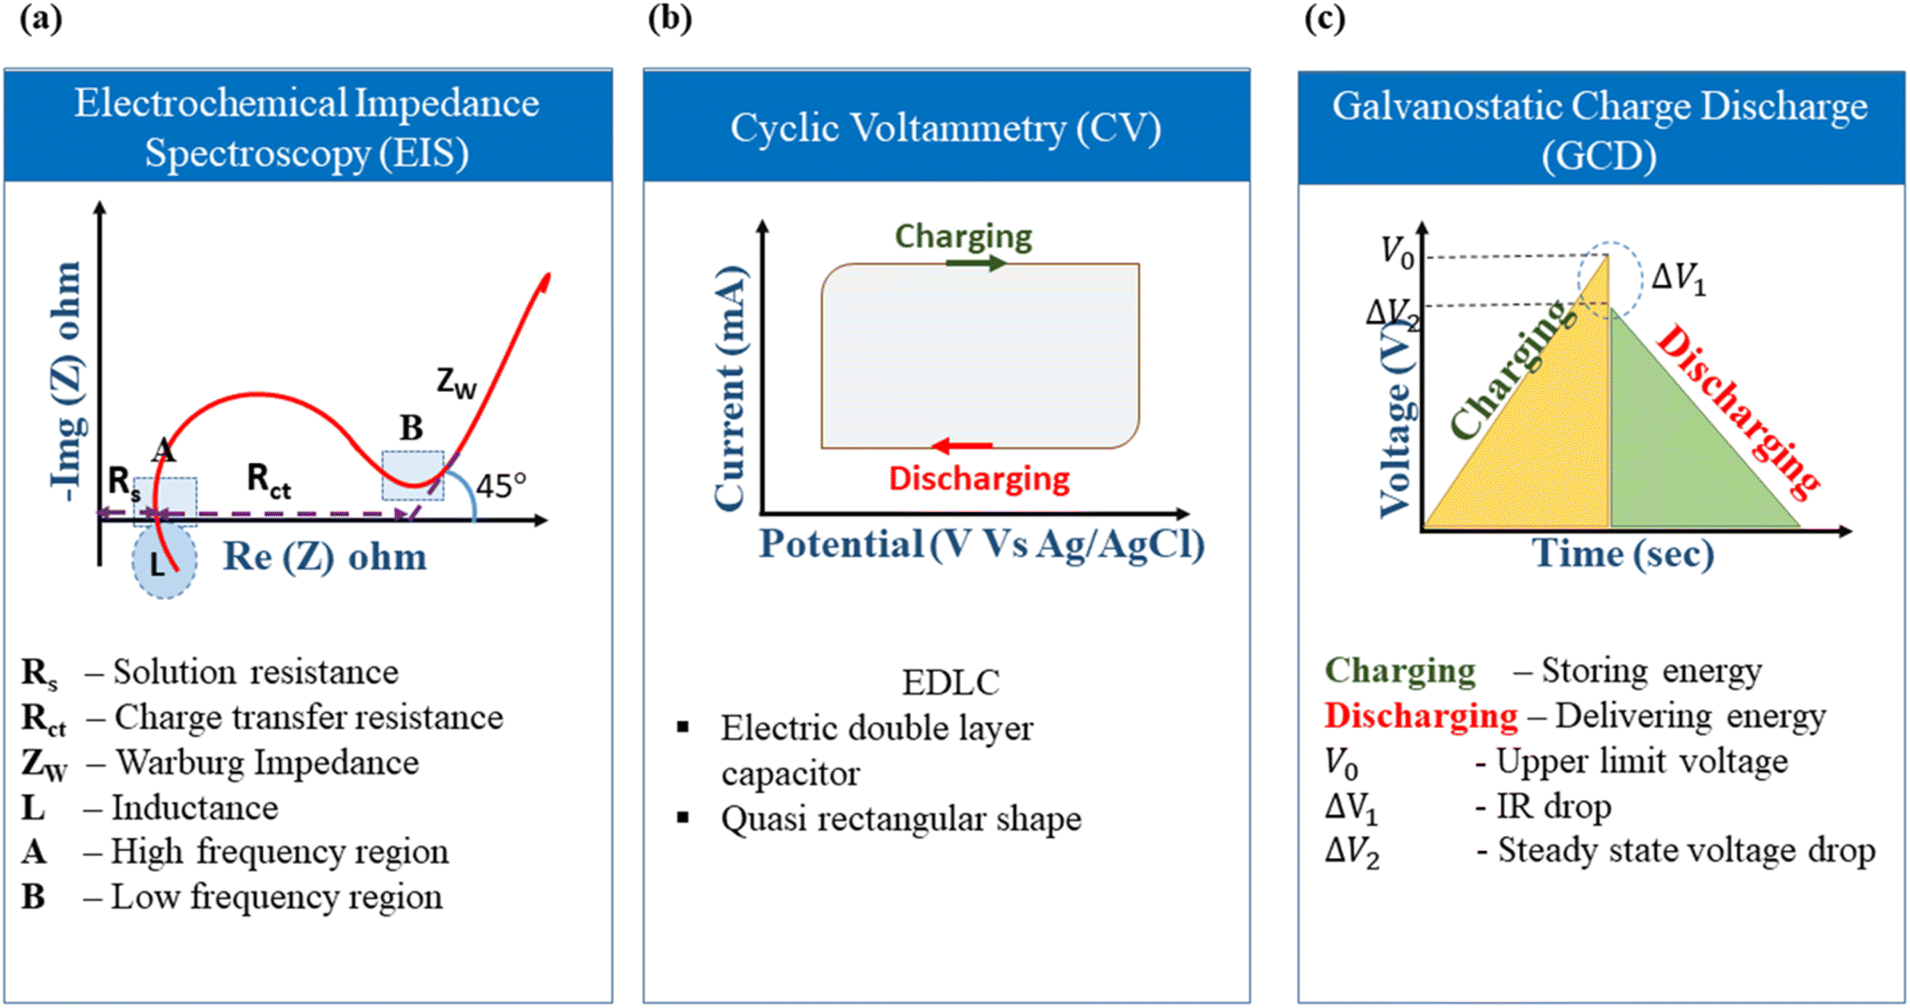 | ||
| Fig. 11 Schematic of electrochemical characterization techniques: (a) EIS (b) CV and (c) GCD. | ||
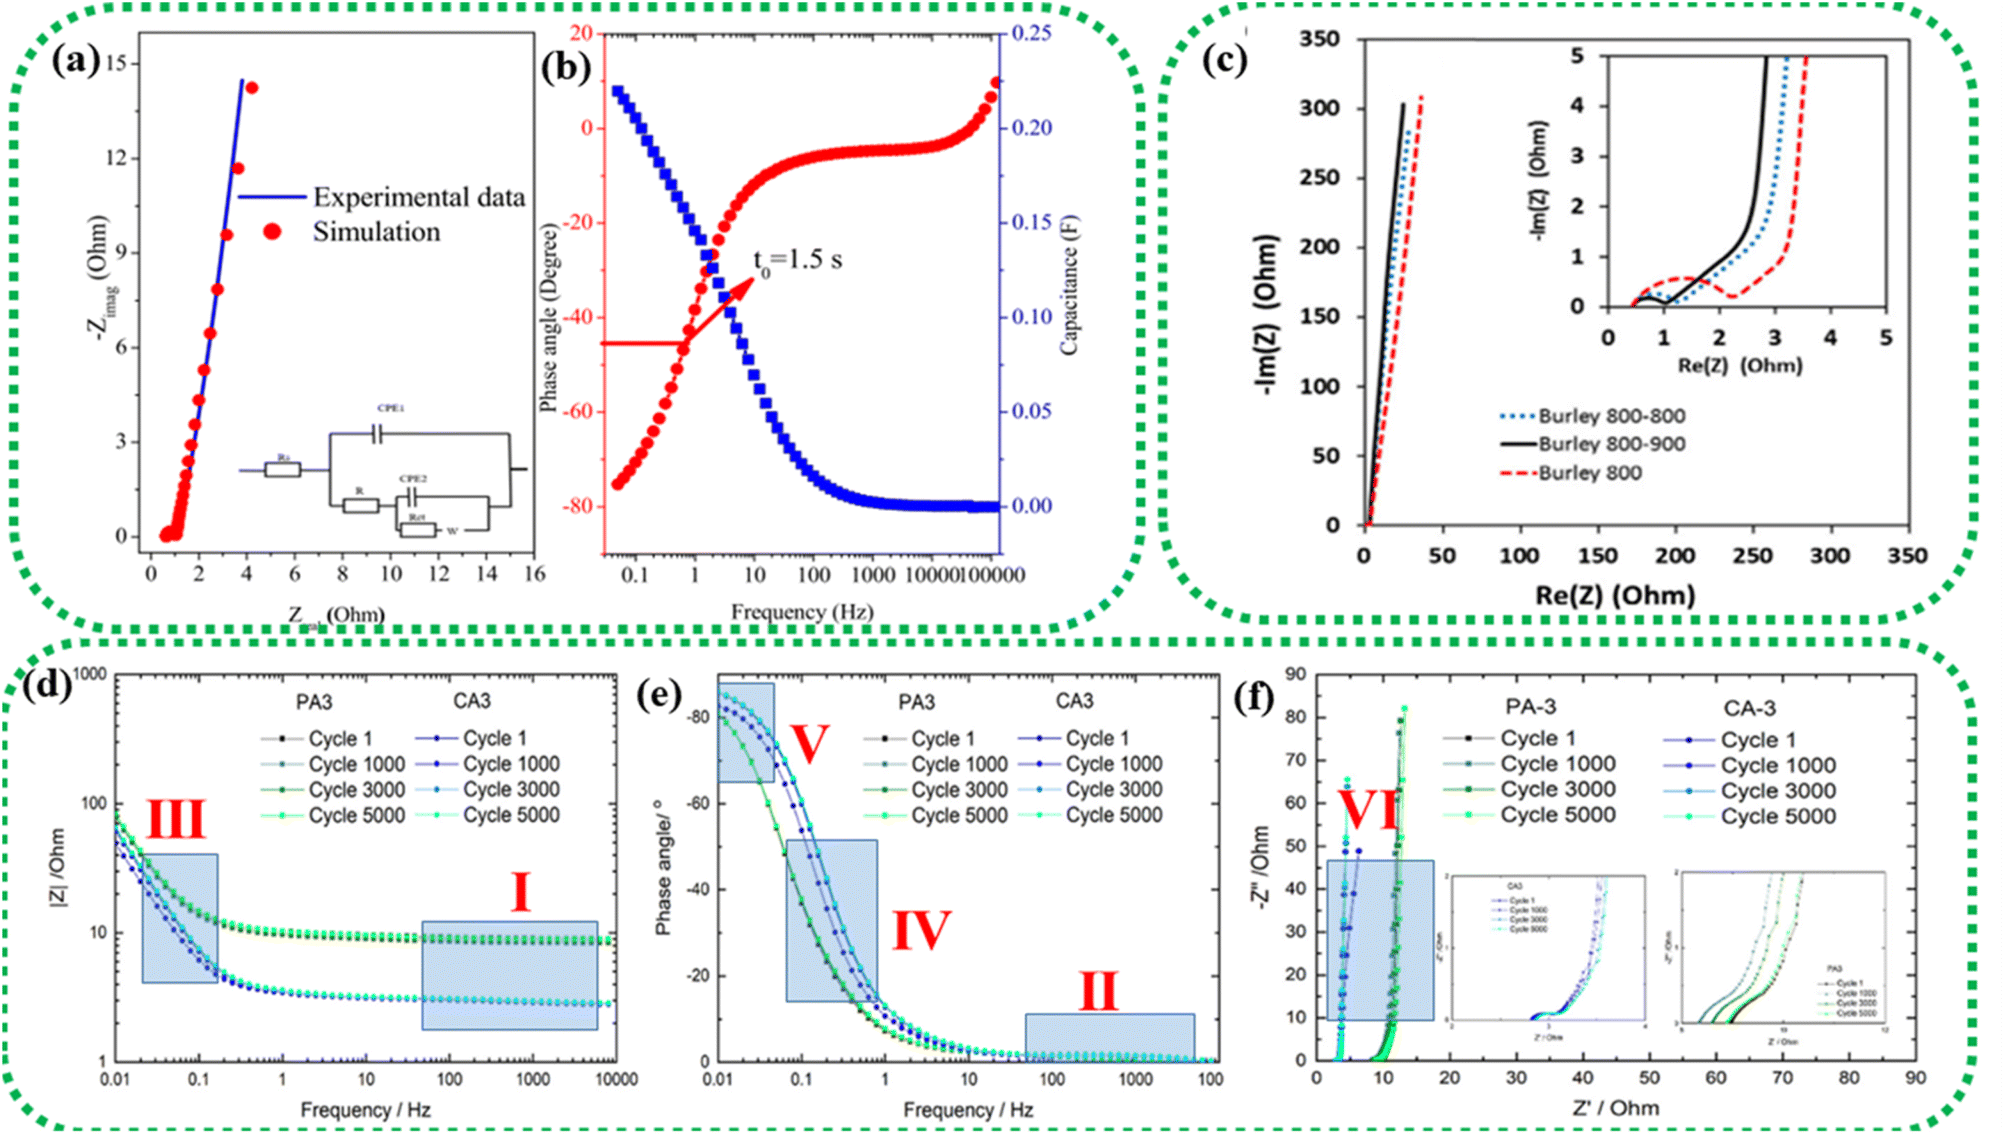 | ||
| Fig. 12 EIS study of an asymmetric device composed of a graphene oxide–polyaniline nanocomposite and AC. (a) Nyquist plot (inset: equivalent circuit model); (b) Bode plot. Reprinted from ref. 172 under the terms and conditions of the Creative Commons Attribution (CC BY 4.0) license. (c) Nyquist plot of two-electrode cells prepared using Burley tobacco-derived AC with different post-treatment temperatures. Reprinted with permission from ref. 173, copyright (2015), Elsevier. EIS characterization of physically (PA) and chemically (CA) activated carbon after 1, 1000, 3000, and 5000 cycles: (d) frequency vs. modulus of impedance graph, (e) Bode plot and (f) Nyquist plot. Reprinted with permission from ref. 174, copyright (2021), Elsevier. | ||
The Nyquist plot in Fig. 12c represents the comparison of Burley tobacco-derived AC prepared without (labelled as Burley 800) and with post-annealing treatment (labelled as Burley 800–800 and Burley 800–900) under an N2 atmosphere.173 It shows a semicircle with an identical ESR value of 0.43 Ω for all ACs. A lower ESR value is typically indicative of a greater concentration of CC bonds, which can promote electron mobility.94 There is also a significant shift in the Rct values, from 1.0 Ω (800–900 °C) to 1.25 Ω (800–800 °C) and 2.2 Ω (800 °C). These graphs denoted that the post-treatment helped remove the remaining surface oxygen functionalities, with an accompanying increment in surface area from 1749 m2 g−1 to 1871 m2 g−1. The Burley 800–900 °C sample showed a relatively lower Rct value of 1.0 Ω, implying optimal conductivity.
The low impedance and phase angle that intercept the Y axis close to 0° are shown in Fig. 12(d and e) as regions I and II, respectively.174 The semicircle in the mid-frequency region denotes the interfacial contact capacitance related to charge accumulation at the electrode/electrolyte interface and Rct arising from both ionic and electronic resistances. The electronic resistance depends on the electrical contact at the interface between the electrode and the current collector, as well as the electrical conductivity of the active electrode material.176–178
The ionic resistance is evaluated by the ionic conductivity at the electrode/electrolyte interface. The phase angle tends to change from 0° to −90° with changes in the modulus of the impedance, as shown in Fig. 12d and e in regions III and IV, respectively. The X-axis intercept in the lower-frequency region of the Nyquist plot indicates the internal resistance (Rint). In this frequency range, the phase angle tends to reach approximately −85°, suggesting capacitive behaviour, as shown in region V of Fig. 12e (for an ideal capacitor the value should be 90°, the non-compliance is because real materials possess internal resistance, which is usually not zero).179,180 This can be identified in the Nyquist plot as a semi-vertical line parallel to the imaginary axis, which is shown as region VI in Fig. 12f. Moreover, the diffusion of solvated ionic species generates additional resistance at the mid-frequency range known as diffusion-controlled resistance Zw. At higher frequencies, the diffusion of solvated ions is very slow, resulting in a small Zw. Zw can be inferred from the Nyquist plot and Bode plot, as denoted by the tilted line with a 45° slope and the phase angle shift of 45° in Fig. 12f. In certain circumstances, a minor inductance (L) behaviour, which may have been brought on by experimental conditions or the internal configuration of the SC, can be present depending also on the cabling and setup,181 as shown in Fig. 11a. Thus, Nyquist plots are generally used for probing resistive behavior, while Bode plots give insights into the capacitive nature of the electrochemical system under study.
The measured EIS data are evaluated to understand each component of the electrochemical system by fitting an equivalent circuit model with electrical components, such as capacitors, resistors, and inductors.182 Rs, Rct, and Cdl form the equivalent circuit model, such as that represented in Fig. 13, which also shows the formation of an EDLC layer at the working electrode/electrolyte interface. The resistor (Rct) and double layer capacitance (Cdl) are connected in parallel, and together they are connected in series to the resistor Rs.
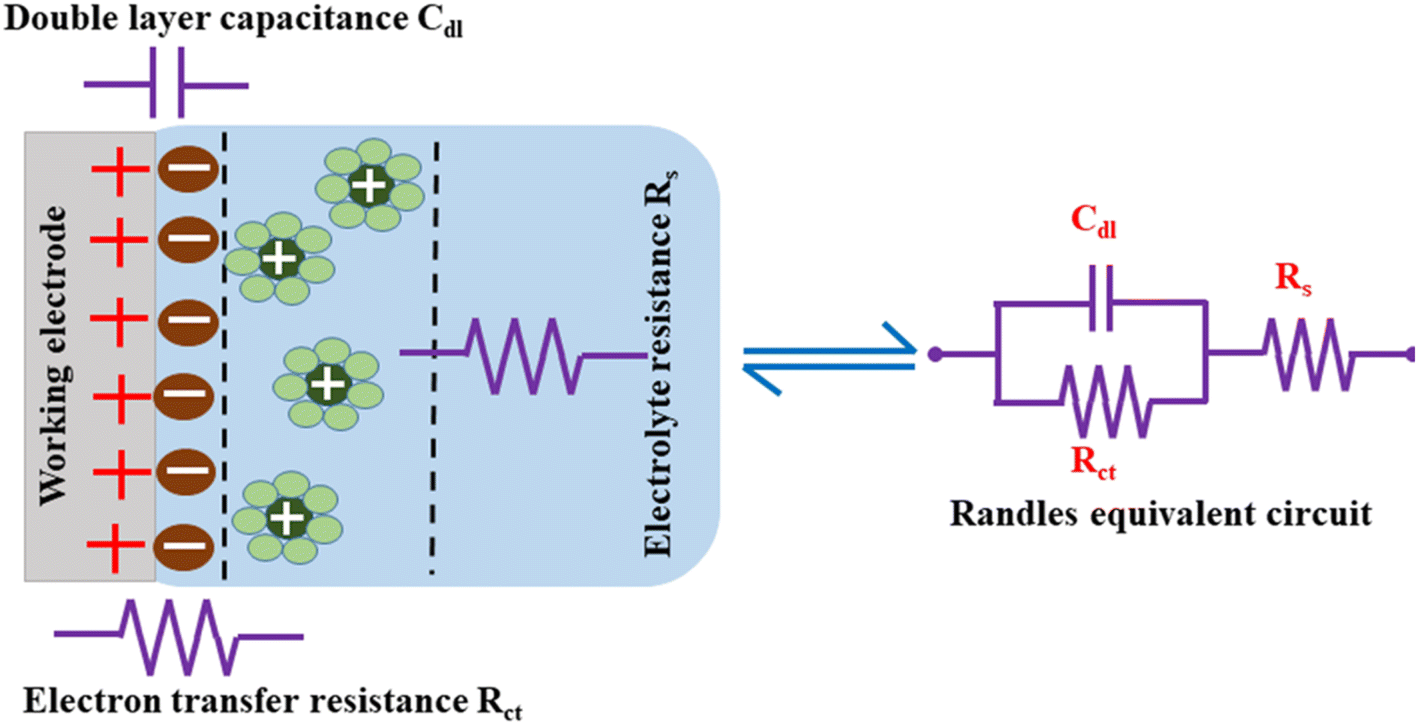 | ||
| Fig. 13 Charge storage via EDLC formation and the equivalent circuit. | ||
Cdl indicates the capacitance at the electrode/electrolyte interface. For an ideal capacitor, the electrode should possess a homogenous interface, and the phase angle should be exactly equal to −90°. However, in a real system, the electrode/electrolyte interface is affected by surface roughness, heterogeneity, and uncontrolled instantaneous adsorption/desorption of molecules in the immediate surroundings, leading to non-ideal behaviour. This is represented by a CPE, which is an empirical quantity that correlates the capacitive behaviour with the roughness of the electrode and is given by eqn (15).
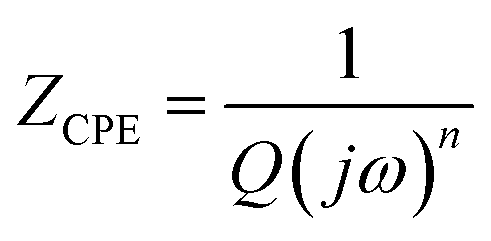 | (15) |
Table 5 presents the correlation between CPE values, components, and their respective symbols.
| Value | Elements | Symbol |
|---|---|---|
| n = 0.5 | Warburg |  |
| n = 1 | Capacitor |  |
| n = −1 | Inductor |  |
| n = 0 | Resistor |  |
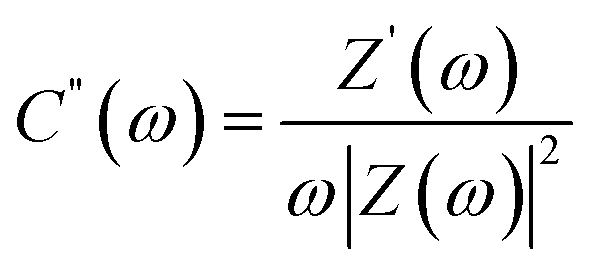
Complex capacitance and complex power analysis are two approaches used in EIS to examine the electrical characteristics of an electrochemical system. They reveal key information regarding the behaviour at the electrode–electrolyte interface. Complex numbers are used to express the impedance 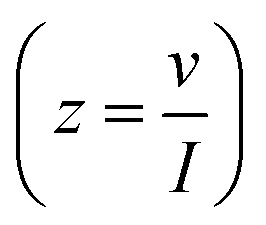 of the system, accounting for resistance loss and the capacitive behaviour of the system. The phase difference between the current and voltage can then be represented in Farads according to the following eqn (16)–(22),174,183
| C(ω) = C′(ω) − jC′′(ω) | (16) |
 | (17) |
 | (18) |
| ω = 2πf | (19) |
The complex power value is given by
| S(ω) = P(ω) + jQ(ω) | (20) |
| P(ω) = ωC′′(ω)|ΔVrms|2 | (21) |
| Q(ω) = −ωC′(ω)|ΔVrms|2 | (22) |
 and ΔVmax is the maximum voltage.
The SC impedance can be obtained by plotting the real (C′(ω)) and complex (C′′(ω)) capacitance values over frequency (f).
Moreover, analyzing the distribution of relaxation time (DRT) and the distribution of diffusion time (DDT) extracted from EIS measurements offers crucial insights into the kinetic parameters governing charge transfer, ion diffusion and interfacial parameters within the SC device. These parameters are evaluated within the time domain.184 A comprehensive understanding of the fundamental concepts of DRT and DDT can enable researchers to effectively evaluate the performance of SCs.185–188
The ideal CV graph of an EDLC material follows a quasi-rectangular shape, as shown in Fig. 11b. It indicates the unrestricted transport of solvated ions in the activated carbon pores due to the formation of the double layer at the electrode/electrolyte interface.117
The Cs of the device (2-electrode system) can be calculated from the CV data using the following eqn (23):190
 | (23) |
At lower scan rates, the electrolyte ions have sufficient time to access the inner pores of the electrode material and hence offer less ohmic resistance, which enhances the access path for solvated ions in the electrolyte, leading to more charge accumulation on the electrode surface. At a higher scan rate, the CV curve starts deviating from the quasi-rectangular shape because the solvated ions are in contact with the surface for a very short time as a result of the formation of an unstable Helmholtz double layer at the electrode–electrolyte interface, leading to lesser charge accumulation on the surface and a lower capacitance value.191,192 Dunn's model is often used to quantify the diffusive and capacitive contributions of an SC system assuming that diffusive contributions are predominant at low scan rates while capacitive contributions become dominant at higher scan rates.193
 | (24) |
The GCD curves of EDLC-type electrode materials exhibit a symmetric triangular shape during both charging and discharging, as represented in Fig. 10c. This shape is due to a linear voltage change concerning time. IR drop, which is defined as the potential difference or voltage drop between the ends of the electrodes during the GCD test, is an important metric that indicates the suitability of a material for SC applications. According to Ohm's Law (Δv = IR), an SC experiences a voltage drop when a current (I) is passed through it because of the lowering of the internal resistance (R). This voltage drop is termed IR drop. As the current density increases, the IR drop in the GCD curve becomes higher and consequently lowers the discharging time due to faster ionic diffusion.
Fig. 14(a–c) show the IR drop observed for the various weight ratios of the nanocomposite NCE electrodes at high current densities.195 At higher current densities, the electrolyte ions have insufficient time for diffusion into the inner surface of the electrode, resulting in lower capacitance values.196 IR drop is mainly attributed to electrolyte potential drop, contact resistance between the current collector, electrode material, separator, and electrolyte, and the charge–discharge current density. The overall cell performance is deduced by IR drop, which is a straight measure of the ESR of the cell. Lower IR drops denote lower internal resistance and lead to better coulombic efficiency.146
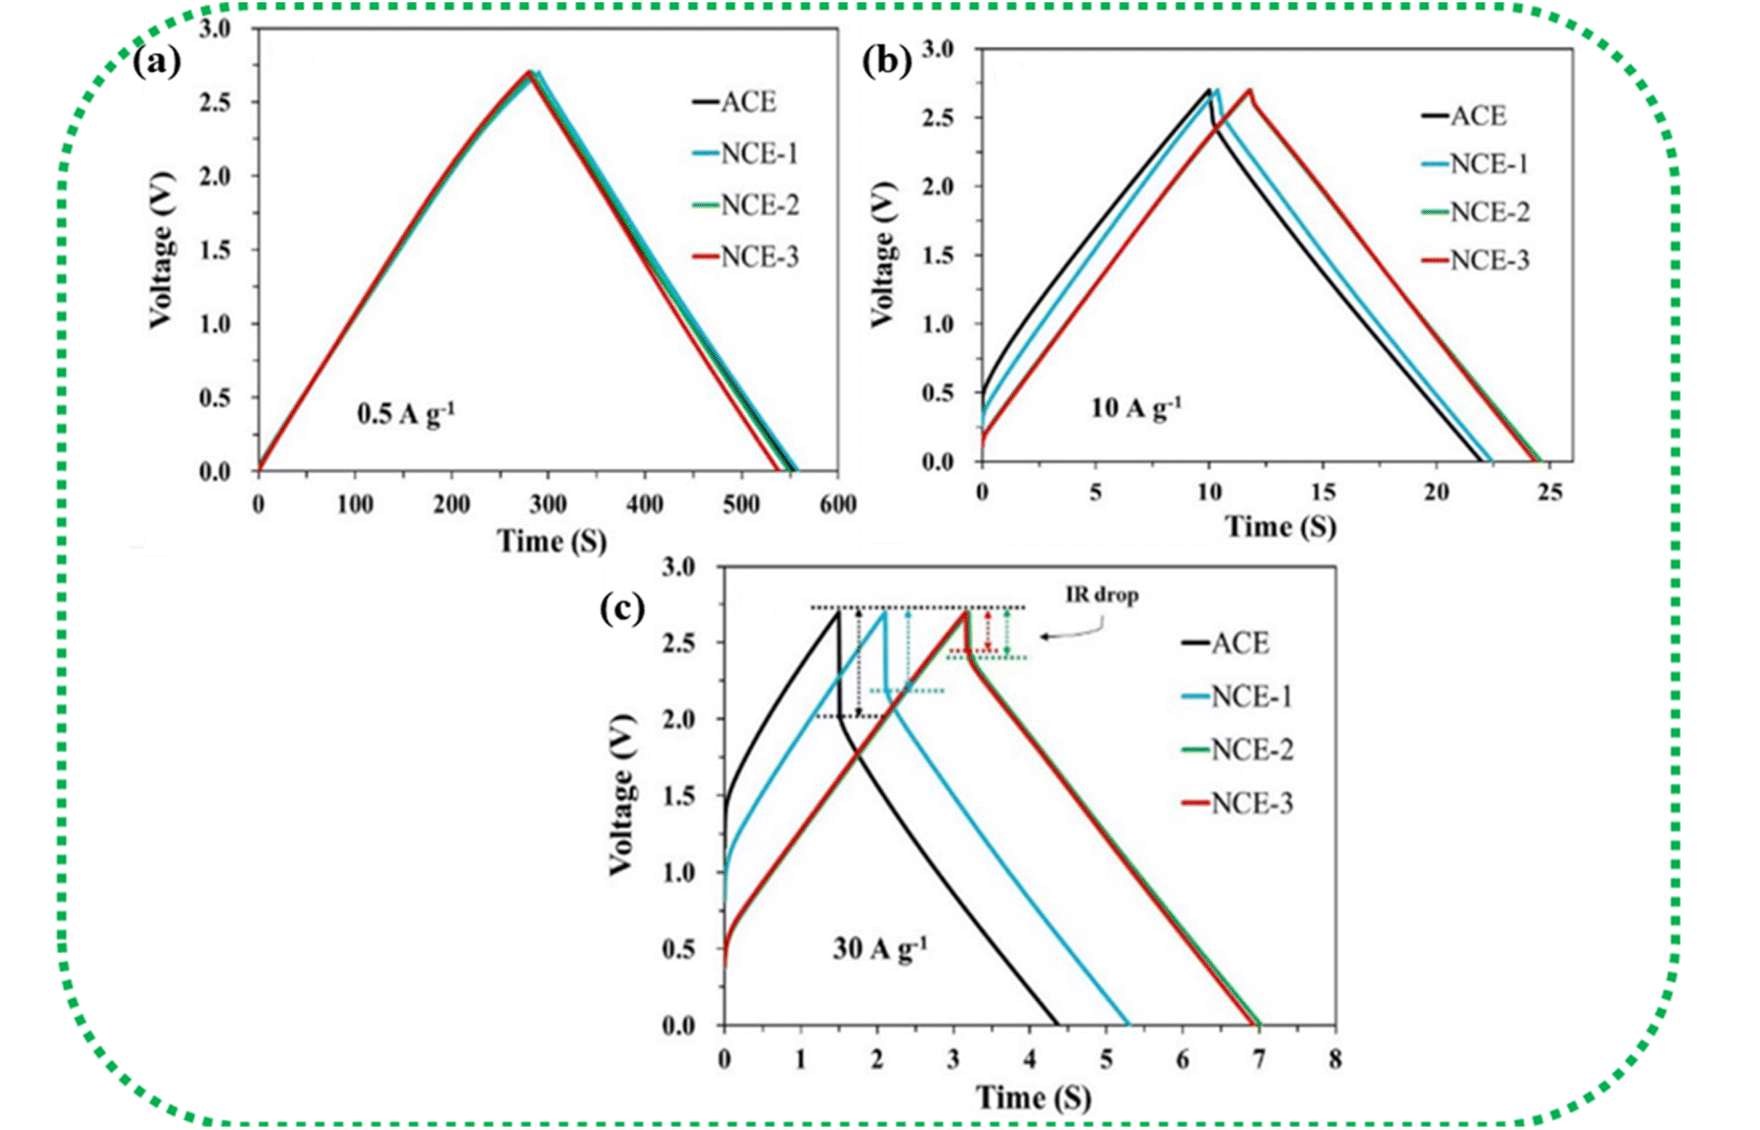 | ||
| Fig. 14 (a–c) Increase in IR drop with increasing current density in NCE (AC/CB/CNT/CNF). Reprinted with permission from ref. 195, copyright (2020), Elsevier. | ||
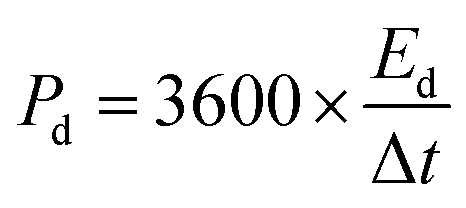
Ed (W h kg−1) and Pd (W kg−1) of an SC can be calculated from the following eqn (25) and (26),197
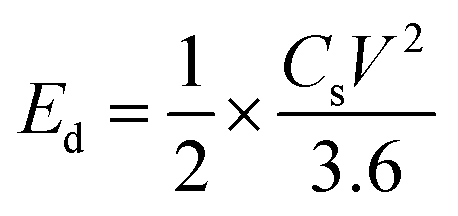 | (25) |
 | (26) |
 | (27) |
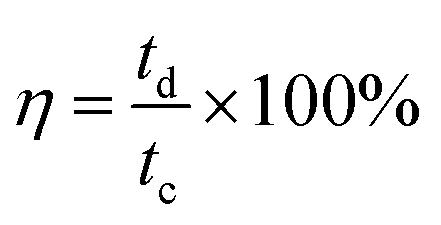
Coulombic efficiency (η) is defined as the ratio of time taken to deliver the charge stored during discharge to the time taken for storing the charge and is expressed as a percentage. A value of 100% represents complete discharge without any losses. It is calculated using eqn (28):200
 | (28) |
A deeper understanding of conceptualization, methodology, and key factors of the cyclic stability of SCs can be referred from ref. 201.
The presence of ash content, in particular in a BDAC, can have a significant impact on self-discharge, leakage current, and cycling stability.209 Ash in BDAC generally comprises mineral components, such as oxides of potassium, sodium, calcium, and silicon, which serve as templates for pore formation. A lower ash content implies a high proportion of fixed carbon content in the raw material.210 These minerals can establish a tortuous conductive pathway, which results in the development of a leakage current, directly exacerbating the self-discharge process. One of the key strategies to minimise the ash content is acid soaking; for instance, soaking in HCl before carbonization in commercial potassium humate has been proven effective in reducing the ash content from 20% to 6.3%. As a result, the leakage current reduced (15.3 μA) compared with the material used without acid soaking (25.0 μA) over 5.4 hours of testing.211
The self-discharge mechanism of SCs is explained by two different fitting models, which assume that (a) the internal resistance leads to the development of a leakage current and (b) the self-discharge is predominantly a diffusion-controlled process, as illustrated in Fig. 15(a and b).213 The first model correlates the leakage current to the resistance, and the voltage is given by eqn (29),
|
v = v0exp−t/RC
| (29) |
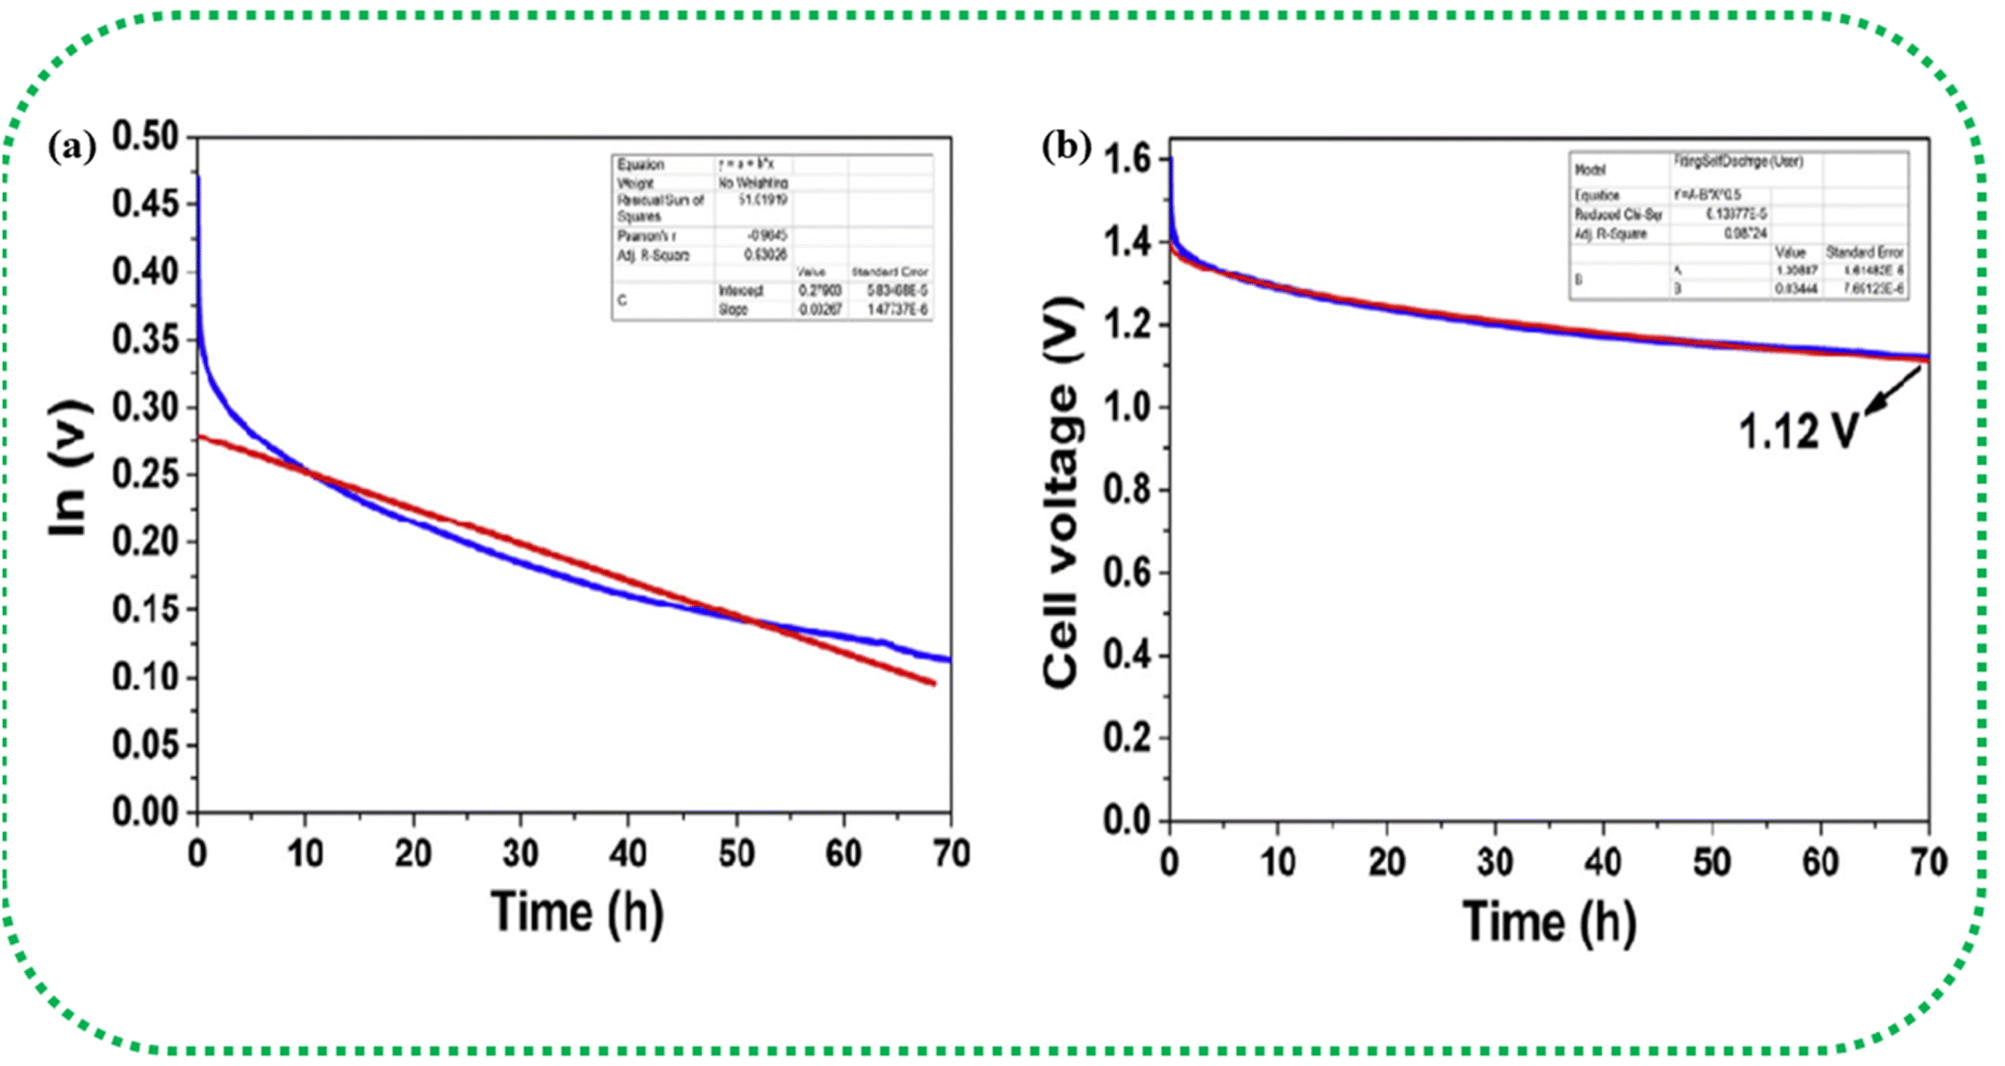 | ||
| Fig. 15 Curve fitting of the self-discharge model. (a) Leakage current over resistance model (b) diffusion control process model. Reprinted with permission from ref. 212, copyright (2017), Elsevier. | ||
The second model considers self-discharge as a diffusion-controlled process, for this the voltage given by eqn (30),
| v = v0 − mt½ | (30) |
 | (31) |
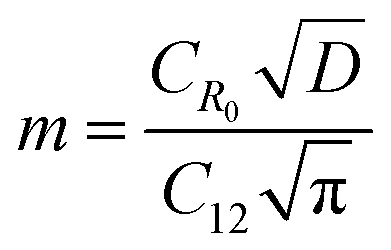
The above sections reveal that apart from CV studies, SC-specific studies can help in specifically judging the stability of a device under high rates of discharge, as well as during inoperative periods, such as storage or no-load conditions. This careful and comprehensive analysis of the performance metrics can be crucial for assessing the suitability of a particular SC configuration before field deployment. Moreover, these tests are highly relevant to BDAC, as BDAC exhibits considerable initial primary changes in metrics, such as surface area, pore hierarchy, surface functionality, interfacial attributes, and homogeneity. Comprehensive BDAC electrochemical characterization and inferences are illustrated in Fig. 16. We next discuss the investigations on peanut shells as a biomass source for BDAC-based SCs. Multiple reviews have summarized the suitability of biomass sources, such as aloevera, fermented rice, corn cob residue, oil palm kernel shells, pine cones, shrimp shells, bamboo waste, cotton stalk, sunflower seed shells, waste newspaper, and cauliflower.218,219 Considering the geography of our research group i.e., India, we have fittingly chosen peanut shells as the precursor for BDAC-based SCs.
 | ||
| Fig. 16 Schematic of the roles of BDAC material in an electrochemical system. | ||
5 Peanut shell and its activated carbon for SCs
Globally, peanut shells account for 7.44 million tons of agro-industrial waste annually.220 The Food and Agricultural Organization (FAO) reports that India is the second largest producer of peanut products in the world.221 Generally, it is used as animal feedstock or dumped in landfills. Peanut shells comprise cellulose, hemicellulose lignin, and ash, which can tailor the surface morphology and electrical conductivity.222 Compared to fossil fuels, peanut shells have a low ash content of 1.44% on a dry weight basis.223 The elemental analysis of peanut shells (sourced in Argentina and China) using a Carbon Hydrogen Nitrogen Sulphur (CHNS) elemental analyzer has revealed its typical composition, as tabulated in Table 6.224,225Extensive research is currently done in pursuit of innovative electrode materials for the realization of high-performance SC applications. As elucidated in the preceding sections, a multitude of factors are implicated in the customization of material properties. In light of these considerations, a significant number of researchers have considered peanut shells as a suitable raw material for the development of activated carbon. Research on peanut-shell-based BDAC has been categorized based on some common factors considered in published reports, which thereby contribute to the development of sustainable SCs.
5.1 Two-step acid pickling
Two-step acid pickling is a promising approach for producing impurity-free activated carbon; this can be done even post-carbonization and activation. Pickling effectively removes impurities, introduces new porosity through in situ etching, and improves the accessibility of the carbon matrix for subsequent activation, leading to improved activation efficiency. Effective removal of both metal (and its associated complexes) and other impurities introduced during the activation process is an added benefit, and the formation of new pores has been reported at these positions in the carbon matrix.2265.2 Direct activation
High surface area activated carbon (HSAC) has been prepared by single-step direct KOH activation. In addition to this, a binder-free electrode was prepared using this HSAC on nickel foam by a facile hydrothermal method. The electrochemical performance of this electrode was characterized in a three-electrode system, which exhibited a Cs of 242.84 F g−1 in KOH and 272 F g−1 in Li2SO4 electrolyte at a scan rate of 10 mV s−1. The higher capacitance in the Li2SO4 electrolyte is because the direct growth of HSAC on nickel maintains its porous structure; moreover, it favours the insertion of Li+ and SO42− ions into the electrode surface during the charging and discharging processes.227Analogously, a single-step method was used to synthesise a composite of PSAC with Co3O4 via low-temperature calcination. The PSAC was prepared by carbonization followed by KOH activation. The asymmetric device of this composite displayed a Cs of 58.2 F g−1 at a current density of 1 A g−1, with an Ed of 12.7 W h kg−1 and Pd of 8964.7 W kg−1.228
5.3 Microwave-assisted PSAC
Mesoporous carbons (MCs) have been synthesized from peanut shells via single-step microwave-assisted ZnCl2 activation. The mass ratio of ZnCl2/peanut shell ranged from 1 to 5 (1:1, 2:1, 3:1, 4:1, and 5:1) at 600 W of microwave power. The specific surface area increased with the mass ratio, from 1307 m2 g−1 to 1552 m2 g−1, and then fell to 1409 m2 g−1 due to pore collapse. On the other hand, the yield of the MCs also declined from 38.4% to 32.3% with an increase in the mass ratio from 2 to 5, likely due to the release of more volatile components at higher concentrations of ZnCl2. A mass ratio of 1:4 showed optimal parameters, with a Cs of 184 F g−1 at 0.05 A g−1 after 1000 cycles.229 HPAC prepared by hydrothermal treatment followed by ZnCl2 activation had a Cs of 340 F g−1 and a 4.7% decay in capacitance after 10000 cycles at 1 A g−1 in an electrode system with 1 M H2SO4 as the electrolyte.230
Similarly, a microwave-assisted heated glycol reduction method was employed to synthesise a composite of ruthenium/mesoporous carbon from peanut shells.231
5.4 Hydrothermal carbonization
Hydrothermal carbonization combined with KOH activation was utilized to produce a hierarchical porous carbon with a surface area of 2565 m2 g−1. The symmetrical device in 3 M KOH showed a Cs of 188 F g−1 at a current density of 0.04 A g−1. This device was stable for up to 10000 cycles with a capacitance retention of 89.3%.232
Two distinct methods, hydrothermal carbonization and ethanol soaking were utilized to produce microstructure-activated carbon from peanut shells in another study. Ethanol soaking gave the best result in removing the lignin and hemicellulose components without disturbing the crystalline nature of the cellulose microfibrils. The peanut shell powder was soaked in ethanol for one month to facilitate this removal, which also extended the mesopore range and increased the total pore volume by 250% compared with the material prepared using an alternative hydrothermal process. It revealed higher values, such as a Cs value of 189 F g−1, Ed of 26 W h kg−1, and Pd of 57 kW kg−1, compared with that prepared by hydrothermal carbonization, which showed a Cs value of 109 F g−1, an Ed of 14.9 W h kg−1 and Pd of 32 kW kg−1, which can be attributed to this soaking process.233
5.5 Activating agents
3D-activated porous carbon materials can be synthesized using different activating agents, such as NaOH, KOH, KCl, and K2CO3. KCl acts as a template for pore formation in char. Molten KCl replaces the position of volatile substances that are released during the activation process, and KCl is reduced to K, which further intercalates into the carbon network. Consequently, microporous carbon is generated after the elimination of the residual template by acid washing. K2CO3 has a strong etching effect on the carbon frame, as represented by eqn (32) and (33), because the K atom can readily dissociate during the initial stages of activation and lead to pore formation. CO32− leads to the formation of mesopores as well. The activation mechanism of NaOH is similar to that of KOH, as described in eqn (34)–(36). Nevertheless, the etching effect of NaOH is rather weak because of its lower alkalinity.| K2CO3 + C → K + CO | (32) |
| K2CO3 + C → KO2/K2O/K2O2 + CO | (33) |
| 6NaOH + 2C → 2Na + 2Na2CO3 + 3H2 | (34) |
| C + H2O → CO/CO2 + H2 | (35) |
| CO2 + C → 2CO | (36) |
Among the agents listed, BDAC prepared using KOH has shown a high specific surface area of 2936.8 m2 g−1 and a high Cs of 339 F g−1 at 1 A g−1 in a three-electrode system with Ed up to 39.1 W h kg−1 and a Pd of 2495.5 W kg−1 in the two-electrode system. A capacitance retention of 80% after 10000 cycles at 5 A g−1 was also observed.225
The investigation of the influence of different activating agents (K2CO3, KOH, KHCO3) at varying weight ratios on PSAC disclosed that among all the activating agents, KOH-derived carbon with a mass ratio of 1:4 showed the highest specific surface area of 2547 m2 g−1, with the symmetric SC showing a Cs of 224.3 F g−1.234
The influence of double activating agents was studied using ZnCl2 and FeCl3 and peanut shells as the raw material. In this work, a single-step activation method was adopted to obtain a ZnCl2-activated carbon (ZN-AC), FeCl3-activated carbon (FE/AC), and ZnCl2/FeCl3-activated carbon (ZN-FE-AC). Among all the samples ZN-AC-x (x = 2:1 weight ratio of peanut shell and activating agent) achieved the highest high Cs value of 239.88 F g−1 because it had more ordered carbon and higher O–H and carboxyl group concentrations than the other samples. Though FE/ZN-AC-2 had a high surface area, it showed poor performance. This may be due to the presence of excessive micropores, which will not permit the electrolyte ions to pass through.235
The combined influence of ZnCl2 and CoCl2 as activating agents was examined to prepare an N2/O2 enriched hierarchical porous carbon (NOHPPC) derived from peanut shells. ZnCl2 initiated a dehydrating process during the activation stage, retaining carbon in the matrix. The graphitization degree of the carbon matrix was enhanced through catalytic graphitization using cobalt. The NOHPPC with a weight ratio of 1:1(ZnCl2:peanut shell powder) showed a higher graphitization degree (IG/ID = 0.17) than materials prepared using other weight ratios (2:1, 3:1). It exhibited capacitance retention of 90.9% after 10000 cycles at 10 A g−1 in a three-electrode system containing a 6 M KOH electrolyte.236
Porous carbon derived from peanut shell waste was prepared by carbonization and followed by KOH activation with a weight ratio of 1:4. This material was used as an anode electrode material along with a sulphur-reduced graphene oxide/cobalt oxide composite in a supercapattery.237 Activated carbon obtained from peanut shells using the same method described above was also utilized as anode material in an asymmetric SC configuration along with sulphur-reduced graphene oxide/manganese oxide composite.238
5.6 The importance of the impregnation ratio
NaOH-based BDAC from peanut shells prepared using various impregnation ratios between 1:2 and 1:3 showed a rise in specific surface area from 584 m2 g−1 to 826 m2 g−1 and pore size from 1.8 nm to 2.1 nm at higher impregnation ratios. This is because higher ratios led to more dehydration, due to which a greater number of ions intercalated into the carbon skeleton, accordingly aiding pore expansion. Moreover, the 1:3 impregnated BDAC exhibited a Cs value of 263 F g−1 at 10 mV s−1 and 290 F g−1 at 0.2 A g−1 in a three-electrode system and 98% coulombic efficiency after 1000 cycles.239
The utilization of carbon cloth as a current collector and BDAC from peanut shells as the electrode material allowed a high areal mass loading of 9–10 mg cm−2. Carbon cloth is corroded by any type of electrolyte, electrically conductive at 15 S cm−2 with a porous structure, and has a thickness of 200–250 μm and a high packing density of 0.73 g cm−3. With electrolytes, such as 6 M KOH and 0.5 M Na2SO4, cell voltage values of 1.0 V and 1.6 V have been reported, respectively, for which the differences in the gravimetric and volumetric Cs of KOH and NaOH (due to different hydrated ionic radii of 0.36–0.42 nm and 0.533 nm respectively) are postulated as the reasons.240
5.7 Heteroatom doping
N-doped PSAC prepared using melamine as the N source at a weight ratio of 1:2 had a hierarchical porous structure with enriched micropores and mesopores in the range of 2 nm to 5 nm and a surface area of 2014.6 m2 g−1. Before activation, the raw material was chemically reacted with aqueous NH4OH to eliminate lignin and promote its swelling, which increased the etching effect of ZnCl2 (the activating agent) during activation.242
To enhance the specific surface area, a mixture of peanut shell powder, soy protein as the N source, and GO at a weight ratio of 5:1.5 was employed and activated at 800 °C with KOH. The resulting material demonstrated a Cs value of 289.4 F g−1 and capacitance retention of 92.8% after 5000 cycles.243
Ex situ N doping in the carbon structure is an effective way to enhance the electrochemical properties. The effect of the mass ratio of activating agent in ex situ N doping has been investigated using PSAC and melamine the N2 precursor, which was mixed at different ratios (1:0.5, 1:1, 1:2) with PSAC and further pyrolyzed at 850 °C for 1 hour in argon. N doping with a 1:0.5 ratio achieved a surface area of 1048 m2 g−1, higher than that of pristine PSAC. The sample with 1:1 and 1:2 ratios resulted in less porous structures, as evident from SEM and BET analyses, attributed to the decomposition of melamine, which destroys the pore walls and blocks existing pores within the carbon structure. Analogously, ex situ N doping with a ratio of 1:1 showed the highest Cs of 251.2 F g−1 at a current density of 1 A g−1 in a symmetric device configuration compared with other doped and undoped electrode materials. The stability of the device was examined by VHT, and the Cs values were obtained for every 10 hours of holding time.244
5.8 Molten salt
KCl in its molten state at 800 °C during pyrolysis and subsequent post-heat treatment at a higher temperature (1000 °C) was used to introduce defects and develop the porous structure at the initial stage of PSAC fabrication, which resulted in a Cs value of 355 F g−1 at 0.5 A g−1 in the 6 M KOH electrolyte.2465.9 Bimetallic activation
A single-step bimetallic activation technique was employed by coupling the activation of metal chlorides (FeCl3/ZnCl2, FeCl3/MgCl2, and ZnCl2/MgCl2) in a CO2 environment. The peanut shell powder activated with FeCl3/MgCl2 at 800 °C attained a Cs of 247.28 F g−1 at a current density of 1 A g−1 in a 1 M Na2SO4 electrolyte with capacitance retention of 96.31% after 5000 cycles. Micropores of size 0.7 nm were observed with a relatively high concentration of oxygen-containing functional groups contributing to the pseudocapacitance response and the highest Cs value among all the tested activating agents.247 Table 7 summarizes research done on PSAC for SC applications, including preparation methods, physical properties and SC performance.| Method | AA | Morphology | SSA (m2 g−1) | Electrolyte | System | Cs (F g−1) | Ed (W h kg−1) | Pd (W kg−1) | Cyclic stability | Retention (%) | Ref. |
|---|---|---|---|---|---|---|---|---|---|---|---|
| a Conventional method*-carbonization and activation; AA*-activating agent; SSA*-specific surface area; Cs*-specific capacitance. | |||||||||||
| Conventional method*/mechanical exfoliation | KOH | Mesoporous carbon/few-layer graphene | 2070 | 1 M H2SO4 | Three electrode | 186 @ 0.5 A g−1 | 58.125 | 37.5 | 5000 @ 10 A g−1 | 87 | 221 |
| Microwave-assisted method | ZnCl2 | Mesoporous carbon | 1552 | 1 M Et4NBF4/PC | Three electrode | — | 19.3 | 1007 | — | — | 223 |
| Conventional method | KOH | 3D porous carbon | 2936.8 | 6 M KOH | Two electrode | 282 @ 1 A g−1 | 39.1 | 2495.5 | 10000 @ 5 A g−1 |
80 | 225 |
| Conventional method | KOH | Porous carbon | 550.38 | 6 M KOH | Two electrode | 390.9 @ 5 A g−1 | 22.2 | 319.97 | 10000 @ 5 A g−1 |
93.8 | 226 |
| PVA/KOH | 432.7 @ 0.5 A g−1 | 18.2 | 275.3 | ||||||||
| Hydrothermal/direct growth on Ni foam | KOH | Honeycomb like 3 D porous structure | 1279 | 1 M KOH | Three electrode | 242.84 | 18.89 | 1000 | — | — | 227 |
| 1 M Li2SO4 | 272 @ 10 mV s−1 | 20 | 1000 | ||||||||
| One-step activation/Co3O4 composite | KOH | Porous carbon | 247.7 | 6 M KOH | Two electrode | 58.2 @ 1 A g−1 | 22.7 | 8964.7 | 5000 @ 5 A g−1 | 93.1 | 228 |
| Microwave-assisted method | ZnCl2 | Mesoporous carbon | 1552 | 6 M KOH | Three electrode | 184 @ 0.05 A g−1 | 4.94 | 740 | 1000 | — | 229 |
| Hydrothermal treatment | ZnCl2 | Hierarchical porous carbon | 1549 | 1 M H2SO4 | Three electrode | 333 @ 0.5 A g−1 | 10.8 | 6250 | 10000 @ 1 A g−1 |
95.3 | 230 |
| Microwave-assisted method | ZnCl2 | Mesoporous carbon/ruthenium composite | 1176 | 6 M KOH | Three electrode | 287 | 10.5 | — | 1000 | 93.3 | 231 |
| Hydrothermal carbonization | KOH | Hierarchical porous carbon | 2562 | 3 M KOH | Two electrode | 188 @ 0.04 A g−1 | — | — | 10000 @ 2 A g−1 |
89.3 | 232 |
| Ethanol soaking/activation | ZnCl2 | Mesoporous carbon | 1483 | PVdF-HFP/EMITf/Mg (TF2) | Two electrode | 189 @ 1.25 A g−1 | 26 | 57 | 10000 @ 1.25 A g−1 |
72 | 233 |
| Conventional method | KOH | Hierarchical porous carbon | 2547 | 2.5 M KNO3 | Two electrode | 224.3 @ 1 A g−1 | 25.2 | 900 | 15000 @ 5 A g−1 |
83 | 234 |
| One-step activation | ZnCl2 + FeCl3 | Microporous carbon | 1481.59 | 1 M Na2SO4 | Three electrode | 239.88 @ 0.5 A g−1 | — | — | 5000 @ 2 A g−1 | 94.55 | 235 |
| Conventional method | NaOH | Mesoporous carbon | 826 | 6 M KOH | Three electrode | 290 @ 0.2 A g−1 | — | — | 1000 @ 0.2 A g−1 | 90 | 239 |
| Conventional method | KOH | Microporous carbon | 1700 | 0.5 M Na2SO4 | Two electrode | 150.4 @ 0.5 A g−1 | 16.92 | 451.2 | 12000 @ 0.5 A g−1 |
99 | 240 |
| Hydrothermal carbonization | KOH + H6NO4P | Mesoporous carbon | 602.7 | 6 M KOH | Three electrode | 208.3 @ 1 A g−1 | 18.33 | 4882.83 | 5000 @ 2 A g−1 | 98.8 | 241 |
| Hydrothermal carbonization | ZnCl2 + melamine | Hierarchical porous carbon | 2014.6 | 6 M KOH | Two electrode | 300.6 @ 0.5 A g−1 | 40.92 | 990 | 5000 @ 2 A g−1 | 90.14 | 242 |
| Conventional method | KOH | Hierarchical porous carbon | 1691 | 1 M H2SO4 | Three electrode | 289.4 @ 0.4 A g−1 | 25.72 | 1280 | 5000 | 92.8 | 243 |
| PVA/H2SO4 | Two electrode | 10.75 @ 10 mV s−1 | 2000 | 82.9 | |||||||
| Chemical activation/Ex situ N2 doping | KOH + melamine | Interconnected porous structure | 1442 | 2.5 M KNO3 | Two electrode | 251.2 @ 1 A g−1 | 35 | 20 | 20000 @ 5 A g−1 |
83.2 | 244 |
| Conventional method | KOH/melamine + urea | Hierarchical porous carbon | 1151.6 | 1 M H2SO4 | Two electrode | 80.25 @ 1 A g−1 | 11.5 | 5000 | 5000 @ 5 A g−1 | 98.8 | 245 |
| One-step bimetallic activation | FeCl3 + MgCl2 | Microporous carbon | 1427.28 | 1 M Na2SO4 | Two electrode | 58.83 @ 1 A g−1 | 32.7 | 588.3 | 5000 @ 2 A g−1 | 96.31 | 247 |
| Hydrothermal carbonization | H3PO4 | Mesoporous carbon | 17.8 | 1 M KOH | Three electrode | 240 @ 1 A g−1 | 4.08 | 101.3 | 1200 @ 3 A g−1 | 90 | 248 |
| Thermal dissolution carbon enrichment | NaOH | Microporous carbon | 2746 | 6 M KOH | Three electrode | 228 @ A g−1 | — | — | — | — | 249 |
| Catalytic graphitization/activation/ | CoCl2/ZnCl2 | Hierarchical porous carbon | 1942 | 6 M KOH | Two electrode | 221 @ 0.5 A g−1 | 11.1 | 150 | 10000 @ 10 A g−1 |
92.1 | 236 |
| 1 M [BMIm]BF4/AN | Two electrode | 135 @ 0.5 A g−1 | 42 | 375 | 10000 @ 10 A g−1 |
89 | |||||
| Conventional method | KOH | Mesoporous carbon | 702.31 | 2 M KOH | Two electrode | 98 @ 0.25 A g−1 | — | — | 20000 @ 5 A g−1 |
97 | 68 [our group] |
5.10 Other applications
Beyond its use in SCs, PSAC has found applications in H2 and CO2 storage.250 PSAC enriched with micropores and an ultra-high specific area was employed in an H2 storage system.251 Composites of PSAC with iron oxide have been employed in capacitive deionization to remove chromium ions.252 Activated carbons derived from the inner and outer portions of peanut shells were utilized as the anode and cathode material, respectively, in a sodium-ion capacitor,253 as well as anode materials in lithium-ion and sodium-ion batteries.254 N-enriched activated carbon nanosheets from peanut shells have been used to promote the hydrogen evolution reaction.255With the detailing of peanut-derived BDAC and the preceding sections on the parameters governing both BDAC and SCs based on BDAC, we have summarized the extensive research done in these fields by first presenting conclusive observations on various aspects, ranging from the synthesis protocols to contemplations of characterizations and at the device level. We have further highlighted existing challenges and stances on the future outlook of such green sources of SCs as an illustration in Fig. 17.
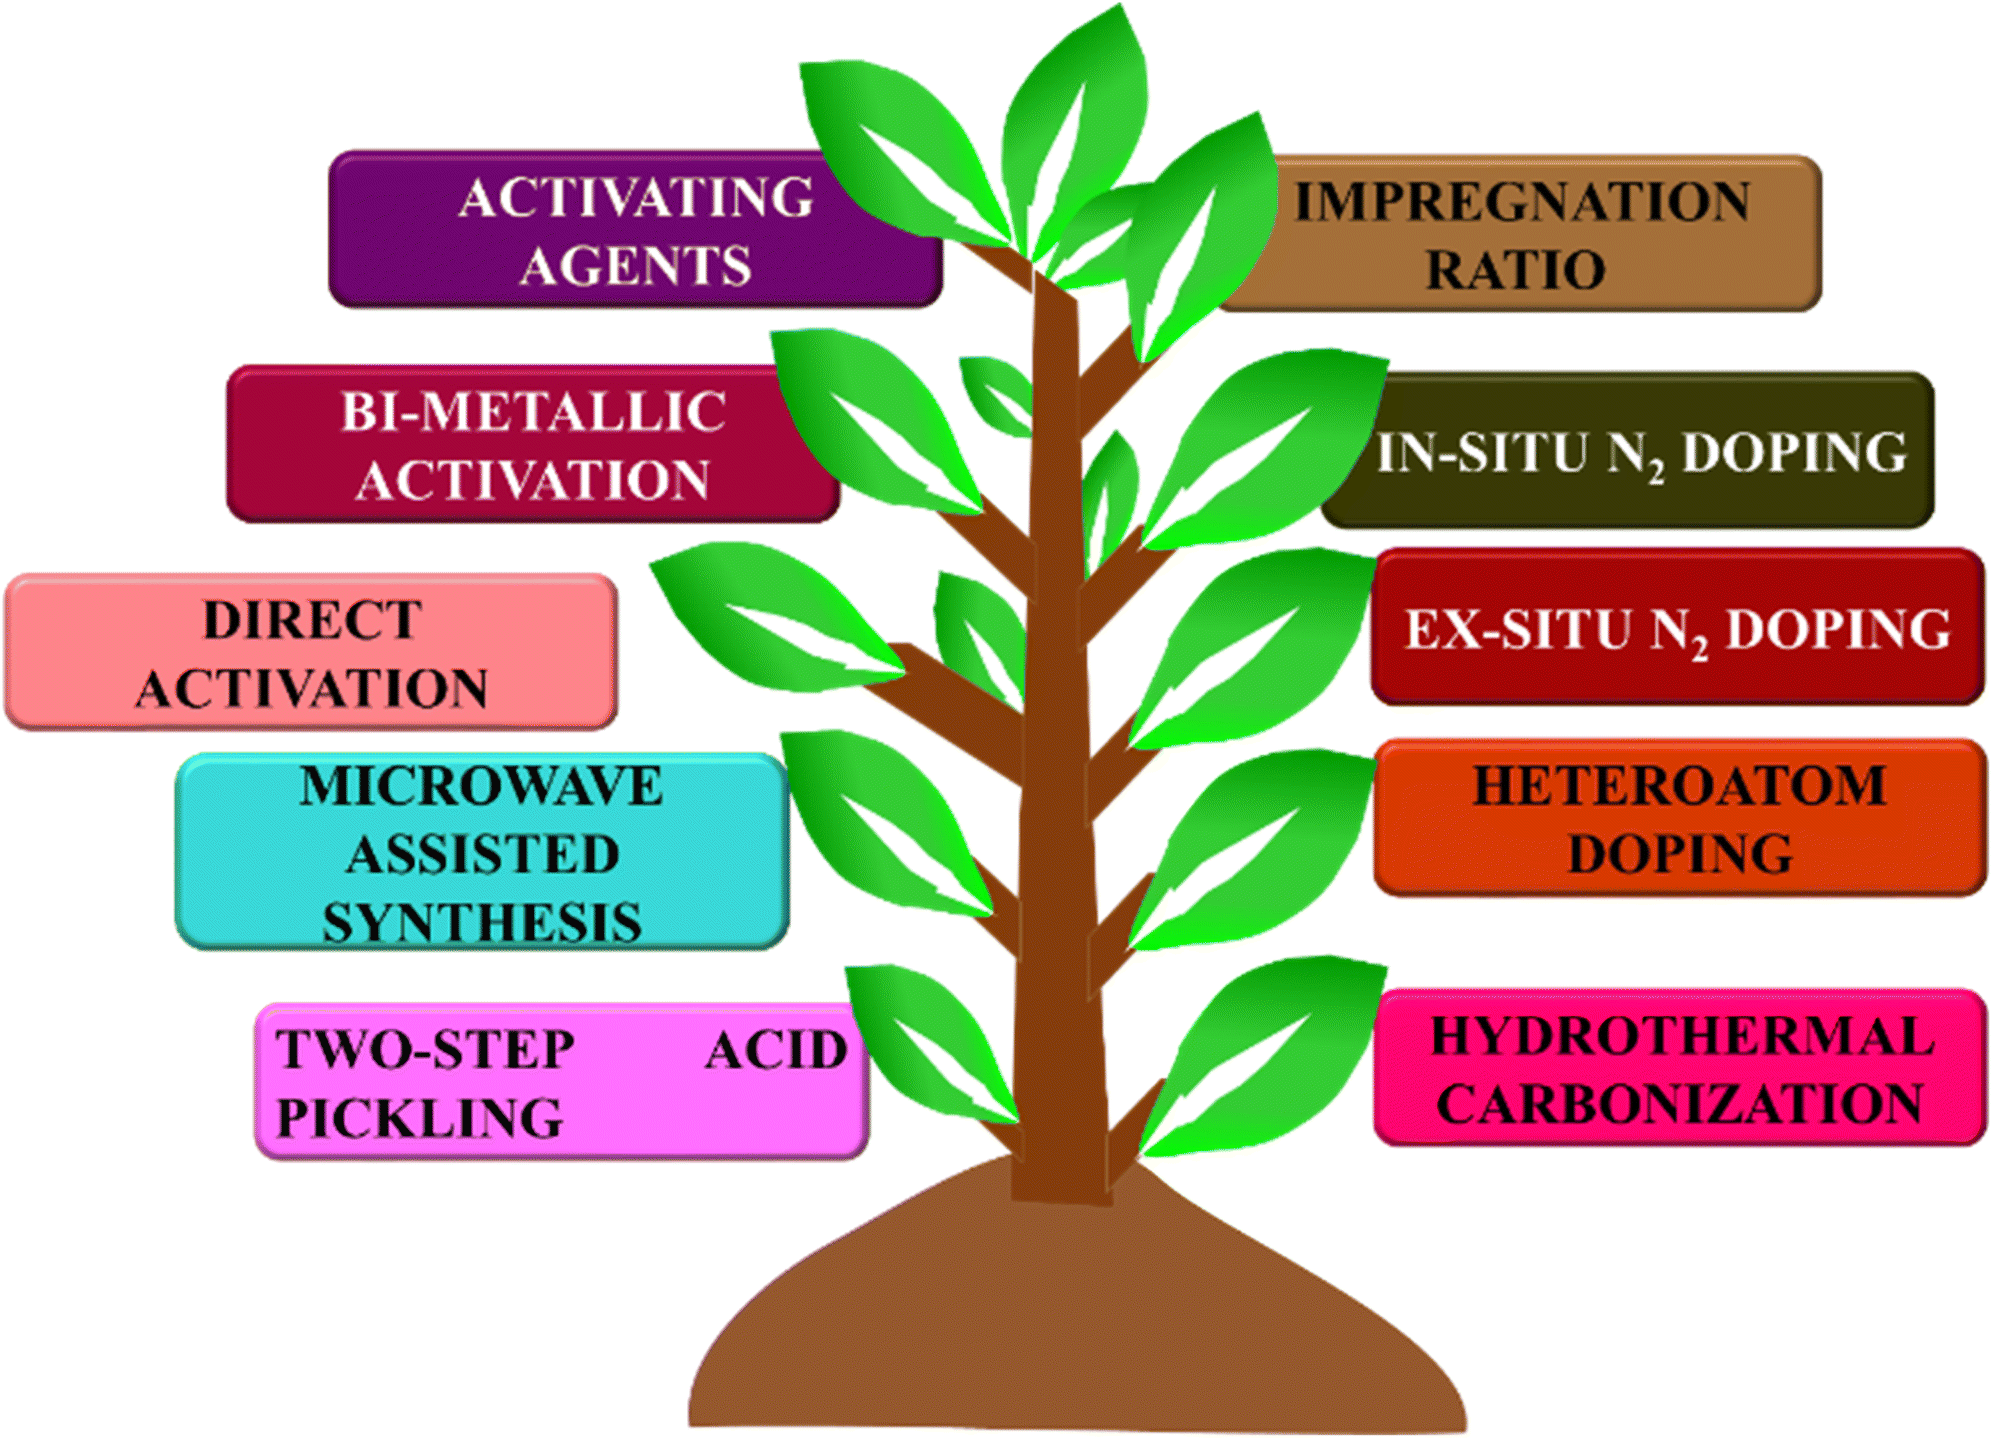 | ||
| Fig. 17 Schematic of critical factors influencing the potential application of PSAC in high-performance SCs. | ||
6 Conclusions
The inherent chemical composition, versatile morphology, structural stability, abundance, low cost, and environmental friendliness make BDAC materials promising candidates for SC applications, as detailed in this review. The overview of tailoring the BDAC architecture through activation methods, pre-treatments, activating agents, heteroatom doping, and impregnation time partially drives home this opinion. Unfortunately, there are only a few studies that explore the fundamental factors that influence the design of BDAC materials and the synthesis methodologies. Apart from the overarching conclusions, such as the preference for high carbon content and lower ash content for electrode materials, the intricacies of porosity control and evaluation of its changes over time/cycling, the importance of hierarchical architectures, and specific protocols that can dictate BDAC synthesis via an initial component analysis, such as CHNS analyses, have to be addressed for a better standing on the viability of BDAC for commercial applications. Usually, the 3D interconnected hierarchical structure of BDAC materials incorporates a “balanced” distribution of micropores and mesopores, which render them as promising candidates for emerging energy storage devices. This warrants a detailed exploration to understand the optimal hierarchy for specific SC metric targets.This review elucidates the fundamental characterization techniques employed to analyze diverse biomass sources, including XRD, FTIR, Raman spectroscopy, SEM, TEM, BET, and BET. The assessments of the amorphous nature, structural defect characteristics, and graphitization degrees using XRD, Raman and FTIR analysis of the surface functional groups are detailed to help discern their influence on the wettability and pseudocapacitance behaviour of the electrode materials. SEM and TEM analyses provide insights into the structural morphology and pore distribution, surface area, and pore hierarchy measured by BET analysis, which are critical factors that influence the energy storage capacity of BDAC-based SC devices.
We have also explored the basic principles of SCs, the charge storage mechanisms, and multiple electrochemical characterization techniques, such as CV, GCD, and EIS. The cyclic stability, voltage holding ability, self-discharge, and leakage current (LC) of BDAC electrodes quantified by GCD experiments show interesting aspects, revealing the interactions between the electrodes, electrolytes, and separators during long-term cycling. These results are important for enhancing the cycling stability of BDAC-based electrodes used in SCs.
7 Challenges and future outlook
The introduction of innovative technologies is essential to enhancing the production capacity of BDAC and paving the way for commercialisation. This does not necessarily have to be cutting-edge technologies, but more along the lines of significantly better material-level interpretations, especially pre- and post-treatment under real-world operational conditions. Until consistent results are achieved across multiple studies with similar objectives, the randomness associated with BDAC synthesis will always be a hindrance to scaling and realizing precise control in the manufacturing and maintenance of BDAC-based SC devices.As examples that drive the point that detailed analyses are a necessity, we highlight that self-discharge and leakage current, which are inherent BDAC traits due to the inability to achieve consistent porosity, chemical makeup, and material stability, pose significant challenges to the development of BDAC-based SCs. Implementing strategies, such as solid-state electrolytes and incorporating redox additives into the electrolyte, can effectively mitigate these issues and enhance the overall performance of the device by achieving at least a consistent chemical makeup. Realizing consistent porosity is trickier, as the controlling factors of porosity are countless, ranging from activating agent dosage during biomass pre-treatment to the intricate control of carbonization conditions (temperature, ramp rates, ambients, cool-down rates).
The majority of SC research currently focuses on developing novel electrode materials from different biomass sources and electrolytes, both aimed at enhancing Ed, which is a major bottleneck to SC predominance. Hence to commercialise SCs, it is also rather important to examine factors that contribute to the degradation and ageing of the SCs, including electrode material delamination, electrolyte decomposition, functional group changes, corrosion, gas evolution, phase creation/annihilation, and separator dissolution.
Data availability
No primary research results, software, or code have been included and no new data were generated or analysed as part of this review.Author contributions
T. Manimekala was involved in the conceptualization, analysis, and draft writing of the manuscript. R. Sivasubramanian was involved in the conceptualization, formal analysis, writing, and finalization of the manuscript. Mushtaq Ahmad Dar was involved in the draft formulation, providing critical feedback and preparing the final draft of the manuscript. Gnanaprakash Dharmalingam was involved in funding acquisition, conceptualization, analysis, and manuscript correction.Conflicts of interest
There are no conflicts of interest in this manuscript.Acknowledgements
The authors wish to acknowledge the EMR Division under the HRD Group of the Council of Scientific & Industrial Research (CSIR), Government of India for financial support through the CSIR SRF-direct Fellowship. The authors also acknowledge the facilities and support provided by the PSG Sons and Charities, Coimbatore, India. This project was funded by the National Plan for Science, Technology and Innovation (MAARIFAH), King Abdulaziz City for Science and Technology, Kingdom of Saudi Arabia, Award Number (2-17-02-001-0053).References
- R. N. A. Raja Seman, R. F. Munawar, J. Abd Razak, N. N. Zulkapli, M. S. A. Bistamam, E. Talib, T. I. Tunku Kudin, N. S. Abdul Manaf and M. A. Azam, Appl. Mech. Mater., 2015, 761, 452–456 Search PubMed.
- R. BoopathiRaja and M. Parthibavarman, J. Alloys Compd., 2019, 811, 152084 CrossRef CAS.
- M. Z. Iqbal, S. Zakar and S. S. Haider, J. Electroanal. Chem., 2020, 858, 113793 CrossRef CAS.
- L. Wang and X. Y. Qin, Bull. Mater. Sci., 2014, 37, 649–654 CrossRef CAS.
- L. Zang, X. Qiao, Q. Liu, C. Yang, L. Hu, J. Yang and Z. Ma, Cellulose, 2020, 27, 1033–1042 CrossRef CAS.
- R. Tang, M. Yamamoto, K. Nomura, E. Morallón, D. Cazorla-Amorós, H. Nishihara and T. Kyotani, J. Power Sources, 2020, 457, 228042 CrossRef CAS.
- S. Kiruthika and G. U. Kulkarni, Bull. Mater. Sci., 2021, 44, 1–6 CrossRef.
- M. Mn, F. Ti, S. Kumar, R. Prakash, H. K. Choi, B. H. Koo, J. I. Song, H. Chung, H. Jeong and C. G. Lee, J. Cent. South Univ. Technol., 2010, 16, 434–439 Search PubMed.
- E. Taer, M. Melisa, A. Agustino, R. Taslim, W. Sinta Mustika and A. Apriwandi, Energy Sources, Part A, 2021, 1–12 Search PubMed.
- S. Gergely, Global Supercapacitor Market Report by Product Type, Module Type, Material Type, End Use Industry, and Region 2024-2032, 2024 Search PubMed.
- J. Sun, B. Luo and H. Li, Adv. Energy Sustainability Res., 2022, 3, 2100191 CrossRef.
- P. Shabeeba, M. S. Thayyil, M. P. Pillai, P. P. Soufeena and C. V. Niveditha, Russ. J. Electrochem., 2018, 54, 302–308 CrossRef CAS.
- N. Kumar, S. Bin Kim, S. Y. Lee and S. J. Park, Nanomaterials, 2022, 12, 3708 CrossRef CAS PubMed.
- L. Zhang, Y. Chi, Z. Li, X. Sun, H. Gu, H. Zhang, Y. Chen and G. Z. Chen, J. Electrochem. Soc., 2020, 167, 040524 CrossRef CAS.
- A. Muzaffar, M. B. Ahamed, K. Deshmukh and J. Thirumalai, Renewable Sustainable Energy Rev., 2019, 101, 123–145 CrossRef CAS.
- D. T. D. Thillaikkarasi, M. M. M. Malarvizhi and S. K. S. Karthikeyan, J. Environ. Nanotechnol., 2020, 9, 01–04 CrossRef CAS.
- S. H. Kazemi, M. A. Kiani, R. Mohamadi and L. Eskandarian, Bull. Mater. Sci., 2014, 37, 1001–1006 CrossRef CAS.
- N. H. N. Azman, H. N. Lim and Y. Sulaiman, J. Nanomater., 2016, 2016, 5935402 Search PubMed.
- V. C. Bose and V. Biju, Bull. Mater. Sci., 2015, 38, 865–873 CrossRef CAS.
- C. Wan, L. Yuan and H. Shen, Int. J. Electrochem. Sci., 2014, 9, 4024–4038 CrossRef.
- B. Pal, S. Yang, S. Ramesh, V. Thangadurai and R. Jose, Nanoscale Adv., 2019, 1, 3807–3835 RSC.
- K. Nasrin, S. Gokulnath, M. Karnan, K. Subramani and M. Sathish, Energy Fuels, 2021, 35, 6465–6482 CrossRef CAS.
- A. Virya, J. Abella, A. Grindal and K. Lian, Batteries Supercaps, 2020, 3, 194–200 CrossRef CAS.
- M. M. El-Zaidia, A. H. Khafagy, S. Hassan and M. Z. Zaki, IOSR J. Eng., 2019, 09, 2278–8719 Search PubMed , https://www.iosrjen.org/.
- P. Krishnan and V. Biju, Bull. Mater. Sci., 2021, 44, 1–11 CrossRef.
- M. Bahdanchyk, M. Hashempour and A. Vicenzo, Electrochim. Acta, 2020, 332, 1–37 CrossRef.
- T. Cetinkaya and R. A. W. Dryfe, J. Power Sources, 2018, 408, 91–104 CrossRef CAS.
- N. Kumar, L. Pradhan and B. K. Jena, Wiley Interdiscip. Rev.: Energy Environ., 2022, 11, 1–24 Search PubMed.
- B. Evanko, S. J. Yoo, J. Lipton, S. E. Chun, M. Moskovits, X. Ji, S. W. Boettcher and G. D. Stucky, Energy Environ. Sci., 2018, 11, 2865–2875 RSC.
- G. Wang, H. Wang, X. Lu, Y. Ling, M. Yu, T. Zhai, Y. Tong and Y. Li, Adv. Mater., 2014, 26, 2676–2682 CrossRef CAS PubMed.
- S. Ahankari, D. Lasrado and R. Subramaniam, Mater. Adv., 2022, 3, 1472–1496 RSC.
- M. Liu, K. Turcheniuk, W. Fu, Y. Yang, M. Liu and G. Yushin, Nano Energy, 2020, 71, 104627 CrossRef CAS.
- V. Ganesh, S. Pitchumani and V. Lakshminarayanan, J. Power Sources, 2006, 158, 1523–1532 CrossRef CAS.
- J. Liu, L. Zhang, H. Bin Wu, J. Lin, Z. Shen and X. W. Lou, Energy Environ. Sci., 2014, 7, 3709–3719 RSC.
- J. Miao, C. Zhou, X. Yan, H. Jiang, M. You, Y. Zhu, Y. Li, W. Zhou and X. Cheng, Energy Fuels, 2021, 35, 2766–2774 CrossRef CAS.
- N. Blomquist, T. Wells, B. Andres, J. Bäckström, S. Forsberg and H. Olin, Sci. Rep., 2017, 7, 1–7 CrossRef PubMed.
- C. Zhong, Y. Deng, W. Hu, J. Qiao, L. Zhang and J. Zhang, Chem. Soc. Rev., 2015, 44, 7484–7539 RSC.
- E. Pameté, L. Köps, F. A. Kreth, S. Pohlmann, A. Varzi, T. Brousse, A. Balducci and V. Presser, Adv. Energy Mater., 2023, 13, 202301008 Search PubMed.
- J. Liu, J. Wang, C. Xu, H. Jiang, C. Li, L. Zhang, J. Lin and Z. X. Shen, Adv. Sci., 2018, 5, 1700322 CrossRef PubMed.
- W. Zhong, H. Sun, J. Pan, Y. Zhang, X. Yan, Y. Guan, W. Shen and X. Cheng, Mater. Sci. Semicond. Process., 2021, 127, 105715 CrossRef CAS.
- L. Jiang, L. Sheng and Z. Fan, Sci. China Mater., 2018, 61, 133–158 CrossRef CAS.
- A. Jain, M. Ghosh, M. Krajewski, S. Kurungot and M. Michalska, J. Energy Storage, 2021, 34, 102178 CrossRef.
- Z. Li, D. Guo, Y. Liu, H. Wang and L. Wang, Chem. Eng. J., 2020, 397, 125418, DOI:10.1016/j.cej.2020.125418.
- M. Ojha, X. Liu, B. Wu and M. Deepa, Fuel, 2021, 285, 119246 CrossRef CAS.
- A. R. Selvaraj, A. Muthusamy, Inho-Cho, H. J. Kim, K. Senthil and K. Prabakar, Carbon, 2021, 174, 463–474 CrossRef CAS.
- J. Li, Y. Gao, K. Han, J. Qi, M. Li and Z. Teng, Sci. Rep., 2019, 9, 17270 CrossRef PubMed.
- K. G. Latham, I. Kozyatnyk, J. Figueira, M. Carlborg, E. Rosenbaum and S. Jansson, Chem. Eng. J. Adv., 2021, 6, 100097 CrossRef CAS.
- W. L. Zhang, J. H. Xu, D. X. Hou, J. Yin, D. B. Liu, Y. P. He and H. B. Lin, J. Colloid Interface Sci., 2018, 530, 338–344 CrossRef CAS PubMed.
- P. Merin, P. Jimmy Joy, M. N. Muralidharan, E. Veena Gopalan and A. Seema, Chem. Eng. Technol., 2021, 44, 844–851 CrossRef CAS.
- M. Zhi, F. Yang, F. Meng, M. Li, A. Manivannan and N. Wu, ACS Sustainable Chem. Eng., 2014, 2, 1592–1598 CrossRef CAS.
- K. Y. Perez-Salcedo, S. Ruan, J. Su, X. Shi, A. M. Kannan and B. Escobar, J. Porous Mater., 2020, 27, 959–969 CrossRef CAS.
- B. Yan, J. Zheng, L. Feng, Q. Zhang, C. Zhang, Y. Ding, J. Han, S. Jiang and S. He, Mater. Des., 2023, 229, 111904 CrossRef CAS.
- J. R. Rajabathar, M. Sivachidambaram, J. J. Vijaya, H. A. Al-Lohedan and D. M. D. Aldhayan, ACS Omega, 2020, 5, 15028–15038 CrossRef CAS PubMed.
- Y. Wang, Y. Chen, H. Zhao, L. Li, D. Ju, C. Wang and B. An, Nanomaterials, 2022, 12, 3804 CrossRef CAS PubMed.
- J. Cheng, S. Hu, G. Sun, K. Kang, M. Zhu and Z. Geng, Energy, 2020, 119144 Search PubMed.
- L. Zhang, H. Gu, H. Sun, F. Cao, Y. Chen and G. Z. Chen, Carbon, 2018, 132, 573–579 CrossRef CAS.
- Y. Li, Z. Sun, L. Zhang, Y. Zou, N. Yao, W. Lei, T. Jiang, Y. Chen and G. Z. Chen, J. Electrochem. Soc., 2021, 168, 060521 CrossRef CAS.
- A. Altwala and R. Mokaya, Energy Environ. Sci., 2020, 13, 2967–2978 RSC.
- E. R. Raut, M. A. Bedmohata and A. R. Chaudhari, Water Sci. Technol., 2023, 87, 2233–2249 CrossRef CAS PubMed.
- Mohit, N. Yadav and S. A. Hashmi, J. Energy Storage, 2022, 55, 105421 CrossRef.
- Y. Liu, Z. Shi, Y. Gao, W. An, Z. Cao and J. Liu, ACS Appl. Mater. Interfaces, 2016, 8, 28283–28290 CrossRef CAS PubMed.
- J. Cai and L. Zhang, Macromol. Biosci., 2005, 5, 539–548 CrossRef CAS PubMed.
- J. Li, K. Han, J. Qi, Z. Teng, M. Li and M. Wang, J. Mater. Sci.: Mater. Electron., 2019, 30, 19415–19425 CrossRef CAS.
- M. Rajesh, R. Manikandan, S. Park, B. C. Kim, W. J. Cho, K. H. Yu and C. J. Raj, Int. J. Energy Res., 2020, 44, 8591–8605 CrossRef CAS.
- K. Kanjana, P. Harding, T. Kwamman, W. Kingkam and T. Chutimasakul, Biomass Bioenergy, 2021, 153, 106206 CrossRef CAS.
- Q. T. Qu, B. Wang, L. C. Yang, Y. Shi, S. Tian and Y. P. Wu, Electrochem. Commun., 2008, 10, 1652–1655 CrossRef CAS.
- T. Yumak, G. A. Yakaboylu, O. Oginni, K. Singh, E. Ciftyurek and E. M. Sabolsky, Colloids Surf., A, 2020, 586, 124150 CrossRef CAS.
- T. Manimekala, R. Sivasubramanian, S. Karthikeyan and G. Dharmalingam, J. Porous Mater., 2023, 30, 289–301, DOI:10.1007/s10934-022-01338-7.
- N. Parveen, A. I. Al-Jaafari and J. I. Han, Electrochim. Acta, 2019, 293, 84–96 CrossRef CAS.
- N. T. Nguyen, P. A. Le and V. B. T. Phung, J. Nanopart. Res., 2020, 22, 1–11 CrossRef.
- X. Wei, S. Wan, X. Jiang, Z. Wang and S. Gao, ACS Appl. Mater. Interfaces, 2015, 7, 22238–22245 CrossRef CAS PubMed.
- O. E. Eleri, K. U. Azuatalam, M. W. Minde, A. M. Trindade, N. Muthuswamy, F. Lou and Z. Yu, Electrochim. Acta, 2020, 362, 137152 CrossRef CAS.
- J. Romanos, M. Beckner, T. Rash, L. Firlej, B. Kuchta, P. Yu, G. Suppes, C. Wexler and P. Pfeifer, Nanotechnology, 2011, 23, 015401, DOI:10.1088/0957-4484/23/1/015401.
- N. Sudhan, K. Subramani, M. Karnan, N. Ilayaraja and M. Sathish, Energy Fuels, 2017, 31, 977–985 CrossRef CAS.
- R. Zakaria, N. A. Jamalluddin and M. Z. Abu Bakar, Results Mater., 2021, 10, 100183 CrossRef CAS.
- J. Niu, R. Shao, J. Liang, M. Dou, Z. Li, Y. Huang and F. Wang, Nano Energy, 2017, 36, 322–330 CrossRef CAS.
- J. Liu, Y. Deng, X. Li and L. Wang, ACS Sustainable Chem. Eng., 2016, 4, 177–187 CrossRef CAS.
- R. Guo, N. Guo, W. Luo, M. Xu, D. Zhou, R. Ma, R. Sheng, J. Guo, D. Jia and L. Wang, Int. J. Energy Res., 2021, 45, 9284–9294 CrossRef CAS.
- V. Subramanian, C. Luo, A. M. Stephan, K. S. Nahm, S. Thomas and B. Wei, J. Phys. Chem. C, 2007, 111, 7527–7531 CrossRef CAS.
- K. Shi, M. Ren and I. Zhitomirsky, ACS Sustainable Chem. Eng., 2014, 2, 1289–1298 CrossRef CAS.
- L. Demarconnay, E. Raymundo-Piñero and F. Béguin, Electrochem. Commun., 2010, 12, 1275–1278 CrossRef CAS.
- E. Sohouli, H. Teymourinia, A. Ramazani and K. Adib, Sci. Rep., 2023, 13, 1–14 CrossRef PubMed.
- J. Zhou, M. Wang and X. Li, J. Porous Mater., 2019, 26, 99–108 CrossRef CAS.
- Y. Sun, Y. Ouyang, J. Luo, H. Cao, X. Li, J. Ma, J. Liu, Y. Wang and L. Lu, Chin. Chem. Lett., 2021, 32, 92–98 CrossRef CAS.
- Z. Chen, X. Peng, X. Zhang, S. Jing, L. Zhong and R. Sun, Carbohydr. Polym., 2017, 170, 107–116 CrossRef CAS PubMed.
- L. Cao, H. Li, Z. Xu, H. Zhang, L. Ding, S. Wang, G. Zhang, H. Hou, W. Xu, F. Yang and S. Jiang, Diamond Relat. Mater., 2021, 114, 108316 CrossRef CAS.
- S. Ahmed, M. Rafat and A. Ahmed, Adv. Nat. Sci.: Nanosci. Nanotechnol., 2018, 9, 035008, DOI:10.1088/2043-6254/aad5d4.
- P. Dai, S. Zhang, H. Liu, L. Yan, X. Gu, L. Li, D. Liu and X. Zhao, Electrochim. Acta, 2020, 354, 136717 CrossRef CAS.
- J. He, D. Zhang, M. Han, X. Liu, Y. Wang, Y. Li, X. Zhang, K. Wang, H. Feng and Y. Wang, J. Energy Storage, 2019, 21, 94–104 CrossRef.
- K. S. Lee, Y. J. Seo and H. T. Jeong, Carbon Lett., 2021, 31, 1041–1049 CrossRef.
- G. A. Yakaboylu, C. Jiang, T. Yumak, J. W. Zondlo, J. Wang and E. M. Sabolsky, Renewable Energy, 2021, 163, 276–287 CrossRef CAS.
- O. O. Olatunji, S. A. Akinlabi, M. P. Mashinini, S. O. Fatoba and O. O. Ajayi, IOP Conf. Ser.: Mater. Sci. Eng., 2018, 423, 15 Search PubMed.
- K. Le Van and T. T. Luong Thi, Prog. Nat. Sci.: Mater. Int., 2014, 24, 191–198 CrossRef CAS.
- E. Y. L. Teo, L. Muniandy, E. P. Ng, F. Adam, A. R. Mohamed, R. Jose and K. F. Chong, Electrochim. Acta, 2016, 192, 110–119 CrossRef CAS.
- T. D. Hoang, Y. Liu and M. T. Le, Sustainability, 2024, 16, 5495, DOI:10.3390/su16135495.
- M. Jayachandran, S. Kishore Babu, T. Maiyalagan, N. Rajadurai and T. Vijayakumar, Mater. Lett., 2021, 301, 130335 CrossRef CAS.
- X. Lu, K. Xiang, W. Zhou, Y. Zhu and H. Chen, Bull. Mater. Sci., 2018, 41, 1–7 CrossRef CAS.
- P. K. Singh, A. K. Das, G. Hatui and G. C. Nayak, Mater. Chem. Phys., 2017, 198, 16–34 CrossRef CAS.
- P. E. Saranya and S. Selladurai, New J. Chem., 2019, 43, 7441–7456 RSC.
- A. J. Sun, J. Niu, M. Liu and J. Ji, Appl. Surf. Sci., 2018, 427, 807–813, DOI:10.1016/j.apsusc.2017.07.220.
- B. S. Girgis, Y. M. Temerk, M. M. Gadelrab and I. D. Abdullah, Carbon Lett., 2007, 8, 95–100 CrossRef.
- D. D. Liu, B. Y. Jia, S. Li, L. J. Dong, J. H. Gao and Y. K. Qin, Asia-Pac. J. Chem. Eng., 2019, 14, 1–12 CrossRef CAS.
- U. F. Hassan, A. A. Sallau, E. O. Ekanem, A. Jauro and A. M. Kolo, Int. J. Adv. Chem., 2021, 9, 34–39 CrossRef.
- T. Guan, K. Li, J. Zhao, R. Zhao, G. Zhang, D. Zhang and J. Wang, J. Mater. Chem. A, 2017, 5, 15869–15878 RSC.
- P. R. Choi, S. G. Kim, J. C. Jung and M. S. Kim, Carbon Lett., 2017, 22, 70–80 Search PubMed.
- P. Sharma, G. Sharma and R. Punia, Appl. Phys. A: Mater. Sci. Process., 2021, 127, 1–7 CrossRef.
- B. Manoj and A. G. Kunjomana, Int. J. Electrochem. Sci., 2012, 7, 3127–3134 CrossRef CAS.
- K. Subramani, N. Sudhan, M. Karnan and M. Sathish, ChemistrySelect, 2017, 2, 11384–11392 CrossRef CAS.
- D. Liu, B. Xu, J. Zhu, S. Tang, F. Xu, S. Li, B. Jia and G. Chen, ACS Omega, 2020, 5, 11058–11067 CrossRef CAS PubMed.
- W. H. Qu, Y. Y. Xu, A. H. Lu, X. Q. Zhang and W. C. Li, Bioresour. Technol., 2015, 189, 285–291 CrossRef CAS PubMed.
- K. Wang, N. Zhao, S. Lei, R. Yan, X. Tian, J. Wang, Y. Song, D. Xu, Q. Guo and L. Liu, Electrochim. Acta, 2015, 166, 1–11 CrossRef CAS.
- E. Köseoǧlu and C. Akmil-Başar, Adv. Powder Technol., 2015, 26, 811–818 CrossRef.
- A. A. Ceyhan, Ö. Şahin, C. Saka and A. Yalçin, J. Anal. Appl. Pyrolysis, 2013, 104, 170–175 CrossRef CAS.
- I. I. Misnon, N. K. M. Zain, R. A. Aziz, B. Vidyadharan and R. Jose, Electrochim. Acta, 2015, 174, 78–86 CrossRef CAS.
- E. C. T. Ba, M. R. Dumont, P. S. Martins, B. da Silva Pinheiro, M. P. M. da Cruz and J. W. Barbosa, Diamond Relat. Mater., 2022, 122, 9–15 CrossRef.
- N. Ramirez, F. Sardella, C. Deiana, A. Schlosser, D. Müller, P. A. Kißling, L. F. Klepzig and N. C. Bigall, RSC Adv., 2020, 10, 38097–38106 RSC.
- S. S. Shah, E. Cevik, M. A. Aziz, T. F. Qahtan, A. Bozkurt and Z. H. Yamani, Synth. Met., 2021, 277, 116765, DOI:10.1016/j.synthmet.2021.116765.
- A. C. Rodrigues, M. G. C. Munhoz, B. S. Pinheiro, A. F. Batista, G. A. Amaral-Labat, A. Cuña, J. T. Matsushima, J. S. Marcuzzo and M. R. Baldan, J. Porous Mater., 2020, 27, 141–149 CrossRef CAS.
- K. Chaitra, T. R. Vinny, P. Sivaraman, N. Reddy, C. Hu, K. Venkatesh, S. C. Vivek, N. Nagaraju and N. Kathyayini, J. Energy Chem., 2017, 26, 56–62 CrossRef.
- N. K. Kalagatur, K. Karthick, J. A. Allen, O. S. N. Ghosh, S. Chandranayaka, V. K. Gupta, K. Krishna and V. Mudili, Front. Pharmacol., 2017, 8, 1–13 Search PubMed.
- A. Bello, F. Barzegar, M. J. Madito, D. Y. Momodu, A. A. Khaleed, T. M. Masikhwa, J. K. Dangbegnon and N. Manyala, RSC Adv., 2016, 6, 68141–68149 RSC.
- R. Sharma, N. Chadha and P. Saini, Indian J. Pure Appl. Phys., 2017, 55, 625–629 Search PubMed.
- T. Yumak, G. A. Yakaboylu, O. Oginni, K. Singh, E. Ciftyurek and E. M. Sabolsky, Colloids Surf., A, 2020, 586, 124150 CrossRef CAS.
- G. Zhong, S. Xu, J. Chao, X. Fu, W. Liao, Y. Xu, Z. Liu and Y. Cao, Ind. Eng. Chem. Res., 2020, 59, 21756–21767 CrossRef CAS.
- D. Momodu, M. Madito, F. Barzegar, A. Bello, A. Khaleed, O. Olaniyan, J. Dangbegnon and N. Manyala, J. Solid State Electrochem., 2017, 21, 859–872 CrossRef CAS.
- C. Ruan, K. Ai and L. Lu, RSC Adv., 2014, 4, 30887–30895 RSC.
- H. Chen, Y. C. Guo, F. Wang, G. Wang, P. R. Qi, X. H. Guo, B. Dai and F. Yu, New Carbon Mater., 2017, 32, 592–599 CrossRef CAS.
- X. L. Su, J. R. Chen, G. P. Zheng, J. H. Yang, X. X. Guan, P. Liu and X. C. Zheng, Appl. Surf. Sci., 2018, 436, 327–336 CrossRef CAS.
- S. J. Rajasekaran and V. Raghavan, J. Electrochem. Sci. Eng., 2023, 13, 215 CrossRef.
- T. N. Nguyen, P. A. Le and V. B. T. Phung, Biomass Convers. Biorefin., 2022, 12, 2407–2416 CrossRef CAS.
- D. Wang, S. Liu, G. Fang, G. Geng and J. Ma, Electrochim. Acta, 2016, 216, 405–411 CrossRef CAS.
- M. Vinayagam, R. Suresh Babu, A. Sivasamy and A. L. Ferreira de Barros, Biomass Bioenergy, 2020, 143, 105838 CrossRef CAS.
- M. Vinayagam, R. Suresh Babu, A. Sivasamy and A. L. F. de Barros, Carbon Lett., 2021, 31, 1133–1143 CrossRef.
- R. Liu, J. X. Wang and W. D. Yang, Nanomaterials, 2022, 14, 3504, DOI:10.3390/nano12193504.
- O. Fasakin, J. K. Dangbegnon, D. Y. Momodu, M. J. Madito, K. O. Oyedotun, M. A. Eleruja and N. Manyala, Electrochim. Acta, 2018, 262, 187–196 CrossRef CAS.
- T. Adinaveen, L. J. Kennedy, J. J. Vijaya and G. Sekaran, J. Ind. Eng. Chem., 2013, 19, 1470–1476 CrossRef CAS.
- J. Mi, X. R. Wang, R. J. Fan, W. H. Qu and W. C. Li, Energy Fuels, 2012, 26, 5321–5329 CrossRef CAS.
- J. Feng, R. Tang, X. Wang and T. Meng, ACS Appl. Energy Mater., 2021, 4, 5230–5236 CrossRef CAS.
- C. Karaman, O. Karaman, N. Atar and M. L. Yola, Phys. Chem. Chem. Phys., 2021, 23, 12807–12821 RSC.
- B. Li, H. Zhang, D. Wang, H. Lv and C. Zhang, RSC Adv., 2017, 7, 37923–37928 RSC.
- D. L. Vu, J. S. Seo, H. Y. Lee and J. W. Lee, RSC Adv., 2017, 7, 4144–4151 RSC.
- J. Xu, Q. Gao, Y. Zhang, Y. Tan, W. Tian, L. Zhu and L. Jiang, Sci. Rep., 2014, 4, 1–6 Search PubMed.
- K. M. Ajay, M. N. Dinesh, G. Byatarayappa, M. G. Radhika, N. Kathyayini and H. Vijeth, Inorg. Chem. Commun., 2021, 127, 108523 CrossRef CAS.
- M. Thommes, K. Kaneko, A. V. Neimark, J. P. Olivier, F. Rodriguez-Reinoso, J. Rouquerol and K. S. W. Sing, Pure Appl. Chem., 2015, 87, 1051–1069 CrossRef CAS.
- L. Zhang, L. Zhang, H. Gu, Y. Chen and G. Z. Chen, J. Alloys Compd., 2021, 883, 160907 CrossRef CAS.
- K. Surya and M. S. Michael, Biomass Bioenergy, 2021, 152, 106175 CrossRef CAS.
- S. Ghosh, R. Santhosh, S. Jeniffer, V. Raghavan, G. Jacob, K. Nanaji, P. Kollu, S. K. Jeong and A. N. Grace, Sci. Rep., 2019, 9, 1–15 CrossRef PubMed.
- Z. Liu, Z. Zhu, J. Dai and Y. Yan, ChemistrySelect, 2018, 3, 5726–5732 CrossRef CAS.
- D. Gandla, X. Wu, F. Zhang, C. Wu and D. Q. Tan, ACS Omega, 2021, 6, 7615–7625 CrossRef CAS PubMed.
- Q. Wei, Z. Chen, Y. Cheng, X. Wang, X. Yang and Z. Wang, Colloids Surf., A, 2019, 574, 221–227 CrossRef CAS.
- K. Manickavasakam, S. Suresh Balaji, S. Kaipannan, A. G. Karthick Raj, S. Veeman and S. Marappan, J. Energy Storage, 2020, 32, 101939 CrossRef.
- A. Bello, N. Manyala, F. Barzegar, A. A. Khaleed, D. Y. Momodu and J. K. Dangbegnon, RSC Adv., 2016, 6, 1800–1809 RSC.
- I. I. Misnon, N. K. M. Zain and R. Jose, Waste Biomass Valorization, 2019, 10, 1731–1740 CrossRef CAS.
- J. Cherusseri, D. Pandey and J. Thomas, Batteries Supercaps, 2020, 3, 860–875, DOI:10.1002/batt.201900230.
- S. I. Wong, H. Lin, J. Sunarso, B. T. Wong and B. Jia, Appl. Mater. Today, 2020, 18, 100522 CrossRef.
- L. Ling and M. Qing-Han, J. Mater. Sci., 2005, 40, 4105–4107 CrossRef.
- M. A. Brza, S. B. Aziz, H. Anuar, E. M. A. Dannoun, F. Ali, R. T. Abdulwahid, S. Al-Zangana and M. F. Z. Kadir, Polymers, 2020, 12, 1–25 Search PubMed.
- S. Najib and E. Erdem, Nanoscale Adv., 2019, 1, 2817–2827 RSC.
- T. V. Thu, T. Van Nguyen, X. D. Le, T. S. Le, V. Van Thuy, T. Q. Huy and Q. D. Truong, Electrochim. Acta, 2019, 314, 151–160 CrossRef CAS.
- M. Haripriya, A. M. Ashok, S. Hussain and R. Sivasubramanian, Ionics, 2021, 27, 325–337 CrossRef CAS.
- M. Haripriya, T. Manimekala, G. Dharmalingam, M. Minakshi and R. Sivasubramanian, Chem.–Asian J., 2024, e202400202 CrossRef CAS PubMed.
- Q. Liu, M. S. Javed, C. Zhang, Y. Li, C. Hu, C. Zhang, M. Lai and Q. Yang, Nanoscale, 2017, 9, 5509–5516 RSC.
- Y. Zhao, M. Hao, Y. Wang, Y. Sha and L. Su, J. Solid State Electrochem., 2016, 20, 81–85 CrossRef CAS.
- H. Wang, H. Yi, X. Chen and X. Wang, J. Mater. Chem. A, 2014, 2, 3223–3230 RSC.
- D. Jacob, P. A. Mini, A. Balakrishnan, S. V. Nair and K. R. V. Subramanian, Bull. Mater. Sci., 2014, 37, 61–69 CrossRef CAS.
- Y. Su, G. Yuan, J. Hu, G. Zhang, Y. Tang, Y. Chen, Y. Tian, S. Wang, M. Shakouri and H. Pang, Adv. Mater., 2024, 36, 2406094 CrossRef CAS PubMed.
- R. M. A. P. Lima, G. S. Dos Reis, M. Thyrel, J. J. Alcaraz-Espinoza, S. H. Larsson and H. P. de Oliveira, Nanomaterials, 2022, 12, 866 CrossRef CAS PubMed.
- X. Zhou, Q. Chen, A. Wang, J. Xu, S. Wu, J. Shen and J. Accepted, ACS Appl. Mater. Interfaces, 2016, 8, 3776–3783 CrossRef CAS PubMed.
- E. G. Calvo, F. Lufrano, P. Staiti, A. Brigandì, A. Arenillas and J. A. Menéndez, J. Power Sources, 2013, 241, 776–782 CrossRef CAS.
- T. Zhang, B. Fuchs, M. Secchiaroli, M. Wohlfahrt-Mehrens and S. Dsoke, Electrochim. Acta, 2016, 218, 163–173 CrossRef CAS.
- W. Zhou, B. He, L. Quan, R. Li, Y. Chen, C. Fan, S. Chen, C. Xu, X. Fan, L. Xing and J. Liu, Adv. Energy Mater., 2023, 13, 1–11 Search PubMed.
- H. Gul, A. u. H. A. Shah and S. Bilal, Polymers, 2019, 11, 1678 CrossRef CAS PubMed.
- P. Kleszyk, P. Ratajczak, P. Skowron, J. Jagiello, Q. Abbas, E. Frąckowiak and F. Béguin, Carbon, 2015, 81, 148–157 CrossRef CAS.
- A. Adan-Mas, L. Alcaraz, P. Arévalo-Cid, F. A. López-Gómez and F. Montemor, Waste Manage., 2021, 120, 280–289 CrossRef CAS PubMed.
- S. J. Rajasekaran, A. N. Grace, G. Jacob, A. Alodhayb, S. Pandiaraj and V. Raghavan, Catalysts, 2023, 13, 286 CrossRef CAS.
- S. Y. Lin and X. Zhang, J. Power Sources, 2015, 294, 354–359 CrossRef CAS.
- P. Dulyaseree and W. Wongwiriyapan, J. Phys.: Conf. Ser., 2021, 1835, 012106 CrossRef CAS.
- Q. Zhang, N. Lin, T. Xu, K. Shen, T. Li, Y. Han, J. Zhou and Y. Qian, RSC Adv., 2017, 7, 39762–39766 RSC.
- D. J. Tarimo, K. O. Oyedotun, A. A. Mirghni, N. F. Sylla and N. Manyala, Electrochim. Acta, 2020, 353, 136498 CrossRef CAS.
- N. S. M. Nor, M. Deraman, R. Omar, E. Taer, A. Awitdrus, R. Farma, N. H. Basri and B. N. M. Dolah, AIP Conf. Proc., 2014, 1586, 68–73 CrossRef CAS.
- G. Ragoisha and Y. Aniskevich, J. Solid State Electrochem., 2021, 25, 753 CrossRef CAS.
- H. S. Magar, R. Y. A. Hassan and A. Mulchandani, Sensors, 2021, 21, 6578, DOI:10.3390/s21196578.
- P. A. Basnayaka, M. K. Ram, E. K. Stefanakos and A. Kumar, Electrochim. Acta, 2013, 92, 376–382 CrossRef CAS.
- W. Zhou, Y. Mo, P. Gao, K. Wang, J. Ke, Z. Liu, S. Chen and J. Liu, Adv. Funct. Mater., 2024, 34, 2312994 CrossRef CAS.
- Y. Chen, Q. He, Y. Zhao, W. Zhou, P. Xiao, P. Gao, N. Tavajohi, J. Tu, B. Li, X. He, L. Xing, X. Fan and J. Liu, Nat. Commun., 2023, 14, 8326 CrossRef CAS PubMed.
- H. J. Jiang, T. C. Underwood, J. G. Bell, S. Ranjan, D. Sasselov and G. M. Whitesides, Proc. Natl. Acad. Sci. U. S. A., 2017, 120, 2017 Search PubMed.
- Y. Lu, C. Z. Zhao, J. Q. Huang and Q. Zhang, Joule, 2022, 6, 1172–1198 CrossRef CAS.
- Y. Mo, W. Zhou, K. Wang, K. Xiao, Y. Chen, Z. Wang, P. Tang, P. Xiao, Y. Gong, S. Chen, P. Gao and J. Liu, ACS Energy Lett., 2023, 8, 995–1002 CrossRef CAS.
- P. S. Joshi and D. S. Sutrave, Int. J. ChemTech Res., 2018, 11(9), 77–88 CrossRef CAS.
- M. Sethi, U. S. Shenoy and D. K. Bhat, Nanoscale Adv., 2020, 2, 4229–4241 RSC.
- A. M. Teli, S. A. Beknalkar, D. S. Patil, S. A. Pawar, D. P. Dubal, V. Y. Burute, T. D. Dongale, J. C. Shin and P. S. Patil, Appl. Surf. Sci., 2020, 511, 145466 CrossRef CAS.
- Y. Tang, Y. Shi, Y. Su, S. Cao, J. Hu, H. Zhou, Y. Sun, Z. Liu, S. Zhang, H. Xue and H. Pang, Adv. Sci., 2024, 11, 2403802 CrossRef CAS PubMed.
- M. Alzaid, F. Alsalh and M. Z. Iqbal, J. Energy Storage, 2021, 40, 102751 CrossRef.
- F. Licht, M. A. Davis and H. A. Andreas, J. Power Sources, 2020, 446, 227354 CrossRef CAS.
- F. Cheng, X. Yang, S. Zhang and W. Lu, J. Power Sources, 2020, 450, 227678 CrossRef CAS.
- B. Balamuralitharan, S. N. Karthick, S. K. Balasingam, K. V. Hemalatha, S. Selvam, J. A. Raj, K. Prabakar, Y. Jun and H. J. Kim, Energy Technol., 2017, 5, 1953–1962 CrossRef CAS.
- S. Mondal, N. Aravindan and M. V. Sangaranarayanan, Electrochim. Acta, 2019, 324, 134875 CrossRef CAS.
- S. Kulandaivalu, N. Suhaimi and Y. Sulaiman, Sci. Rep., 2019, 9, 1–10 CrossRef CAS PubMed.
- M. Maher, S. Hassan, K. Shoueir, B. Yousif and M. E. A. Abo-Elsoud, J. Mater. Res. Technol., 2021, 11, 1232–1244 CrossRef CAS.
- A. A. Yadav, Thin Solid Films, 2016, 608, 88–96 CrossRef CAS.
- Q. Wu, T. He, Y. Zhang, J. Zhang, Z. Wang, Y. Liu, L. Zhao, Y. Wu and F. Ran, J. Mater. Chem. A, 2021, 9, 24094–24147 RSC.
- D. Weingarth, A. Foelske-Schmitz and R. Kötz, J. Power Sources, 2013, 225, 84–88 CrossRef CAS.
- R. K. Mishra, G. J. Choi, H. J. Choi, J. Singh, F. S. Mirsafi, H. G. Rubahn, Y. K. Mishra, S. H. Lee and J. S. Gwag, Chem. Eng. J., 2022, 427, 131895 CrossRef CAS.
- A. Bello, F. Barzegar, M. J. Madito, D. Y. Momodu, A. A. Khaleed, T. M. Masikhwa, J. K. Dangbegnon and N. Manyala, Electrochim. Acta, 2016, 213, 107–114 CrossRef CAS.
- R. H. I. Keyla, G. T. L. Leticia, S. C. E. Maximiano and T. G. L. Carlos, J. Mater. Sci.: Mater. Electron., 2021, 32, 21432–21440 CrossRef CAS.
- C. Moreno-Castilla, H. García-Rosero and F. Carrasco-Marín, Materials, 2017, 10, 747, DOI:10.3390/ma10070747.
- N. F. Sylla, S. Sarr, N. M. Ndiaye, B. K. Mutuma, A. Seck, B. D. Ngom, M. Chaker and N. Manyala, Nanomaterials, 2021, 11, 1056 CrossRef CAS PubMed.
- G. Yuan, Y. Su, X. Zhang, B. Gao, J. Hu, Y. Sun, W. Li, Z. Zhang, M. Shakouri and H. Pang, Natl. Sci. Rev., 2024, 11(10), nwae336 CrossRef PubMed.
- S. Yun Zhou, X. Hai Li, Z. Xing Wang, H. Jun Guo and W. Jie Peng, Trans. Nonferrous Met. Soc. China, 2007, 1328–1333 CrossRef.
- A. Babu Rajendran, G. Manivannan, K. Jothivenkatachalam and S. Karthikeyan, Rasayan J. Chem., 2015, 8, 330–338 Search PubMed.
- W. Kang, G. Huang, Q. Geng, W. Hou, Y. Yao, B. Xu, B. Xing and C. Zhang, Mater. Sci., 2018, 24, 247–252 CrossRef.
- F. Barzegar, A. Bello, J. K. Dangbegnon, N. Manyala and X. Xia, Appl. Energy, 2017, 207, 417–426 CrossRef CAS.
- R. K. Mishra, G. J. Choi, Y. Sohn, S. H. Lee and J. S. Gwag, Mater. Lett., 2019, 253, 250–254 CrossRef CAS.
- B. W. Ricketts, J. Power Sources, 2000, 89, 64–69 CrossRef CAS.
- C. H. Yang, Q. D. Nguyen, T. H. Chen, A. S. Helal, J. Li and J. K. Chang, ACS Sustainable Chem. Eng., 2018, 6, 1208–1214 CrossRef CAS.
- Z. Wang, Z. Xu, H. Huang, X. Chu, Y. Xie, D. Xiong, C. Yan, H. Zhao, H. Zhang and W. Yang, ACS Nano, 2020, 14, 4916–4924 CrossRef CAS PubMed.
- M. Haque, Q. Li, A. D. Smith, V. Kuzmenko, P. Rudquist, P. Lundgren and P. Enoksson, J. Power Sources, 2020, 453, 227897 CrossRef CAS.
- M. Shanmuga Priya, P. Divya and R. Rajalakshmi, Sustainable Chem. Pharm., 2020, 16, 100243 CrossRef.
- S. Rawat, R. K. Mishra and T. Bhaskar, Chemosphere, 2022, 286, 131961 CrossRef CAS PubMed.
- M. A. Perea-Moreno, F. Manzano-Agugliaro, Q. Hernandez-Escobedo and A. J. Perea-Moreno, Sustainability, 2018, 10, 1–15 CrossRef.
- T. Purkait, G. Singh, M. Singh, D. Kumar and R. S. Dey, Sci. Rep., 2017, 7, 1–14 CrossRef CAS PubMed.
- G. Murali, S. Harish, S. Ponnusamy, J. Ragupathi, H. A. Therese, M. Navaneethan and C. Muthamizhchelvan, Appl. Surf. Sci., 2019, 492, 464–472 CrossRef CAS.
- X. He, P. Ling, J. Qiu, M. Yu, X. Zhang, C. Yu and M. Zheng, J. Power Sources, 2013, 240, 109–113 CrossRef CAS.
- M. d. C. Rojas, M. L. Nieva Lobos, M. L. Para, M. E. González Quijón, O. Cámara, D. Barraco, E. L. Moyano and G. L. Luque, Biomass Bioenergy, 2021, 146, 105971 CrossRef CAS.
- Y. Zhan, H. Zhou, F. Guo, B. Tian, S. Du, Y. Dong and L. Qian, J. Energy Storage, 2021, 34, 102180 CrossRef.
- K. Liang, Y. Chen, S. Wang, D. Wang, W. Wang, S. Jia, N. Mitsuzakic and Z. Chen, J. Energy Storage, 2023, 70, 107947 CrossRef.
- N. T. Nguyen, P. A. Le and V. B. T. Phung, Chem. Eng. Sci., 2021, 229, 116053 CrossRef CAS.
- Y. Zhang, H. Wei, H. Kimura, D. Wu, X. Xie, X. Y. Yang, C. Hou, X. Sun and W. Du, Ceram. Int., 2022, 48, 34576–34583 CrossRef CAS.
- X. He, R. Li, J. Han, M. Yu and M. Wu, Mater. Lett., 2013, 94, 158–160 CrossRef CAS.
- Z. Xiao, W. Chen, K. Liu, P. Cui and D. Zhan, Int. J. Electrochem. Sci., 2018, 13, 5370–5381 CrossRef CAS.
- X. He, K. Xie, R. Li and M. Wu, Land, 2014, 10, 1016 Search PubMed.
- W. Kang, B. Lin, G. Huang, C. Zhang, Y. Yao, W. Hou, B. Xu and B. Xing, J. Mater. Sci.: Mater. Electron., 2018, 29, 6361–6368 CrossRef CAS.
- N. Yadav, M. K. Singh, N. Yadav and S. A. Hashmi, J. Power Sources, 2018, 402, 133–146 CrossRef CAS.
- N. F. Sylla, N. M. Ndiaye, B. D. Ngom, D. Momodu, M. J. Madito, B. K. Mutuma and N. Manyala, Sci. Rep., 2019, 9, 1–15 CrossRef CAS PubMed.
- F. Guo, X. Jiang, X. Li, K. Peng, C. Guo and Z. Rao, J. Mater. Sci.: Mater. Electron., 2019, 30, 914–925 CrossRef CAS.
- Y. Wen, L. Chi, X. Wen, X. Chen and E. Mijowska, Adv. Electron. Mater., 2020, 6, 1–10 Search PubMed.
- D. J. Tarimo, K. O. Oyedotun, A. A. Mirghni, B. Mutuma, N. F. Sylla, P. Murovhi and N. Manyala, Int. J. Hydrogen Energy, 2020, 45, 33059–33075 CrossRef CAS.
- D. J. Tarimo, K. O. Oyedotun, A. A. Mirghni, N. F. Sylla and N. Manyala, Electrochim. Acta, 2020, 353, 136498 CrossRef CAS.
- L. Pandey, S. Sarkar, A. Arya, A. L. Sharma, A. Panwar, R. K. Kotnala and A. Gaur, Biomass Convers. Biorefin., 2021, 1–10 Search PubMed.
- M. Muthu Balasubramanian, M. Subramani, D. Murugan and S. Ponnusamy, Ionics, 2020, 26, 6297–6308 CrossRef CAS.
- S. Liu, Q. Zhang, J. Liu, J. Li, W. Liu, Y. Wang and S. Yuan, Int. J. Mol. Sci., 2024, 25, 7583 CrossRef CAS PubMed.
- X. Jiang, F. Guo, X. Jia, Y. Zhan, H. Zhou and L. Qian, J. Energy Storage, 2020, 30, 101451 CrossRef.
- M. F. Wu, C. H. Hsiao, C. Y. Lee and N. H. Tai, ACS Omega, 2020, 5, 14417–14426 CrossRef CAS PubMed.
- N. F. Sylla, N. M. Ndiaye, B. D. Ngom, B. K. Mutuma, D. Momodu, M. Chaker and N. Manyala, J. Colloid Interface Sci., 2020, 569, 332–345 CrossRef CAS PubMed.
- W. O. Makinde, M. A. Hassan, Y. Pan, G. Guan, N. López-Salas and A. S. G. Khalil, J. Alloys Compd., 2024, 991, 174452 CrossRef CAS.
- Y. Qiao, C. Zhang, F. Kong, Q. Zhao, A. Kong and Y. Shan, Waste Manage., 2021, 125, 257–267 CrossRef CAS PubMed.
- F. Guo, X. Jiang, X. Jia, S. Liang, L. Qian and Z. Rao, J. Electroanal. Chem., 2019, 844, 105–115 CrossRef CAS.
- A. Sandeep and A. V. Ravindra, Diamond Relat. Mater., 2024, 146, 111158 CrossRef CAS.
- Z. Hu, X. Li, Z. Tu, Y. Wang, O. D. Dacres, Y. Sun, M. Sun and H. Yao, Fuel Process. Technol., 2020, 205, 106430 CrossRef CAS.
- A. Ariharan and B. Viswanathan, Indian J. Chem. Technol., 2018, 25, 140–149 CAS.
- X. Li, H. Tian, S. Yan, H. Shi, J. Wu, Y. Sun, Y. Xing, H. Bai and H. Zhang, Int. J. Hydrogen Energy, 2024, 50, 324–336 CrossRef CAS.
- G. Bharath, K. Rambabu, F. Banat, A. Hai, A. F. Arangadi and N. Ponpandian, Sci. Total Environ., 2019, 691, 713–726 CrossRef CAS PubMed.
- J. Ding, H. Wang, Z. Li, K. Cui, D. Karpuzov, X. Tan, A. Kohandehghan and D. Mitlin, Energy Environ. Sci., 2015, 8, 941–955 RSC.
- W. Lv, F. Wen, J. Xiang, J. Zhao, L. Li, L. Wang, Z. Liu and Y. Tian, Electrochim. Acta, 2015, 176, 533–541 CrossRef CAS.
- K. R. A. Saravanan, N. Prabu, M. Sasidharan and G. Maduraiveeran, Appl. Surf. Sci., 2019, 489, 725–733 CrossRef CAS.
| This journal is © The Royal Society of Chemistry 2025 |