
 Open Access Article
 This Open Access Article is licensed under a Creative Commons Attribution-Non Commercial 3.0 Unported Licence
CNT encapsulated nickel-doped hollow porous manganese oxide scaffold as a sulfur cathode host for Li–S battery applications†
Arunakumari Nulu a,
Venugopal Nulua,
Hee Cheol Kimb and
Keun Yong Sohn*a
a,
Venugopal Nulua,
Hee Cheol Kimb and
Keun Yong Sohn*a
aDepartment of Nanoscience and Engineering, Center for Nano Manufacturing, Inje University, 197 Inje-ro, Gimhae, Gyeongnam-do 50834, Republic of Korea. E-mail: ksohn@inje.ac.kr
bDepartment of AI and Software, Inje University, 197 Inje-ro, Gimhae, Gyeongnam-do 50834, Republic of Korea
First published on 27th January 2025
Abstract
Recently, lithium–sulfur batteries have captivated those in the energy storage industry due to the low cost and high theoretical capacity of the sulfur cathode (1675 mA h g−1). However, to enhance the practical usability of Li–S batteries, it is crucial to address issues such as the insulating nature of sulfur cathodes and the high solubility of lithium polysulfides (LiPS, Li2Sx, 4 ≤ n ≤ 8) that cause poor active sulfur utilization. Designing innovative sulfur hosts can effectively overcome sulfur bottlenecks and achieve stable Li–sulfur batteries. This study presents novel hollow porous structures of Ni-doped MnO2 encapsulated with multi-walled carbon nanotubes (CNTs) used as an efficient host material for a sulfur cathode. These hollow, porous, hierarchical structures, combined with transition metal (Ni) doping, serve to enhance the adsorption of LiPS and contribute to improved redox kinetics during the electrochemical process. Furthermore, the remarkable conductivity provided by the CNT encapsulation significantly enhances the sulfur and LiPS conversion kinetics, effectively suppressing the undesirable shuttling effect and promoting efficient utilization of the active material. The prepared cathode (S@Ni-MO/CNT) not only meets but exceeds expectations, delivering superior cyclability, rate capability results, and improved Li-diffusion properties. These results underscore the effectiveness of constructing novel host materials for sulfur cathodes, leaving no doubt about the potential of this novel host material to address the challenges in lithium–sulfur batteries.
1 Introduction
The ever-increasing demand for high-energy/power-density storage systems with low cost, safety, and long-term stability is essential for portable electronics devices, electric vehicles, medical devices, and grid storage applications.1–3 The demand for portable energy storage systems is steadily growing across various essential sectors, such as military, pharmaceutical, medical, and space applications.4–7 Over the past few decades, researchers have concentrated on advancing Li-based rechargeable battery technologies through the development of new chemical compositions and innovative anode and cathode materials, aiming to achieve higher energy and power densities.8,9 Conventional lithium-ion batteries (LIBs) that utilize graphite anodes and Li-metal oxide (LMO) cathodes fail to meet the demand for higher energy densities due to the constrained theoretical capacities of graphite (372 mA h g−1) and LMO cathodes (270 mA h g−1). These limitations impede the further advancement of LIB technology.10,11 In this context, secondary lithium–sulfur (Li–S) batteries have emerged as a promising high-energy battery system. They rely on the pairing of a lightweight metallic Li-anode (theoretical capacity of 3860 mA h g−1) with a low-cost sulfur cathode (theoretical capacity of 1675 mA h g−1), which allows for high theoretical gravimetric (2500 W h kg−1) and volumetric energy densities (2800 W h L−1).12–14 Owing to their safer operational potentials (∼2.1 V), high capacities exceeding 700 mA h g−1, and impressive long cycle life collectively poised Li–S batteries for future energy storage applications.15,16 Despite the many advantages, there are still some challenges to commercialize sulfur-based batteries. These include addressing the insulating properties of sulfur, managing the significant volume expansion (∼80%) during lithium–redox reactions, and finding solutions to the diffusion of soluble reaction intermediates, such as polysulfides (LiPS, Li2Sn, where 4 ≤ n ≤ 8), which can result in the loss of active sulfur.17,18Researchers have made many developments to improve the electrochemical performance of sulfur cathodes. Designing sulfur hosts with high conductivity, large surface area, strong electrocatalytic properties, and great adsorption abilities are crucial to stabilizing sulfur cathodes. Incorporating sulfur into different carbon/carbonaceous materials with high conductivity and large surface area, such as CNTs, graphene, graphite, mesoporous carbons, hollow porous carbons, and carbon nanofibers (CNFs), etc., is one of the efficient ways to stabilize the sulfur cathodes.19–23 These hosts provide the required conductivity to sulfur and restrain polysulfide dissolution, eventually leading to high capacities. Though capacities increased, in due course, they declined and failed to stabilize due to the nonpolar nature of carbons, which cannot absorb polysulfides efficiently. Therefore, researchers have indeed focused on using polar materials with electrocatalytic properties as a host material for sulfur cathodes, which could increase the kinetics of the conversion reactions of dissolved polysulfides into final reaction products, Li2S2/Li2S or S8, which significantly increase the utilization of sulfur active material.24,25 Different types of transition metal compounds, including oxides,26,27 nitrides,28,29 sulfides,30,31 and selenides,32,33 etc. have attracted significant attention owing to their excellent absorption ability to LiPS.
Among these, MnO2 has attracted significant attention due to its high polarity, cost-effectiveness, and wide availability, making it an excellent choice as a host material for the sulfur cathode.34,35 Well-ordered porous MnO2 hierarchical structures with a large surface area and strong absorption capabilities are proposed for scavenging LiPS and to effectively confining them.36,37 All these properties of MnO2 significantly enhance the cycling performance of the sulfur cathode. A diverse range of hollow manganese dioxide (MO) structures, including spheres, tubes, and urchin-like forms, has been successfully developed through various synthesis strategies.38–43 These approaches include hard-template techniques, soft-template assembly, Ostwald ripening processes, oxidation etching, carbonization of manganese-based metal–organic frameworks (MOFs), and hydrothermal methods. While these methodologies exhibit significant promise, challenges persist regarding template removal through acid or base etching. Such processes can adversely affect the structural integrity of the resultant materials. Furthermore, the specific conditions and elevated temperatures required for carbonization can complicate the synthesis process and substantially increase production costs. Consequently, the synthesis of hollow porous MnO2 structures remains an ongoing challenge, with a critical need for more efficient and straightforward methods for template removal in order to advance practical applications in this domain. In this study, hollow structures were fabricated using a modified, facile chemical method followed by an annealing treatment. One of the main advantages of this synthesis approach is that it can be performed at room temperature, utilizing a quick, water-soluble template, and subsequently annealed at low temperatures. The resulting hollow and porous nanostructures are expected to improve the electrochemical properties of MnO2 (MO) by providing a large surface area, low density, and a vital buffer volume during redox reactions.
Yet, the inadequate electronic and ionic conductivity of MnO2 cannot provide the necessary conductivity to the sulfur/LiPS, resulting in decreased cycle life and poor active material utilization. This limitation underscores the need for critical solutions to address the conductivity issue and improve the overall performance of the sulfur cathode. Recently, metal (Co, Ni, Fe, etc.) doping into active materials has been a good strategy to overcome the finite electronic conductivity issue, which can increase interparticle conductivity and provide ionic channels for Li-redox reactions.44–47 Along with metal doping, a highly conductive carbon matrix is also needed to maintain good electronic conductivity, low internal resistance, and faster reaction kinetics of host material throughout the electrochemical process. CNTs exhibit excellent electrical conductivity and superior thermal and mechanical properties, suitable as conductive additives to electrode materials.48,49 Dong et al. designed MnO2 with rGO/CNT carbon framework as a host for a sulfur cathode, which delivered 780 mA h g−1 capacity at 0.5C after 200 cycles and showed excellent electrochemical properties.26 Wei et al. developed a novel metal oxide-based material, Co@NCNTs/Co-TiO2, as a dual-functional material. The material showed a high rate capability of 879.6 mA h g−1 at 5C with low capacity decay, indicating the importance of critical designing factors of host materials.50
Considering the above-mentioned concerns, the innovative structures of nickel-doped hollow porous MnO2 encapsulated with CNTs (Ni-MO/CNT) were meticulously designed using a one-pot single-step sol–gel approach, followed by a composite formation with CNTs through an annealing process. Subsequently, the host material was impregnated with sulfur and examined as a cathode material for Li–S battery applications. As expected, the prepared sulfur-infused Ni-MO/CNT (S@Ni-MO/CNT) showed excellent cyclability and rate capability results. Moreover, impedance studies of the prepared cathode showed improved Li-ion diffusion properties. These excellent electrochemical properties could be due to the enhanced adsorption of LiPS and improved redox kinetics by Ni-MO. The remarkable conductivity provided by the CNTs encapsulation significantly enhances the sulfur and LiPS conversion kinetics, effectively suppressing the undesirable shuttling effect and promoting efficient utilization of the active material.
2 Results and discussion
CNTs encapsulated in nickel-doped hollow manganese oxide structures were prepared by a one-step sol–gel method followed by an annealing approach. Initially, the stoichiometric amounts of Mn(NO3)2·6H2O and Ni(NO3)2·6H2O were dissolved in 100 ml of propanol solvent and stirred to make a uniform solution. Then, the calculated amount of Li2O2 template was added to the above solution, resulting in the neutralization of nitrate precursors, forming LiNO3 and evaluating oxygen, which oxidized Mn(II) into MnOx. During the reaction, Li2O2 particles undergo gradual coverage with an in situ-formed Ni-MnOx layer, approximately 50–100 nm in size. Subsequent washing with water and ethanol removes the Li2O2 particles entirely, resulting in the formation of hollow particles of the δ-Ni-doped MnO2 phase. The resulting powder is then dried overnight at room temperature. Following this, the powder is heat treated at 500 °C for 1 hour to facilitate the formation of the λ phase of Ni-doped MnO2 (Ni-MO). Furthermore, subjecting the material to high-temperature annealing facilitates the incorporation of Ni and promotes the crystallization of the hollow particles. This process results in the production of nanoparticles with meso/nanoporous walls, signifying progress. As shown in Fig. 1, the prepared Ni-MO material was combined with CNTs in the ratio of 75![[thin space (1/6-em)]](https://www.rsc.org/images/entities/char_2009.gif) :25 ratio and subjected to annealing at 500 °C for 2 h to make CNTs encapsulated Ni-MO structures (Ni-MO@CNT). Later, the sulfur powder was loaded into prepared host Ni-MO@CNT structures by typical impregnation technique by heat treating the sulfur and Ni-MO@CNTs mixture at 155 °C for 12 h in an argon atmosphere to obtain S/Ni-MO@CNT cathode material. The specially designed hollow-porous structure of Ni-MO creates abundant space and active interfaces for storing sulfur, effectively minimizing sulfur volume changes during cycling. Moreover, the strong polar absorption ability of Ni-MO frameworks could accelerate the catalytic conversion reactions of LiPS. At the same time, the doped Ni nanoparticles can improve the catalytic properties as well as the conductivity of MO. Furthermore, the encapsulated CNTs greatly enhance the electronic conductivity of Ni-MO hollow structures and increase the physical confinement of LiPS, eventually increasing the active sulfur utilization. As a result, the prepared cathode material showed remarkable electrochemical properties, including enhanced Li-diffusion characteristics, cyclability, and rate capability.
:25 ratio and subjected to annealing at 500 °C for 2 h to make CNTs encapsulated Ni-MO structures (Ni-MO@CNT). Later, the sulfur powder was loaded into prepared host Ni-MO@CNT structures by typical impregnation technique by heat treating the sulfur and Ni-MO@CNTs mixture at 155 °C for 12 h in an argon atmosphere to obtain S/Ni-MO@CNT cathode material. The specially designed hollow-porous structure of Ni-MO creates abundant space and active interfaces for storing sulfur, effectively minimizing sulfur volume changes during cycling. Moreover, the strong polar absorption ability of Ni-MO frameworks could accelerate the catalytic conversion reactions of LiPS. At the same time, the doped Ni nanoparticles can improve the catalytic properties as well as the conductivity of MO. Furthermore, the encapsulated CNTs greatly enhance the electronic conductivity of Ni-MO hollow structures and increase the physical confinement of LiPS, eventually increasing the active sulfur utilization. As a result, the prepared cathode material showed remarkable electrochemical properties, including enhanced Li-diffusion characteristics, cyclability, and rate capability.
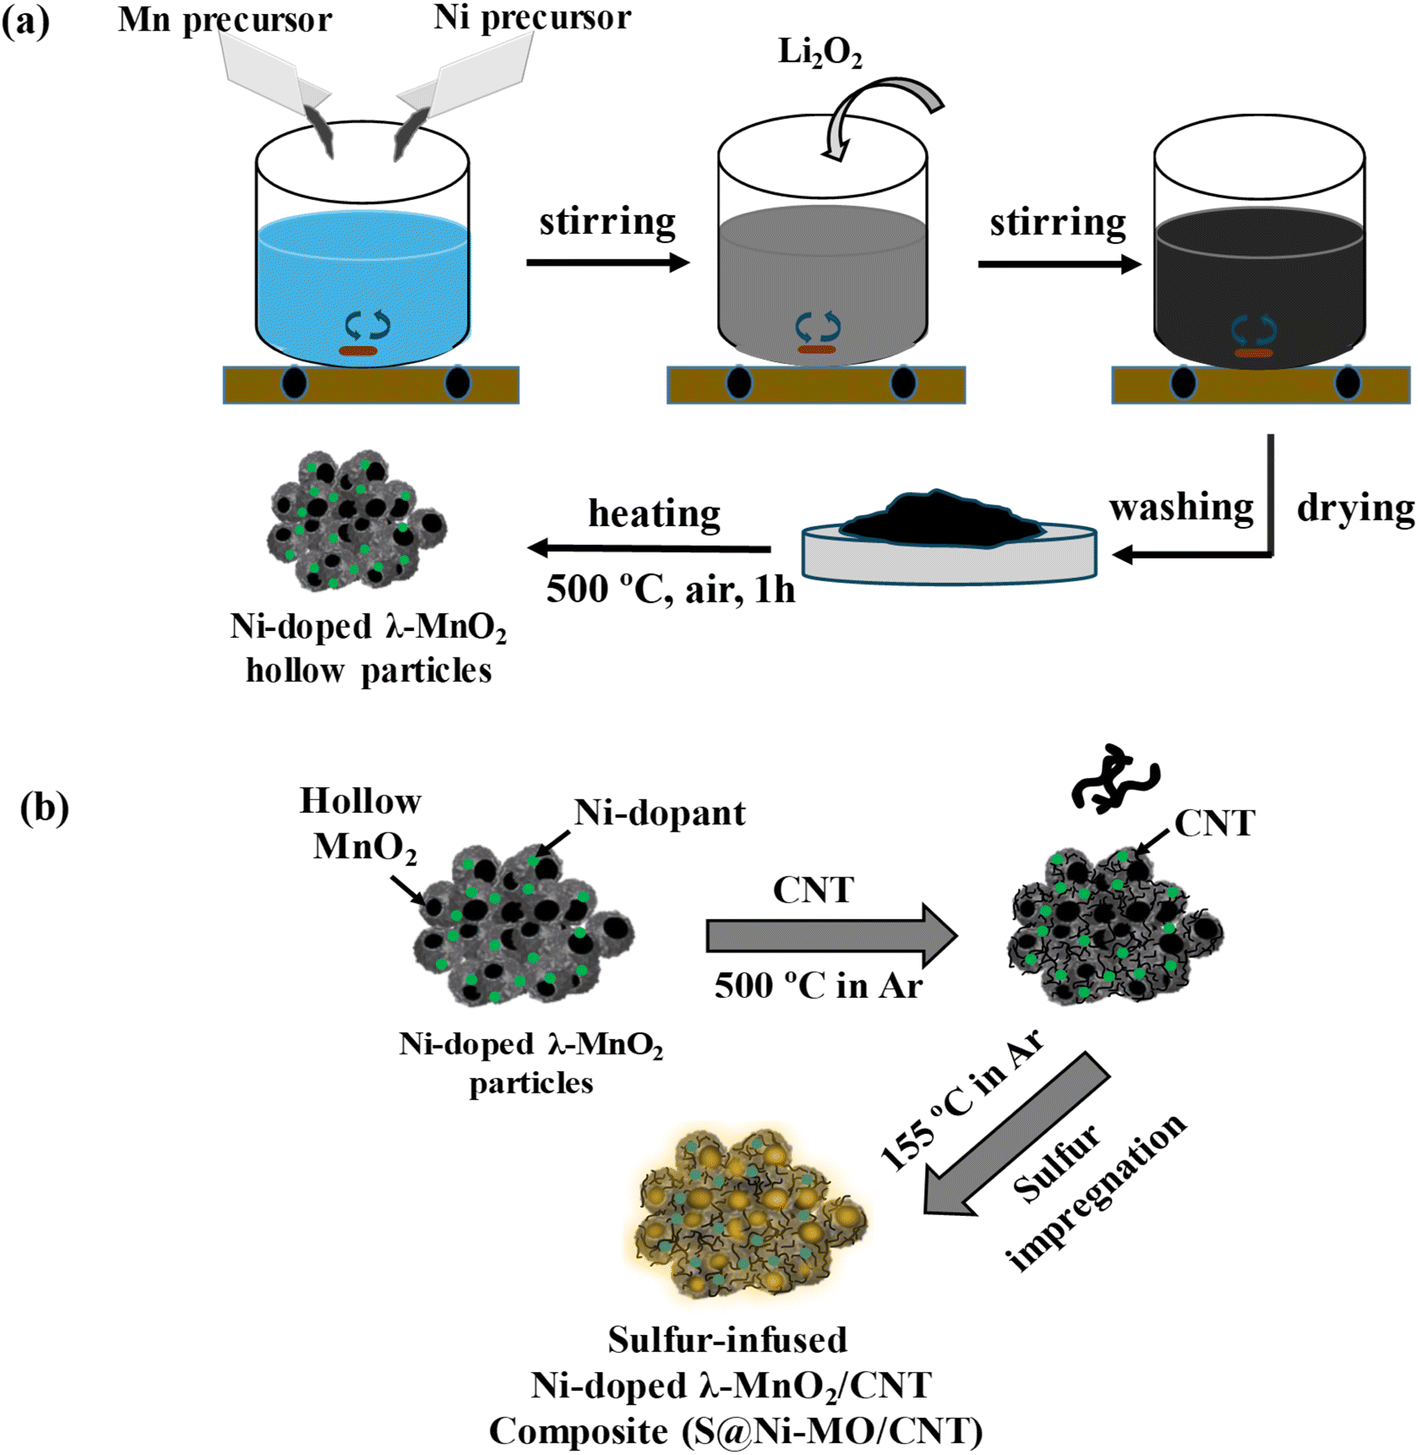 | ||
| Fig. 1 (a) Step-by-step synthesis process of Ni-doped hollow λ-MnO2 particles (b) preparation of S@Ni-MO/CNT composite cathode. | ||
Fig. S1† depicts the XRD patterns of CNTs, MO, and Ni-MO, while Fig. 2 shows the XRD patterns of sulfur, S@CNT, S@MO, S@Ni-MO, and S@Ni-MO/CNT. The diffraction spectra of CNTs showed peaks around 2θ = 25.7° and 42.8°, corresponding to (002) and (100) planes of stacked graphene sheets, confirming the CNTs.19 The synthesized MO and Ni-MO diffraction patterns showed (111), (311), (400), (511), and (440) planes, indexed to 3D-spinal structures of λ-MnO2 (JCPDS card no. 440992). No other impurity peaks were observed, confirming no possible side reactions. An interesting observation is that the (400) peak of Ni-MO slightly shifted towards the left, compared to the (400) peak of MO, indicating the successful doping of Ni-into the spinal structures of λ-MnO2.46,47 The pure sulfur XRD patterns from Fig. 2 display distinct crystalline peaks at 2θ = 23.1°, 25.8°, 27.8°, and 31.4°, which align with the (222), (026), (040), and (044) planes of the orthorhombic phases of crystalline sulfur (JCPDS no. 08-0247). From the diffraction patterns of S@CNT, S@MO, S@Ni-MO, and S@Ni-MO/CNT, it is worth noting that all composite materials exhibited patterns similar to pure sulfur, indicating successful coverage of the surface and hollow pores of MO with sulfur.26 In addition to the sulfur peaks, S@CNT and S@Ni-MO/CNT composites displayed peaks around 26°, revealing the presence of (002) planes of CNTs in both samples, as depicted in the inset. The BJH isotherms of MO and Ni-MO samples are depicted in Fig. S2.† As per IUPAC, isotherms are distinguished into 4 – types: I, II, III, and IV. The isotherms in the isotherms in Fig. S2a,† illustrate the initial N2 uptake at a low relative pressure (p/po) of 0.2, indicating the presence of a small number of micropores. The observed type IV hysteresis loop from 0.2 to 0.9 is linked to the mesopores in the prepared samples. Fig. S2a† shows the initial N2 uptake at low relative pressure (p/po) 0.2, which is accredited to the small number of micropores, where type IV hysteresis loop, which was witnessed from 0.2–0.9, is related to the mesopores in the prepared samples. The loop above 0.9 indicates that the mesopores are inter-crystalline pores due to the aggregated nanocrystals.46,47 The BJH pore size distribution curves are shown in Fig. S2b,† where MO shows wide mesopores between 3–6 nm, whereas Ni-MO shows meso/nanopores 7–20 nm, respectively. The surface area of MO is 35.5 m2 g−1, while the surface area of Ni-MO is 63.6 m2 g−1. The increased surface area of Ni-MO results from the presence of extra pores formed by Ni-doping. The same findings have been documented in the literature.51,52 The enhanced surface area facilitates faster Li+ transportation, and the meso/nanoporous Ni-MO enables quick wetting of the active material and provides ample buffering volume for elemental sulfur.
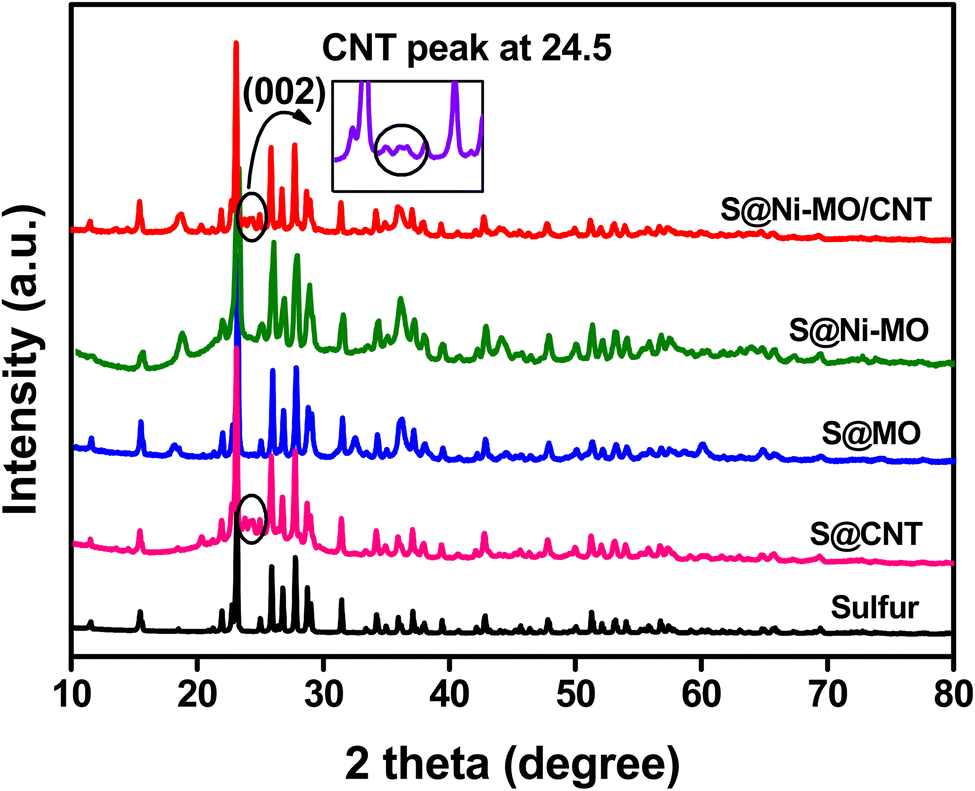 | ||
| Fig. 2 XRD patterns of pure sulfur, S@CNT, S@MO, S@Ni-MO and S@Ni-MO/CNT composite cathode s (inset shows the (002) peaks of carbon). | ||
Fig. 3a and b show the SEM images of prepared MO and Ni-MO materials, respectively. Both materials showed disorderly arranged hollow nanoparticles from 100 to 300 nm, with hollow interiors with an average shell thickness of 70–80 nm. The surface of each nanoparticle is covered with numerous thin (∼10 nm) nanoflakes. These hollow structures afford effective space and high active sulfur loading. The thin nano flakes confine the active sulfur and LiPS and hamper the shuttle effect. The doped Ni can improve the conductivity of MO material, which eventually improves the Li+ redox reactions. The atomic percentage of doped nickel in the Ni-MO sample was carefully analyzed using ICP-AES (Inductively Coupled Plasma Atomic Emission Spectroscopy). The results revealed that the cobalt content in Ni-MO is 17.23%, which closely aligns with the nickel doping concentration. This finding provides strong evidence for the successful doping of cobalt into MO. The TEM images presented in Fig. 3c illustrate the effective combination of CNTs with Ni-MO structures and form stable framework structures, demonstrating improved structural stability during Li+ redox reactions. Moreover, the CNTs afford essential electronic conductivity of the host material.26 The in-depth Ni-MO/CNT morphology and structure analysis are studied using selected area electron diffraction (SAED) and STEM-EDS techniques. Furthermore, the inset of Fig. 3b showcases the SEAD pattern, indexed with (111), (311), and (400) corresponding to λ-MO, while the (002) plane relates to CNTs within the composite material, aligning well with the XRD result. A closer view of Ni-MO/CNT is shown in Fig. 3d, where the surface nano-thin flakes and CNTs are marked with blue and red colors. The high-resolution TEM (HR-TEM) was performed in the blue and red regions, shown in Fig. 3e and f, respectively. From Fig. 3e, most of the external surface displayed lattice fringes with an interplanar distance of approximately 0.49 nm, representing the (111) plane of λ-MnO2 (PDF no. 42-1169). Additionally, a lattice fringe with an interplanar spacing of 0.2 nm was identified, which aligns with the cubic phase (111) plane of Ni.46,47 The HR-TEM image of the red region from Fig. 3d is displayed in Fig. 3f, which displays the lattice fringes with d-spacing 0.34 nm respective to the (002) plane of CNT.49 The STEM-EDS image and respective elemental mapping images of Ni-MO/CNT material are depicted in Fig. S3,† indicating the presence of Mn, Ni, O, and C in the composite. This result is also confirmed by the respective STEM-EDS spectrum shown in Fig. S3e.† The SEM images of the prepared cathode S@Ni-MO/CNT are shown in Fig. 4a and b. The images clearly show that CNTs are well-bound to the composite material. The SEM-EDS results of S@Ni-MO/CNT are shown in Fig. S4,† which shows the presence of Mn, Ni, O C, and S in the composite and are further confirmed by the SEM-EDS spectra shown in Fig. S4g.† The TEM images of the composite are shown in Fig. 4c and d, indicating that the structures are integrated with CNTs and afford excellent structural stability and significant conductivity to the composite cathode. The HR-TEM images of the specified part from Fig. 4d are clearly shown in Fig. 4e. The lattice planes with d-spacing of 0.46 nm and 0.39 nm are definitively indexed to the (111) plane of MnO2 and the (222) plane of sulfur, respectively. The other two planes identified with a lattice spacing of 0.2 nm and 0.34 nm are indexed to the planes of (111) of Ni and the (002) of CNTs, respectively. The STEM-EDS image and corresponding elemental mapping of S@Ni-MO/CNT are presented in Fig. 4f–k. These results provide strong evidence supporting the successful infusion of sulfur into the host Ni-MO/CNT structures. The STEM-EDS spectra from Fig. 4l also confirm the presence of peaks corresponding to S, Mn, Ni, O, and C. All the SEM, TEM, and HR-TEM results confirmed the successful infusion of sulfur into novel structures of Ni-MO/CNTs.
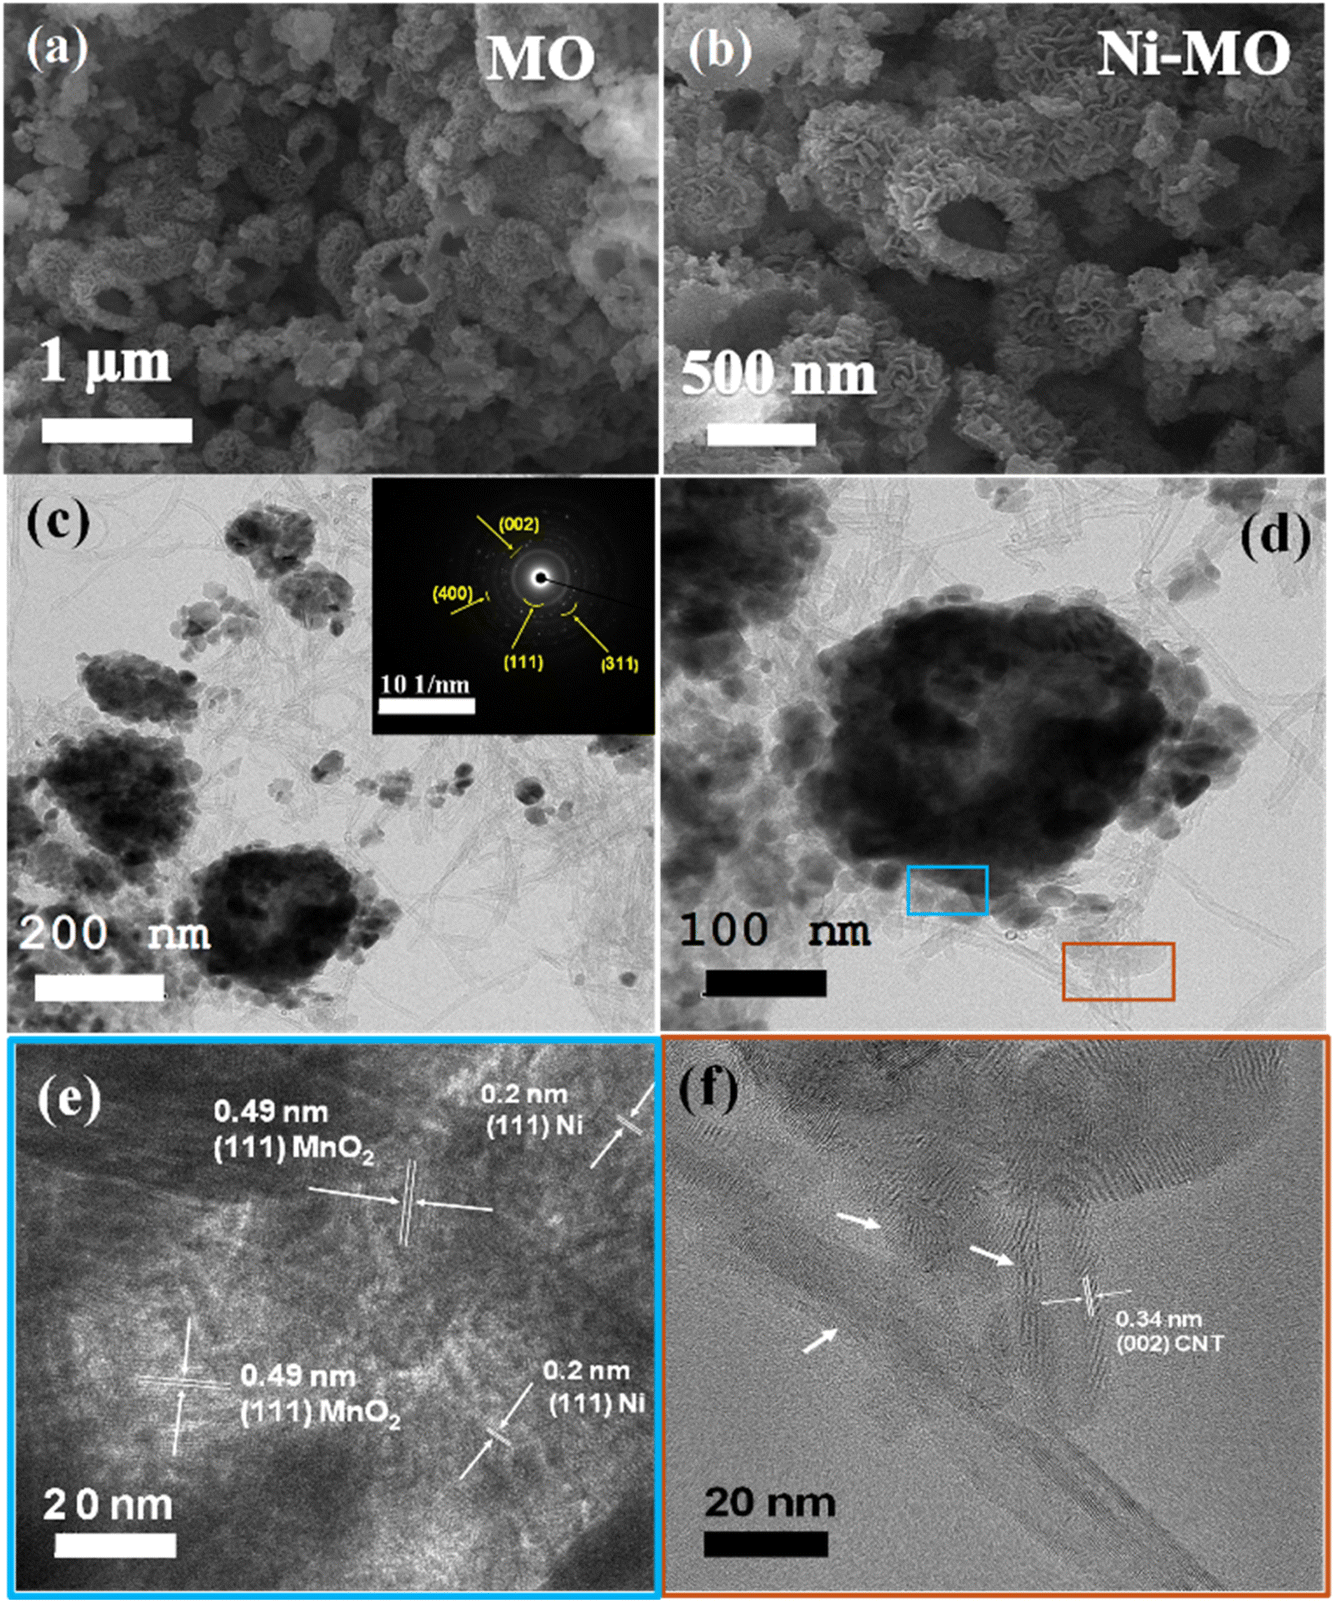 | ||
| Fig. 3 SEM images (a) MO (b) Ni-MO, TEM images (c) Ni-MO/CNT (d) closer view of Ni-MO/CNT (e) HR-TEM image of blue part from image (d), (f) HR-TEM image of brown part from image (d). | ||
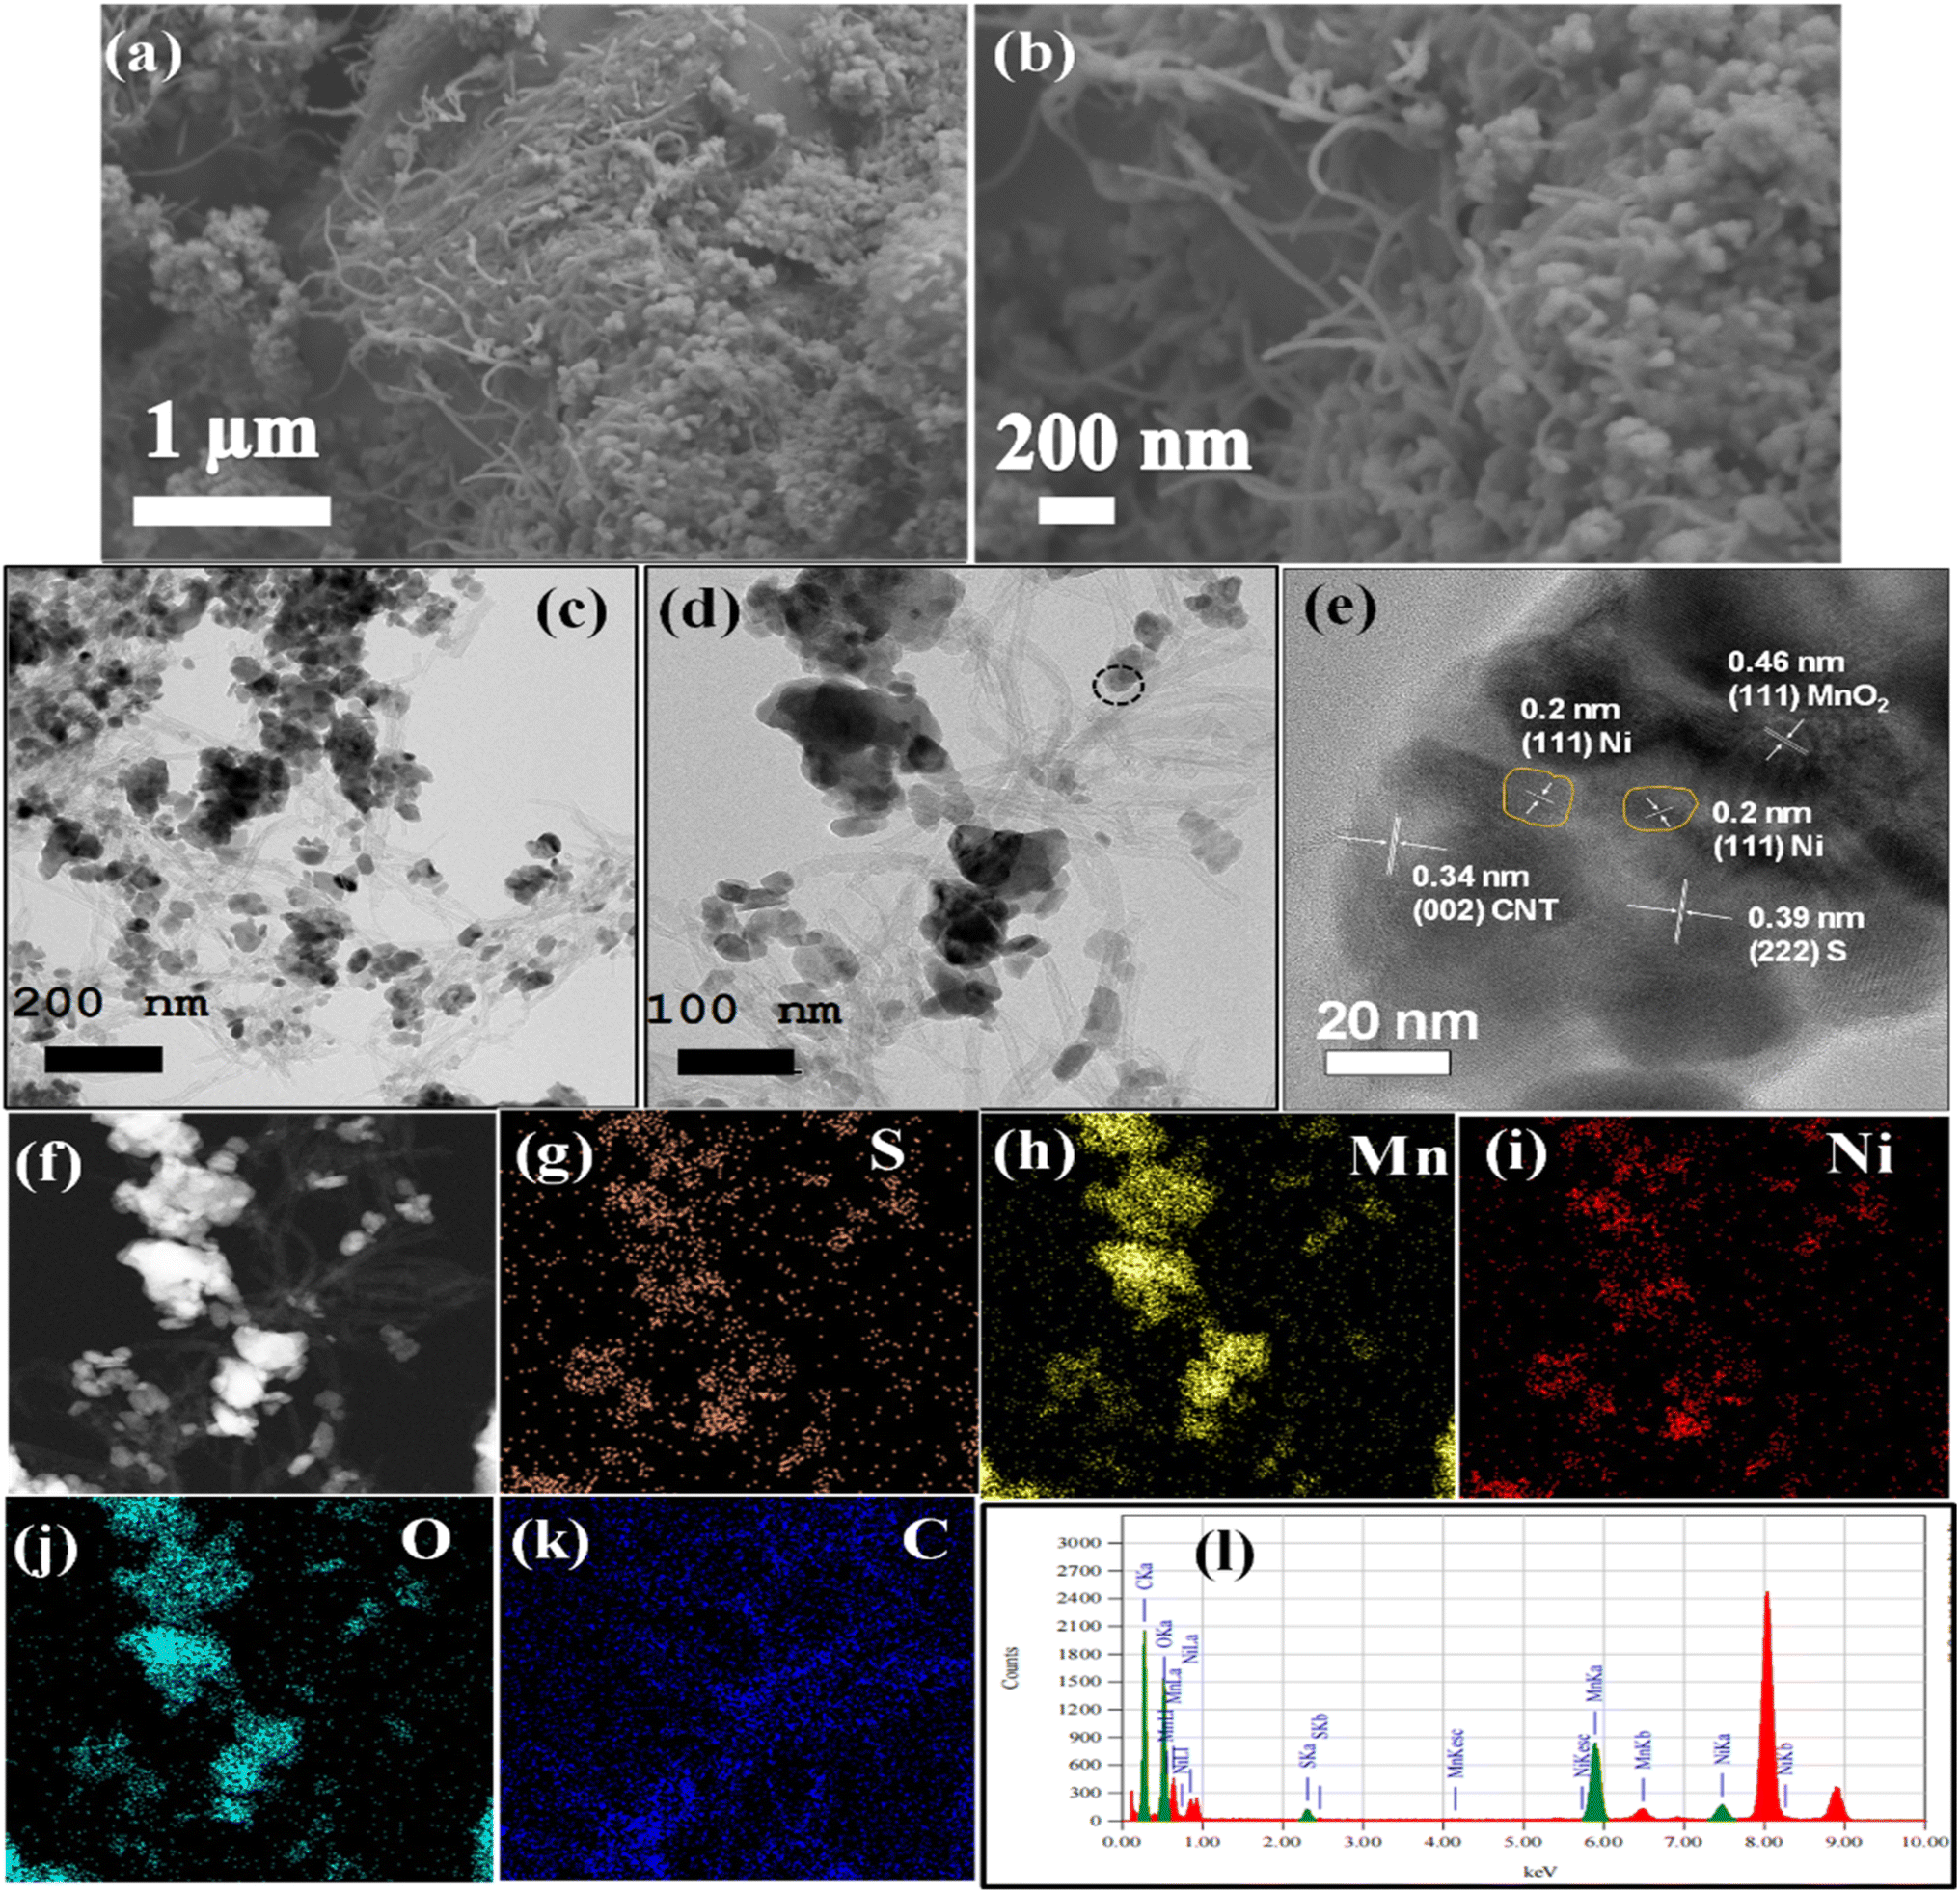 | ||
| Fig. 4 SEM images (a) S@Ni-MO/CNT (b) closer view of S@Ni-MO/CNT, TEM images (c) S@Ni-MO/CNT (d) closer view of S@Ni-MO/CNT (e) HR-TEM image of S@Ni-MO/CNT part from image (d) and (f–k) STEM image and corresponding elemental mappings of S@Ni-MO/CNT, (l) STEM-EDS spectra of image (f). | ||
Thermogravimetric analysis (TGA) was used to analyze the sulfur content in the composite material in an argon atmosphere, with temperatures ranging from 50–500 °C, and the results are shown in Fig. S5a.† The analysis revealed that sulfur evaporation commenced after reaching 200 °C for all materials. Additionally, pure sulfur exhibited 100% weight loss at approximately 320 °C. The calculated sulfur content in S@CNT, S@MO, S@Ni-MO, and S@Ni-MO/CNT hybrids is 63%, 62%, 63%, and 62%, respectively. These results closely align with the amounts of sulfur added during the composite preparation, indicating successful incorporation of sulfur into the host materials with minimal loss. Furthermore, the carbon content in the Ni-MO/CNT host material was determined by TGA in an air atmosphere within a temperature range of 50–700 °C, and the results are shown in Fig. S5b.† The analysis indicated that carbon oxidation commenced after 200 °C and was complete at 550 °C. The calculated carbon content in the Ni-MO/CNT host material is 23%, which is approximately the amount of CNTs added during the host material preparation process.
The surface elemental composition and chemical states of S@Ni-MO/CNT were analyzed by XPS, and the results are displayed in Fig. 5. The wide survey scan spectrum Fig. 5a shows that the composite has the combination of S, Mn, Ni, O, and C at the binding energies of 163, 226, 284, 530, 643, 771.2, and 855 respective to the S 2p, S 2s, C1s, O 1s, Mn 2p, Mn 2s and Ni 2p without any impurities. The peak at 904 eV and 973.8 eV are attributed to Mn LMM and O KLL auger peaks, which are appeared due to core level electron transitions.52 The peak fitting method was employed to determine the chemical states of elements in the composite material. The high-resolution S 2p spectrum is shown in Fig. 5b, comprising S 2p1/2, S 2p3/2, and sulfate peaks at the binding energies of 163.9, 165.1, and 168.6 eV signifying the typical characteristic peaks of sulfur. The sulfate peaks are related to sulfur oxidation due to the presence of oxygen from MnO2.53,54 The peaks at binding energies 641.8 and 653.5 eV are related to the Mn3+, whereas the peak at binding energy 645.2 eV represents the Mn4+. The higher intensity of Mn3+ in MnO2 can initiate a large active surface that leads to better electrochemical performance.34 The high-resolution Ni 2p spectra are depicted in Fig. 5d, where peaks at the binding energies of 855.2 and 872.8 eV are responsible for Ni 2p3/2 and Ni 2p1/3 and other two satellite peaks are observed at the binding energies of 879.16 and 861.2 eV indicating the successful doping of Ni-into MnO2.2 Fig. 5e shows the high-resolution spectra of O1s, where the peak is split into two peaks at binding energies 529.8 and 531.6 eV, which are related to Mn–O and C–O bonds in metal oxide.46 The C1s spectra from Fig. 5f show the peaks at the binding energy of 284.6 eV related to the C–C bond, where the broad peak at 285.6 eV is indexed to the C–O bond, confirming the carbon in the composite. All these results are well consistent with STEM-EDX results.
 | ||
| Fig. 5 XPS spectra (a) survey scan (b) high-resolution S 2p (c) high-resolution Mn 2p (d) high-resolution Ni 2p (e) high-resolution O 1s (f) high-resolution C 1s of S@Ni-MO/CNT composite. | ||
Various electrochemical tests, including cyclic voltammetry (CV), cyclability, rate capability, and impedance, were performed to evaluate the effective performance of the S@Ni-MO/CNT composite as a cathode material for lithium–sulfur (Li–S) batteries. The redox behavior of the electrode materials was investigated within the voltage range of 1.8–2.8 V at 0.1 mV s−1 scan rate. The CV profiles of the first five cycles for S@CNT and S@Ni-MO/CNT electrodes were depicted in Fig. 6a and b, respectively. From the cathodic scan of S@CNT, Fig. 6a shows two reduction peaks at 2.29 V and 2.02 V are related to the conversion of sulfur into long-chain polysulfides (Li2Sn, 4 ≤ n ≤ 8) and from long-chain polysulfides to short-chain polysulfides (Li2Sn, 1 ≤ n ≤ 4), respectively, which are the typical reduction peaks of sulfur cathodes. In the anodic scan, two peaks at 2.3 V and 2.42 V existed and are attributed to the reverse two-step reactions of Li2S2/Li2S to liquid long-chain polysulfides subsequent sulfur formation.55 From Fig. 6b, the reduction peaks at 2.19 V and 2.0 V of S@Ni-MO/CNT are ascribed to the two-step conversion of pure sulfur into Li2S. In the anodic scan, the two oxidation peaks at 2.3 V and 2.4 V represent the reverse formation of sulfur from polysulfides. The anodic peaks are sharp compared to S@CNT, indicating the faster kinetics in S@Ni-MO/CNT composite due to CNTs, which ensure high electronic conductivity, improved interfacial stability between sulfur and electrolyte, and faster kinetics by minimizing polysulfide dissolution. For comparison, the first CV cycles of S@CNT and S@Ni-MO/CNT are displayed in Fig. S6a,† in which S@Ni-MO/CNT composite showed polarization in both oxidation/reduction scans and could be attributed to the phase transformation from sulfur to poly sulfides and vice versa. Moreover, the hollow porous structures of Ni-MO lead to slow wettability of the composite during the initial cycles, which could also cause overpotential. The S@Ni-MO/CNT composite exhibits a significant integrated area, indicating a high electrochemical storage capacity. This can be attributed to the exceptional catalytic ability of the MO structures with Ni doping, providing both excellent buffer space and a high mass loading of active sulfur. Additionally, the presence of CNTs ensures good conductivity, contributing to the overall structural stability of the S@Ni-MO/CNT cathode. The overlapping of CV profiles after the first cycles in both composites indicates the stable and reversible capacities. From the second cycle, the peaks are observed at higher voltages during the cathodic scan and at lower voltages during the anodic scan, suggesting a correlation with the activation process of the sulfur cathodes. This phenomenon is likely attributed to the formation of ionic and electronic channels, which may lead to reduced polarization and the maintenance of stable capacities.26,56 The CV results of the S@MO and S@Ni-MO composite are shown in Fig. S6b and c,† respectively, which are similar to that of S@CNT and S@Ni-MO/CNT profiles indicating similar reaction mechanisms in the composites. All prepared cathodes showed typical sulfur cathode profiles and are in good agreement with previous reports.19,26,56
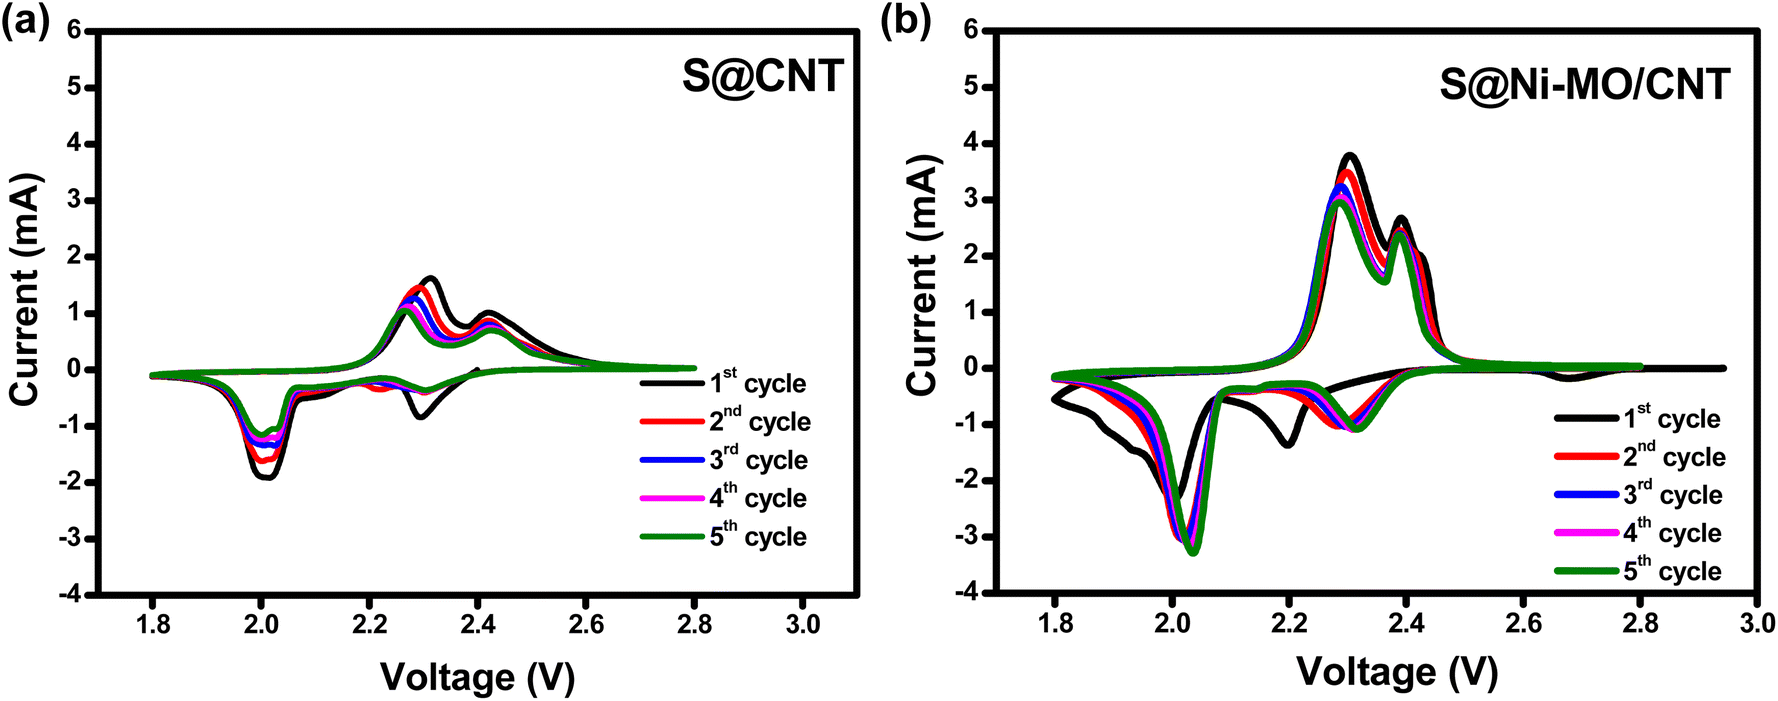 | ||
| Fig. 6 Cyclic voltammograms, first cycles of (a) S@CNT (b) S@Ni-MO/CNT cathodes. | ||
The galvanostatic charge–discharge curves are investigated at the applied current of 0.2C in the voltage window of 1.8–2.8. Fig. 7a depicts the charge–discharge curves for the first and 20th cycles for all the composites. All the composite materials showed two-step discharge plateaus around 2.3 V and 2.05 V, which are related to two different electrochemical reactions between sulfur and lithium. The shorter high-voltage plateau is accredited to the forming of long-chain LiPS. The longer lower volate plateau is responsible for forming shorter poly sulfides, Li2S2 and Li2S. The charging profiles also showed a two-step reverse process forming long chains LiPS and sulfur. After twenty cycles, all composites showed similar charge–discharge curves, indicating the same redox reaction mechanisms between sulfur and lithium. Considering specific capacities, the S@CNT composite showed a 946 mA h g−1 initial charge capacity (ICC) and 850 mA h g−1 discharge capacity (DC) with 89.8% initial coulombic efficiency (ICE). The composites S@MO and S@Ni-MO composites delivered 961 and 962 mA h g−1 ICC and 902 and 929 mA h g−1 DCs with 93.8 and 96.5 ICE %, respectively. Compared with the S-CNT composite, the S@MO and S@Ni-MO composites show better ICC and ICE%, which could be due to the favorable catalytic behavior of Ni-MO and the well-sulfur loading into hollow structures. The S@NiMO/CNT composite showed 941 mA h g−1 ICC and 902 mA h g−1 DC with 95.8 CE%. Though the similar sulfur content in the composites, compared to S@MO and S@NiMO composites, S@Ni-MO/CNT showed lesser initial capacities due to the combination of Ni-MO and CNTs, which could accumulate more Li+ ions during the initial cycles. The high surface area provided by the Ni-MO/CNT host results in the formation of the SEI layer, leading to a decrease in ICEs.19,26 After twenty cycles, S@CNT, S@MO, S@Ni-MO and S@Ni-MO/CNT delivered 529/517, 631/624, 736/725, and 809/802 mA h g−1 specific capacities with 97.6, 98.8, 98.5 and 99.1 CE%, respectively implies the high reversibility of S@Ni-MO/CNT composite cathode.
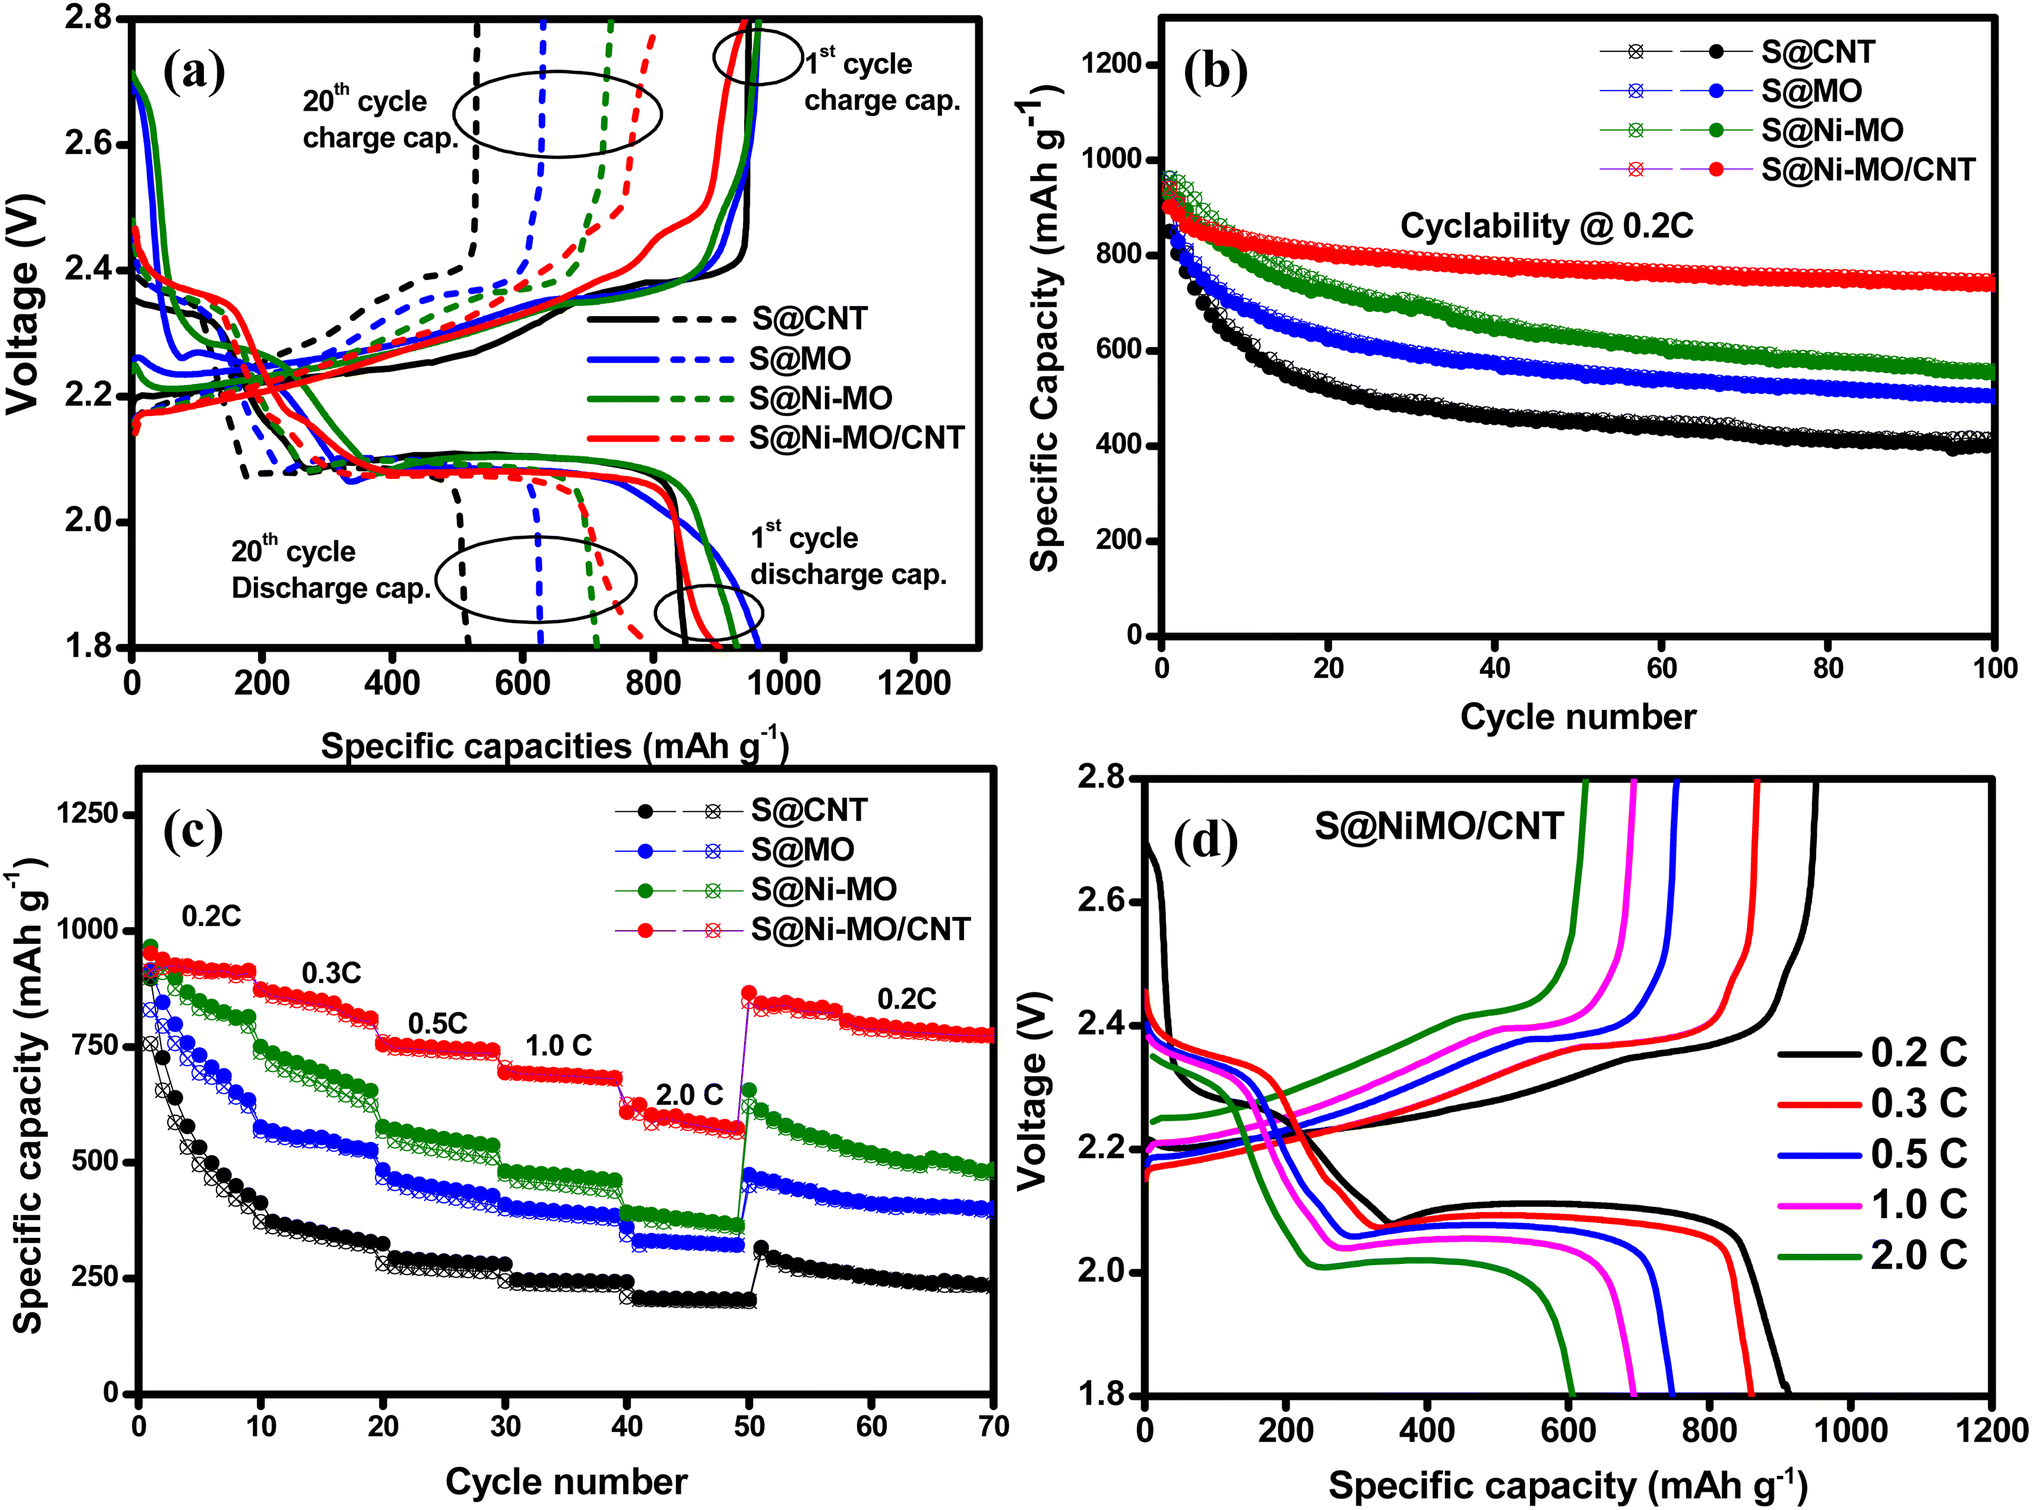 | ||
| Fig. 7 (a) Charge–discharge profiles for the 1st and 20th cycles (b) cycling performances at 0.2C (c) rate performance from 0.2C to 2.0C of S@CNT, S@MO, S@Ni-MO, and S@Ni-MO/CNT electrodes (d) charge–discharge profiles of S@Ni-MO/CNT electrode at different applied C-rates. | ||
The long-term cyclability results of all prepared cathodes at 0.2C are depicted in Fig. 7b. For all the electrodes, a gradual decline in capacities are observed with the increased cycle number. After 100 cycles, the S@CNT, S@MO, S@Ni-MO, and S@Ni-MO/CNT cathodes showed 415/400, 505/502, 556/552, and 747/741 mA h g−1 specific capacities with 96.2, 99.5, 99.2, and 99.2 CE%. The electrode showed 49%, 60%, 58.2% and 82% of capacity retentions vs. second charge capacities, respectively. The cycle number vs. CE% plots are shown in Fig. S7a.† The S@CNT cathode initially showed a good capacity (946/850 mA h g−1) but failed to maintain stability due to the poor trapping ability of CNTs, which caused the loss of active material by the polysulfide shuttle effect. The S@MO and S@Ni-MO cathodes demonstrated enhanced cyclic stability compared to the S@CNT composite. This improvement can be attributed to the significant influence of MO and Ni-MO hosts, which effectively secure sulfur within hollow structures, regulate the loss of active material, and proficiently capture polysulfides. The catalytic behavior of MO also favors the kinetics of the redox reactions. Among these cathodes, the S@Ni-MO/CNT cathode exhibited a notably high capacity, along with superior capacity retention and stability, when compared to the other three electrodes. Combining Ni-doped hollow MO structures and conductive CNTs forms three-dimensional frameworks that greatly enhance structural stability, sulfur retention, and polysulfide entrapment, ultimately resulting in improved electrochemical performance. The collaborative effect of highly porous hollow structures, doped-Ni, and conductive CNTs establishes the Ni-MO/CNT as a well-suited host for sulfur cathodes.
The rate performance results of the prepared cathodes at various applied C-rates (0.2–2.0C) are compared, and the results are displayed in Fig. 7c. S@CNT, S@MO, S@Ni-MO, S@Ni-MO/CNT cathodes delivered 896, 915, 966, and 951 mA h g−1 at 0.2C rate, 372, 568, 736, and 867 mA h g−1 at 0.3C rate, 294, 464, 571, and 754 mA h g−1 at 0.5C rate, 247, 402, 479, and 693 mA h g−1 at 1C rate, 208, 331, 390, and 627 mA h g−1 at 2.0C rate, respectively. The results clearly show that the S@Ni-MO/CNT cathode showed superior rate performance among all cathodes. After reducing the current density back to 0.2C, 91% (866 mA h g−1) capacity is retained for the S@Ni-MO/CNT cathode, whereas other cathodes S@CNT, S@MO, S@Ni-MO showed 35%, 52%, 68% of capacity retentions. The charge–discharge profiles for the S@Ni-MO/CNT electrode at 0.2C, 0.3C, 0.5C, 1.0C, and 2.0C are shown in Fig. 7d, where all the curves showed typical sulfur cathode profiles. The C-rate results suggest that excellent conductivity provided by Ni-doping and CNTs, catalytic activity, LiPS chemical absorption, physical trapping by MO structures, and significant structural stability afforded by CNTs wrapping makes the S@Ni-MO/CNT cathode feasible for practical and industrial Li–S battery applications.
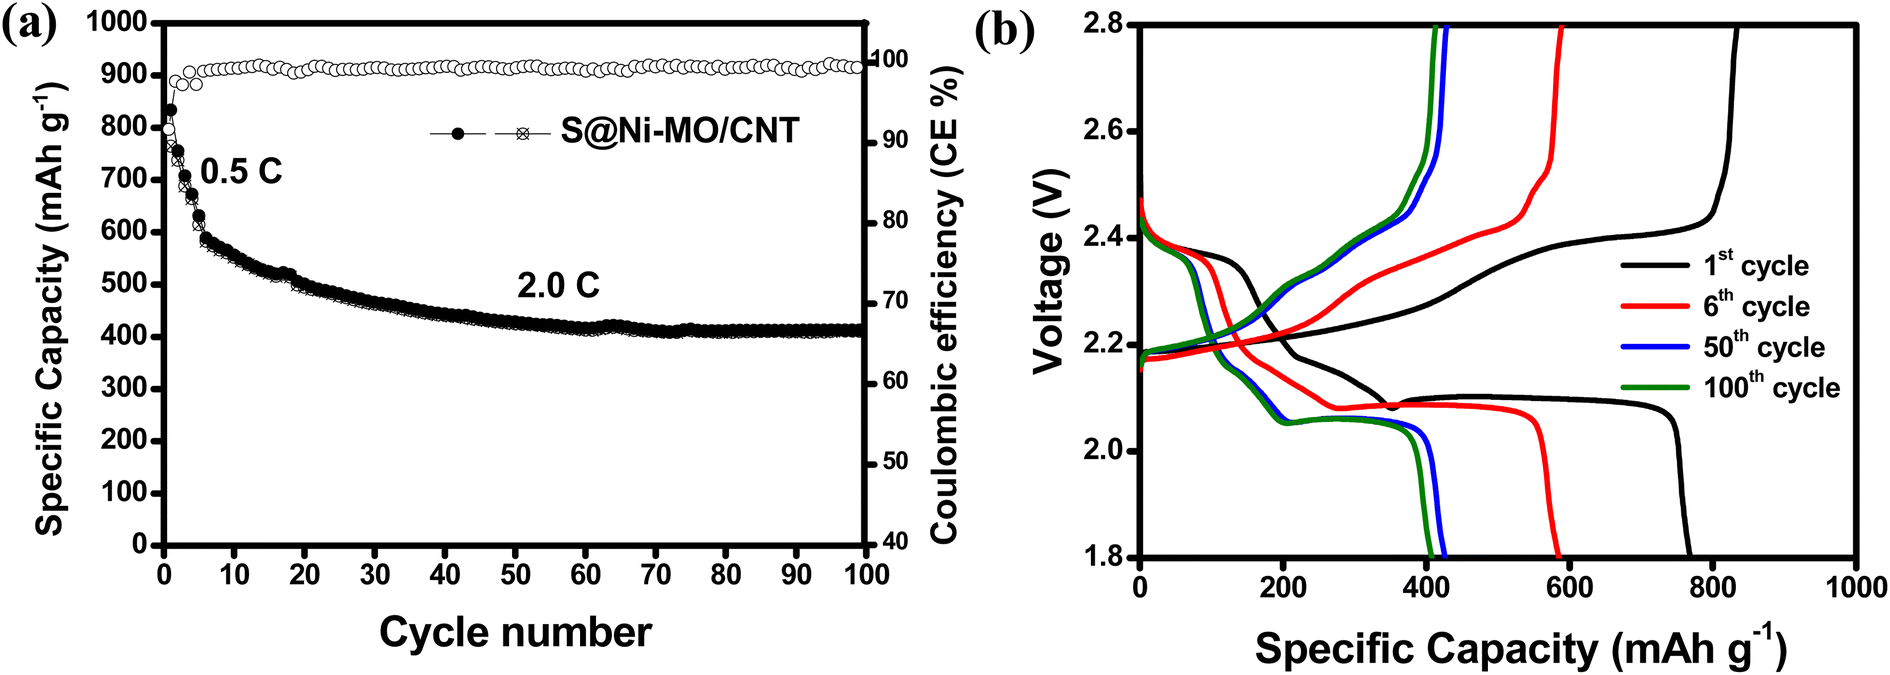
The cyclic stability at high currents was rigorously evaluated at 2.0C to determine the durability of the prepared cathode material and the results are shown in Fig. 8a. To minimize the SEI formation and unwanted side reactions, the cell was initially cycles at 0.5C for five cyles and onwards at 2.0C. The cell delivered remarkable initial specific capacities of 833/764 mA h g−1, achieving a coulombic efficiency of 91% at 0.5C. Despite a minor decline in capacity during the initial cycles, the performance quickly stabilized, reaching 413/410 mA h g−1 after 100 cycles, with an exceptional coulombic efficiency of 99% at an applied current of 2.0C. The charge–discharge profiles for the 1st, 6th, 50th, and 100th cycles, as shown in Fig. 8b, exemplify the expected behavior of a sulfur cathode. These results unequivocally demonstrate that the enhanced conductivity from Ni-doping and CNT wrapping, along with the superior catalytic and absorption properties of the MO structures, plays a pivotal role in ensuring the stability of the S@Ni-MO/CNT composite at higher currents.
 | ||
| Fig. 8 (a) Cycling performances at 2.0C (first five cycles @0.5C) (b) charge–discharge profiles for the 1st, 6th, 50th and 100th cycles of S@Ni-MO/CNT cathode. | ||
UV-vis absorption measurements were carried out to better understand the exceptional cathode performance and investigate the interaction of LiPS with various cathode host materials. Firstly, 10 ml of the prepared 5 mM Li2S6 solution was taken in 5 glass containers, then 5 mg of CNTs, MO, Ni-MO, and Ni-MO/CNT host materials were added to the Li2S6 solutions and rested for 3 h. After 3 h resting period, the supernatant liquids were collected and diluted for UV-vis spectra analysis. The digital images presented in Fig. 9a clearly demonstrate that CNT, MO, and Ni-MO materials exhibit a slight yellow tint, indicating their capability to absorb polysulfides. The peak intensities of the S62− species all samples from UV-Vis spectra are shown in Fig. 9b.55 The absorption spectra illustrated in Fig. 9b confirm that MO and Ni-MO significantly outperform CNTs in terms of absorption. This enhanced performance comes from their superior catalytic, polar, and absorption properties, whereas CNTs, being nonpolar materials, cannot effectively absorb polysulfides. Furthermore, the high electrical conductivity of CNTs leads to considerable reflection of electromagnetic waves instead of absorption, and poor impedance matching further exacerbates their subpar absorption performance.57 In contrast, the MO/CNT and Ni-MO/CNT composites display remarkable absorption properties for polysulfides, thanks to the synergistic effects of the high surface area and robust absorption capabilities of both CNTs and MO. The individual MO/CNT absorption performance is showed in Fig. S8,† in which the supernatant liquid shows less yellow tint, as a clear solution. But, the Ni-MO/CNT composite demonstrates even less intense absorption peaks, which underscores its excellent polysulfide absorption performance, significantly enhanced by the 20% Ni doping in the MO material.
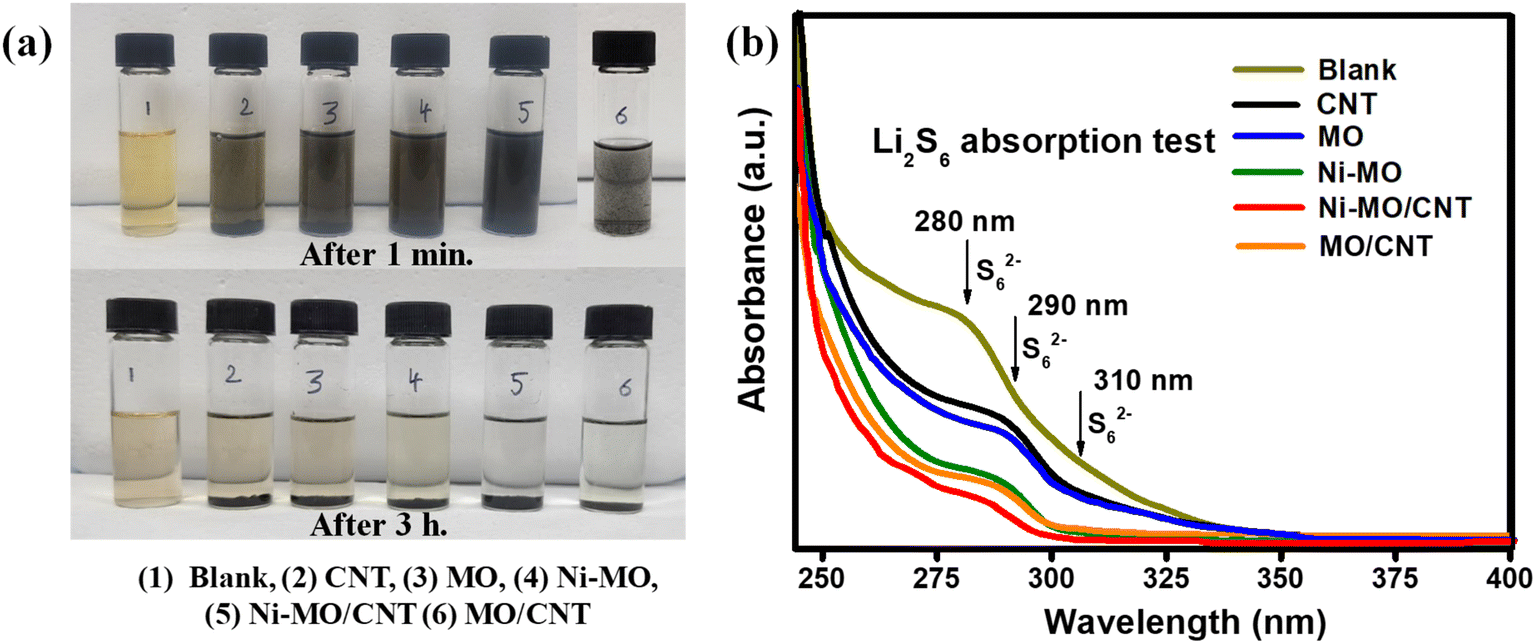 | ||
| Fig. 9 Li2S6 polysulfide adsorption test: (a) digital photograph of polysulfide adsorption tests for CNT, MO, Ni-MO, Ni-MO/CNT and MO/CNT materials in Li2S6 solutions in the time intervals of 1 min. and after 3 h (b) UV-vis absorption spectra of lithium polysulfide (Li2S6) solutions of blank, CNT, MO, Ni-MO, Ni-MO/CNT and MO/CNT supernatant liquids after resting for 3 h. | ||
To evaluate the absorption properties of these materials comprehensively, surface areas were accurately measured using the BET technique. The recorded surface areas for CNTs, MO, Ni-MO, MO/CNT, and Ni-MO/CNT are 142, 35.5, 63.6, 86.3, and 98.64 m2 g−1, respectively. While surface area is undoubtedly a critical factor in determining absorption properties, it is essential to recognize that the catalytic and polar behaviors of these materials play a decisive role in their ability to absorb polysulfides. Despite CNTs having a higher surface area than the other materials, they fail to demonstrate effective absorption behavior compared to those containing MO, primarily due to their unique microstructural characteristics and high polar and catalytic properties.
The impedance plots of prepared composite cathodes are presented in Fig. 10. For all the electrodes, the Nyquist plots are composed of a semicircle in high and middle frequency and an inclined line in the low-frequency region. The former refers to the interface charge-transfer resistance (Rct), and the latter corresponds to Warburg impedance (Wb), which refers to the Li+ diffusion properties in the active material. The high-frequency intercept on the real axis represents the solution resistance (Rs), whereas RSEI, is mainly attributed to the Li/electrolyte interface due to the formation of the solid electrolyte interface (SEI) layer.58 For fresh electrodes, all the cells showed high Rct values. Among all, S@CNT showed lower Rct, indicating high conductivity provided by CNTs. However, after 100 cycles, S@CNT showed a high Rct value, showing the large additional semicircle, which is always related to Li+ migration through the solid–electrolyte interface (SEI) film formed during the charge–discharge process. However, the S@Ni-MO/CNT cathode showed lesser Rct values than other electrodes, indicating excellent contact between S, Ni-MO, and CNTs, which benefits electrode conductivity and charge transfer resistance. The equivalent circuit models containing Rs, RSEI, Rct, constant phase elements (CPE1 and CPE2), and Warburg impedance (Wb) for before and after cycling are shown in Fig. S9.† The resistance values of the electrodes after 100 cycles are summarized in Table 1. The following equation was used to calculate the diffusion coefficient of Li+ in the prepared electrodes:
| Zre = Rs + RSEI + Rct + σwω−1/2 | (1) |
| D = R2 × T2/2A2 × F4 × C2σw2 | (2) |
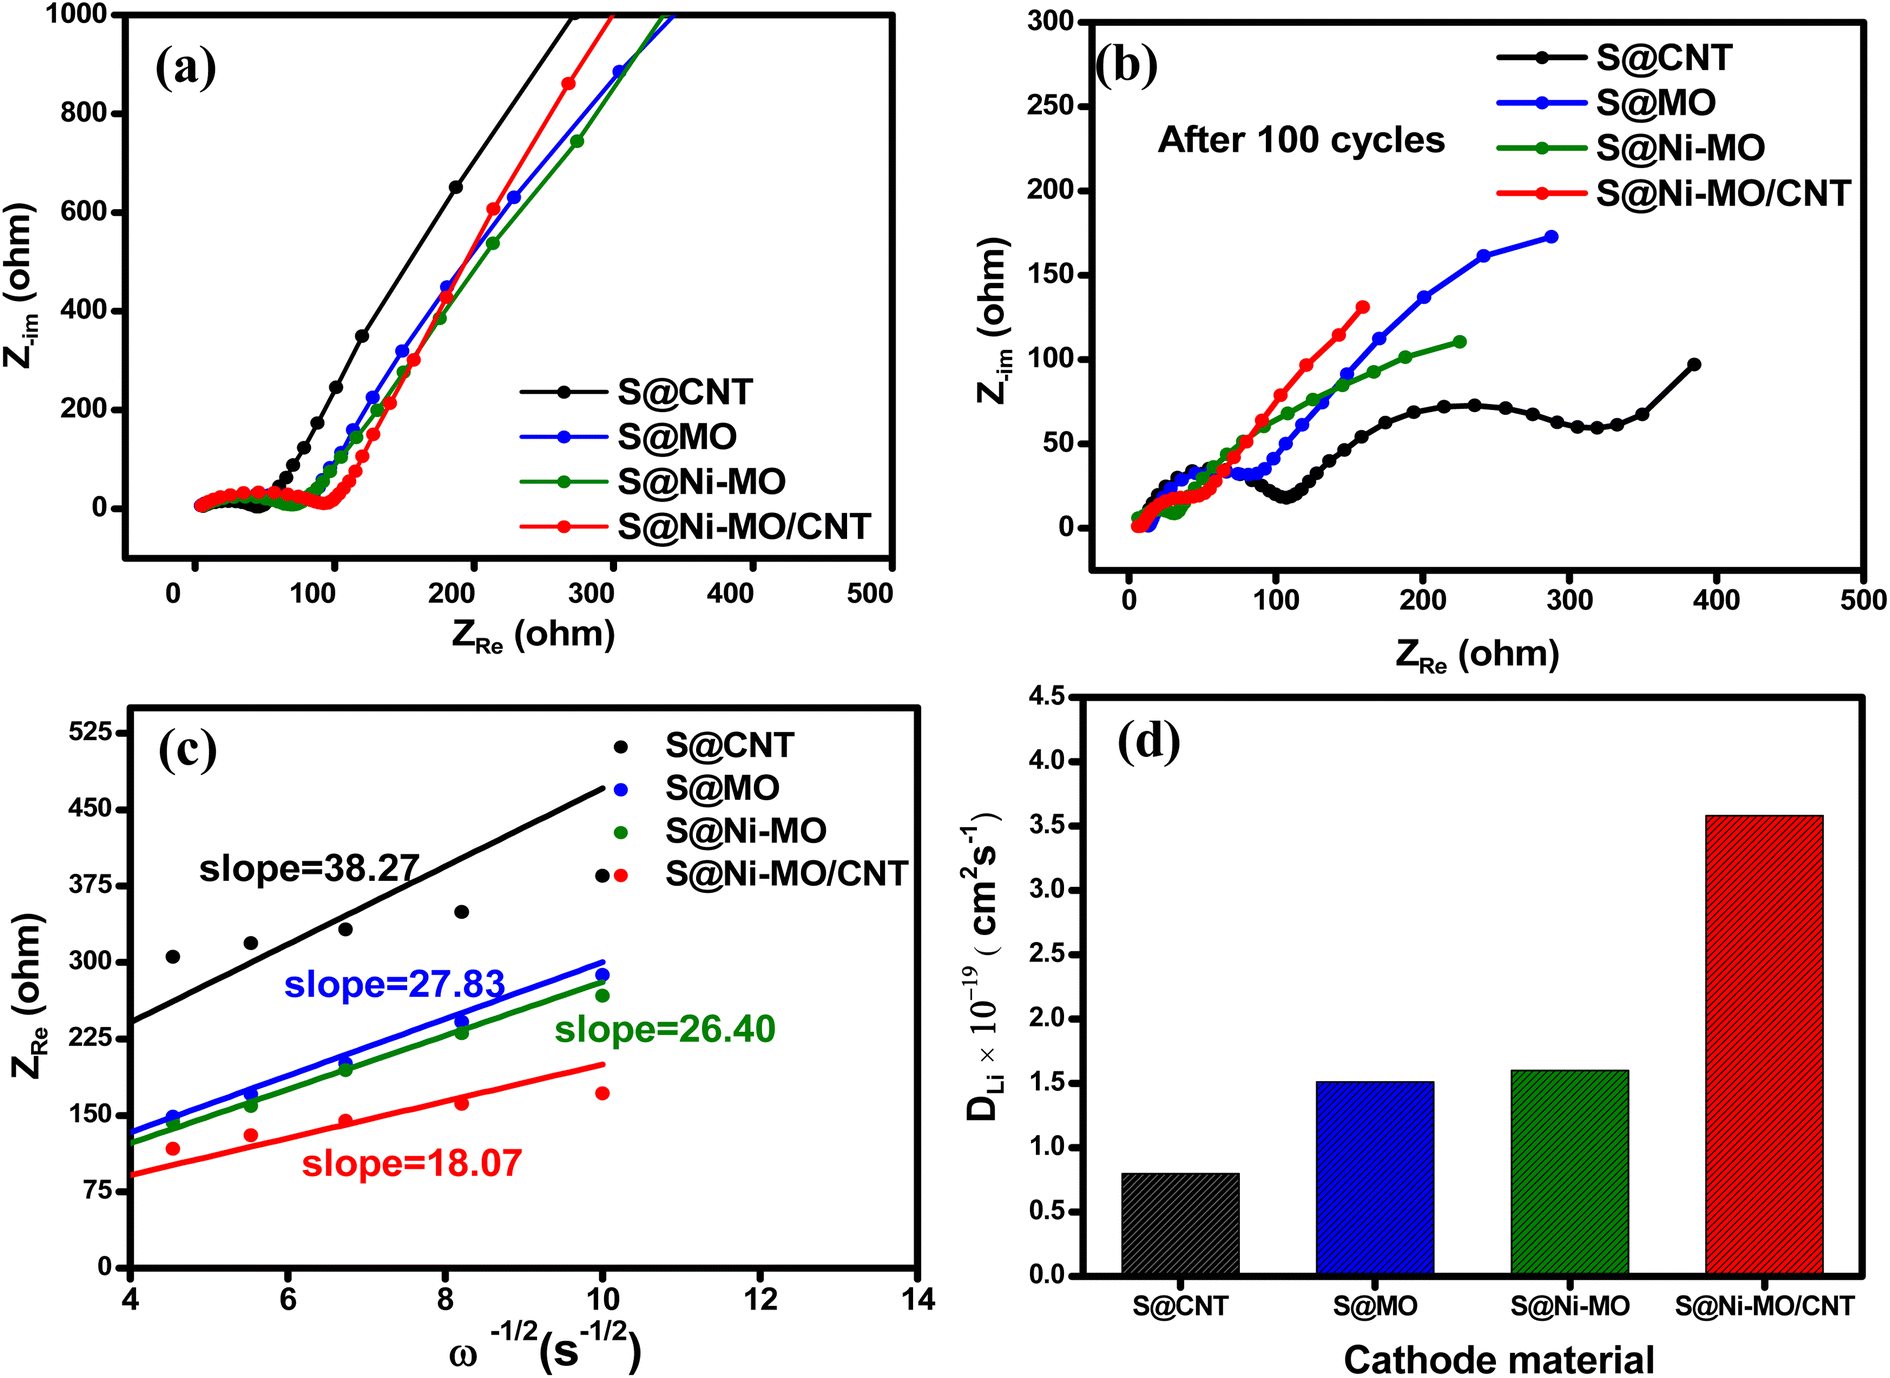 | ||
| Fig. 10 EIS spectra of S@CNT, S@MO, S@Ni-MO, and S@Ni-MO/CNT electrodes (a) before cycling (b) after 100 cycles (c) fitting results of the ZRe versus w−1/2 plots (d) calculated diffusion coefficient (DLi) of electrodes. | ||
| Electrode materials | Before cycling | After cycling | Diffusion coefficient (D, cm2 s−1) | ||||
|---|---|---|---|---|---|---|---|
| Rs (Ω) | RSEI (Ω) | Rct (Ω) | Rs (Ω) | RSEI (Ω) | Rct (Ω) | ||
| S@CNT | 5.5 | — | 41.0 | 12.6 | 49.5 | 266.5 | 0.79 × 10⁻¹⁹ |
| S@MO | 3.7 | — | 73.2 | 9.9 | 38.2 | 43.7 | 1.51 × 10⁻¹⁹ |
| S@Ni-MO | 5.8 | — | 65.8 | 5.9 | 22.3 | 33.6 | 1.60 × 10⁻¹⁹ |
| S@Ni-MO/CNT | 4.4 | — | 89.1 | 6.3 | 15.2 | 16.7 | 3.58 × 10⁻¹⁹ |
To further realize the role of Ni-MO/CNTs in promoting cell performance, the electrode morphology was analyzed by SEM after 100 cycles at 0.2C. For the specimen preparation, the cycled cell was carefully disassembled in the argon-filled glove box, and collected the cathode, and washed with DOL: DME several times. The dried material was collected and used for analysis. The resulting SEM images are depicted in Fig. 11a–c. The images showed agglomeration of the structures to some extent due to harsh Li+ reactions, and no visible cracks were observed on the surface of the electrode. Moreover, the electrode still retained its hollow structures, which are represented by arrow marks in Fig. 11b. The wrapped CNTs are also observed and marked with yellow arrows and circles in Fig. 11c, signifying the excellent structural stability of the well-designed Ni-MO/CNT host material. SEM-EDX image and corresponding elemental mapping of S@Ni-MO/CNT electrode shown in Fig. 11d–i indicating the presence of S, Mn, Ni, O and C and further confirmed by EDX-spectra.
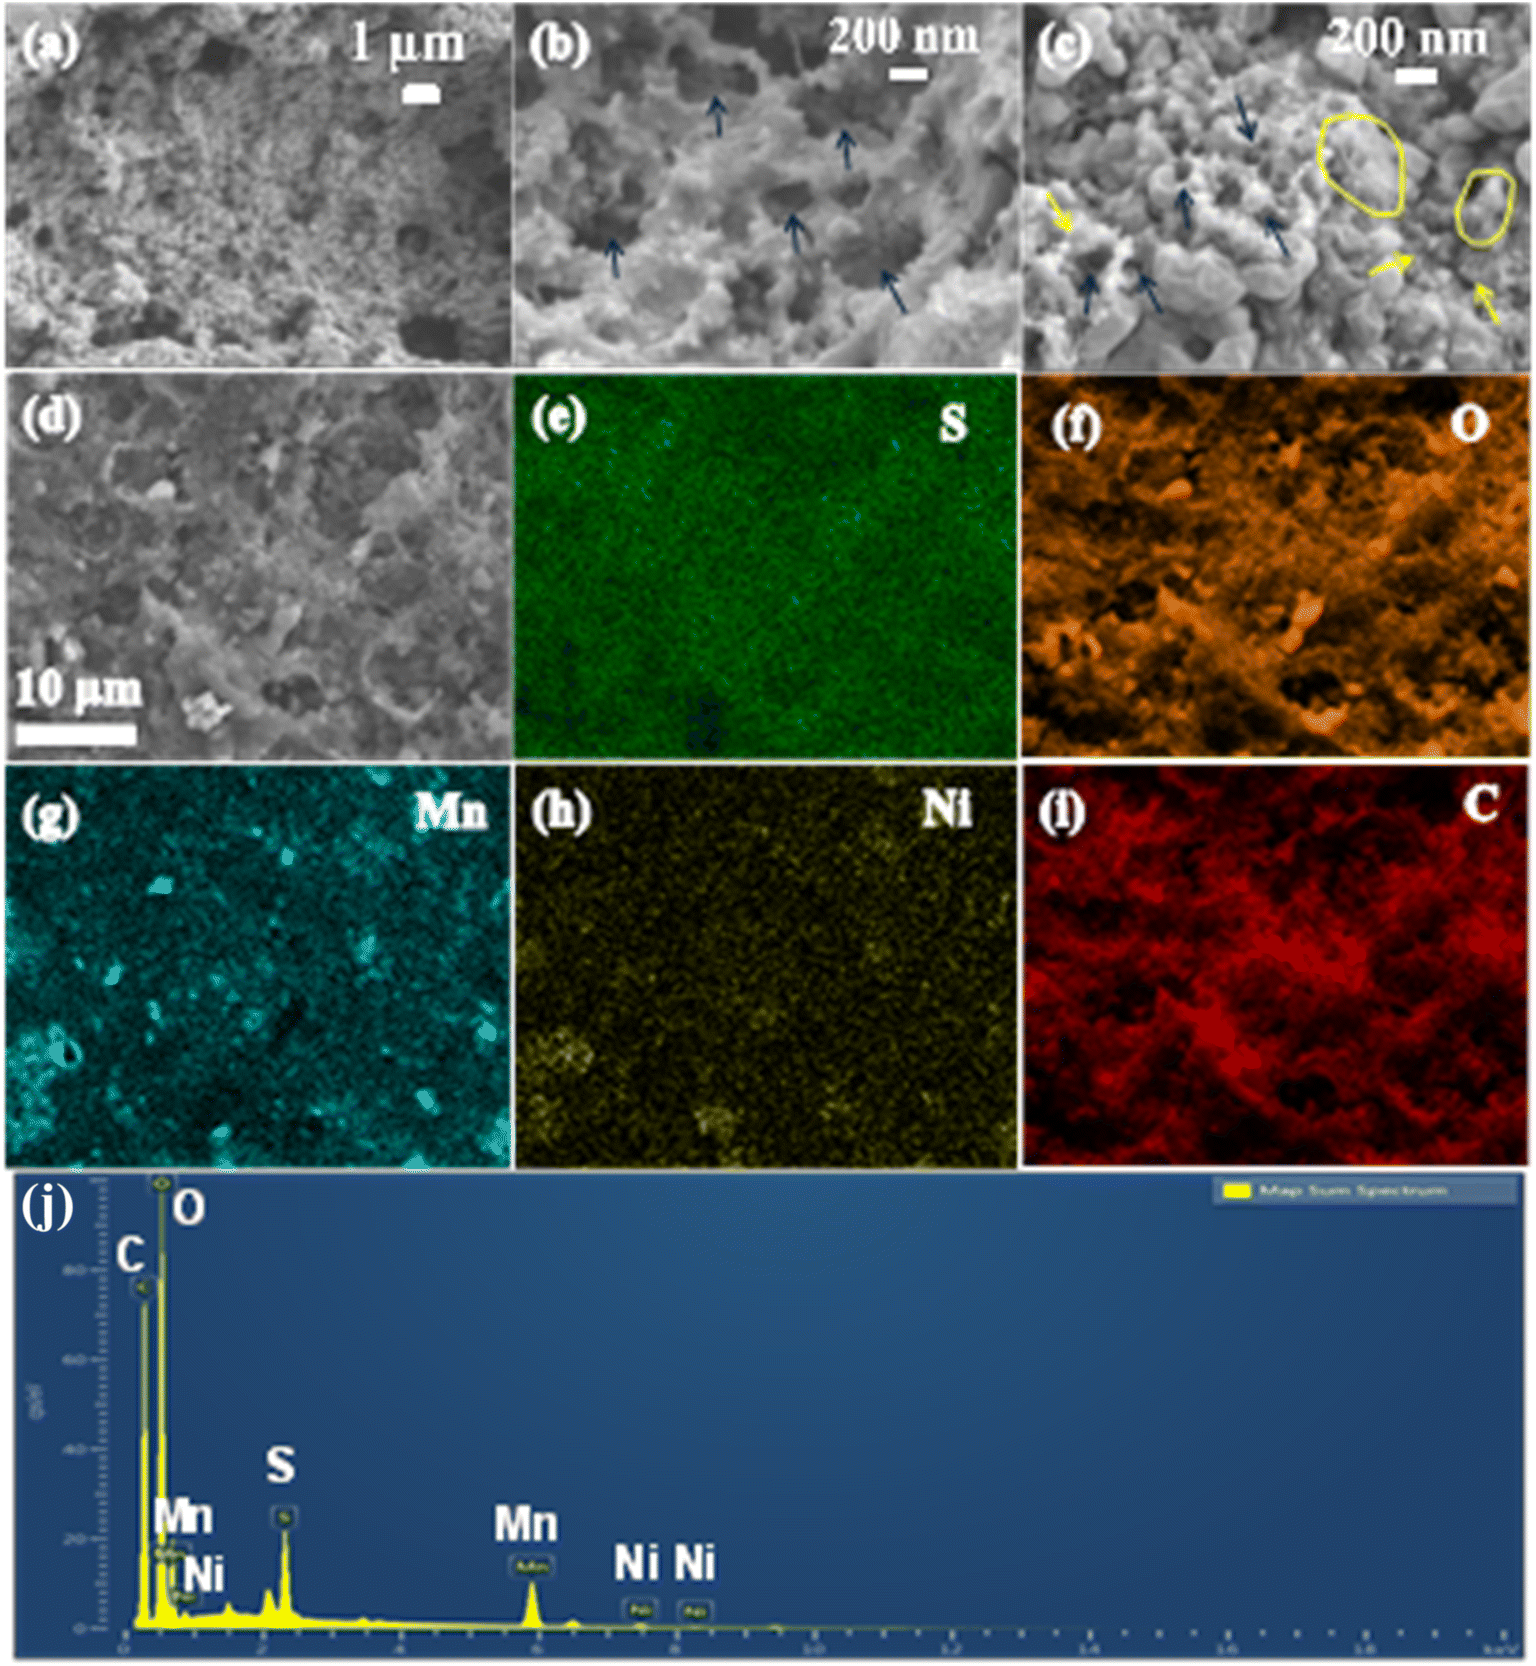 | ||
| Fig. 11 SEM images (a) S@Ni-MO/CNT electrode after 100 cycles (b) retained hollow structures of host-material (c) observed CNTs (d–i) SEM-EDX image and corresponding elemental mapping (j) SEM-EDX spectra of cycled S@Ni-MO/CNT electrode. | ||
The electrochemical properties of relatively similar MnO2/Carbon hosts are compared with the Ni-MO/CNT host and summarized in Table 2.
| Host material | Applied current | Cycle life | Specific capacity | Ref. |
|---|---|---|---|---|
| MWCNT | 100 mA g−1 | 50 cycles | 300 mA h g−1 | 59 |
| MnO2@GO | 0.35C | 400 cycles | 261 mA h g−1 | 60 |
| MnO2/AB | 0.1C | 50 cycles | 649 mA h g−1 | 61 |
| MnO2@HCF | 0.5C | 300 cycles | 662 mA h g−1 | 62 |
| MnO2@HCS | 1.0C | 500 cycles | 705 mA h g−1 | 63 |
| GN/MnO2 | 0.2C | 250 cycles | 493.5 mA h g−1 | 64 |
| C-hemp/MnO2 | 1.1C | 100 cycles | 700 mA h g−1 | 65 |
| ZIF-67@MnO2 | 0.5C | 100 cycles | 895 mA h g−1 | 66 |
| Carbon paper/MnO2 | 0.2C | 200 cycles | 664 mA h g−1 | 67 |
| This work | 0.2C | 100 cycles | 747 mA h g−1 | This work |
| Ni–MnO2/CNT | 2.0C | 100 cycles | 413 mA h g−1 |
The individual cathode hosts CNTs, MO, and Ni-MO struggle to effectively control the overall dissolution of LiPS, pointing to a need for improved trapping ability, conductivity, and stability. The impressive absorption capacity of MO structures shows promise in reducing the LiPS shuttle effect by establishing chemical barriers between the electrode and electrolyte and catalyzing the reaction kinetics. These structures also offer the necessary buffer volume to sulfur, alleviating mechanical stress on the cathode and curbing the loss of active material. The overall conductivity facilitated by doped nickel and CNTs promotes faster kinetics, leading to a noteworthy capacity enhancement. Furthermore, the encapsulation of CNTs ensures the physical confinement of LiPS and also affords structural stability to the host material. The schematic S@Ni-MO/CNT functioning and its absorption and confinement of LiPS are illustrated in Fig. 12. The combined influence of MO, Ni-doping, and CNTs positions Ni-MO/CNT as a promising and effective host for sulfur cathodes in lithium–sulfur (Li–S) battery applications.
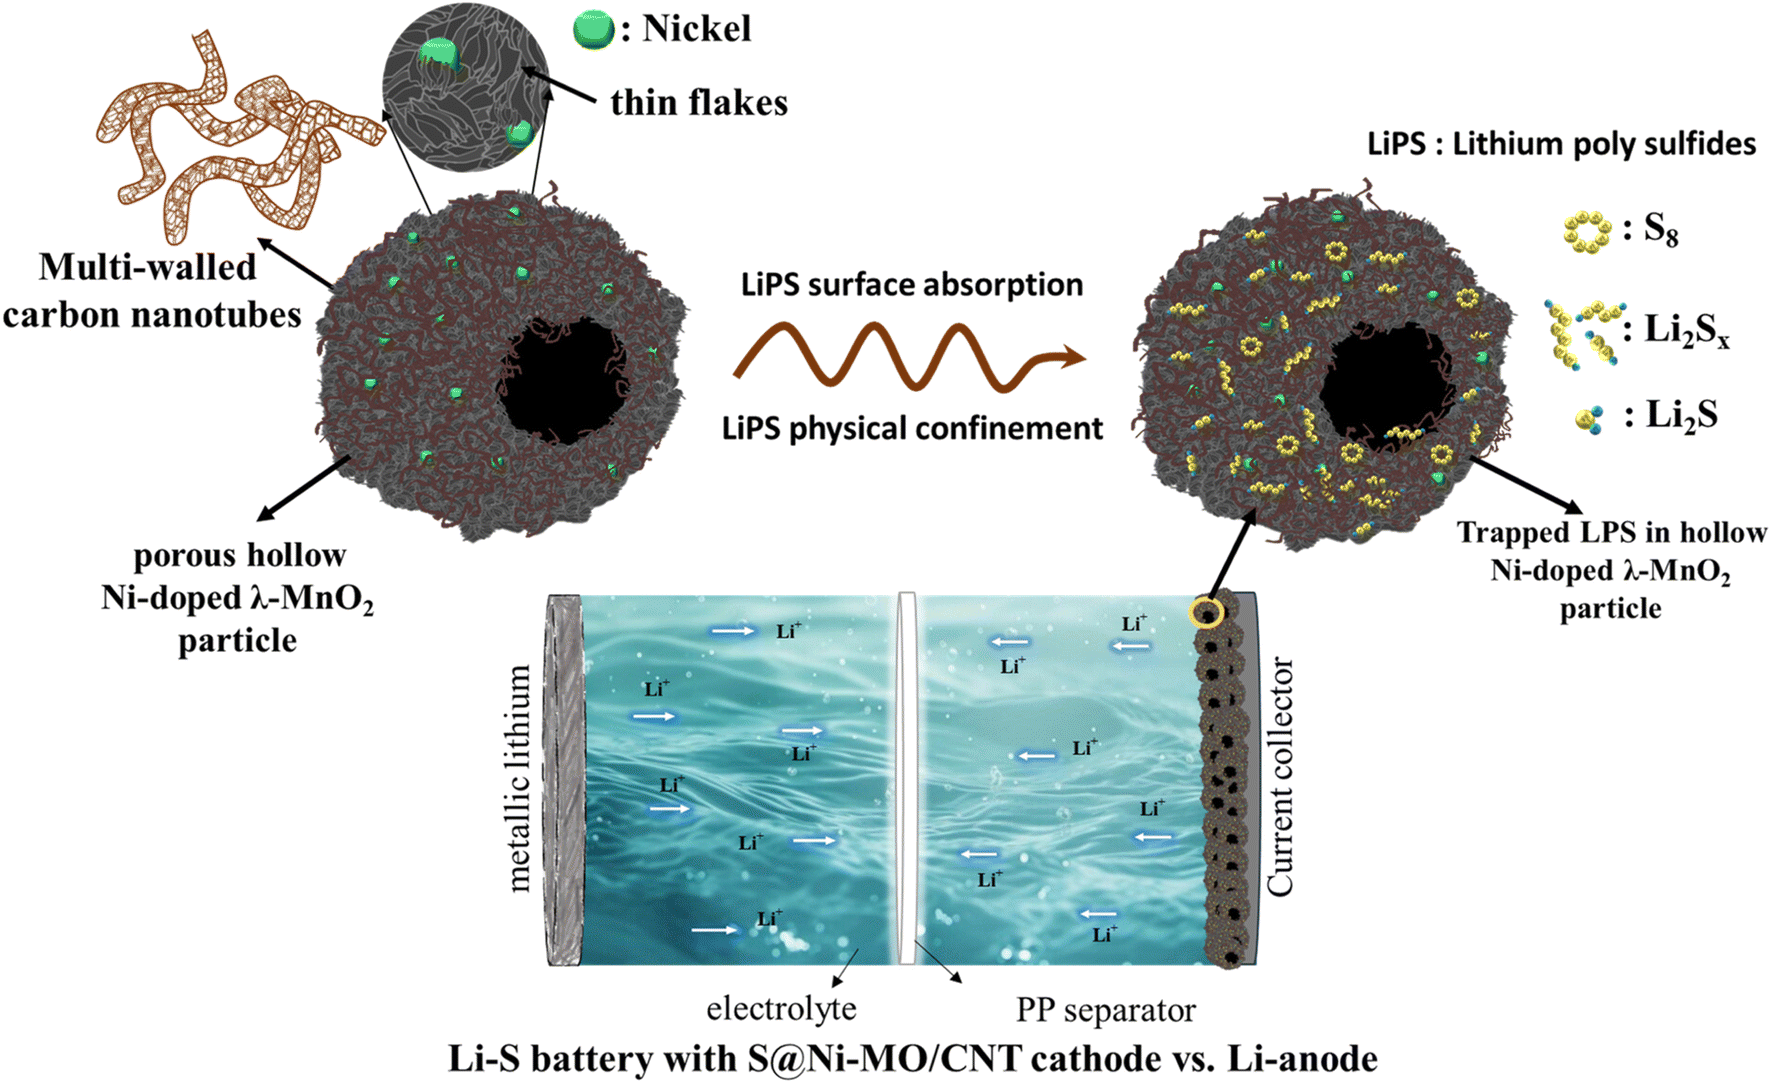 | ||
| Fig. 12 Schematic of the functioning of S@Ni-MO/CNT and its absorption and confinement of LiPS as a cathode material for Li–S battery. | ||
3 Conclusion
In this study, nickel-doped MnO2 hollow porous structures were prepared by a one-step sol–gel approach followed by CNTs wrapping by annealing in an argon atmosphere. The well-designed CNTs encapsulated nickel-doped hollow porous manganese oxide (Ni-MO/CNT) scaffold was used as a host for sulfur. The impregnation technique was used to infuse sulfur into the Ni-MO/CNT host and studied as a cathode for Li–S battery applications. As a cathode, S@Ni-MO/CNT delivered excellent long-term cyclability, 747 mA h g−1 after 100 cycles at 0.2C with 82% capacity retention. The electrode showed superior rate capability (627 mA h g−1 at 2.0C) and improved Li+ diffusion properties. These excellent electrochemical properties could be due to the incorporation of nickel (Ni) doping within the hollow-porous, hierarchical structures that serve to augment the adsorption of lithium polysulfides (LiPS) and contribute to enhanced redox kinetics during the electrochemical process. Furthermore, the encapsulation of carbon nanotubes (CNT) facilitates superior conductivity, thereby substantially accelerating the kinetics of sulfur and LiPS conversion. This, in turn, effectively mitigates the undesirable shuttling effect while promoting the efficient utilization of the active material. These findings highlight the critical need for the development of Ni-MO/CNT sulfur-host materials to advance a broad spectrum of Li–S rechargeable battery applications.4 Experimental
4.1 Materials
Manganese nitrate hexahydrate Mn(NO3)2·6H2O, Sigma Aldrich), nickel nitrate hexahydrate (Ni(NO3)·6H2O, Sigma Aldrich), lithium peroxide (Li2O2, Sigma Aldrich), isopropanol, multi-walled carbon nanotubes (Hanwha Nanotech Corp. CM-100, diameter: 10–14 nm), sulfur powder (Sigma Aldrich, ≥ 99.5%) were purchased and used as received.4.2 Materials preparation processes
:25 ratio and thoroughly blended for 20 minutes to ensure uniformity. Subsequently, the composite was subjected to heat treatment at 500 °C for 2 hours in an argon atmosphere. The resulting material, Ni-MO/CNT, serves as the host material for the sulfur cathode.:35 to make a uniform mixture. The material was then taken into an argon-filled Teflon reactor and sealed. Then, impregnation was carried out at 155 °C for 12 h in an argon atmosphere to obtain a sulfur-infiltrated Ni-MO/CNT composite. For the comparison study, sulfur impregnation was carried out with CNTs, MO, and Ni-MO materials separately with the same ratio and under the same conditions and named them as S@CNT, S@MO, and S@Ni-MO respective to the host material.:1) of sublimed sulfur and lithium sulfide (Li2S) were dissolved in a solution of 1,3-dioxolane and 1,2-dimethoxyethane (DOL:DME, in a 1:1 ratio, v/v) and vigorously stirred for 24 hours in argon-filled glovebox at 60 °C. This process resulted in the formation of a distinct brownish-red Li2S6 solution. Subsequently, the concentration of the prepared solution was diluted to 5 mM to conduct the polysulfide adsorption test.4.3 Materials characterization
The crystal structures of the synthesized materials were analyzed using a Cu Kα radiation source via X-ray diffractometry in the 2θ range of 10–80°. Surface morphology was characterized utilizing scanning electron microscopy (SEM) and transmission electron microscopy (TEM). X-ray photoelectron spectroscopy was employed to investigate the surface oxidation states of the materials. Thermal analysis in an argon atmosphere (50–450 °C) was utilized to examine the sulfur content in the composite materials, whereas analysis in an air atmosphere (50–700 °C) was conducted to determine the carbon content. The Ni contents of the prepared materials were determined using inductively coupled plasma atomic emission spectroscopy (ICP-AES). The Brunauer–Emmett–Teller (BET) and Barrett–Joyner–Halenda (BJH) methods were applied to estimate the surface area, pore volume, and pore diameter of the materials. UV-vis spectroscopy was implemented to assess the materials' polysulfide absorption capacity.4.4 Electrochemical measurements
The electrochemical properties of the prepared electrode materials were investigated using 2032R-button-type coin cells. The working electrodes were prepared using 80% active material combined with 10% super P carbon and 10% Polyvinylidene fluoride (PVDF) binder in N-methyl pyrrolidone (NMP) solvent. All the components were mixed well for 30 min. in a mini ball bill to make a uniform slurry. Then, the slurry was coated on Al foil using the typical doctor blade technique with a thickness of 25 μm. The electrodes were dried in a vacuum oven at 60 °C for 12 h to remove excess solvent. Later, the electrodes were punched into 14 mm disks with an average active material loading of ∼2.72 g cm−2 and used as cathodes for the Li–S battery study. Metallic Li was employed as a counter electrode without any pre-surface cleaning. The 19 mm diameter polypropylene (PP Wellcos Corporation, Separator 2400) was used as a separator. 1 M lithium bis-(tri fluoromethyl sulfonyl-imide) (LiTFSI, Sigma Aldrich, 99.95%) and 0.25 M lithium nitrate (LiNO3, Alfa Aesar, 99.98%, anhydrous) dissolved in 1,2-dimethoxy ethane (DME, 99.5%, Sigma Aldrich, anhydrous) and 1,3-dioxolane (DOL, 99.8%, Sigma Aldrich, anhydrous), solvent with 1:1 (v/v) ratio was used as an electrolyte. The electrolyte-to-sulfur ratio is 10 μL mg−1 to ensure the large capacities and long-term cycle stability. All cells were fabricated in argon-filled glove box with H2O < 0.1 ppm and O2 < 1 ppm. All the electrochemical properties of the fabricated cell were carried out in the BioLogic battery testing system at room temperature. The cut-off voltage for half-cell testing is 1.6–2.6 V. The redox behavior of the prepared cathodes is investigated by studying cyclic voltammetry (CV) with a scan rate of 0.1 mV s−1. Cyclability was tested at the applied current of 0.2C, and the rate capability was studied at the current rates from 0.2–2.0C. Li+ diffusion properties are investigated by employing electrochemical impedance spectroscopy (EIS) in the frequency range 10 mHz–10 kHz.
Data availability
The data supporting this article have been included as part of the ESI.†Author contributions
Conceptualization, A. N.; methodology, A. N and V. N.; measurement and analysis, A. N.; measurement supervision, K. Y. S, and V. N.; writing – original draft preparation, A. N.; writing – review and editing, K. Y. S., A. N., V. N., and H. C. K.; funding acquisition, K. Y. S., H. C. K. and A. N. All authors have read and agree to the published version of the manuscript.Conflicts of interest
The authors declare that they have no known competing financial interests or personal relationships that could have appeared to influence the work reported in this paper.Acknowledgements
This research work was supported by the National Research Foundation of Korea (NRF) (grants 2021R1I1A1A01061270 and 2021R1I1A3059637), funded by the Ministry of Education. This research was supported by the MSIT (Ministry of Science ICT), Korea, under the national program for Excellence in SW, supervised by the IITP (Institute of Information & Communications Technology Planning & Evaluation) in 2022 (2022-0-01091, 1711175863).References
- X. Zhao, G. Cheruvally, C. Kim, K. K. Cho, H. J. Ahn, K. W. Kim and J. H. Ahn, J. Electrochem. Sci. Technol., 2016, 7(2), 97–114 CrossRef CAS.
- A. Nulu, V. Nulu and K. Y. Sohn, J. Alloys Compd., 2022, 911, 164976 CrossRef CAS.
- Y. Yang, G. Zheng and Y. Cui, Chem. Soc. Rev., 2013, 42, 3018–3032 RSC.
- R. A. Marsh, J. Power Sources, 1989, 26, 243–245 CrossRef.
- J. Y. Park, P. R. Ullapu, H. Choo, J. K. Lee, S. J. Min, A. N. Pae, Y. Kim, D. J. Baek and Y. S. Cho, Eur. J. Org Chem., 2008, 2008, 5461–5469 Search PubMed.
- P. R. Ullapu, S. J. Min, S. N. Chavre, H. Choo, J. K. Lee, A. N. Pae, Y. Kim, M. H. Chang and Y. S. Cho, Angew. Chem., Int. Ed., 2009, 48, 2196–2200 CrossRef CAS PubMed.
- C. P. Grey and D. S. Hall, Nat. Commun., 2020, 11, 6279 Search PubMed.
- F. Wu and G. Yushin, Energy Environ. Sci., 2017, 10(2), 435–459 Search PubMed.
- Y. Yang, G. Yu, J. J. Cha, H. Wu, M. Vosgueritchian, Y. Yao, Z. Bao and Y. Cui, ACS Nano, 2011, 5(11), 9187–9193 CrossRef CAS PubMed.
- C. Liu, F. Li, L. P. Ma and H. M. Cheng, Adv. Mater., 2010, 22, E28–E62 CAS.
- J. Q. Huang, Q. Zhang and F. Wei, Energy Storage Mater., 2015, 1, 127–145 Search PubMed.
- M. Agostini and A. Matic, Small, 2020, 16(2), 1905585 CrossRef CAS PubMed.
- A. Nulu, V. Nulu and K. Y. Sohn, ChemElectroChem, 2023, 10, e202300145 CrossRef CAS.
- J. W. Park, S. C. Jo, M. J. Kim, I. H. Choi, B. G. Kim, Y. J. Lee, H. Y. Choi, S. Kang, T. Y. Kim and K. J. Baeg, NPG Asia Mater., 2021, 13, 30 Search PubMed.
- J. Schuster, G. He, B. Mandlmeier, T. Yim, K. T. Lee, T. Bein and L. F Nazar, Angew. Chem., Int. Ed., 2012, 51, 3591–3595 CrossRef CAS PubMed.
- Z. F. Wang, H. Y. Wang, X. L. Liu, Y. X. Chen, Y. Zhao, Y. G. Zhang, Q. Q. Han, C. L. Qin, Z. Bakenov, Y. C. Wang and X. Wang, Rare Met., 2023, 42(11), 3705–3717 CrossRef CAS.
- M. Agostini, M. Sadd, S. Xiong, C. Cavallo, J. Heo, J. H. Ahn and A. Matic, ChemSusChem, 2019, 12(18), 4176–4184 CrossRef CAS PubMed.
- J. Y. Hwang, H. M. Kim, S. Shin and Y. K. Sun, Adv. Funct. Mater., 2018, 28(3), 1704294 CrossRef.
- A. Nulu, V. Nulu and K. Y. Sohn, RSC Adv., 2024, 14, 2564–2576 RSC.
- J. Tian, F. Xing and Q. Gao, Molecules, 2021, 26(9), 2507 CrossRef CAS PubMed.
- M. Abdollahifar, P. Molaiyan, U. Lassi, N. L. Wu and A. Kwade, Renewable Sustainable Energy Rev., 2022, 169, 112948 CrossRef CAS.
- L. Hu, Y. Chen, Y. Chen, L. Liu, S. Liang, N. Zhou, T. Ding, L. Jiang, L. Wang, X. Liang and K. Hu, Mater. Lett., 2024, 357, 135691 CrossRef CAS.
- J. Xu, J. Ao, Y. Xie, Y. Zhou and X. wang, Nanomaterials, 2023, 13(17), 2492 CrossRef CAS PubMed.
- Z. Zhang, D. H. Wu, Z. Zhou, G. R. Li, S. Liu and X. P. Gao, Sci. China Mater., 2019, 62, 74–86 CrossRef CAS.
- X. Liang, C. Y. Kwok, F. L. Marzano, Q. Pang, M. Cuisinier, H. Huang, C. J. Hart, D. Houtarde, K. Kaup, H. Sommer, T. Brezesinski, J. Janek and L. F. Nazar, Adv. Energy Mater., 2016, 6, 1501636 CrossRef.
- W. Dong, L. Meng, X. Hong, S. Liu, D. Shen, Y. Xia and S. Yang, Molecules, 2020, 25, 1989 CrossRef CAS PubMed.
- C. Zha, D. Wu, T. Zhang, J. Wu and H. Chen, Energy Storage Mater., 2019, 17, 118–125 CrossRef.
- M. Waqas, Y. Han, D. Chen, S. Ali, C. Zhen, C. Feng, B. Yuan, J. Han and W. He, Energy Storage Mater., 2020, 27, 333–341 CrossRef.
- Y. Qiu, L. Fan, M. Wang, X. Yin, X. Wu, X. Sun, D. Tian, B. Guan, D. Tang and N. Zhang, ACS Nano, 2020, 14, 16105–16113 CrossRef CAS PubMed.
- F. Ma, Y. Wan, X. Wang, X. Wang, J. Liang, Z. Miao, T. Wang, C. Ma, G. Lu, J. Han, Y. Huang and Q. Li, ACS Nano, 2020, 14, 10115–10126 CrossRef CAS PubMed.
- S. M. Hosseini, A. Varzi, S. Ito, Y. Aihara and S. Passerini, Energy Storage Mater., 2020, 27, 61–68 CrossRef.
- Q. Hao, G. Cui, Y. Zhang, J. Li and Z. Zhang, Chem. Eng. J., 2020, 381, 122672 Search PubMed.
- D. Cai, B. Liu, D. Zhu, D. Chen, M. Lu, J. Cao, Y. Wang, W. Huang, Y. Shao, H. Tu and W. Han, Adv. Energy Mater., 2020, 10, 1904273 CrossRef CAS.
- G. Radhika, R. Subadevi and M. Sivakumar, J. Chem. Sci., 2020, 132, 53 CrossRef CAS.
- Z. Chen, Y. Hu, W. Liu, F. Yu, X. Yu, T. Mei, L. Yu and X. Wang, ACS Appl. Mater. Interfaces, 2021, 13(32), 38394–38404 Search PubMed.
- S. Tu, X. Zhao, M. Cheng, P. Sun, Y. He and Y. Xu, ACS Appl. Mater. Interfaces, 2019, 11, 10624–10630 CrossRef CAS PubMed.
- Y. Ma, Int. J. Electrochem. Sci., 2020, 15, 3996–4004 Search PubMed.
- H. Chen, B. Zhang, F. Li, M. Kuang, M. Huang, Y. Yang and Y. X. Zhang, Electrochim. Acta, 2016, 187, 488–495 Search PubMed.
- W. M. Chen, L. Qie, Q. G. Shao, L. X. Yuan, W. X. Zhang and Y. H. Huang, ACS Appl. Mater. Interfaces, 2012, 4, 3047–3053 CrossRef CAS PubMed.
- X. He, M. Yang, P. Ni, Y. Li and Z.-H. Liu, Colloids Surf., A, 2010, 363, 64–70 CrossRef CAS.
- D. Han, X. Jing, P. Xu, Y. Ding and J. Liu, J. Solid State Chem., 2014, 218, 178–183 Search PubMed.
- J. Zhu, W. Shi, N. Xiao, X. Rui, H. Tan, X. Lu, H. H. Hng, J. Ma and Q. Yan, ACS Appl. Mater. Interfaces, 2012, 4, 2769–2774 CrossRef CAS PubMed.
- X. M. Feng, Z. Z. Yan and N. N. Chen, Chin. J. Inorg. Chem., 2014, 30, 2509–2515 Search PubMed.
- A. Nulu, V. Nulu and K. Y. Sohn, ChemElectroChem, 2021, 8, 1259–1269 CrossRef CAS.
- A. Nulu, Y. G. Hwang, V. Nulu and K. Y. Sohn, Nanomaterials, 2022, 12, 3004 Search PubMed.
- J. S. Moon, A. Nulu, Y. G. Hwang, V. Nulu and K. Y. Sohn, ChemistrySelect, 2021, 6, 7012–7024 CrossRef CAS.
- V. Nulu, A. Nulu and K. Y. Sohn, Nanoscale Adv., 2024, 6, 3426–3440 Search PubMed.
- Z. Wang, Y. Yan, Y. Zhang, Y. Chen, X. Peng, X. Wang, W. Zhao, C. Qin, Q. Liu, X. Liu and Z. Chen, Carbon Energy, 2023, 5, e306 Search PubMed.
- A. Nulu, V. Nulu and K. Y. Sohn, ChemElectroChem, 2023, 10, e202300145 Search PubMed.
- X. Wei, Y. Luo, X. Du, L. Wu, G. Liu and J. Li, J. Chem. Eng., 2023, 454, 140152 Search PubMed.
- S. P. Takle, S. D. Naik, S. K. Khore, S. A. Ohwal, N. M. Bhujbal, S. L. Landge, B. B. Kale and R. S. Sonawane, RSC Adv., 2018, 8, 20394 RSC.
- A. Ullah, L. Rahman, Z. S. Hussain, A. Jilani, D. Iqbal, Z. N. Musadiq, W. S. Khan, I. Hussain and A. Rehman, Mater. Innov., 2022, 2, 83–91 CrossRef CAS.
- L. Chen, J. Jia, R. Ran and X. Song, J. Chem. Eng., 2019, 369, 1129–1137 Search PubMed.
- T. Lei, Y. Xie, X. Wang, S. Miao, J. Xiong and C. Yan, Small, 2017, 13(37), 1701013 Search PubMed.
- J. Häcker, D. H. Nguyen, T. Rommel, Z. Z. Karger, N. Wagner and K. A. Friedrich, ACS Energy Lett., 2022, 7(1), 1–9 CrossRef.
- R. Zhang, Y. Dong, M. A. Al-Tahan, Y. Zhang, R. Wei, Y. Ma, C. Yang and J. Zhang, J. Energy Chem., 2021, 60, 85–94 CrossRef CAS.
- Y. Li, X. Li, Y. Liu and H. Zhang, Carbon, 2018, 108, 346–352 Search PubMed.
- S. Walus, C. Barchasz, R. Bouchet and F. Alloin, Electrochim. Acta, 2020, 359, 136944 CrossRef CAS.
- S. C. Han, M. S. Song, H. Lee, H. S. Kim, H. J. Ahn and J. Y. Lee, J. Electrochem. Soc., 2003, 150(7), A889–A893 CrossRef CAS.
- X. Huang, K. Shi, J. Yang, G. Mao and J. Chen, J. Power Sources, 2017, 356, 72–79 CrossRef CAS.
- G. Radhika, R. Subadevi and M. Sivakumar, J. Chem. Sci., 2020, 132, 1–9 CrossRef.
- Z. Li, J. Zhang and X. Lou, Angew. Chem., Int. Ed., 2015, 54, 12886–12890 CrossRef CAS PubMed.
- Q. Shao, D. Guo, C. Wang and J. Chen, J. Alloys Compd., 2020, 842, 155790 Search PubMed.
- F. Chen, L. Zhan, S. Zhang, Z. Liang, X. Fan, L. Ma and X. Zhou, Ionics, 2020, 26, 5279–5286 CrossRef CAS.
- A. Raghunandanan, U. Mani and R. Pitchai, RSC Adv., 2018, 8, 24261–24267 RSC.
- K. Wang, W. Li, W. Ye, W. Yin, W. Chai, Y. Qu, Y. Rui and B. Tang, J. Alloys Compd., 2019, 793, 16e23 Search PubMed.
- Z. Pang, L. Kong, H. Zhang, B. Deng, D. Song, X. Shi, Y. Ma and L. Zhang, Crystals, 2022, 12(11), 1596 CrossRef CAS.
Footnote |
| † Electronic supplementary information (ESI) available. See DOI: https://doi.org/10.1039/d4ra07700h |
| This journal is © The Royal Society of Chemistry 2025 |