
 Open Access Article
 This Open Access Article is licensed under a Creative Commons Attribution-Non Commercial 3.0 Unported Licence
Electron paramagnetic resonance and photoluminescence study on local structure of Gd3+ ions in Gd-doped CaF2 crystals†
Shirui Luoabc,
Fang Tanb,
Dapeng Jianga,
Honggang Liuf,
Tingyu Liu g,
Liening Weib,
Yu Liuac,
Zhen Zhanga,
Fengkai Mae,
Zhonghan Zhanga,
Huamin Kouac,
Huaize Qinbd,
Jingguo Zhub,
Junjie Hub,
Wei Hong*b and
Liangbi Su*ac
g,
Liening Weib,
Yu Liuac,
Zhen Zhanga,
Fengkai Mae,
Zhonghan Zhanga,
Huamin Kouac,
Huaize Qinbd,
Jingguo Zhub,
Junjie Hub,
Wei Hong*b and
Liangbi Su*ac
aState Key Laboratory of High Performance Ceramics and Superfine Microstructure, Shanghai Institute of Ceramics, Chinese Academy of Sciences, Shanghai 201899, China
bLaser Fusion Research Center, Mianyang, Sichuan 621900, China
cCenter of Materials Science and Optoelectronics Engineering, University of Chinese Academy of Sciences, Beijing 100049, China
dState Key Laboratory of Crystal Materials, Shandong University, Jinan 250100, China
eDepartment of Optoelectronic Engineering, Jinan University, Guangzhou 510632, China
fCollege of Materials Science and Engineering, Sichuan University, Chengdu 610064, China
gCollege of Science, University of Shanghai for Science and Technology, Shanghai, 200093, China
First published on 29th January 2025
Abstract
Employing electron paramagnetic resonance (EPR) and excitation and photoluminescence (PL) spectra, changes of the local structure of Gd3+ ions were investigated for the CaF2 crystals containing 0.00015, 0.17, 1.22, 5.75 at% Gd ions, respectively. The obtained spin Hamiltonian parameters of the cubic configuration Gd3+ monomer are g = 1.9862, B4 = −2.3153 ± 0.015 MHz and B6 = −0.0005 ± 0.001 MHz. The peak-to-peak width of the EPR lines of the cubic configuration Gd3+ is significantly broadened and partially quenched with the increase of the Gd3+ concentration, which indicates that the exchange and dipole interactions between Gd3+–Gd3+ are enhanced. From theoretical calculations, combined with experimentally measured angular dependence, we found that for the 1.22 at% Gd:CaF2 crystals, Gd3+ remains essentially cubic, and the majority of the Gd3+ ions are distributed as a dimer conformation along the [110] direction and at a distance of about 7.7 Å.
1. Introduction
Due to the high intensity and short pulse duration, ultra-intense ultrashort lasers show great promise for applications in basic and cutting-edge interdisciplinary disciplines, such as high-energy physics, fusion energy, precision measurements, chemistry, materials, and biomedicine.1–4 The invention of the chirped pulse amplification (CPA) technique has greatly increased the peak power of pulsed lasers.5 As the basis for realizing the CPA technique, the development of laser materials that satisfy all relevant specifications has been of great interest. So far, due to the excellent comprehensive material parameters, two laser gain media, Nd-glass and Ti:sapphire, have been widely used in ultra-intense and ultra-short lasers. However, with the development of ultra-intense ultrashort lasers toward higher peak power, as well as higher repetition frequency and average output power, both materials show obvious limitations. The lower thermal conductivity of the Nd-glass medium limits its application to high repetition frequency lasers,6 and the stronger amplification of spontaneous emission (ASE) of Ti:sapphire limits its maximum output energy to tens of joules.7Nd3+ ion-doped alkaline-earth metal fluoride (MF2) crystals have excellent properties of high thermal conductivity (10 W m−1 K−1) and wide photoluminescence bands (20–30 nm), which makes them an important potential gain medium for high-repeating-frequency, high-power ultrashort lasers.8–11 Kaminskii et al. have extensively studied Nd3+ doped MF2 crystals since the 1960s. In order to solve the severe concentration quenching that occurs in the luminescence of Nd3+ ions in the 1 μm band when they are highly doped with Nd3+ ions, one needs to introduce Y3+, La3+, Gd3+ or Lu3+ at a concentration of about 5 at% as buffer ions into Nd3+ doped fluoride crystals in order to ensure the quantum efficiency of their photoluminescence.12–15 In recent years, Qin et al. achieved the shortest mode-locked pulse of 103 fs by choosing a suitable Y doping concentration (10%).16 Tang et al. synthesized 0.5% Nd, 5% Y:CaF2 crystal rods as an amplifying medium with high repetition frequency and achieved a small gain of 2.7, which is close to twice that of Nd-glass.17
Buffer ions doped with Nd:MF2 will come close to Nd3+ ions, decrease the symmetry of the local environment of Nd3+ ions and increase the distance between Nd3+ ions, thus eliminating the concentration quenching of Nd3+,18 and thus higher doping concentration is required. Phenomenologically, large doping brings about defects such as small-angle grain boundaries (SAGB), which leads to an order of magnitude decrease in optical uniformity19 and reduces the laser-induced damage threshold,20 which affects the stable application of MF2 in highly heavy-frequency and ultrafast high-power lasers. The specific physical processes responsible for these unfavorable effects of high-concentration doping are not fully understood, and it is necessary to study the local structure of high-concentration doped trivalent rare-earth ions in MF2 crystals, which will help to find a way to improve the quality of the crystals.
The local structures formed by the doping of high concentrations of trivalent rare earth ions in alkaline earth metal fluorides are very complex and have been studied for sixty years. At low doping concentrations of a few ppm, the local structures are dominated by spatially discrete monomers, such that the monomers often exhibit different local symmetries due to the different ways of charge balance. At doping concentrations reaching greater than 100 ppm,21 dimers, trimers, and even hexamers appear. Experimentally, some of these clusters have been successfully obtained by different methods. Using fluorescence spectroscopy22 and selective excitation,23 fluorescence signals from a variety of photoactive centers have been observed in crystals. Subsequently, Andeen et al. observed cluster-associated dielectric relaxation.24 Catlow et al. observed the way in which the local structural environment of the impurities varies with the size of the rare-earth ions by extended X-ray absorption fine structure (EXAFS), and obtained under- and over-doped dimeric and hexametric configurations by computer lattice simulation studies.21 The study of F-occupancy using neutron diffraction revealed that the dominant multimer in 5% La-doped CaF2 is a spatially discrete distribution of dimer,25 as well as a model of polymers in higher concentration Y-doped CaF2 sample.26 On the other hand, some progress has been made in related computer simulations. Ma et al. obtained a series of cluster configurations of rare earth ions doped in CaF2 and SrF2 matrices using first-principles calculations based on density-functional theory.27–29
Electron paramagnetic resonance (EPR), as a characterization tool for the study of unpaired electrons, has been widely used in the past decades to determine the monomer structure of low concentration doped trivalent rare earth ions in MF2,30–36 and EPR studies on the cluster structure of high concentration doped trivalent rare earth ions are also being carried out. Aminov et al. investigated cerium doped CaF2 single crystals, and observed a broadening of EPR spectra at high concentrations (5–15 at%).37 Kazanskii et al. measured the tetragonal antiprismatic prismatic structure of trivalent lanthanide ions (Ln3+) in single crystals of Ln3+ doped MF2 above 1 at% using EPR, and the symmetric hexametric model was established by computer simulation.38 Among the trivalent rare-earth ions, Gd3+ has seven electrons in 4f orbital and the ground state is 8S7/2 because its orbital angular momentum is zero, and for its dimer EPR Hamiltonian quantities contain fewer interaction terms inside the description. In addition, the spin-lattice relaxation time of Gd3+ is quite long, and its EPR signals can be easily obtained even at room temperature, which makes it a very good sample that can be used to study the local structure of the clusters by EPR.
In order to further investigate the localized structure of doped Gd3+ ions in MF2 crystals, we grew Gd3+:CaF2 crystals with nominal concentrations of Gd of 0.17, 1.22 and 5.75 at% named 0.1GCF, 1GCF and 5GCF, and 0.005 at% Nd3+:CaF2 crystals containing trace Gd impurities at a concentration of only 1.5 ppm named NCF. These four samples containing different concentrations of Gd ions were characterized using EPR, excitation and PL spectroscopy, XRD, and ICP-MS. EPR experiments revealed that the main EPR spectrum of the NCF sample at room temperature belongs to the Gd3+ paramagnetic center in cubic field. By fitting the experimental data to the angular dependence of the EPR spectrum of this paramagnetic center, we obtained the spin Hamiltonian parameters of the Gd3+ monomer in the cubic configuration. Further, we obtained the EPR spectra of all samples when the magnetic field was parallel to the c-axis of the crystals. The results show that all these crystals contain EPR lines corresponding to the Gd3+ centers in the cubic field, and the peak-to-peak EPR line width grows from 7 G to 158 G nearly linearly as the concentration of Gd increases. This increase in width is related to the exchange interaction (EI) and magnetic dipole–dipole interaction (MDDI) of Gd3+ ions in the dimer, and this result is consistent with the expectation that dimers, or even high-order clusters, are formed from the cubic conformation Gd3+ centers in the samples as the concentration of Gd increases.
2. Experiments
The 0.1GCF, 1GCF and 5GCF samples used in this study were grown from 4N CaF2 blocks and 4N GdF3 powder by Bridgeman method. The NCF samples were grown from 4N CaF2 blocks and 4N NdF3 powder by the same method. Crucibles made of high-purity platinum were used as carriers for the crystal feedstock, and 1 wt% polytetrafluoroethylene (PTFE) micropowder was added as a deoxidizing agent. The target temperature controlled by the program is 1430 °C, the heating rate is 40–100 °C h−1, and after holding for 3–5 hours, the guide tube is slowly lowered at a rate of 0.8 mm h−1 to enter the crystal growth stage. Crystal growth time is set at 230 hours. After the crystal growth is complete, the crystal begins to cool down at a rate of 60 °C h−1. The three samples were obtained from the same batch in a single growth run, and underwent the same descending process, resulting in columnar samples with a diameter of about 2.5 cm and a length of about 9 cm. The elemental content of Gd in the samples was determined using inductively coupled plasma mass spectrometry (ICP-MS), and the results are shown in Table 1. The sample powders were subjected to XRD tests at room temperature using a high-resolution X-ray powder diffractometer, which was used to obtain information on the structure and lattice constants of the crystals. The crystals were cut after high-precision orientation with a non-standard high-speed fully automated Laue single-crystal orienter to obtain the experimental samples for EPR tests, which were rectangular in size of 3 × 3 × 5 mm3. The three edges of the samples were parallel to the axes a, b, and c of the crystals respectively, which were equivalent. The nomenclature of a, b, and c was arbitrary. The EPR measurements were carried out using a continuous-wave EPR spectrometer of X-band. The microwave frequency was close to 9.86 GHz. Modulation amplitude of the NCF is 1 G, and which of the 1GCF is 8 G. The modulation frequency was 100 kHz. The magnetic field measurement error was less than 1 G after calibration of the magnetic field with a standard strong pitch sample. PL spectra were recorded with an Optical Parametric Oscillator (OPO) laser excitation and a time-resolved fluorometer. The cryogenic PL spectra were measured by immobilizing the samples in a helium cryostat at a temperature of 16 K.| NCF | 0.1GCF | 1GCF | 5GCF | |
|---|---|---|---|---|
| Gd (at%) | 0.00015 | 0.17 | 1.22 | 5.75 |
First-principles calculations were used to further validate this structure. The 2 × 2 × 2 supercells were constructed to simulate CaF2 crystals with point defects one GdCa or two GdCa, as shown in Fig. 4. We optimized the supercell structure using density functional theory (DFT) and the Vienna Ab initio Simulation Package (VASP). The projector augmented wave (PAW) method was employed for the potential field, with a cutoff energy of 680 eV. The Monkhorst–Pack k-point meshes of 5 × 5 × 5 were used. The Perdew–Burke–Ernzerhof (PBE) functional, based on the generalized gradient approximation (GGA), was utilized for the electron exchange and correlation functions. To accurately model the excited states in the system, the Hubbard U parameter was employed. The value of the d-orbital of the Gd atom is 6 eV.39 The convergence criteria for force and energy were met with thresholds set at 0.001 eV Å−1 and 10−6 eV, respectively. Atomic configurations of Ca 3s2p64s2, F 1s22s2p5 and Gd 5s2p6d16s2 were treated as valence electrons.
3. Results
3.1 EPR results
The EPR spectrum of the NCF and 1GCF samples with magnetic field parallel to the c-axis of the crystal at room temperature is shown in Fig. 1(a) and (b). When the microwave frequency is 9.86 G, similar 7 distinct EPR lines are observed in the EPR spectra of NCF and 1GCF. Although NCF sample contains higher concentration of Nd3+ ions, the EPR resonance lines for Nd3+ ions do not appear at room temperature.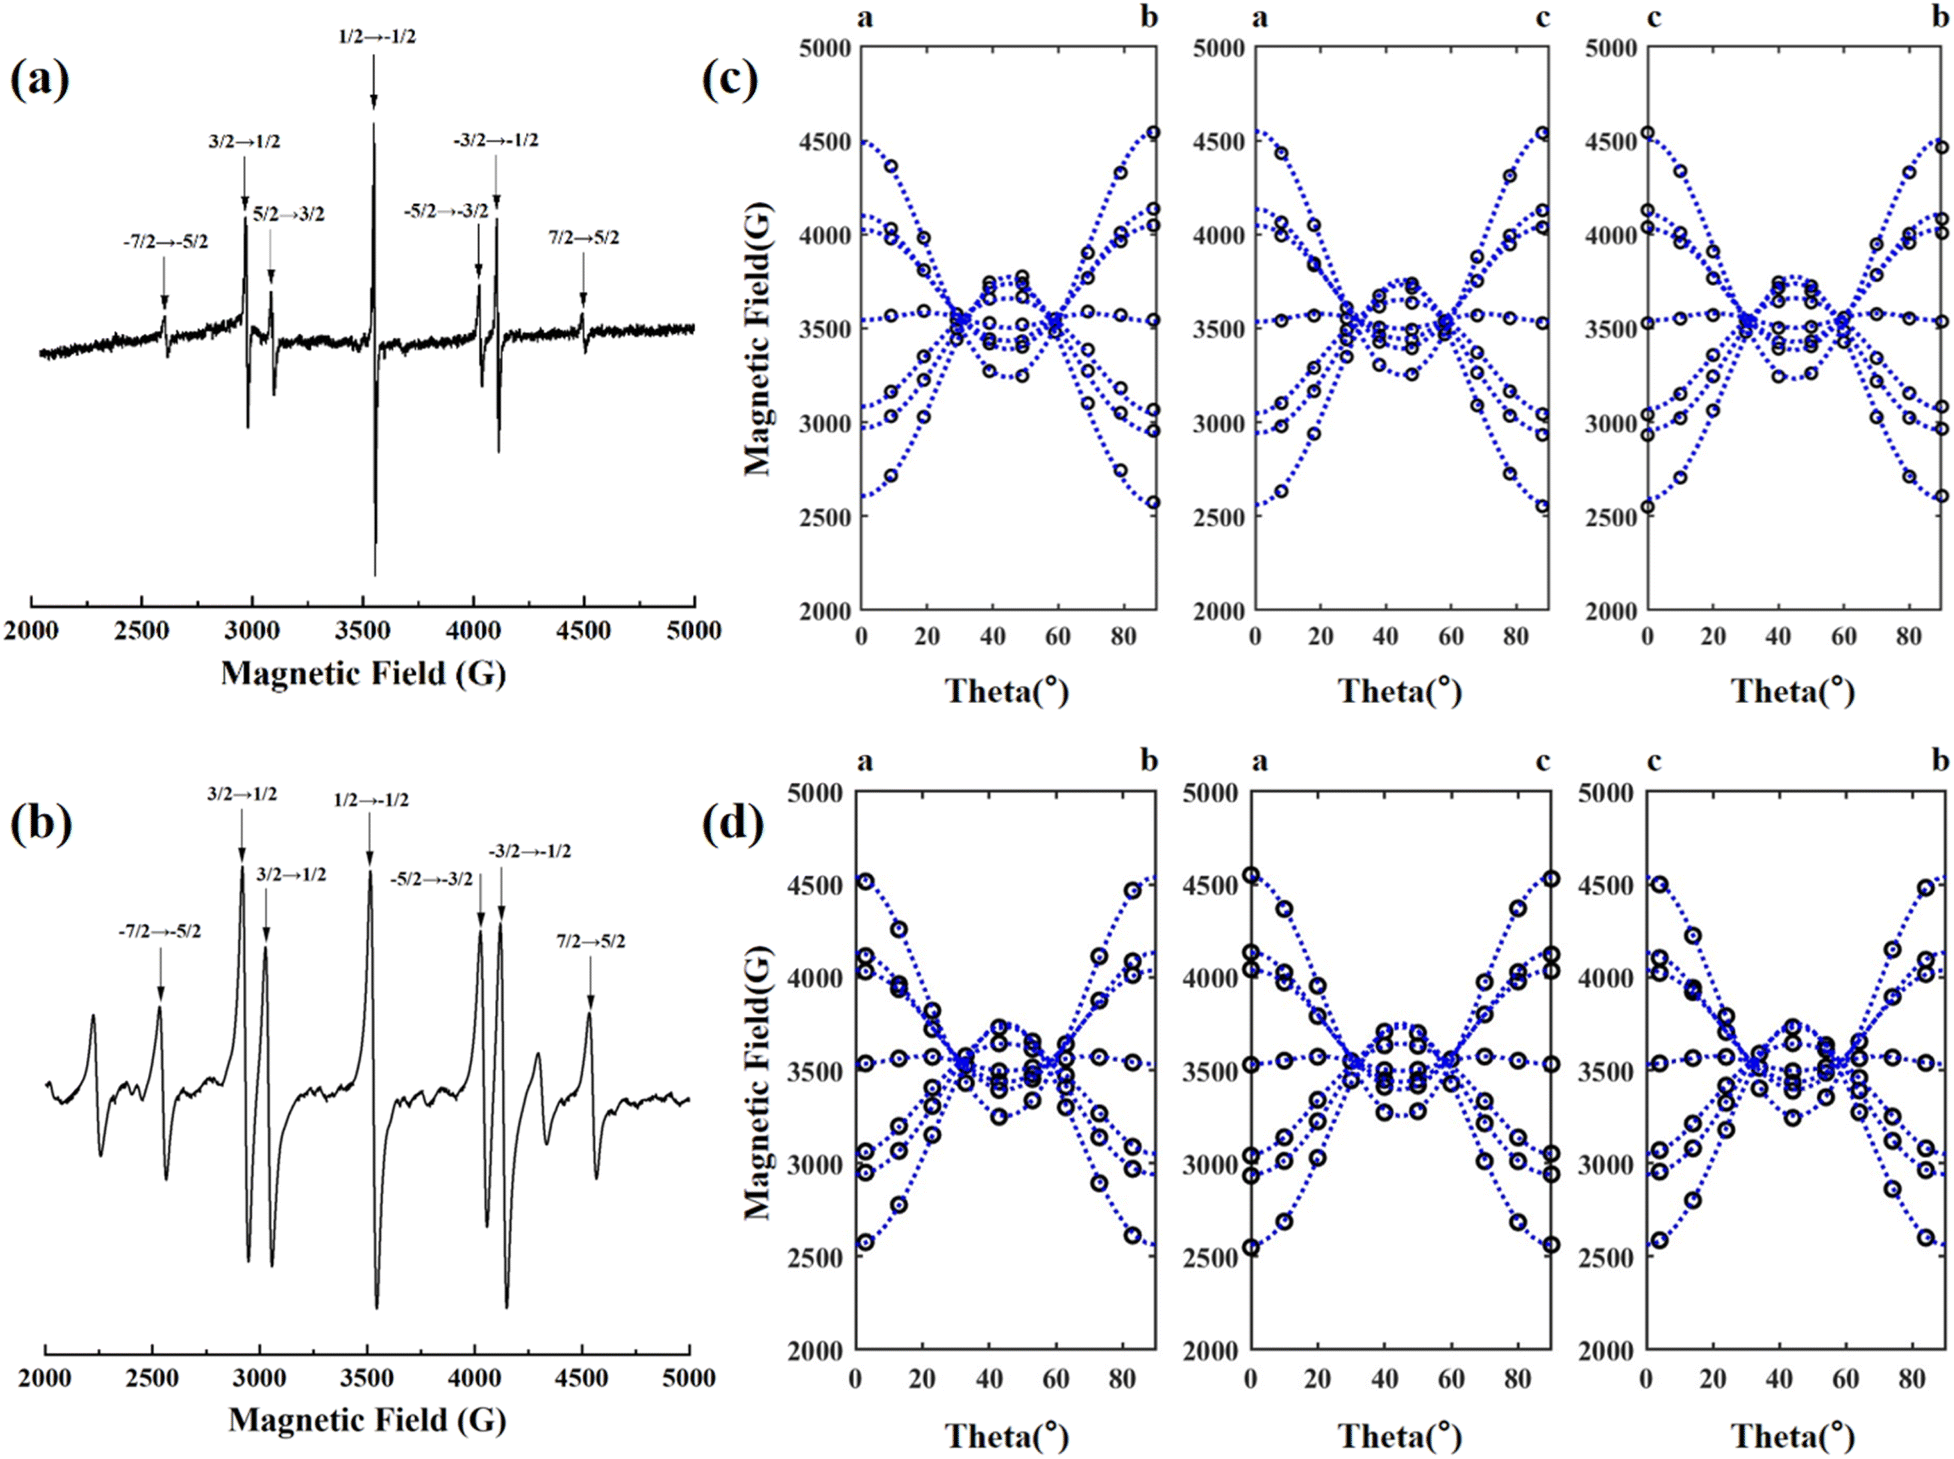 | ||
| Fig. 1 Electron paramagnetic resonance spectra of (a) NCF and (b) 1GCF crystals at room temperature with ν = 9.86 GHz, B//c. Modulation amplitude of the NCF is 1 G, and which of the 1GCF is 8 G. Angular dependence of the EPR spectra of the Gd3+ center at room temperature in the (c) NCF and (d) 1GCF crystals with the magnetic field lying in the a–b, a–c and c–b plane. Each hollow circle represents a measured EPR line and the blue dashed lines are the angular dependence of the resonance fields calculated using the fitted spin Hamiltonian parameters in Table 2. | ||
In order to obtain the complete spin Hamiltonian parameters, the angular dependence of these seven EPR lines in the planes of the crystals a–b, a–c and c–b were measured by using a homemade correlator, and the results are shown in Fig. 1(c) and (d). Experimental data were collected at 10° intervals and each hollow circle represents a measured resonance line.
The angular dependence of the EPR lines in the three planes shows the same pattern. When the direction of the scanning magnetic field relative to the crystal axis is changed, the EPR lines split and merge with the rotation of the magnetic field. When the magnetic field is parallel to the a, b and c axes of the crystal, the splitting between the seven EPR lines is the largest, and the obtained EPR spectrum is shown in Fig. 1(a). The fine structure is seen to collapse from the [100] direction when the magnetic field is at an angle of about 30° and 60° to the c-axis.
The high concentration of doped Gd3+ ions have a significant effect on their EPR spectra at room temperature. We measured the EPR spectra of four crystals, NCF, 0.1GCF, 1GCF and 5GCF, when the magnetic field is parallel to the c-axis, and the results are shown in Fig. 2(b). In very close proximity to the seven EPR spectral lines of the NCF crystal, the three highly doped samples have similar seven resonance lines. Taking the EPR line of 4497 G in Fig. 1(a) as an example, the positions of the EPR lines for the three crystals of 0.1GCF, 1GCF, and 5GCF are shifted by 45 G, 30 G, and 40 G. The EPR spectra of the three crystals of NCF, 1GCF and 5GCF are dominated by these seven EPR lines, but the 0.1GCF crystal contains a large number of other resonance lines of comparable intensity. The intensities of the seven EPR lines increase proportionally with increasing doping concentration below 1 at%, but when the concentration increases to 5 at%, the integral area decreases instead. The peak-to-peak widths of the EPR lines located near 3552 G are 7 G, 12 G, 29 G and 158 G, respectively, as the doping concentration increases.
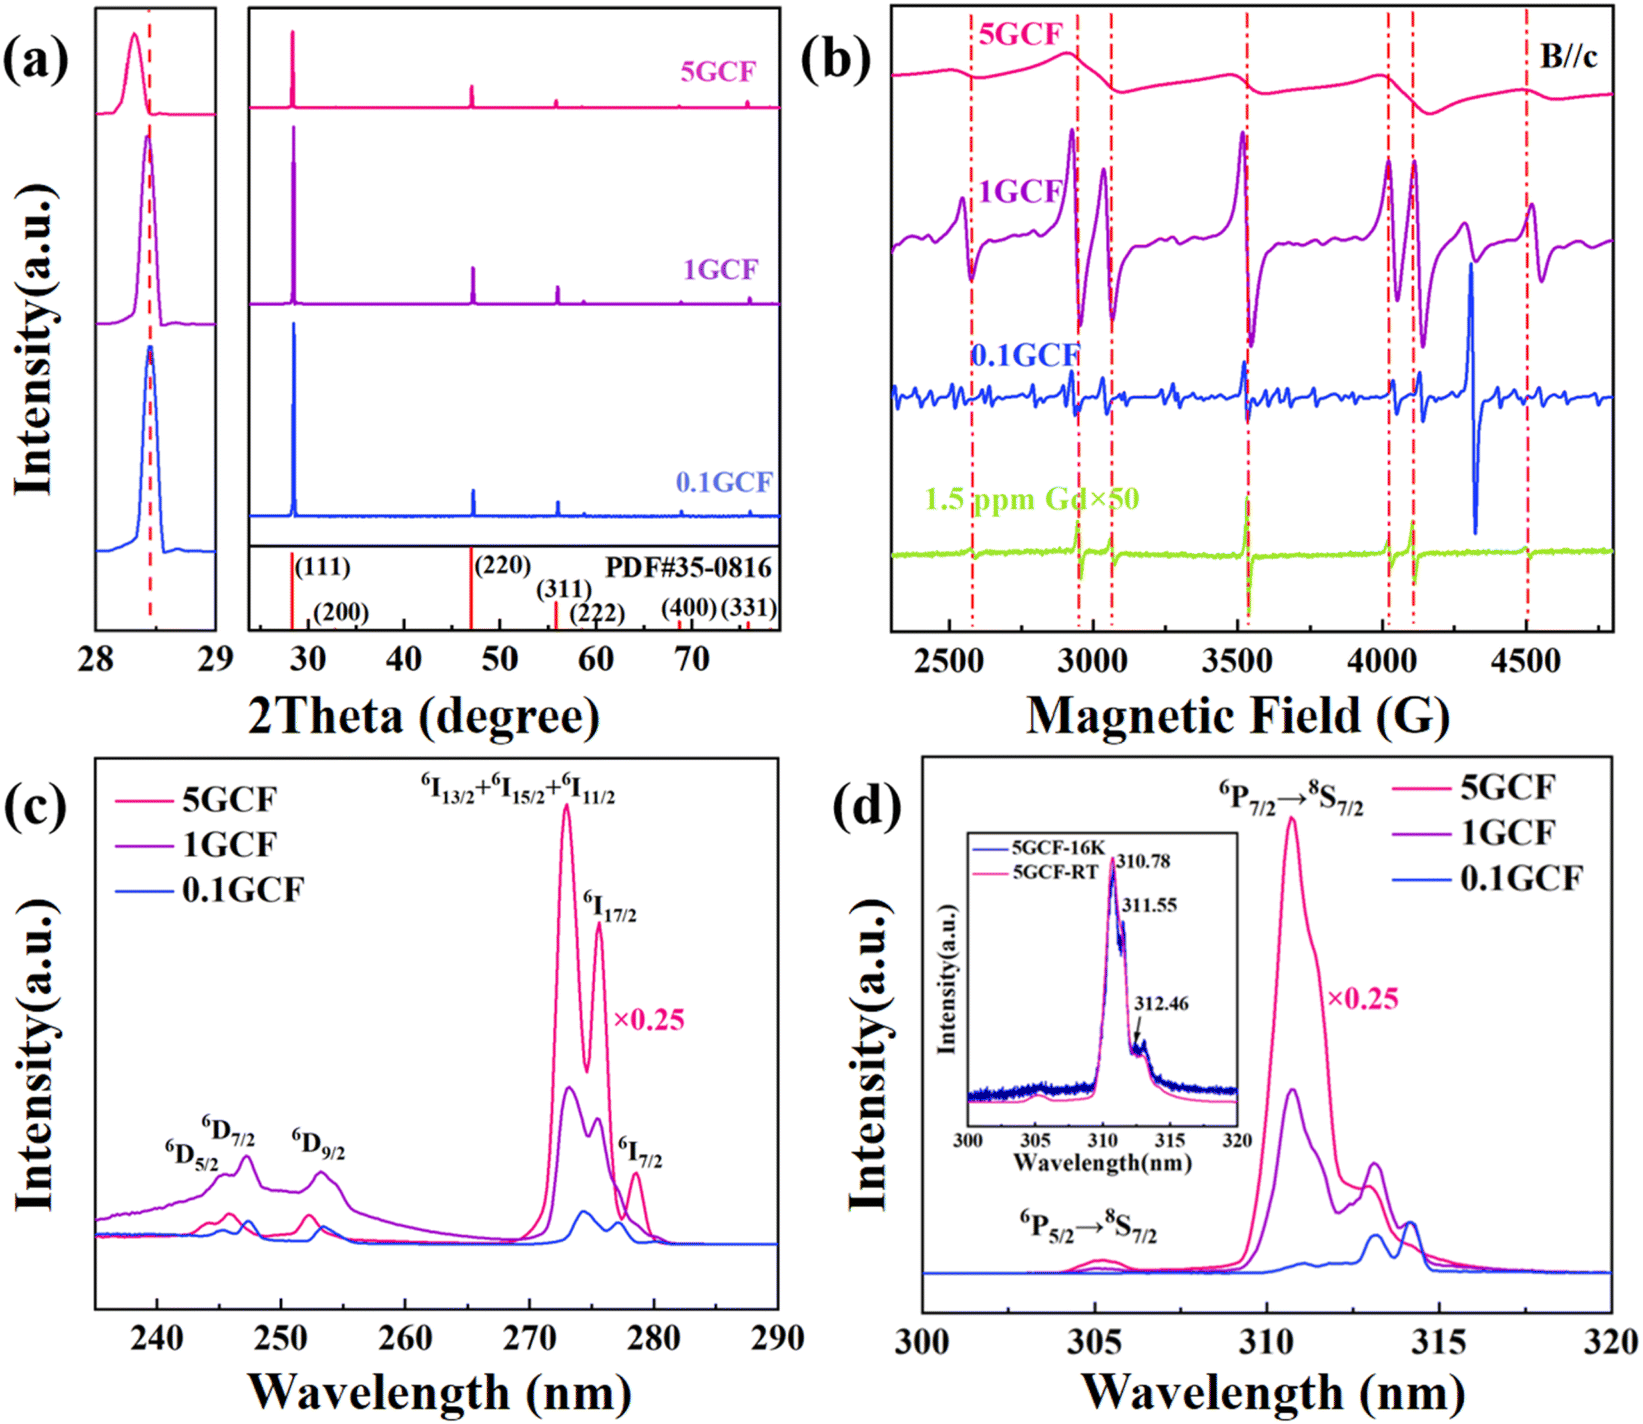 | ||
| Fig. 2 (a) High-resolution X-ray diffraction (XRD) patterns of 0.1GCF, 1GCF and 5GCF; (b) EPR spectra of NCF, 0.1GCF, 1GCF and 5GCF crystals at room temperature with ν = 9.86 GHz. B//c. Modulation amplitude is 8 G; (c) excitation and (d) PL spectra of 0.1GCF, 1GCF and 5GCF crystals at room temperature, the intensity of 5GCF was multiplied by 0.25 for clear view. | ||
3.2 Excitation and PL spectra results
The excitation and PL spectra of the samples are shown in Fig. 2(c) and (d), and the NCF sample could not be detected due to the Gd content of only 1.5 ppm. The excitation spectrum is shown in Fig. 2(c), and the monitored emission peak wavelength is 314 nm, and it can be seen that the excitation peaks were detected at 245.4 nm, 247.2 nm, 253.2 nm, 273.0 nm, 275.6 nm and 278.6 nm. The PL spectra are shown in Fig. 2(d), and there are two sets of emission peaks at around 305 nm and 314 nm. The intensity of the excitation and PL peaks gradually increases with increasing doping concentration. The low-temperature (16 K) PL spectrum of 5GCF was tested, and the normalized PL spectrum is shown in Fig. 2(d), three emission peaks at 310.78 nm, 311.55 nm and 312.46 nm were observed.4. Data analysis and discussion
4.1 The Hamiltonian parameters of the Gd3+ monomer
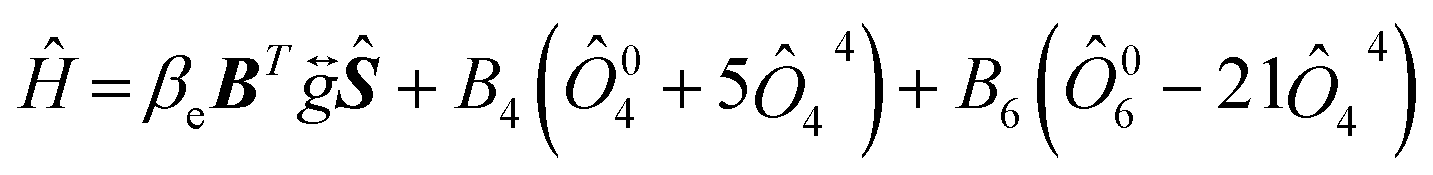
Before investigating the cluster structure of Gd3+, it is first necessary to fit the Hamiltonian parameters of the Gd3+ monomer by studying low concentration samples, and accurate monomer spin Hamiltonian parameters are the necessary basis for describing the dimer EPR angular dependence. Seven characteristic EPR resonance lines were observed in both 1.5 ppm Gd samples and samples doped with different concentrations of Gd, with positions and angular dependence consistent with the cubic field Gd3+ reported.40,41 The model of nonlocally compensated cubic Gd3+ centers in the crystal structure of MF2 is formed by the substitution of Gd3+ ions for the divalent cation Ca2+. With Gd3+ at the center of a simple cube consisting of eight fluoride ions, the required charge compensator is located far enough away from the Gd3+ ions so that the cubic symmetry at Gd3+ is ensured.42 Thus, the observed EPR spectrum of the cubic field of the Gd3+ ion in CaF2 and its dependence on the angle is described by a spin Hamiltonian Ĥ as follows:
 | (1) |
In eqn (1), the first term is the electron Zeeman term, and the second and third terms represent fine-structure splitting of the 8S7/2 ground state due to the crystal-field. The symmetric g-matrix requires six independent parameters, including three principal values and three Euler angles to specify the molecular coordinates relative to the crystal coordinates. In this work, the three principal values of the g tensor are set equal, and B4 and B6 are two independent higher-order crystal field constants. We performed a least-squares fit to the angular dependence of Fig. 1(c) and (d) using eqn (1) with the three independent parameters of g, B4 and B6. The fitting process precisely diagonalizes the Hamiltonian matrix of eqn (1). The fitting results are shown in Table 2. It can be seen that the parameters of our fitted cubic configuration do not differ much from the literature.40,41 The calculated curves of the angular dependences were obtained using the fitting values from Table 2, as shown by the blue dashed line in Fig. 1(c) and (d). It can be seen that the value of the Landé factor gNCF = 1.9862 and g1GCF = 1.9889. If the ground state of the 4f7 ions were a pure 8S7/2 state, the only non-zero interaction in a magnetic resonance experiment would be the Zeeman interaction, and g would be isotropic and very close to the free spin value of 2.00232. Shifts of the principal values from the free-spin value are caused by spin–orbit interactions.44 In subsequent work, ab initio calculations of the g-factor values can be carried out using the multi-configuration response theory.45
| Ref. 40 | g | 1.991 ± 0.002 |
| B4 | −2.3109 ± 0.025 MHz | |
| B6 | −0.0024 ± 0.0012 MHz | |
| Ref. 41 | g | 1.9918 ± 0.0010 |
| B4 | −2.3284 ± 0.015 MHz | |
| B6 | −0.0035 ± 0.0015 MHz | |
| NCF | g | 1.9862 ± 0.0007 |
| B4 | −2.3153 ± 0.0015 MHz | |
| B6 | −0.0004 ± 0.0001 MHz | |
| Dev. | 12.4558 G/0.6250% | |
| 1GCF | g | 1.9889 ± 0.0007 |
| B4 | −2.3023 ± 0.0080 MHz | |
| B6 | 0.0010 ± 0.0019 MHz | |
| Dev. | 9.5084 G/0.4749% |
There are six stable isotopes of Gd, among which the isotopes with nuclear spin I = 3/2 have an abundance of 14.8% for 155Gd and 15.65% for 157Gd, and the rest of 154Gd, 156Gd, 158Gd and 160Gd have nuclear spin I = 0. However, hyperfine splitting induced by 155Gd and 157Gd is not observed in Fig. 1(a). The reason is that the hyperfine constants A155 = 4.0 G and A157 = 5.34 G,46 both of which are smaller than the peak-to-peak width of 7 G of the spectral lines, and thus the hyperfine structure is hidden in the spectral lines and not observed.
It is noteworthy that when trivalent cations are doped into CaF2 crystals, F− ions are introduced into the interstitial positions to satisfy the charge balance of the system.47 Due to the different positions of the interstitial F− ions, the doping positions of the rare earth ions become unequal, where the most typical way of charge compensation is to introduce an interstitial F− in the nearest neighbor position (NN) of the trivalent cation to form a locally symmetric structure of C4v. In our samples, only Gd3+ with a local symmetry of Oh was observed. Friedman and Low found, by varying the annealing process, that these differences were mainly related to the rate at which the temperature of the crystals decreased during the thermal gradient and/or annealing process.48 In fast-growing (0.5 to 1 inch per hour) crystals, the excess F− does not have sufficient time to diffuse to more energetically stable sites near the trivalent ions, and Gd3+ tends to show cubic symmetry.
4.2 Effect of Gd doping concentration on local structure
At higher doping concentrations, exchange interaction (EI) occurs between Gd3+–Gd3+, which is caused by orbital overlap, and if the magnetic orbital orientation between the two ions favors the formation of the largest possible overlap integrals, then the exchange coupling constant J < 0, results in the formation of an antiferromagnetic coupling, and the ground state |S1–S2| = 0, and the number of unpaired electrons in the system Seff = 0, i.e., the EPR silent state. The reason that the integral area of the EPR spectral line of 5GCF in Fig. 2(b) is smaller than that of 1GCF is that the exchange interaction between Gd3+–Gd3+ leads to the EPR signal quench of most of the Gd3+ in 5GCF. The exchange interaction causes the EPR peak-to-peak width broadening. At the same time, there is a magnetic dipole–dipole interaction (MDDI) between Gd3+. In high concentration samples, MDDI also leads to the broadening of the EPR spectrum. The higher the spin concentration, the shorter the inter-spin distance, the stronger the MDDI, the more efficient the energy relay transfer, and the larger the spectrum broadening.49 Therefore, in Fig. 2(b), it is observed that the EPR spectra gradually broaden with increasing concentration (ESI Fig. 2†). Comparison of the concentration and the integral area of the EPR lines of the samples with different concentrations shows that the concentration of the NCF, 0.1GCF and 1GCF samples is proportional to the integral area (ESI Fig. 3†) suggesting that the other EPR lines in the 0.1GCF belong to other impurity ions. Among them, 7 spectral lines at 2316 G, 2768 G, 2906 G, 3550 G, 4162 G, 4342 G and 4776 G may be cubic Eu(II) signals (ESI Fig. 6†),50 and the remaining impurity signals need to be further studied. For the GCF crystals grown from the same batch, similar EPR resonance lines for impurities were observed in 0.1GCF and 1GCF, and the EPR resonance lines for 5GCF were severely broadened, so no impurity peaks were observed, and thus the impurities were presumed to be from the feedstock.For the shift of the EPR spectral line with the concentration of Gd ions in the sample observed in Fig. 2(b), we have fitted it using the open-source MATLAB program package easyspin,51 and the results are shown in Table 3. It can be seen that the absolute value of the fourth-order crystal field parameter B4 gradually decreases with increasing doping concentration. According to the experimental results of XRD in Fig. 2(c), the lattice constants given are also listed in Table 3. From the results in Table 3, it can be seen that the lattice constants increase gradually as the doping concentration is elevated, the distance between the Gd3+ and the surrounding F− ions is gradually increased, and the effect of the crystal field on the Gd3+ is weakened, which leads to a gradual decrease in the crystal field splitting of the EPR lines.
| Gd (at%) | B4 (MHz) | B6 (MHz) | Lattice constant (Å) | |
|---|---|---|---|---|
| 5GCF | 5.75 | −2.24163 | −0.00059 | 5.4828 |
| 1GCF | 1.22 | −2.29283 | −0.00017 | 5.4664 |
| 0.1GCF | 0.17 | −2.29983 | −0.00050 | 5.4631 |
| CaF2 | 5.4619 |
The EPR lines in the center of NCF, 0.1GCF, 1GCF and 5GCF were fitted, and it was found that the EPR lines of NCF, 1GCF and 5GCF were Lorentzian line shape, while the spectral lines of 0.1GCF were Gaussian line shape (ESI Fig. 4†). When the spin concentration is very low, the EPR transition depends only on the spin-lattice interaction, and the absorption peak is Lorentzian line shape, which accords with our judgment that Gd3+ in NCF are all monomers. With the increase of doping concentration, spin–spin interaction results in Gaussian line shape of 0.1GCF. The doping concentration increases further, exchange interaction between neighbors exceeds the purely dipole interaction, the effects produced by exchange interaction are complex. If the spins are identical, the line is narrowed in the center and extended in the wings. This phenomenon is called ‘exchange narrowing’, and the shape approximates to a Lorentzian line shape.44
The excitation and PL spectra of the samples are shown in Fig. 2(c) and (d). The energy state with orbital angular momentum L = 1 and spin S = 5/2 is split into 6P3/2, 6P5/2 and 6P7/2 state, the energy state with orbital angular momentum L = 2 and spin S = 5/2 is split into 6D5/2, 6D7/2 and 6D9/2 state, and the energy state with orbital angular momentum L = 6 and spin S = 5/2 is split into 6I7/2, 6I11/2, 6I13/2, 6I15/2 and 6I17/2 state by the spin–orbit interaction. In the excitation spectra, 6I11/2, 6I13/2 and 6I15/2 are combined in the absorption peak of 273.0 nm because of their similar energies. In the PL spectra, the emission bands 6P5/2 → 8S7/2 and 6P7/2 → 8S7/2 can be observed. Under the action of the crystal field, the transition at 6P7/2 → 8S7/2 appears to have several peaks.52 At 16 K, three absorption peaks at 310.7 nm, 311.6 nm and 312.1 nm were observed, which correspond to the emission peaks of cubic configuration Gd3+ as reported.53 The fine structure of the Gd3+ PL spectrum changes with increasing doping concentration, and the strongest emission peak gradually changes from 314.2 nm to 310.7 nm, which further demonstrates the change of the local crystal field structure of Gd3+.53
With the increase of doping concentration, the widening, quenching and line shape changes of the EPR lines show a strong EI and MDDI between Gd3+, and the changes in the fine structure of the excitation and PL spectra show the changes in the local crystal field structure of Gd3+. Theoretical findings suggest that monomers tend to aggregate to form high-order clusters to make the fluorite system more stable,54–56 which, in combination with the above experimental results, explains the formation of Gd3+ clusters.
4.3 Theoretical calculations of Gd3+–Gd3+ dimer
The distribution and configuration of Gd3+–Gd3+ in Gd3+ clusters are further analyzed using theoretical calculations.57 For simplicity, two Gd3+ are considered to occupy the Ca2+ center lattice position separately, and the point group symmetries are both cubic, i.e., the magnetic equivalence case. For the Gd3+–Gd3+ ion pair occupying the cubic symmetric magnetic equivalence, its spin Hamiltonian under the external magnetic field B can be written as:| Hpair = SA·geff·B + SB·geff·B − 2J(R)·SA·SB + SA·K·SB | (2) |
The essence of the above spin Hamiltonian quantity (2) is first to project the two energy levels corresponding to each EPR spectral line of an isolated Gd3+ ion into a subspace with an equivalent spin S of 1/2 (geff is its equivalent g-factor), and then it is equivalent to consider the effect of the exchange interaction J and the magnetic dipole interaction K on the spectral lines between two ion pairs with equivalent spins of 1/2. Using the energy ΔE between the corresponding two energy levels in combination with the EPR spectral resonance condition: ΔE(B) = hν, the location of the magnetic field of the EPR spectral resonance of the corresponding Gd3+–Gd3+ ion pair can be determined by the analytic formulas given in ref. 54.
Based on the crystal structure of CaF2, two dimer cases are considered, (1) Gd3+–Gd3+ ion pair with distance R = 7.7 Å and ion pair spatial orientation along the [110] direction, as in Fig. 3(c); (2) Gd3+–Gd3+ ion pair with distance R = 5.44 Å and ion pair spatial orientation along the [100] direction, as in Fig. 3(f). Taking the position of the monomer Gd3+ EPR lines in the NCF as the position before splitting and considering only the interactions, it is calculated that the seven EPR lines of the Gd3+ ion split in response to EI and MDDI between the ion pairs. As shown in Fig. 3(a), (b), (d) and (e), the dark gray solid lines are the experimentally measured EPR lines, and the colored hollow circles are the theoretically calculated EPR line positions, where the three hollow circles of the same angle and the same color scheme indicate the EPR line positions of the Gd3+ monomer as well as the theoretically calculated positions of the two EPR lines of the split, respectively. The isotropic exchange interaction does not change the positions of the spectral lines. Two split resonance lines are not observed due to the widening of the EPR lines. Because the effect of the crystal field on the Gd3+ between NCF and 1GCF is different, there is a deviation between the theoretically calculated EPR lines positions and the measured EPR lines positions of 1GCF. Calculations show that the EPR line splitting values are comparable to the peak-to-peak width of the EPR lines of 1GCF when the Gd3+–Gd3+ ion pair distance R = 7.7 Å and along the [110] direction, as shown in Fig. 3(a) and (b). When the Gd3+–Gd3+ ion-pair distance R = 5.44 Å and along the [100] direction, the EPR line splitting value differs from the peak-to-peak width of the EPR line of 1GCF, as shown in Fig. 3(d) and (e). Only a single Lorentzian peak was obtained by fitting the center peak shape of 1GCF, suggesting that the majority of Gd3+ in 1GCF is distributed as a dimer conformation along the [110] direction and at a distance about 7.7 Å.
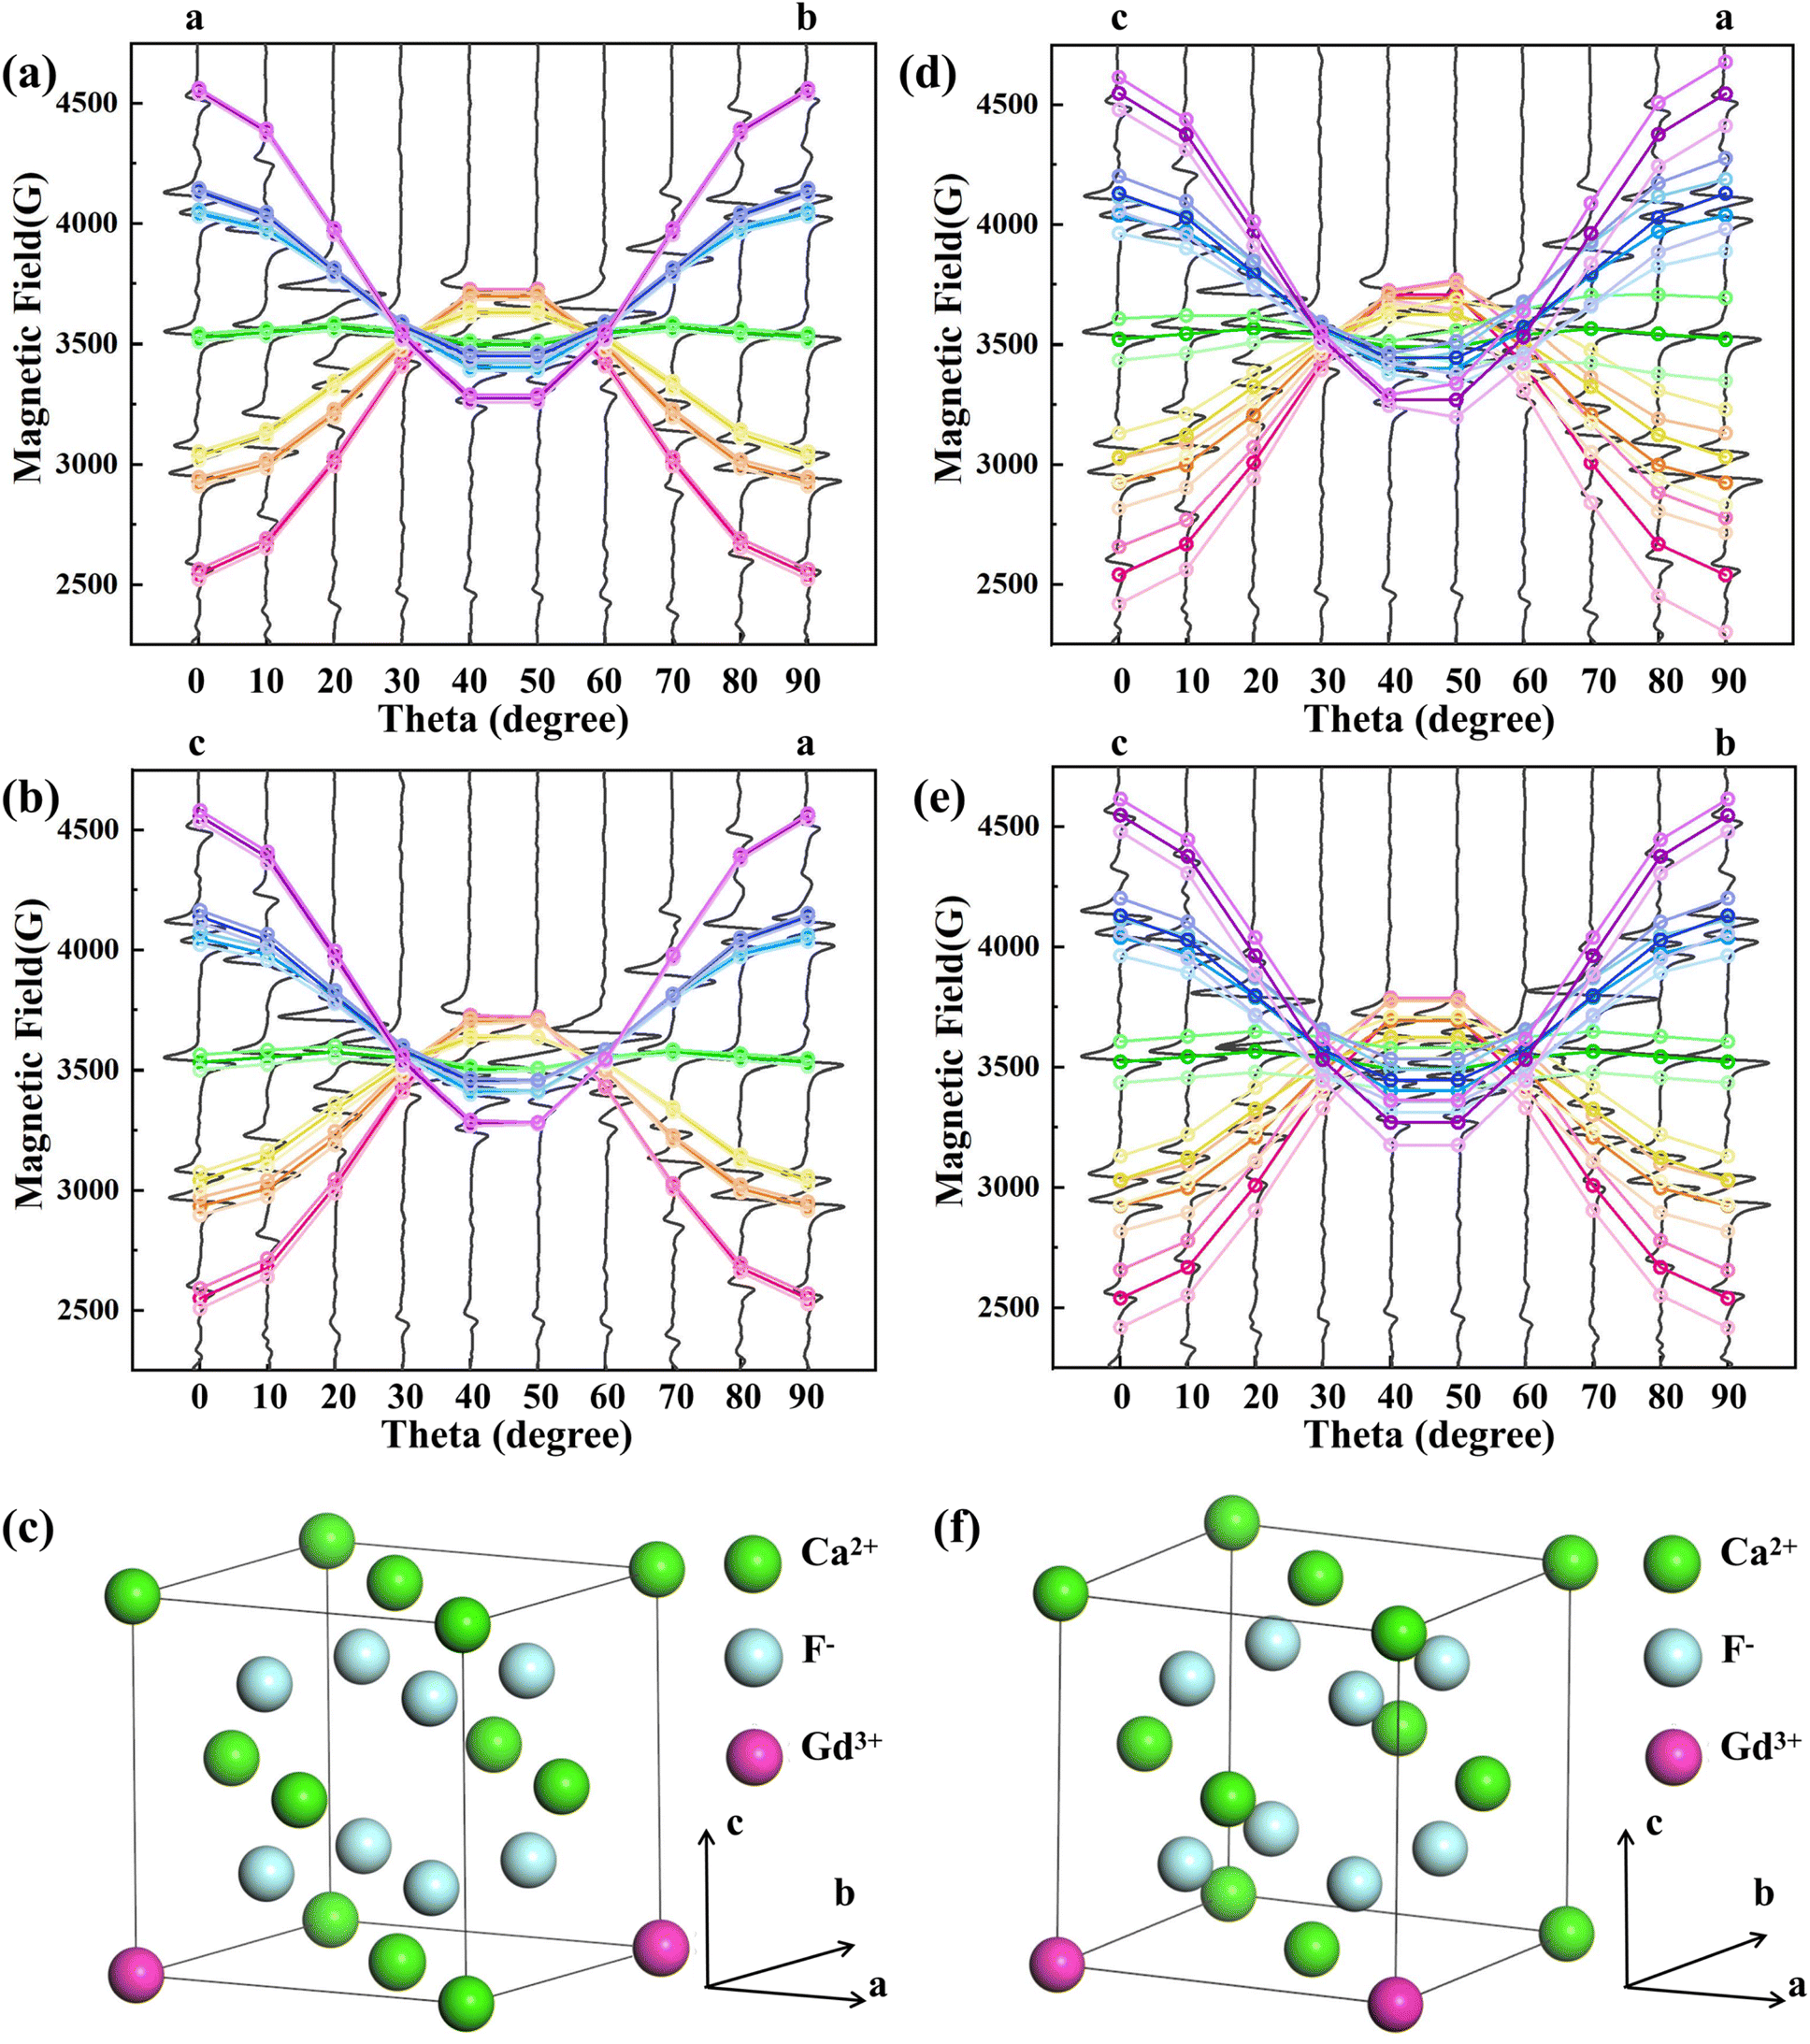 | ||
| Fig. 3 Theoretical calculations of EPR spectral lines with magnetic field angle in the (a) ab plane and (b) ac plane for Gd3+–Gd3+ distance R = 7.7 Å; (c) Gd3+–Gd3+ ion pair orientation parallel to the [110]; theoretical calculations of EPR spectral lines with magnetic field angle in the (d) ac plane and (e) bc plane for Gd3+–Gd3+ distance R = 5.44 Å; (f) Gd3+–Gd3+ ion pair orientation parallel to the [100] direction. | ||
After Gd3+ substitution for Ca2+, the structural relaxation is small, the symmetry is hardly broken, and the cubic conformation remains (Fig. 4), which is in accordance with the EPR fitting results of 1GCF. The bond length between Ca2+ and F− in the normal lattice is 2.365 Å. After a single Gd3+ replaces Ca2+, the bond length between Gd3+ and F− becomes 2.328 Å, which is slightly reduced compared with the intact crystal. After the substitution of two Gd3+ for Ca2+, the bond length of Gd3+ with F− becomes 2.373 Å, which is slightly increased. The reason is that the Bader charge of Gd3+ after a single Gd3+ replaces Ca2+ (6.828e) is smaller than that of Gd3+ after two Gd3+ replaces Ca2+ (7.060e), i.e., the former carries a higher positive charge, and there is a larger coulombic gravitational force between Gd3+ and F−, and therefore, the former has a shorter bond length. The shorter bond length of Gd3+ with F− in dimer suggests that there is less crystal-field interaction in 1GCF. The absolute value of the crystal field action parameter B4 is smaller, consistent with the results of the EPR fits for NCF and 1GCF.
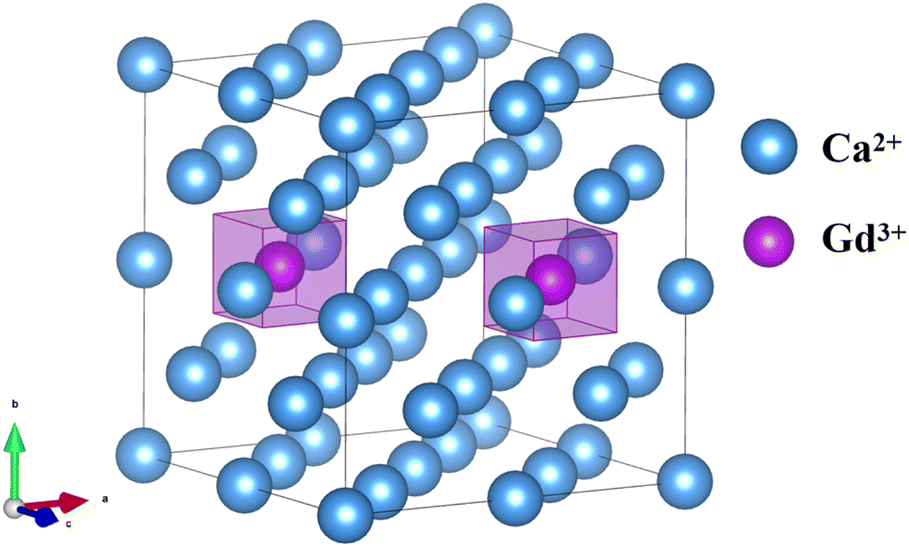 | ||
| Fig. 4 A schematic diagram of a 2 × 2 × 2 supercell of the CaF2 crystal (for clarity, F− ions are removed from the figure), Gd3+–Gd3+ ion pair orientation parallel to the [110]. | ||
5. Conclusions
In summary, we prepared four Gd:CaF2 crystals in this work. The spin Hamiltonian of the 1.5 ppm Gd impurity sample shows that Gd3+ is in cubic conformation in CaF2, which may be attributed to the fact that the F−, which acts as a charge compensator, is located farther away from the center of Gd3+. The results of EPR tests in the axial direction of Gd:CaF2 crystals with different concentrations show that the signal intensity of the cubic conformation of Gd is enhanced and then weakened with increasing doping concentration, and the EPR lines are broadened, which indicates that the EI and MDDI between Gd3+–Gd3+ are enhanced, and the distance between Gd3+–Gd3+ is gradually shortened with the increase of doping concentration. The excitation and PL spectra show that the fine structure of the spectra changes with increasing doping concentration, which further proves that the crystal field of Gd3+ changes. Combining the test results of EPR and optical spectra, it can be hypothesized that Gd3+ aggregates to form cluster structures with increasing doping concentration. By fitting experimentally measured angular dependence data for 1.22 at% Gd:CaF2 crystals, combined with theoretical calculations, it was obtained that most of the Gd3+ is in the dimer configuration distributed along the [110] direction and at a distance of 7.7 Å, and the Gd3+ remains cubic. The present work explains the variation of the localized structure of Gd3+ in CaF2 matrix with concentration, which is of some reference value for the evolution of cluster structure of other rare earth ions in alkaline earth metal fluoride.Data availability
The data supporting this study's findings are available from the corresponding author upon reasonable request.Author contributions
Conceptualization, project administration and resources: Wei Hong and Liangbi Su. Data curation: Fang Tan. Formal analysis and software: Shirui Luo, Fang Tan and Liening Wei. Funding acquisition: Wei Hong, Liangbi Su, Huamin Kou and Dapeng Jiang. Investigation and validation: Shirui Luo performed the electron paramagnetic resonance test. Yu Liu performed the optical experiment. Huaize Qin, Jingguo Zhu and Junjie Hu prepared the crystal sample. Methodology: Honggang Liu performed theoretical calculations of Gd3+–Gd3+ pairs, and Tingyu Liu performed the DFT calculations. Supervision: Zhen Zhang, Fengkai Ma and Zhonghan Zhang. Visualization: Shrui Luo. Writing – original draft: Shirui Luo. Writing – review & editing: Wei Hong.Conflicts of interest
There are no conflicts to declare.Acknowledgements
This work has been financially supported by the National Key Technologies R&D Program (2022YFB3605701), the National Natural Science Foundation of China (U2230103, 61925508) and CAS Project for Young Scientists in Basic Research (YSBR-024).References
- H. Schwoerer, B. Liesfeld, H. P. Schlenvoigt, K. U. Amthor and R. Sauerbrey, Phys. Rev. Lett., 2006, 96, 014802 CrossRef CAS
.
- U. Keller, Nature, 2003, 424, 831–838 CrossRef CAS
- R. A. Snavely, M. H. Key, S. P. Hatchett, T. E. Cowan, M. Roth, T. W. Phillips, M. A. Stoyer, E. A. Henry, T. C. Sangster, M. S. Singh, S. C. Wilks, A. MacKinnon, A. Offenberger, D. M. Pennington, K. Yasuike, A. B. Langdon, B. F. Lasinski, J. Johnson, M. D. Perry and E. M. Campbell, Phys. Rev. Lett., 2000, 85, 2945–2948 CrossRef CAS
- E. L. Clark, K. Krushelnick, M. Zepf, F. N. Beg, M. Tatarakis, A. Machacek, M. I. K. Santala, I. Watts, P. A. Norreys and A. E. Dangor, Phys. Rev. Lett., 2000, 85, 1654–1657 CrossRef CAS PubMed
- D. Strickland and G. Mourou, Opt. Commun., 1985, 55, 447–449 CrossRef CAS
- A. A. Kuzmin, E. A. Khazanov, O. V. Kulagin and A. A. Shaykin, Opt. Express, 2014, 22, 20842–20855 CrossRef CAS
- K. Ertel, C. Hooker, S. J. Hawkes, B. T. Parry and J. L. Collier, Opt. Express, 2008, 16, 8039–8049 CrossRef PubMed
- R. Soulard, D. Stoffel, J.-L. Doualan, A. Braud, S. Montant, J.-P. Goossens, P. Camy, in Laser Congress 2018 (ASSL), Optica Publishing Group, Boston, Massachusetts, 2018, p. ATu2A.18 Search PubMed
- J. Zhu, L. Wei, W. Tian, J. Liu, Z. Wang, L. Su, J. Xu and Z. Wei, Laser Phys. Lett., 2016, 13, 055804 CrossRef
- S. Wang, D. Jiang, Q. Wu, S. Pang, J. Wang, X. Qian, J. Liu, B. Mei and L. Su, J. Alloys Compd., 2019, 781, 629–632 CrossRef CAS
- F. K. Ma, D. P. Jiang, L. B. Su, J. Y. Wang, W. Cai, J. Liu, J. G. Zheng, W. G. Zheng, J. Xu and Y. Liu, Opt. Lett., 2016, 41, 501–503 CrossRef CAS
- A. A. Kaminskii, V. V. Osico, A. M. Prochorov and Y. K. Voronko, Phys. Lett., 1966, 22, 419–421 CrossRef CAS
- A. Kaminskii, Zhetf Pisma Redaktsiiu, 1967, 6, 615 CAS
- A. A. Kaminskii, N. R. Agamalyan, G. A. Deniseneo, S. E. Sarkisov and P. P. Fedorov, Phys. Status Solidi A, 1982, 70, 397–406 CrossRef CAS
- K. S. Bagdasarov, Y. K. Voronko, A. A. Kaminskii, L. V. Krotova and V. V. Osiko, Phys. Status Solidi B, 1965, 12, 905–912 CrossRef CAS
- Z. P. Qin, G. Q. Xie, J. Ma, W. Y. Ge, P. Yuan, L. J. Qian, L. B. Su, D. P. Jiang, F. K. Ma, Q. Zhang, Y. X. Cao and J. Xu, Opt. Lett., 2014, 39, 1737–1739 CrossRef CAS PubMed
- X. Tang, J. Qiu, Z. Fan, L. Su and H. Wang, Opt. Mater., 2016, 58, 445–448 CrossRef CAS
- M. Abraham, R. A. Weeks, G. W. Clark and C. B. Finch, Phys. Rev., 1965, 137, A138–A142 CrossRef
- J. Stäblein, K. Pöhl, A. Weisleder, G. v. d. Gönna, T. Töpfer, J. Hein and M. Siebold, Optical Properties of CaF2 and Yb3+:CaF2 for Laser Applications, Proc. SPIE, 2011, 8080, 808002 CrossRef
- S. Zhang, L. Wang, G. Zhu, M. Diehl, A. Maldar, X. Shang and X. Zeng, Int. J. Plast., 2022, 150, 103186 CrossRef CAS
- C. R. A. Catlow, A. V. Chadwick, G. N. Greaves and L. M. Moroney, Nature, 1984, 312, 601–604 CrossRef CAS
- Y. K. Voron'ko, A. A. KAminskii and V. V. Osiko, JETP Lett., 1965, 2, 294 Search PubMed
- D. R. Tallant and J. C. Wright, J. Chem. Phys., 1975, 63, 2074–2085 CrossRef CAS
- C. Andeen, D. Link and J. Fontanella, Phys. Rev. B, 1977, 16, 3762–3767 CrossRef CAS
- C. R. A. Catlow, A. V. Chadwick and J. Corish, J. Solid State Chem., 1983, 48, 65–76 CrossRef CAS
- A. K. Cheetham, B. E. F. Fender and M. J. Cooper, J. Phys. C: Solid State Phys., 1971, 4, 3107–3121 CrossRef CAS
- F. Ma, F. Su, R. Zhou, Y. Ou, L. Xie, C. Liu, D. Jiang, Z. Zhang, Q. Wu, L. Su and H. Liang, Mater. Res. Bull., 2020, 125, 110788 CrossRef CAS
- F. Ma, Z. Zhang, D. Jiang, Z. Zhang, H. Kou, A. Strzep, Q. Tang, H. Zhou, M. Zhang, P. Zhang, S. Zhu, H. Yin, Q. Lv, Z. Li, Z. Chen and L. Su, Cryst. Growth Des., 2022, 22, 4480–4493 CrossRef CAS
- F. Ma, H. Zhou, Q. Tang, L. Su, M. Zhang, P. Zhang, H. Yin, Z. Li, Q. Lv and Z. Chen, J. Alloys Compd., 2022, 899, 162913 CrossRef CAS
- G. Vincow and W. Low, Phys. Rev., 1961, 122, 1390–1392 CrossRef CAS
- M. J. Weber and R. W. Bierig, Phys. Rev., 1964, 134, A1492–A1503 CrossRef CAS
- U. Ranon and J. S. Hyde, Phys. Rev., 1966, 141, 259–274 CrossRef CAS
- E. S. Sabisky, Phys. Rev., 1966, 141, 352–362 CrossRef CAS
- F. M.-t. Lay and A. W. Nolle, Phys. Rev., 1967, 163, 266–275 CrossRef CAS
- J. Kirton and S. D. McLaughlan, Phys. Rev., 1967, 155, 279–284 CrossRef CAS
- M. R. Brown, K. G. Roots, J. M. Williams, W. A. Shand, C. Groter and H. F. Kay, J. Chem. Phys., 1969, 50, 891–899 CrossRef CAS
- L. K. Aminov, I. N. Kurkin, A. V. Lovchev, R. M. Rakhmatullin, A. A. Rodionov and S. L. Korableva, Mater. Chem. Phys., 2020, 240, 122136 CrossRef CAS
- S. A. Kazanskii, A. I. Ryskin, A. E. Nikiforov, A. Y. Zaharov, M. Y. Ougrumov and G. S. Shakurov, Phys. Rev. B:Condens. Matter Mater. Phys., 2005, 72, 014127 CrossRef
- S. M. Saini, N. Singh, T. Nautiyal and S. Auluck, Solid State Commun., 2006, 140, 125–129 CrossRef CAS
- W. Low, Phys. Rev., 1958, 109, 265–271 CrossRef CAS
- C. Ryter, Helv. Phys. Acta, 1957, 30, 353–373 CAS
- S. Lee, A. J. Bevolo and C.-C. Yang, J. Chem. Phys., 1974, 60, 1628–1633 CrossRef CAS
- J. M. Baker, B. Bleaney and W. Hayes, Proc. R. Soc. London, Ser. A, 1958, 247, 141–151 CAS
- A. Abragam, B. Bleaney, Electron Paramagnetic Resonance of Transition Ions, 1970, pp. 52–60 Search PubMed
- O. Vahtras, B. Minaev and H. Ågren, Chem. Phys. Lett., 1997, 281, 186–192 CrossRef CAS
- W. Low, Phys. Rev., 1956, 103, 1309 CrossRef CAS
- S. Fang, Q. Zhang, Crystal Color Center Physics, Shanghai, Shanghai Jiao Tong University Press, 1989 Search PubMed
- E. Friedman and W. Low, J. Chem. Phys., 1960, 33, 1275–1276 CrossRef CAS
- J. Su, J. Du, Electron Paramagnetic Resonance Spectroscopy: Principles and Applications, Beijing, Science Press, 2022 Search PubMed
- R. S. Title, Phys. Lett., 1963, 6, 13–14 CrossRef CAS
- S. Stoll and A. Schweiger, J. Magn. Reson., 2006, 178, 42–55 CrossRef CAS
- H. M. Crosswhite, R. L. Schwiesow and W. T. Carnall, J. Chem. Phys., 1969, 50, 5032–5033 CrossRef CAS
- J. Makovsky, Phys. Lett., 1966, 19, 647–649 CrossRef CAS
- J. Corish, C. R. A. Catlow, P. W. M. Jacobs and S. H. Ong, Phys. Rev. B:Condens. Matter Mater. Phys., 1982, 25, 6425–6438 CrossRef CAS
- P. J. Bendall, C. R. A. Catlow, J. Corish and P. W. M. Jacobs, J. Solid State Chem., 1984, 51, 159–169 CrossRef CAS
- C. R. A. Catlow and M. J. Norgett, J. Phys. C: Solid State Phys., 1973, 6, 1325–1339 CrossRef CAS
- H. Liu and W. Zheng, J. Appl. Phys., 2018, 123, 025105 CrossRef
Footnote |
| † Electronic supplementary information (ESI) available. See DOI: https://doi.org/10.1039/d4ra08622h |
| This journal is © The Royal Society of Chemistry 2025 |