
 Open Access Article
 This Open Access Article is licensed under a Creative Commons Attribution-Non Commercial 3.0 Unported Licence
A highly sensitive electrochemical sensor for the detection of lead(II) ions utilizing rice-shaped bimetallic MOFs incorporated reduced graphene oxide†
Tien Dat Doanab,
Thi Hai Yen Phama,
Dinh Dung Luong a,
Nhung Hac Thiab,
Ho Thi Oanha,
Thu Thao Lec,
Ha Tran Nguyend,
Thi Kim Dung Hoange and
Mai Ha Hoang*ab
a,
Nhung Hac Thiab,
Ho Thi Oanha,
Thu Thao Lec,
Ha Tran Nguyend,
Thi Kim Dung Hoange and
Mai Ha Hoang*ab
aInstitute of Chemistry, Vietnam Academy of Science and Technology, 18 Hoang Quoc Viet, Cau Giay, Hanoi 10072, Vietnam. E-mail: hoangmaiha@ich.vast.vn
bGraduate University of Science and Technology, Vietnam Academy of Science and Technology, 18 Hoang Quoc Viet, Cau Giay, Hanoi 10072, Vietnam
cFaculty of Chemistry, Hanoi National University of Education, 136 Xuan Thuy, Cau Giay, Hanoi 10072, Vietnam
dNational Key Laboratory of Polymer and Composite Materials, Ho Chi Minh City University of Technology, Vietnam National University, Ho Chi Minh City 70000, Vietnam
eInstitute of Chemical Technology, Vietnam Academy of Science and Technology, 1A Thanh Loc 29 Str., Dist. 12, Ho Chi Minh City 70000, Vietnam
First published on 18th February 2025
Abstract
The detection of lead ions (Pb2+) in water is of critical importance due to the harmful effects of lead on human health and the environment. Traditional detection methods often require high user expertise, expensive equipment, and complex analytical procedures. Electrochemical sensors have emerged as effective alternatives due to their portability and affordability. In this study, a novel electrochemical sensor was developed for the sensitive and selective detection of Pb2+ based on glassy carbon electrodes (GCE) modified with bimetallic metal–organic frameworks (MOFs) and reduced graphene oxide (rGO). The bimetallic MOFs were successfully synthesized via a hydrothermal method, combining two metal centers Fe and Mg linked to a 1,4-benzene dicarboxylate ligand (FeMg-BDC). The synthesized FeMg-BDC has higher conductivity and surface area than monometallic Fe-BDC or Mg-BDC MOFs. Thanks to the synergistic effects between FeMg-BDC and rGO, the rGO/FeMg-BDC electrode has a larger electrochemically active surface area and faster electron transfer rate than the bare GCE. This enhancement facilitated the accumulation of lead onto the electrode surface, thereby improving the sensitivity of Pb2+ ion detection. Using the square wave anodic stripping voltammetry method, the sensor based on rGO/FeMg-BDC electrode exhibited two linear ranges: 0.01 to 0.5 μg L−1 and 0.5 to 50.0 μg L−1, with a low limit of detection (LOD) of 9 ng L−1. Furthermore, the external rGO thin film protects the FeMg-BDC material on the electrode surface, ensuring high durability and repeatability of the sensor. The developed sensor was successfully applied to accurately determine lead ion concentrations in various real water samples.
1. Introduction
Nowadays, with the growth of metallurgy and chemical industries, significant quantities of heavy metal ions (HMIs) are released into aquatic ecosystems. The pollution caused by HMIs raises critical concerns due to their effect on environmental safety and human health.1,2 Lead is known to be an extremely toxic heavy metal, lead exposure poses a significant threat to human health across all ages, causing developmental problems in children, cardiovascular issues in adults, and a range of other health complications.1,3,4 Human exposure to lead ions primarily arises from the ingestion of food or water that has been contaminated with lead. The World Health Organization (WHO) has established a maximum permissible limit of 10 μg L−1 for Pb2+ in drinking water.5 Detection and determination of Pb2+ ions are an important research topic. The determination of metal ions is commonly performed using a variety of popular techniques such as flame atomic absorption spectroscopy (FAAS), inductively coupled plasma atomic emission spectroscopy (ICP-AES), inductively coupled plasma mass spectrometry (ICP-MS), and atomic fluorescence spectroscopy (AFS).6–9 However, although these methods provide high sensitivity and selectivity, they require high user expertise, expensive equipment, and complex analytical procedures.10 Recently, electrochemical sensors have become contemporary recognition methods for chemical analysis due to their benefits of portability, and reasonable cost.11,12 Lead or most heavy metals possess their distinctive electrochemical reduction–oxidation activity, rendering them effortless and expedient to be directly recognized by taking advantage of their redox characteristics. Square wave anodic stripping voltammetry (SWASV) stands out as an electrochemical analysis technique offering exceptional sensitivity and low limits of detection (LOD). However, the performance of SWASV critically depends on the characteristics of the working electrode.13–15 Hence, the selection of suitable materials to fabricate or modify working electrode plays an important role in improving the performance of electrochemical sensors. Metal–organic frameworks (MOFs) are porous, crystalline materials formed by linking metal ions with organic ligands.16 MOFs are ideal materials for designing high-performance electrochemical sensors due to their high surface area, tunable porosity, potential for redox activity, and ability to incorporate functional groups.17–20 However, a common limitation of monometallic metal–organic frameworks is relatively low electrical conductivity.21–23 This drawback reduces charge transfer on the electrode surface.19,20,24 To solve this issue, bimetallic MOFs were utilized to prepare the working electrode. By incorporating two different metal ions in their inorganic nodes, bimetallic MOFs synergistically enhance conductivity, facilitating efficient charge transfer within the framework.25 For instance, Wang's group demonstrated that carbon cloth modified with a Ni/Co bimetal MOF displayed remarkable electron transport properties and catalytic performance for glucose sensing.21 In addition to enhancing electron conductivity, prior studies have demonstrated that FeMg-BDC MOFs exhibit remarkable heavy metal ion adsorption capabilities.26,27 Consequently, the bimetallic FeMg-BDC is also expected to promote the adsorption of lead ions onto the electrode surface during the accumulation process. As a result, electrochemical sensors incorporating FeMg-BDC material hold great potential for achieving exceptional sensitivity in Pb2+ analysis.Building on this, our study presents the initial application of the bimetallic MOF FeMg-BDC as an electrode material for a trace-level Pb2+ electrochemical sensor. Despite its promising sensitivity, the weak adhesion between the FeMg-BDC layer and the electrode surface was found to diminish the durability of the sensor. To address this limitation, a reduced graphene oxide (rGO) coating was introduced to improve the stability and performance of the electrode. Although previous studies have explored MOF-graphene hybrids for electrochemical sensing, the specific role of rGO in enhancing electrode durability and charge transfer has not been well elucidated.20,28 This work demonstrates that the rGO/FeMg-BDC/GCE electrode achieves superior sensitivity for Pb2+ detection and significantly improves durability compared to the unmodified FeMg-BDC/GCE. Additionally, the rGO/FeMg-BDC/GCE sensor accurately detected Pb2+ concentrations in various real water samples, underscoring its potential for practical applications in continuous monitoring.
2. Experimental
2.1. Materials
Graphite powder (size less than 20 μm), standard solution of Pb2+ (1000 mg L−1), terephthalic acid (H2BDC) (98%), FeCl3·6H2O (99%), Mg(NO3)2·6H2O (98%), K3[Fe(CN)6] (99%), K4[Fe(CN)6]·3H2O (98%), KOH (90%), KH2PO4 (99.5%), K2HPO4 (98%), H3PO4 (85%), CH3COOH (99%), CH3COONa (99%), KCl (99.5%), NaNO3 (99%), KMnO4 (98%), H2SO4 (98%), dimethylformamide (DMF) were obtained from Sigma Aldrich. Deionized (DI) water and ethanol (C2H5OH) were used for solution preparation, cleaning, and other purposes.2.2. Apparatus
The morphology of materials and electrodes was characterized by field emission scanning electron microscopy (FESEM, JSM-IT800/JEOL, Japan) and high-resolution transmission electron microscopy (TEM, JEM 1400, JEOL, Japan). X-ray photoelectron spectroscopy (XPS, Thermo VG, Multilab 2000, England) was carried out to study the chemical states and the elemental composition of the samples. The crystal structures were confirmed by X-ray diffractometer (XRD, Bruker D8 Advance). Specific surface areas of MOF materials were investigated by Brunauer–Emmett–Teller (BET) method (Tristar-3030 system, USA Micromeritics). The presence of functional groups in the material was determined by Fourier-transform infrared (FT-IR) spectroscopy (Jacos 4700 spectrometer, USA) and Raman spectroscopy (LabRAM HR Evolution, Horiba, France). The zeta potential of bimetallic MOF and graphene oxide dispersed in water was determined using dynamic light scattering with a Litesizer 500 instrument (Anton Paar, Austria).Electrochemical measurements utilized an AUTOLAB PGS302N device (Metrohm, Netherland) with a three-electrode system: a reference electrode (Ag/AgCl/KCl), a counter electrode (platinum wire), and a developed working electrode. Techniques included electrochemical impedance spectroscopy (EIS), cyclic voltammetry (CV), and square wave anodic stripping voltammetry (SWASV) were used for the examination of the electrochemical properties of the electrodes and Pb2+ analysis procedures.
2.3. Synthesis of GO
GO was synthesized by the modified Hummers' method by oxidizing graphite with HNO3, H2SO4, and KMnO4.29 The synthesis process was carried out as follows: 1 g of graphite was dispersed in 50 mL of a concentrated H2SO4/HNO3 solution (the ratio of the two acids was 3![[thin space (1/6-em)]](https://www.rsc.org/images/entities/char_2009.gif) :1). The mixture was maintained at 0 °C, and 1 g of KMnO4 was gradually added, followed by stirring for 20 hours. After the reaction, the solid was filtered and washed with distilled water multiple times to eliminate residual acid thoroughly. After synthesis, the GO was obtained in gel form at a concentration of 1 mg mL−1.
:1). The mixture was maintained at 0 °C, and 1 g of KMnO4 was gradually added, followed by stirring for 20 hours. After the reaction, the solid was filtered and washed with distilled water multiple times to eliminate residual acid thoroughly. After synthesis, the GO was obtained in gel form at a concentration of 1 mg mL−1.
2.4. Synthesis of MOFs
Bimetallic FeMg-BDC frameworks were prepared according to the previous literature27 with some modifications, specifically as follows: A series of FeMg-BDC materials were synthesized with varying Fe/Mg ratios. Briefly, 1 mmol of a mixture of metal salts (FeCl3·6H2O and Mg(NO3)2·6H2O) with desired molar ratios of Fe3+/Mg2+ (1/1, 1/2, 1/4) was mixed with 1 mmol of H2BDC in 10 mL of DMF. The mixture was continuously stirred until a homogeneous solution was formed. Then, 2 mL of 0.2 M NaOH solution was added to the mixture, and stirring continued for 15 min. The mixture was then transferred to an oven at 100 °C for 12 hours. The resulting mixture was then cooled to room temperature. After that, the synthesized MOFs were washed by centrifugation several times with DMF and ethanol to remove unreacted substances before drying at 80 °C for 24 h under vacuum. The obtained powder was denoted as FeMg-BDC (1/1), FeMg-BDC (1/2), and FeMg-BDC (1/4), corresponding to the Fe/Mg ratio. For comparison, monometallic Fe-BDC and Mg-BDC were also prepared using the same procedure.2.5. Modification of the glassy carbon electrode
The GCE surface was first polished with sandpaper, then, it was cleaned with ethanol and dried. The 1 mg mL−1 MOF solution was prepared by dispersing the MOF uniformly in DI water via ultrasonication for 15 minutes. After that, 4 μL of MOF solution was drop-coated onto the surface of the GCE, followed by drying with infrared lights for 15 minutes. The resulting MOF electrodes were labeled as Fe-BDC, Mg-BDC, and FeMg-BDC electrodes.Then, GO was drop-coated onto the FeMg-BDC electrode surface to form the GO/FeMg-BDC electrode. The GO/FeMg-BDC electrodes were electrochemically reduced by cyclic voltammetry within the potential range from 0 to −1 V in a 0.1 M PBS solution at pH 7 for a total of 10 cycles to obtain rGO/FeMg-BDC electrode.30
2.6. Pb2+ analysis
Pb2+ was analyzed by SWASV in KCl–HCl solution. The modified electrode was immersed in a Pb2+ solution at a deposition potential of −0.8 V before being scanned from −0.8 V to 0 V to record the oxidation signals of Pb. Electrode materials, deposition potential, pH of the electrolyte solution, and deposition potential, accumulation time were investigated to optimize before developing the linear ranges curve.3. Result and discussion
3.1. Characterization of synthesized MOFs
FESEM images show that the Fe-BDC crystal had a rice-shaped morphology with a typical length ranging from 800 to 1000 nm and an average diameter of approximately 100 nm (Fig. 1a). Meanwhile, the obtained Mg-MOFs exhibit undefined morphology and irregular dimensions (Fig. 1e). The bimetallic FeMg-BDC frameworks maintain a similar morphology with Fe-BDC (Fig. 1b–d). However, the incorporation of Mg into the FeMg-BDC framework results in a slight change in crystal size. Specifically, as the Mg content in the MOF increases, the length of the bimetallic FeMg-BDC (n) crystals gradually decreases. Besides, the FESEM of FeMg-BDC (1/4) reveals the presence of rice-shaped crystals of the bimetal MOF alongside crystals resembling the Mg-BDC morphology. The resulting product emerges as a composite, comprising both the bimetal MOF and the monometallic Mg-BDC. | ||
| Fig. 1 SEM images of MOFs: (a) Fe-BDC, (b) FeMg-BDC (1/1), (c) FeMg-BDC (1/2), (d) FeMg-BDC (1/4), (e) Mg-BDC, (f) N2 adsorption–desorption isotherms and (g) XRD patterns of MOF samples. | ||
The presence of metals in bimetallic-MOF crystals was investigated by EDS spectroscopy. The EDS spectrum in Fig. S1a† confirms the presence of both Fe and Mg in the bimetallic MOF. Moreover, the FESEM elemental mapping images in Fig. S1b† reveal a uniform distribution of Fe, and Mg confirming the coexistence of both Fe and Mg metal within the bimetal FeMg-BDC crystal.
The crystallization behaviors of the synthesized MOFs were determined by XRD patterns. In Fig. 1g, the sharp and prominent peaks indicate that the synthesized MOF materials are all highly crystalline. The XRD pattern of the synthesized Fe-BDC sample exhibits distinct diffraction peaks at 2θ ∼9° and 11° corresponding to the (100) and (101) planes, respectively. For the synthesized Mg-BDC, the XRD pattern shows diffraction peaks at 2θ ∼9.5°, 14.4°, 18.6°, 24° and 28.5°. Compared with the simulated pattern,31 and the previously reported results,26,27 it can be seen that Fe-BDC and Mg-BDC were successfully synthesized. The XRD patterns of the bimetallic FeMg-BDC (1/1 and 1/2) reveal that with reducing Fe/Mg ratio, the intensity of the diffraction peak at about 9° increases, while the intensity of the diffraction peak around 11° decreases. This phenomenon indicates the successful incorporation of Mg into the framework, consistent with prior reports on Fe and Mg bimetallic MOFs.26,27 Meanwhile, the XRD pattern of FeMg-BDC (1/4) exhibits strong intensity peaks of Mg-BDC and some weak intensity peaks of bimetallic FeMg-BDC. Therefore, the main crystalline phase of FeMg-BDC (1/4) is Mg-BDC and the rest is bimetallic FeMg-BDC. This result is consistent with the FESEM image in Fig. 1d.
The chemical state of elements in the FeMg-BDC was also determined via X-ray photoelectron spectroscopy (XPS). The overall survey spectra in Fig. 2a reveal the presence of Fe, Mg, C, and O. The Mg 1s peak at 1304.2 eV confirms the incorporation of Mg into the bimetallic MOF (Fig. 2b). The Fe 2p spectrum of the FeMg-BDC (Fig. 2c) is deconvoluted into two characteristic peaks of the Fe 2p3/2 peak at 711.4 and the Fe 2p1/2 peak at 725.08 eV. Additionally, the Fe 2p spectrum also indicates the presence of Fe2+ (711.15, 724.77 eV) and Fe3+ (712.85, 727.43 eV) with satellite peaks (717.85, 731.26 eV), suggesting the presence of Fe in both oxidation states within the structure of the FeMg-BDC molecule. The O 1s spectra have two distinct peaks at 531.48 and 532.14 eV, which correspond to the carboxyl groups of the BDC linker and the Fe/Mg–O bonds of FeMg-BDC, respectively (Fig. 2d).27
 | ||
| Fig. 2 XPS spectra of the bimetallic Fe–Mg-BDC: (a) overall survey spectrum, (b) Mg 1s, (c) Fe 2p, (d) O 1s. | ||
In addition, the specific surface areas and porosity of the synthesized MOF are also investigated through nitrogen adsorption/desorption analyses. As shown in Fig. 1f and Table 1, the BET surface areas of the as-synthesized Fe-BDC and Mg-BDC are 47.53 and 17.26 m2 g−1, respectively. Notably, the combination of Fe and Mg in the MOF structure significantly increased the BET surface area of the bimetallic MOF, reaching a maximum value of 182.24 m2 g−1 at the Fe/Mg ratio of 1/2. The pore volume and pore size of this MOF are also the largest, measuring 1.36 cm3 g−1 and 16.44 nm, respectively. This increase is attributed to the synergistic effect between Fe and Mg, as well as the high dispersion of Fe crystals within the porous structure of Mg-MOF. The lower BET surface area observed at the Fe/Mg ratio of 1/1 (129.02 m2 g−1) is likely due to the aggregation of Fe species in the structure.26 Conversely, when the Mg content increases significantly with the Fe/Mg ratio of 1/4, the Mg-BDC phase predominates, as clearly observed in the SEM and XRD images, resulting in a lower BET surface area of Fe–Mg-BDC (1/4) of only 22.37 m2 g−1. This trend is consistent with previous studies by W. S. Abo El-Yazeed and Y. Gu.26,27
| Material | BET surface area m2 g−1 | Pore volume cm3 g−1 | Pore size nm |
|---|---|---|---|
| Fe-BDC | 47.53 | 0.09 | 3.39 |
| Fe–Mg-BDC (1/1) | 129.02 | 0.55 | 5.45 |
| Fe–Mg-BDC (1/2) | 182.24 | 1.36 | 16.44 |
| Fe–Mg-BDC (1/4) | 22.37 | 0.08 | 4.31 |
| Mg-BDC | 17.26 | 0.02 | 2.39 |
The zeta potential of the synthesized bimetallic MOF was investigated, as depicted in Fig. S1c.† The measured zeta potential for the bimetallic MOF sample is approximately −10.8 mV indicates that the surface of the MOF carries a negative charge. This charge originates from carboxylate functional groups (–COO−) on the MOF surface, which dissociate in the aqueous environment, leaving behind negatively charged sites. These sites facilitate the adsorption of Pb2+ cations in the aqueous phase through electrostatic attraction.32,33
3.2. Properties of modified electrodes
The surface morphology of FeMg-BDC, GO/FeMg-BDC, and rGO/FeMg-BDC electrodes were observed by field emission scanning electron microscopy (Fig. 3). The MOF crystal is uniformly distributed on the surface of the GCE electrodes. Fig. 3c and d reveals the presence of a graphene oxide (GO) layer on the surface of the MOF material. After the electrochemical reduction process, the rGO/FeMg-BDC electrode surface is still similar to the GO/FeMg-BDC electrode and the morphology of FeMg-BDC MOF crystals remains unchanged (Fig. 3e and f), indicating that the electrochemical reduction did not affect the bimetallic MOF material layer. The incorporation of the GO or rGO layer is expected to enhance the durability of the electrode. | ||
| Fig. 3 The surface morphologies of FeMg-BDC (a and b), GO/FeMg-BDC (c and d), and rGO/FeMg-BDC (e and f) electrodes. | ||
Electrochemical characterization of the prepared electrodes was analyzed by electrochemical impedance spectra (EIS) and cyclic voltammograms (CV).
EIS results are shown in Fig. 4a and b and the equivalent circuit is displayed in the inset. Based on EIS analysis, the GCE has a total electrode impedance (Rct) value of 180 Ω. After modification with monometallic MOF, the Rct values of the Fe-BDC and Mg-BDC electrodes increase to 229 Ω and 398 Ω, respectively. This result shows that the monometallic MOF reduces the charge transfer ability on the electrode surface due to its low conductivity. In contrast, the FeMg-BDC electrode has a significantly lower Rct than the GCE (∼70 Ω), which shows that bimetallic MOF material can accelerate the charge transfer on the modified electrode surface. The Rct value of the GO/FeMg-BDC electrode is 413 Ω, which is higher than that of the FeMg-BDC electrode. This can be explained by the poor conductivity of GO, which disrupts electron transfer and leads to reduced conductivity. Meanwhile, due to the high electrical conductivity of rGO, the Rct value of the rGO/FeMg-BDC electrode is the lowest, at just 55.7 Ω.
 | ||
| Fig. 4 (a and b) Nyquist plots and (c) CV redox current response at a scan rate of 0.05 V s−1 of the prepared electrodes in 0.1 M KCl solution containing 5 mM of [Fe(CN)6]3−/4−, (d) Raman spectrum of GO/FeMg-BDC and rGO/FeMg-BDC. | ||
CV results are indicated in Fig. 4c, the Fe-BDC and Mg-BDC electrodes show lower redox peak current values (Ip), and peak-to-peak separation (ΔEp) is wider than GCE. This phenomenon is explained by the low electrical conductivity of monometallic MOFs. Meanwhile, the FeMg-BDC electrode has a lower ΔEp value and a higher Ip value compared to GCE. This result once again confirms the excellent electrical conductivity and electrocatalytic ability of bimetallic MOFs compared to monometallic MOFs. In the case of the GO/FeMg-BDC electrode, due to defects in the GO structure, the GO/FeMg-BDC electrode displays the lowest Ip values. By contrast, the rGO/FeMg-BDC electrode has the highest Ip and lowest ΔEp values among all fabricated electrodes. This result is consistent with the EIS and further demonstrates that FeMg-BDC and rGO have created a synergistic effect that enhances the electron transfer rate on the electrode surface.
In addition, the Fe-BDC, FeMg-BDC, GO/FeMg-BDC, and rGO/FeMg-BDC electrodes underwent CV measurements in the PBS solution at pH 7 (0.1 M) without K3[Fe(CN)6]. The results reveal no redox signal associated with iron, confirming that the iron content within the MOF does not influence the observed electrochemical signal (Fig. S3a†).
CV measurements were conducted at various scan rates to gain a better understanding of the electrochemical activity of the rGO/FeMg-BDC electrode (Fig. S3b†). The linear increase of peak current with the square root of the scan rate demonstrates the good electrochemical performance of the electrode (Fig. S3c†). Based on this result, the electrochemically active surface area is determined using Randles–Sevcik eqn (1).
| Ip = 2.69 × 10⁵n3/2AD1/2Cv1/2 | (1) |
Raman spectroscopy was employed to characterize the GO/FeMg-BDC and rGO/FeMg-BDC layers on the electrodes, elucidating the observed behavior and the effect of the electrochemical reduction process (Fig. 4d). The G band, a prominent feature observed in all sp2 carbon systems, arises from C–C bond stretching vibrations. Conversely, the D band reflects the presence of structural defects and disorder within the graphene lattice. The present study observes the G band positions at 1606 cm−1 and 1594 cm−1 for GO/FeMg-BDC and rGO/FeMg-BDC, respectively. Additionally, the D band appears at 1348 cm−1 and 1336 cm−1, respectively. Notably, the G band in rGO exhibits a slight down-shift compared to GO, potentially attributable to an increased abundance of sp2 carbon atoms after electrochemical reduction. Furthermore, the decrease in the intensity ratio of the D band and the G band (ID/IG) from 1.1 (GO/FeMg-BDC) to 0.9 (rGO/FeMg-BDC) corroborates the successful removal of a significant portion of oxygen-containing functional groups and the formation of new sp2 domains upon reduction.34
In comparison with the bare GCE as well as other modified electrodes, the rGO/FeMg-BDC electrode has the largest electrochemically active surface area and the highest charge transfer ability. Hence, rGO/FeMg-BDC is a promising candidate for the development of electrochemical sensors for lead ion detection.
3.3. Optimization of electrode preparation condition
 | ||
| Fig. 5 (a) SWASVs of different electrodes and (b) the plot of peak current at different electrodes in 0.1 M KCl–HCl solution at pH 3 containing 1 μg per L Pb2+ and accumulation time of 120 s. | ||
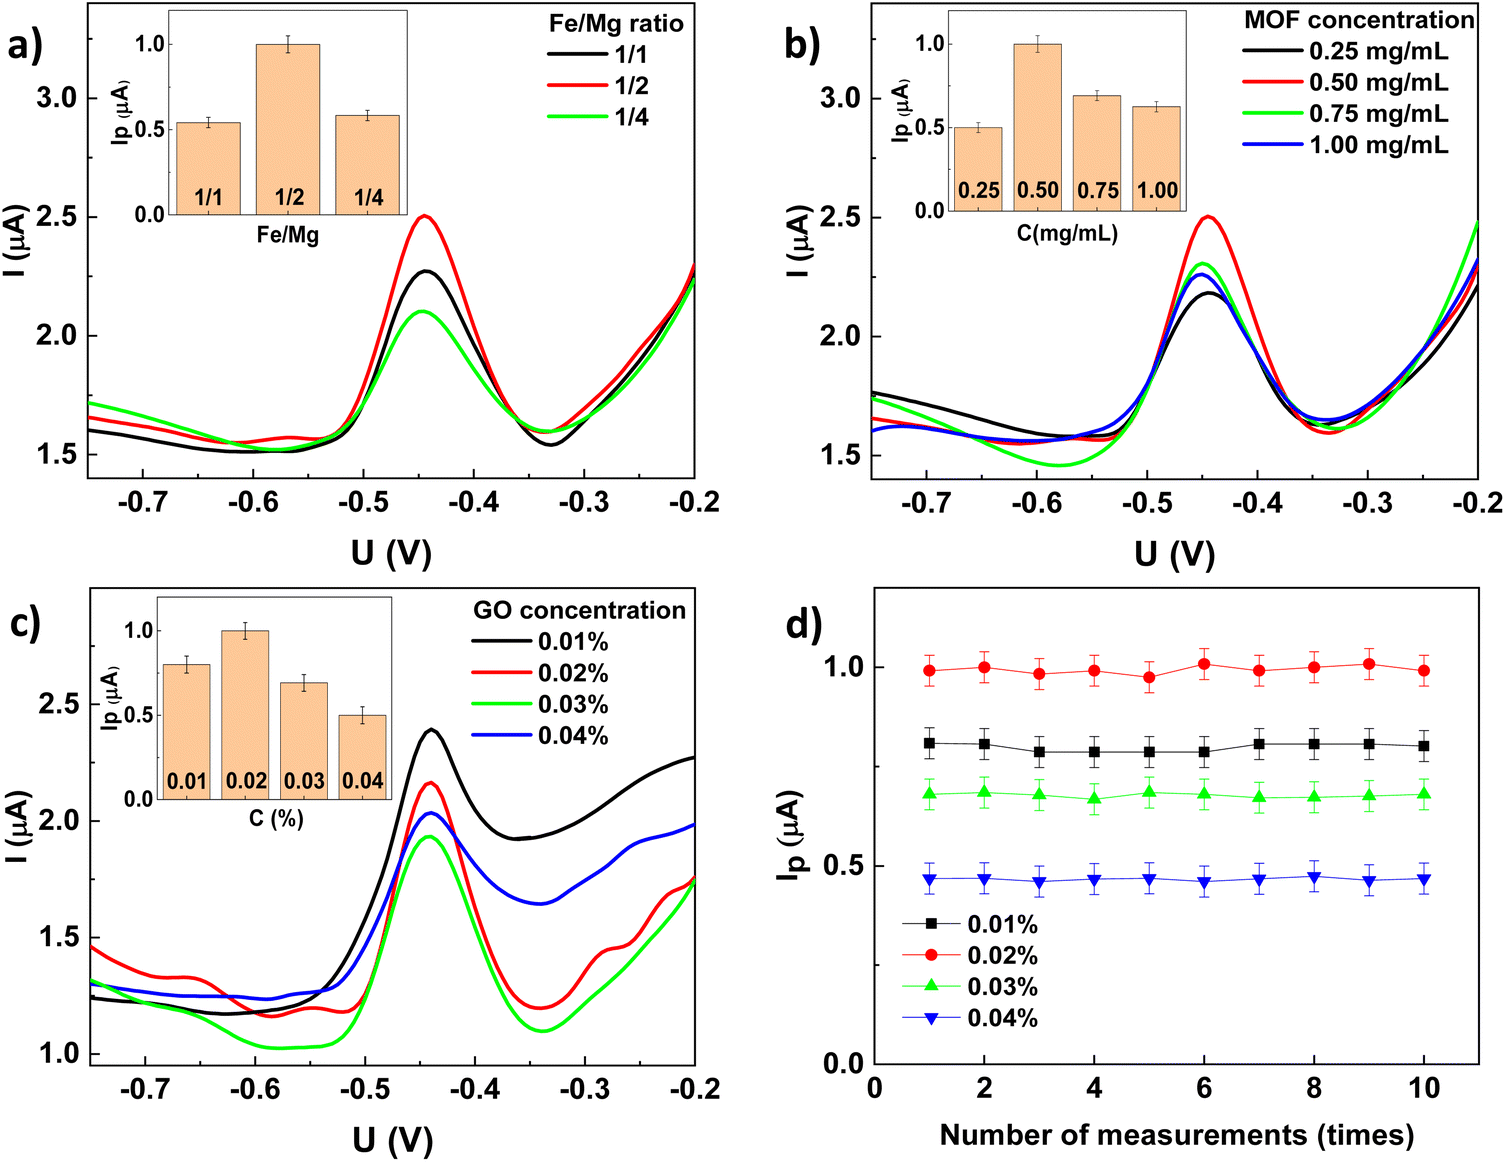
The obtained results shown in Fig. 5 and Table 2 indicate that the GCE exhibits the lowest peak current. Although Fe-BDC and Mg-BDC have low charge transfer capacity, their electrochemical signals are higher than those of GCE due to the porous structure inside the MOF which enhances the adsorption of Pb2+ during the accumulation process. Owning a fast electron transfer rate, the FeMg-BDC electrode shows significantly higher oxidation peaks than that of the Fe-BDC and Mg-BDC electrodes.
| Electrode | Rct (Ω) | EASA (cm2) | Ip (μA) |
|---|---|---|---|
| GCE | 180 | 0.07 | 0.05 |
| Fe-BDC | 229 | 0.055 | 0.11 |
| Mg-BDC | 398 | 0.059 | 0.07 |
| FeMg-BDC | 70 | 0.12 | 0.88 |
| GO/FeMg-BDC | 413 | 0.046 | 0.91 |
| rGO/FeMg-BDC | 55.7 | 0.14 | 1.08 |
The GO/FeMg-BDC electrode exhibits a high electrochemical signal although the charge transfer capability of the GO/FeMg-BDC electrode is low (Table 2). This phenomenon may be attributed to the partial reduction of GO to rGO during the accumulation step at −0.8 V. However, the competition between the reduction of GO and the deposition of Pb2+ might have hindered the complete reduction of GO. Consequently, the peak current value is lower than that of the rGO/FeMg-BDC electrode. Ultimately, the rGO/FeMg-BDC electrode exhibits the highest electrochemical signal, due to its excellent conductivity and extensive electrochemically active surface area.
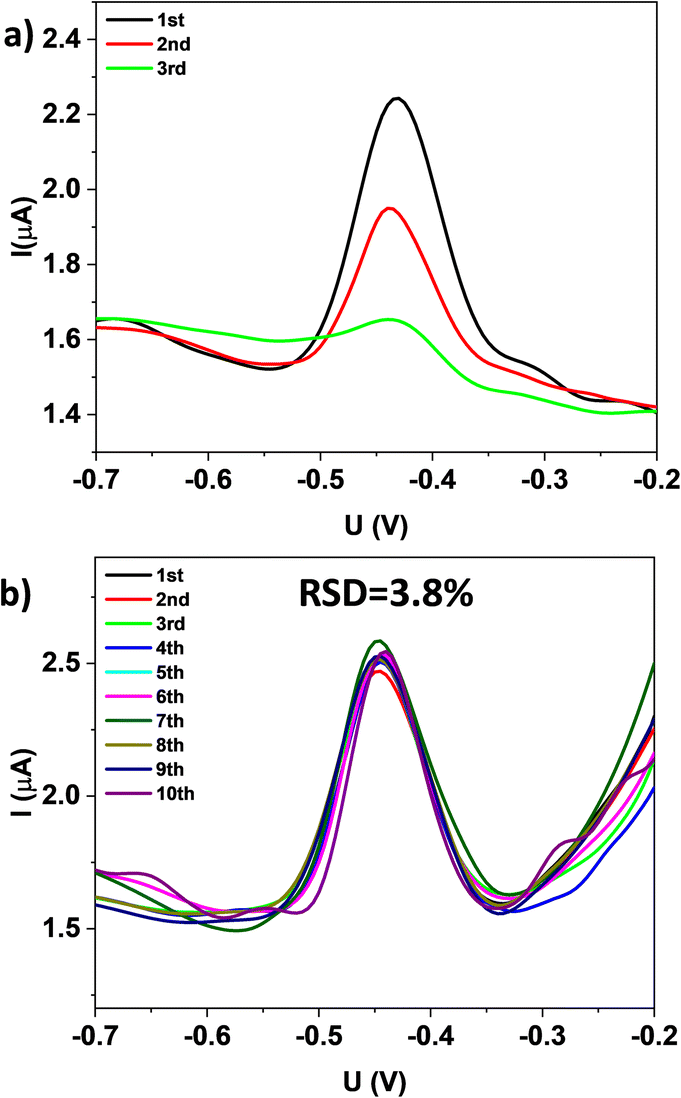
The durability of FeMg-BDC and rGO/FeMg-BDC electrodes were also investigated (Fig. 6). The electrochemical signal of the FeMg-BDC electrode shows a significant decrease after each measurement. In contrast, the electrochemical signal of the rGO/FeMg-BDC electrode remains unchanged after 10 consecutive measurements with a relative standard deviation of 3.8%.
 | ||
| Fig. 6 SWASVs of (a) FeMg-BDC electrode and (b) rGO/FeMg-BDC electrode after several Pb2+ analysis measurements. All of these experiments were performed in 0.1 M of KCl buffer solution pH = 3 containing 1 μg per L Pb2+ with accumulation potential at −0.8 V during 120 s. | ||
The electrode surface before and after Pb2+ analysis was studied using SEM images. After the first measurement, partly of the MOF material on the surface of the FeMg-BDC electrode is detached (Fig. 7). After the three measurements, there are only a few MOF crystals remained on the electrode surface. This phenomenon explains why the electrochemical signal decreased significantly. Meanwhile, for the rGO/FeMg-BDC electrode, the electrode surface remains durable after 10 measurements (Fig. 8), which is consistent with the obtained electrochemical signal. This result shows the effectiveness of the rGO layer on the electrode surface. When combined with bimetallic MOF, rGO acts as a thin protective film, shielding the underlying material layer from external influences during the analysis process. Based on the obtained results, it can be concluded that rGO/FeMg-BDC is a suitable electrode for lead ions electrochemical detection that requires high repeatability.
 | ||
| Fig. 7 SEM images of FeMg-BDC electrode surface (a and b) before and (c and d) after the first measurement, (e and f) after the third measurement. | ||
 | ||
| Fig. 8 SEM images of rGO/FeMg-BDC electrode surface (a and b) before and (c and d) after the 10 times of measurement. | ||
:1 (approximately 1/2) to be the most effective for Pb2+ adsorption. This enhancement is attributed to the synergistic effect of the two metals, which could create new active sites within the bimetallic MOF structure, beneficial for Pb2+ adsorption.26 Therefore, FeMg-BDC with a Fe/Mg ratio of 1/2 is the optimal choice for fabricating electrodes.
 | ||
| Fig. 9 SWASVs and (inset) plot of the peak current of rGO/FeMg-BDC electrode with (a) different ratios of Fe/Mg, (b) different concentrations of FeMg-BDC, (c) different concentrations of GO, (d) the plot of the peak current of rGO/FeMg-BDC electrode using different GO concentration after 10th measurement. All of these experiments were performed in 0.1 M of KCl–HCl solution pH = 3 containing 1 μg per L Pb2+ with accumulation potential at −0.8 V during 120 s. | ||
In addition, the stability of rGO/FeMg-BDC electrodes across varying GO concentrations was assessed. Fig. 9d shows that all electrodes exhibit highly stability, maintaining consistent electrochemical responses after 10 consecutive measurements. Then, GO solution with a concentration of 0.02% was selected to fabricate electrodes for further electrochemical analyses.
3.4. Optimization of analysis conditions
 | ||
| Fig. 10 SWASVs, and (inset) plot of the peak current of rGO/FeMg-BDC electrode (a) in different buffer solutions, (b) at different pH values, (c) at different accumulation potentials, (d) correlation between accumulation time and plot of the peak current of Pb2+ on rGO/FeMg-BDC electrode. | ||
However, from 120 seconds to 600 seconds, the peak height increases negligibly. The slow increase in peak height at longer adsorption times is attributed to the electrode surface nearing the equilibrium state of Pb2+ adsorption. The studied accumulation time is consistent with a previous study.42 Consequently, the tacc of 120 seconds is chosen to optimize sensitivity, reduce analysis time, and avoid saturation of the electrode surface.
3.5. Calibration curve for Pb2+ detection
The calibration curves for the Pb2+ detection with varying concentrations of Pb2+ (ranging from 0.01 to 50 μg L−1) solution was constructed by recording SWASV in 0.1 M KCl–HCl at pH = 3 with deposition potential at −0.8 V during 120 s (Fig. 11a). Accordingly, the peak signal shows a good linear relationship with the Pb2+ concentration across two linear ranges with different slopes. The calibration curves for the two concentration ranges, from 0.01 μg L−1 to 0.5 μg L−1 and from 0.5 μg L−1 to 50 μg L−1, are shown at higher magnification in Fig. 11b and d, with the regression equations being Ip (μA) = 1.7127 (μg L−1) + 0.0148 and Ip (μA) = 0.16574 (μg L−1) + 0.8334, respectively. | ||
| Fig. 11 Standard curve of peak current versus Pb2+ concentration (0.01–50 μg L−1) (a); linear plots for Pb2+ concentrations from 0.01 to 0.5 μg L−1 (b). SWASVs of the rGO/FeMg-BDC electrode at various Pb2+ concentrations in a 0.1 M KCl–HCl solution (pH = 3), with an accumulation potential of −0.8 V for 120 s (c and d). | ||
This result is attributed to the fact that, at low Pb2+ concentrations (from 0.01 μg L−1 to 0.5 μg L−1), the accumulation process occurs rapidly both within the pores and on the outer surface of the material, which possesses a large specific surface area. This facilitates efficient enrichment of Pb2+, leading to a sharp increase in the peak signal as the concentration rises. When the Pb2+ concentration exceeds 0.5 μg L−1, the active sites on both the inner pores and the outer surface of the electrode material gradually become saturated. At that point, mass transport becomes limited, particularly within the porous structure. Consequently, the linear relationship between Pb2+ concentration and the analytical signal transitions to a second range with a reduced slope, forming a secondary calibration range. Additionally, the accumulation of Pb2+ at higher concentrations may occur in the form of multilayers, which could also contribute to the reduction in the slope of the linear calibration curve. This result aligns with several previously published studies, which have reported similar behaviors.42,43 The SWASVs recorded at different concentrations on the rGO/FeMg-BDC electrode are presented in the Fig. 11c and d.
The limit of detection (LOD) represents the sensitivity of the analysis and is therefore calculated based on the most sensitive linear range of 0.01–0.5 μg per L Pb2+ using the standard deviation (σ) of the response from this calibration curve and its slope (Fig. 11b). The calculated LOD value was 0.009 μg L−1, significantly lower than the permissible limit of 10 μg L−1 set by the World Health Organization (WHO) for lead in drinking water. The sensor performance was further evaluated by comparing its LOD with previously reported Pb2+ detection sensors, as summarized in Table 3. The results indicated that the LOD value of this sensor was lower than many reported results.19,20,44–50
| Electrode | Method | Linear range (μg L−1) | LOD (μg L−1) | Ref. |
|---|---|---|---|---|
| Au@SiO2@FMg–BDCO4/NG/GCE | SWASV | 5–80 | 0.60 | 44 |
| GO–AgNW/PET | SWASV | 0.2–60 | 0.067 | 45 |
| NH2-MIL-53(Al)/Ppy/BCE | DPV | 1–400 | 0.31 | 46 |
| NH2-MIL-53(Cr)/GCE | SWASV | 0.4–80 | 6.22 | 47 |
| Zn4O(BDC)3/CPE | DPV | 2.07–207 | 1 | 48 |
| NH2-MIL-101(Fe)/CPE | DPV | 20.7–2070 | 2.48 | 49 |
| NH2-MIL-88(Fe)–rGO/GCE | DPV | 2.07–62 | 2.07 | 20 |
| GA-UiO-66-NH2/GCE | DPV | 2.07–828 | 0.3 | 19 |
| MOF-808-His/GCE | SWASV | 0.207–103 | 0.023 | 50 |
| rGO/Fe–Mg-BDC/GCE | SWASV | 0.01–50 | 0.009 | This work |
3.6. Reproducibility and durability over time of the rGO/FeMg-BDC electrode
To assess the reproducibility of the electrochemical sensor, the Pb2+ signals were measured across ten distinct rGO/FeMg-BDC electrodes under identical conditions. These results exhibit insignificant differences between electrochemical signals (Fig. S5a†), and the relative standard deviation (RSD) for the ten measurements is 3.1% (Fig. S5b†). The obtained result indicates that the fabricated sensor had good reproducibility.The durability over time of the rGO/FeMg-BDC electrode was evaluated using the SWASV method analyzing Pb2+ every 5 days for 30 days. The electrode was stored between measurements under ambient conditions. The electrode shows stable SWASV signals during the 30 days measurement (Fig. S6a and b†). This observation indicates high temporal stability for the rGO/FeMg-BDC electrode.
3.7. Selectivity of the rGO/FeMg-BDC electrode
The selectivity of the electrochemical sensor based on the rGO/FeMg-BDC electrode was examined under optimal conditions in the presence of various inorganic and organic substances. Fig. S7† illustrates the change of signal peak height by adding 100 μg L−1 of inorganic ions or organic compounds to a 1 μg L−1 solution of Pb2+ (100-fold). Except PO43−, all inorganic ions cause minimal interference to the Pb2+ signal, showing relative errors below 5%. The effect of PO43− on the electrochemical signal could be explained by the formation of complexes between PO43− and Pb2+ in solution. Furthermore, the presence of organic substances including paracetamol, uric acid, glucose, ascorbic acid, and dopamine at concentrations 100 times higher than that of Pb2+ do not significantly affect the Pb2+ electrochemical signal recorded on the rGO/FeMg-BDC electrode. Thus, the analysis method employing the fabricated sensor exhibits high selectivity in solutions containing high inorganic and organic substance concentrations.3.8. Determination of Pb2+ in real samples
Ha Long Bay seawater (Ha Long, Quang Ninh, Viet Nam, with specific coordinates 20°56′44.3′′N, 107°02′38.7′′E), West Lake water (Tay Ho, Hanoi, Viet Nam, with specific coordinates 21°04′08.1′′N, 105°48′45.1′′E), and Red River water (Tay Ho, Hanoi, Vietnam, with specific coordinates 21°05′27.0′′N, 105°48′43.4′′E) were used to evaluate the performance of the sensor in the determination of Pb2+ in real samples. Water samples were collected on-site in polyethylene bottles and nitric acid was added to stabilize the sample. To avoid sample dilution, KCl was added to the water samples as an electrolyte ([KCl] = 0.1 M). After that, the samples were used as a normal KCl buffer solution.The applicability of the fabricated electrode for Pb2+ detection in real samples was assessed using the standard addition method. The relative standard deviation (RSD) was determined by measuring each sample three times. Pb2+ concentrations have values of 3.29 μg L−1, 0.20 μg L−1, and 2.65 μg L−1 for Ha Long seawater, Red River water, and West Lake water samples, respectively (Table 4 and Fig. S8†). These results are similar to those obtained via inductively coupled plasma mass spectrometry (ICP-MS), demonstrating good accuracy of the rGO/Fe–Mg-BDC/GCE sensor for Pb2+ detection in real samples.
| Sample | Determined by electrochemical sensor | Determined by ICP-MS (μg L−1) | |
|---|---|---|---|
| Conc. (μg L−1) | RSD (%) | ||
| Ha long seawater | 3.29 | 3.4 | 3.34 |
| Red river water | 0.2 | 4.6 | 0.21 |
| West lake water | 2.65 | 3.5 | 2.69 |
4. Conclusion
In this study, an innovative electrochemical sensor was developed by modifying a glassy carbon electrode with a unique combination of FeMg-BDC and reduced graphene oxide (rGO) for the sensitive and selective detection of Pb2+ ions. The bimetallic architecture of FeMg-BDC enhances charge transfer efficiency and specific surface area, while the integration of rGO further improves the sensor's electrochemical properties and significantly boosts its durability. This synergy results in exceptional analytical performance, including a low detection limit, wide linear dynamic range, good selectivity, high reproducibility, and long-term stability. The practical utility of the sensor was validated by accurately quantifying lead ion concentrations in sea, river, and lake water samples, highlighting the potential of the rGO/FeMg-BDC/GCE electrode for reliable lead ion detection in analytical applications.Data availability
The data supporting this article have been included as part of the ESI.†Author contributions
Conceptualization, Mai Ha Hoang, Thi Hai Yen Pham; data analysis, Tien Dat Doan, Thu Thao Le, Nhung Hac Thi; methodology, Tien Dat Doan, Dinh Dung Luong, Ho Thi Oanh; project administration, Mai Ha Hoang, Thi Kim Dung Hoang; validation, Ha Tran Nguyen; writing – original draft, Tien Dat Doan, Thi Hai Yen Pham; writing – review & editing, Mai Ha Hoang and Thi Hai Yen Pham. All authors have read and agreed to the published version of the manuscript.Conflicts of interest
There are no conflicts of interest to declare.Acknowledgements
This research is funded by Vietnam Academy of Science and Technology under grant number “TĐPTCB.04/24-26”.References
- A. Alengebawy, S. T. Abdelkhalek, S. R. Qureshi and M. Q. Wang, Toxics, 2021, 9, 40–48 CrossRef PubMed
.
- A. Waheed, M. Mansha and N. Ullah, TrAC, Trends Anal. Chem., 2018, 105, 37–51 CrossRef CAS
- P. J. Mafa, A. O. Idris, N. Mabuba and O. A. Arotiba, Talanta, 2016, 153, 99–106 CrossRef CAS PubMed
- D. Anh Nguyen, D. Viet Nguyen, G. Jeong, N. Asghar and A. Jang, J. Chem. Eng., 2023, 461, 141789 CrossRef CAS
- H. Xing, J. Xu, X. Zhu, X. Duan, L. Lu, Y. Zuo, Y. Zhang and W. Wang, J. Electroanal. Chem., 2016, 782, 250–255 CrossRef CAS
- H. Ebrahimzadeh and M. Behbahani, Arab. J. Chem., 2017, 10, S2499–S2508 CrossRef CAS
- S. V. Smirnova, T. O. Samarina, D. V. Ilin and I. V. Pletnev, Anal. Chem., 2018, 90, 6323–6331 CrossRef CAS PubMed
- T. T. Shih, C. C. Hsieh, Y. T. Luo, Y. A. Su, P. H. Chen, Y. C. Chuang and Y. C. Sun, Anal. Chim. Acta, 2016, 916, 24–32 CrossRef CAS PubMed
- A. C. Sotolongo, M. M. Messina, F. J. Ibanez and R. G. Wuilloud, Talanta, 2020, 210, 120614 CrossRef CAS PubMed
- T. D. Doan, Y. T. H. Pham, H. T. Nhung, H. T. Oanh, T. N. Duc, H. Q. Le, T. H. T. Vu, P. H. Pham and M. H. Hoang, Vietnam J. Chem., 2024, 70–79 Search PubMed
- P. Wu, S. Li, X. Ye, B. Ning, J. Bai, Y. Peng, L. Li, T. Han, H. Zhou, Z. Gao and P. Ding, Anal. Chim. Acta, 2020, 1134, 96–105 CrossRef CAS PubMed
- C. Canales, E. Peralta and M. Antilen, J. Electroanal. Chem., 2019, 832, 329–335 CrossRef CAS
- C. Gao and X.-J. Huang, TrAC, Trends Anal. Chem., 2013, 51, 1–12 CrossRef CAS
- D. A. Nguyen, D. V. Nguyen, G. Jeong, N. Asghar and A. Jang, J. Hazard. Mater., 2023, 460, 132126 CrossRef CAS PubMed
- N. Asghar, A. Hussain, D. A. Nguyen, S. Ali, I. Hussain, A. Junejo and A. Ali, J. Nanobiotechnol., 2024, 22, 26 CrossRef PubMed
- Q. L. Zhu and Q. Xu, Chem. Soc. Rev., 2014, 43, 5468–5512 RSC
- S. Tajik, H. Beitollahi, F. Garkani Nejad, I. Sheikhshoaie, A. S. Nugraha, H. W. Jang, Y. Yamauchi and M. Shokouhimehr, J. Mater. Chem. A, 2021, 9, 8195–8220 RSC
- N. Kajal, V. Singh, R. Gupta and S. Gautam, Environ. Res., 2022, 204, 112320 CrossRef CAS PubMed
- M. Lu, Y. Deng, Y. Luo, J. Lv, T. Li, J. Xu, S. W. Chen and J. Wang, Anal. Chem., 2019, 91, 888–895 CrossRef CAS PubMed
- S. Duan and Y. Huang, J. Electroanal. Chem., 2017, 807, 253–260 CrossRef CAS
- Z. Xu, Q. Wang, H. Zhangsun, S. Zhao, Y. Zhao and L. Wang, Food Chem., 2021, 349, 129202 CrossRef CAS PubMed
- L. S. Xie, G. Skorupskii and M. Dinca, Chem. Rev., 2020, 120, 8536–8580 CrossRef CAS PubMed
- L. Sun, M. G. Campbell and M. Dinca, Angew. Chem., Int. Ed. Engl., 2016, 55, 3566–3579 CrossRef CAS PubMed
- J. Wan, Y. Shen, L. Xu, R. Xu, J. Zhang, H. Sun, C. Zhang, C. Yin and X. Wang, J. Electroanal. Chem., 2021, 895, 115374 CrossRef CAS
- J. H. Choi, Y. J. Choi, J. W. Lee, W. H. Shin and J. K. Kang, Phys. Chem. Chem. Phys., 2009, 11, 628–631 RSC
- W. S. Abo El-Yazeed, Y. G. Abou El-Reash, L. A. Elatwy and A. I. Ahmed, RSC Adv., 2020, 10, 9693–9703 RSC
- Y. Gu, D. Xie, Y. Wang, W. Qin, H. Zhang, G. Wang, Y. Zhang and H. Zhao, J. Chem. Eng., 2019, 357, 579–588 CrossRef CAS
- D. Huo, Y. Zhang, N. Li, W. Ma, H. Liu, G. Xu, Z. Li, M. Yang and C. Hou, Anal. Bioanal. Chem., 2022, 414, 1575–1586 CrossRef CAS PubMed
- A. M. Dimiev and J. M. Tour, ACS Nano, 2014, 8, 3060–3068 CrossRef CAS PubMed
- A. Viinikanoja, Z. Wang, J. Kauppila and C. Kvarnstrom, Phys. Chem. Chem. Phys., 2012, 14, 14003–14009 RSC
- X. Yao, C. Bai, J. Chen and Y. Li, RSC Adv., 2016, 6, 26921–26928 RSC
- D. Roy, S. Neogi and S. De, J. Hazard. Mater., 2021, 403, 123624 CrossRef CAS PubMed
- F. Ahmadijokani, S. Tajahmadi, A. Bahi, H. Molavi, M. Rezakazemi, F. Ko, T. M. Aminabhavi and M. Arjmand, Chemosphere, 2021, 264, 128466 CrossRef CAS PubMed
- V. Scardaci and G. Compagnini, C, 2021, 7, 48 CAS
- R. Soltani, R. Pelalak, M. Pishnamazi, A. Marjani, A. B. Albadarin, S. M. Sarkar and S. Shirazian, Sci. Rep., 2021, 11, 1609 CrossRef CAS PubMed
- L. Yu, X. Chen, L. Sun, Q. Zhang, B. Yang, M. Huang, B. Xu and Q. Xu, React. Funct. Polym., 2024, 194, 105770 CrossRef CAS
- C. Yao, H. Wang, J. Zhou, W. Song, Q. Rao, Z. Gao, C. Liu, W. Song and Y. Liang, Arab. J. Chem., 2024, 17, 105498 CrossRef CAS
- Z. Li, X. Zhang, Y. Luo, Q. Li, Y. Qin, G. Wang, S. Yang and Z. Liu, Chem. Phys. Lett., 2023, 830, 140825 CrossRef CAS
- H. Huang, J. Wang, Y. Zheng, W. Bai, Y. Ma and X. Zhao, Food Chem., 2024, 452, 139572 CrossRef CAS PubMed
- L. D. Nguyen, T. C. D. Doan, T. M. Huynh, V. N. P. Nguyen, H. H. Dinh, D. M. T. Dang and C. M. Dang, Sens. Actuators,
B, 2021, 345, 130443 CrossRef CAS
- F. Gholami, M. Roushani, H. Hosseini and Z. M. Karazan, Microchem. J., 2024, 201, 110634 CrossRef CAS
- H. Liu, H. Sun, M. Fang, Y. Zhang, M. Kong, Z. Lv and X. Tan, Mater. Chem. Phys., 2024, 314, 128833 CrossRef CAS
- Z. Lu, W. Zhao, L. Wu, J. He, W. Dai, C. Zhou, H. Du and J. Ye, Sens. Actuators, B, 2021, 326, 128957 CrossRef CAS
- J. Nie, B. He, Y. Cheng, W. Yin, C. Hou, D. Huo, L. Qian, Y. Qin and H. Fa, Chem. Res. Chin. Univ., 2017, 33, 951–957 CrossRef CAS
- T. T. H. Nguyen, T. H. Y. Pham, T. D. Doan, N. H. Thi, H. T. Oanh, T. T. Nguyen, V. T. T. Ha, T. Van Nguyen, M. J. Cho, D. H. Choi and M. H. Hoang, Chem. Pap., 2022, 76, 5459–5469 CrossRef CAS
- N. Wang, W. Zhao, Z. Shen, S. Sun, H. Dai, H. Ma and M. Lin, Sens. Actuators, B, 2020, 304, 127286 CrossRef CAS
- H. Guo, D. Wang, J. Chen, W. Weng, M. Huang and Z. Zheng, J. Chem. Eng., 2016, 289, 479–485 CrossRef CAS
- Y. Wang, Y. Wu, J. Xie and X. Hu, Sens. Actuators, B, 2013, 177, 1161–1166 CrossRef CAS
- P. Chen, H. Wang, H. Li, B. Niu, H. Guo and Z. Chen, J. Electroanal. Chem., 2024, 957, 118–129 CrossRef
- S. L. Z. Jiokeng, T. J. Matemb Ma Ntep, M. N. A. Fetzer, T. Strothmann, C. G. Fotsop, I. Kenfack Tonle and C. Janiak, ACS Appl. Mater. Interfaces, 2024, 16, 2509–2521 CrossRef CAS PubMed
Footnote |
| † Electronic supplementary information (ESI) available. See DOI: https://doi.org/10.1039/d4ra08952a |
| This journal is © The Royal Society of Chemistry 2025 |