DOI:
10.1039/D5RA00008D
(Paper)
RSC Adv., 2025,
15, 4820-4828
In situ modification of bismuth oxyhalide photocatalysts with natural chlorophyll for enhanced photocatalytic performance†
Received
1st January 2025
, Accepted 3rd February 2025
First published on 13th February 2025
Abstract
Bismuth oxyhalides (BiOX) exhibit limited sunlight absorption and utilization, presenting a challenge for their effectiveness in photocatalytic applications. This study draws inspiration from the sensitization effects of natural chlorophyll on semiconductor photocatalysts, achieving in situ synthesis of chlorophyll-sensitized BiOX photocatalysts through a precipitation method. The photocatalytic activity of these materials was evaluated under blue light irradiation (410–420 nm LED) using Rhodamine B (RhB) as a model pollutant. Experimental results reveal that chlorophyll derived from Chlorella effectively sensitized BiOX samples, changed them specific surface area, and surface potential, thereby enhancing RhB degradation efficiency. Among the as-prepared BiOX materials, BiOBr demonstrated the most pronounced improvement, achieving a 97.8% degradation rate for 20 mg per L RhB within 90 min after sensitization. Mechanistic investigations through free radical trapping experiments identified superoxide radicals (˙O2−), photogenerated electrons (e−) and holes (h+) as the key reactive species driving RhB degradation. This study underscores the critical role of chlorophyll sensitization in improving the photocatalytic efficiency of BiOX and provides a comparative analysis of the photocatalytic performance of BiOCl, BiOBr, and BiOI. The findings offer valuable perspectives for the advancement and practical implementation of sensitized photocatalysts in environmental remediation.
Introduction
Semiconductor photocatalysis has emerged as a highly promising technology in environmental and energy research, offering a clean, economical, and energy-efficient advanced oxidation process.1 However, the limitations in inappropriate band gap and low solar energy utilization remain significant bottlenecks, hindering the widespread practical application of these photocatalysts.2 Bismuth oxyhalides (BiOX, X = Cl, Br, I), a novel layered structure material, has garnered considerable attention in the fields of photocatalysis. The presence of different halogen atoms in BiOX results in varying band gaps, i.e., BiOI (∼1.7 eV), BiOBr (∼2.6 eV), and BiOCl (3.2–3.5 eV).3–5 Similar to commonly used photocatalysts such as TiO2, ZnO, or WO3, BiOX has drawbacks. For instance, the narrow band gap of BiOI results in rapid electron/hole recombination, while the wide band gap of BiOCl restricts its activity under visible light.6 Strategies such as doping,7 surface modification,8 heterojunction formation,9 and composite structuring1 have been employed to address these issues.
In recent years, biomass extracts have gained attention as eco-friendly agents in the synthesis of nanoparticles, including TiO2,10 ZnO,11 Ag,12 Au,13 Pt,14 and CuO.15 This approach reduces environmental impact by minimizing waste and avoiding hazardous chemicals. Biomass extracts, enriched with functional groups like aldehydes, phenolic hydroxyls, and carboxyls, facilitate surface modification and enhance interactions between biomolecules and nanoparticles.16 Active biomolecules in these extracts act as bio-reductants, providing precise control over the shape and size of nanoparticles.17 Additionally, biomass extracts exhibit excellent photosensitization properties, broadening the photoresponse range of photocatalysts.18,19 However, when bioextracts are utilized in situ, their influence on the morphology and surface characteristics of the photocatalyst is often overlooked.
Chlorophylls derived from Chlorella have demonstrated potential as natural sensitizers to enhance photocatalytic degradation efficiency. Chlorella contains a wide range of bioactive components, including proteins, amino acids, polysaccharides, fatty acids, vitamins, minerals, and pigments.18 Lipophilic pigments such as chlorophyll and carotenoids comprise 3–5% of the dry weight of Chlorella, with chlorophyll alone accounting for 0.5–1.5%, a concentration significantly higher than that in most vegetables.20 Chlorophyll's excellent solar absorption properties, spanning visible to near-infrared wavelengths, make it a highly effective photosensitizer.21 Its application as a photosensitizer requires effective chemical bonding to semiconductor surfaces, broad light absorption, rapid electron transfer to the semiconductor, and minimized electron/hole recombination.22 Previous studies have explored the sensitizing role of Chlorella chlorophyll in photocatalytic applications. For instance, our group investigated Rhodamine B (RhB) degradation using BiOCl loaded onto 3D-printed models with Chlorella, indicating a possible photosensitizing effect of chlorophyll. However, the specific mechanisms and the sensitizing roles of chlorophyll on other BiOX variants have not been systematically examined.
This study addresses these gaps by extracting chlorophyll from Chlorella via ethanol soaking and evaluating its ability to sensitize BiOX (BiOCl, BiOBr, BiOI) for RhB degradation under visible LED light (410–420 nm). In this paper, chlorophyll is adsorbed onto the BiOX surface, modifying BiOX to form a Ch-BiOX composite material with enhanced sensitization properties. The results reveal that chlorophyll sensitization significantly enhances the photocatalytic efficiency of BiOX, with BiOBr showing the highest performance. Differences in photocatalytic activity among BiOX variants are analyzed, and the effects of various parameters on the degradation process are discussed in detail. This work provides novel insights into the role of Chlorella-derived chlorophyll in improving the photocatalytic efficiency of BiOX materials.
Materials and methods
Chemical reagents and materials
Chlorella powder used in this experiment was obtained from Fuqing Xindaze Spirulina Co Ltd. Deionized water was obtained using a Milli-Q system (Millipore). Bismuth nitrate pentahydrate (Bi(NO3)3·5H2O), potassium chloride (KCl), potassium bromide (KBr), potassium iodide (KI), anhydrous ethanol, benzoquinone (BQ), potassium dichromate (K2Cr2O7), ammonium oxalate (AO), isopropyl alcohol (IPA), and Rhodamine B (RhB) were used directly without further purification.
Extraction of chlorophyll from Chlorella
0.2166 g of Chlorella powder was put into a beaker containing 50 mL of anhydrous ethanol and wrapped in tinfoil. The mixture was then stirred magnetically at 50 °C for 48 h, followed by centrifugation at 10![[thin space (1/6-em)]](https://www.rsc.org/images/entities/char_2009.gif) 000 rpm for 3 min to obtain the chlorophyll extract of Chlorella (hereafter referred to as chlorophyll extract).
000 rpm for 3 min to obtain the chlorophyll extract of Chlorella (hereafter referred to as chlorophyll extract).
Preparation of BiOX catalysts
0.97 g of Bi(NO3)3·5H2O was completely dissolved in a conical flask containing 20 mL of chlorophyll extract (designated as liquid A). Subsequently, 10 mL of KCl solution (liquid B, 15 g L−1) was added dropwise to the mixture under continuous magnetic stirring at room temperature to ensure thorough mixing. The resulting solution was then placed in a constant-temperature shaker and oscillated for 1 h (at 25 °C, 200 rpm). The precipitate was collected by centrifugation, washed multiple times with deionized water to remove impurities, and dried in a vacuum oven at 110 °C for 8 h to obtain the BiOCl catalyst containing chlorophyll extract (abbreviated as Ch-BiOCl).23,24
The preparation of BiOBr and BiOI catalysts containing chlorophyll extract followed a similar procedure, with variations in liquid B. For BiOBr preparation, KCl in liquid B was replaced with 0.238 g of KBr, which was fully dissolved after 5 min of sonication. The subsequent steps were identical to those for Ch-BiOCl, yielding the Ch-BOB catalyst. For BiOI preparation, 1.16 g of Bi(NO3)3·5H2O was used in liquid A, and KCl in liquid B was replaced with 0.4 g of KI, fully dissolved after 5 min of sonication. The subsequent steps were consistent with those for Ch-BiOCl, yielding the Ch-BiOI catalyst.
BiOX catalysts without chlorophyll extract (referred to as EA-BiOX) were prepared similarly, with ethanol replacing the solvent in liquid A.
Characterization
The morphologically and elemental analysis of the samples was conducted using a field emission scanning electron microscope (SEM, SU-1510) coupled with an energy-dispersive spectrometer (EDS). Nanostructures were examined through high-resolution transmission electron microscopy (TEM, Tecnai Talos F200 s, FEI). The crystallization properties were assessed using an X-ray diffractometer (XRD, D8 Advance, Bruker, Germany). The chemical composition and elemental states were analyzed by X-ray photoelectron spectroscopy (XPS, Escalab 250xi, Thermo Fisher). The optical characterization has been performed by UV-visible spectrophotometry (UV-3600, Shimadzu, Japan). The chemical structure was characterized using Fourier transform infrared spectroscopy (FT-IR, Nicolet 5700). Specific surface area and pore size distribution were determined with an adsorption autoanalyzer (ASAP 2460, Micromeritics). Zeta potential and particle size measurements were performed using zeta potential analyzer (Malvern Zetasizer Nano ZS90).
Photocatalytic degradation of RhB
To evaluate the photocatalytic properties of the prepared samples, a series of experiments for the degradation of RhB were conducted. Typically, 10 mg of the catalyst was dispersed in 50 mL of RhB solution (20 mg L−1). To achieve adsorption–desorption equilibrium, the mixture was stirred in the dark for 30 min prior to initiating photocatalytic degradation. Photocatalysis was performed using a 50 W LED blue light lamp (410–420 nm) as the light source, with continuous vigorous mechanical stirring throughout the process. 3 mL of solution was taken every 30 min for UV-visible spectroscopic analysis, with the absorbance at 554 nm used to determine the RhB concentration in the solution.
The proposed first order kinetic constant k can be calculated as:
where
C0 and
Ct denote the concentration of RhB in the initial state and at a specific time, respectively.
In addition, the specific photocatalytic mechanism was investigated by introducing scavengers into the reaction system to identify the primary active species. AO, K2Cr2O7, BQ, and IPA were employed to scavenge h+, e−, ˙O2−, and ·OH, respectively. The experimental conditions remained consistent with those described above, except for the addition of scavengers.
Results and discussion
Photocatalytic investigation
To evaluate the photocatalytic performance of EA-BiOX and Ch-BiOX, RhB was selected as a typical organic pollutant for degradation experiments. Initially, the complete adsorption in the dark and photocatalytic degradation of RhB were conducted. Fig. 1a shows that the samples exhibited varying physical adsorption capacities during the dark reaction, which were depended on the surface area of the active site of the materials. The photocatalytic efficiencies of the Ch-BiOX materials were consistently higher than those of the EA-BiOX materials, as depicted in Fig. 1b. This suggests that chlorophyll from Chlorella enhances the photocatalytic activity of BiOX. Notably, Ch-BiOBr demonstrated the highest k-value of 5.17 × 10⁻³ (Fig. 1c), and Ch-BiOBr exhibited the best photocatalytic performance. Among the as-prepared BiOX materials, Ch-BiOBr demonstrated the most pronounced improvement, achieving a 97.8% degradation rate for 20 mg per L RhB within 90 min. Therefore, follow-up work will focus on further investigating the photocatalytic properties of Ch-BiOBr.
 |
| | Fig. 1 Photocatalytic degradation of RhB with as-prepared samples under blue light photo-irradiation. (a) Dark adsorption process of RhB with EA-BiOX and Ch-BiOX, (b) C/C0 and (c) k-value plots (inset: error bars indicate standard deviation for three measurements) of RhB degradation with EA-BiOX and Ch-BiOX. | |
Morphology of EA-BiOBr and Ch-BiOBr
The morphology of EA-BiOBr and Ch-BiOBr was analyzed by SEM to verify the possible changes in its microstructure (Fig. 2). As can be observed from Fig. 2(a and b), EA-BiOBr exhibits a sheet-like structure and Ch-BiOBr exhibits an irregular spherical structure, and this morphological change may be attributed to the effect of chlorophyll extract. In order to verify the changes in particle size before and after BiOBr sensitization, the particle size statistical analysis was carried out, as shown in Fig. 2(c and d) for EA-BiOBr and Ch-BiOBr, respectively, and it was found that the average particle size of Ch-BiOBr was 0.07 ± 0.014 μm, which was less than the average particle size of EA-BiOBr 0.27 ± 0.06 μm. To compare the morphology changes and particle size distributions of BiOCl and BiOI, SEM and particle size statistical analysis were also performed on them (Fig. S1 and S2†). Similar to BiOBr, the particle sizes of Ch-BiOCl and Ch-BiOI decreased. This is all due to the effect of chlorophyll on the size of the catalyst.25
 |
| | Fig. 2 SEM images of (a) EA-BiOBr and (b) Ch-BiOBr. Particle size distribution histogram of (c) EA-BiOBr and (d) Ch-BiOBr. | |
TEM analysis revealed spherical BiOBr particles (Fig. 3a and b), consistent with the SEM observations. According to the high-resolution transmission electron microscopy (HRTEM) in Fig. 3c, the lattice spacing was measured at 0.35 nm, corresponding to the (101) crystallographic plane of BiOBr, which aligns with reported literature values.26 Additionally, elemental mapping using energy dispersive spectroscopy (EDS) was performed to determine the composition and provide detailed characterization of BiOBr. The results demonstrate that the elements of Bi, Br, and O are uniform distributed throughout the BiOBr material (Fig. 3d–g), confirming its successful synthesis. The detection of Mg and N elements further confirms the successful incorporation of chlorophyll from Chlorella into the BiOBr (Fig. 3h and i), as these elements are derived from chlorophyll extract.27,28 Additionally, EA-BiOBr was analyzed using TEM, HRTEM, and EDS. TEM images revealed that EA-BiOBr exhibited irregular flakes (Fig. S3a and b†), consistent with SEM observations. HRTEM analysis confirmed a lattice spacing of 0.35 nm (Fig. S3c†), corresponding to the (101) plane of BiOBr, similar to Ch-BiOBr. The EDS elements mapping of EA-BiOBr demonstrated the uniform distribution of Bi, Br, and O (Fig. S3d–f†), confirming its successful synthesis. In contrast to Ch-BiOBr, EA-BiOBr lacked detectable C, N, and Mg, further confirming the successful loading of chlorophyll onto BiOBr in the Ch-BiOBr composite.
 |
| | Fig. 3 (a and b) TEM images, (c) HRTEM image, and (d–i) EDS elements mapping of Ch-BiOBr. | |
XRD analysis
The crystal structure of BiOX synthesized using ethanol and chlorophyll extract was characterized via X-ray diffraction (XRD). Fig. 4 shows the XRD patterns of BiOBr synthesized through both solvents of ethanol and chlorophyll extract. Both EA-BiOBr and Ch-BiOBr exhibit diffraction peaks corresponding to the tetragonal phase of BiOBr (JCPDS No. 09-0393). It can be observed that the overall peak intensity of Ch-BiOBr is lower than that of EA-BiOBr, except for the (101) plane. Since higher peak intensity indicates better crystallinity,29 the crystallinity of Ch-BiOBr is slightly lower than that of EA-BiOBr, likely due to the presence of chlorophyll. This result is consistent with what has been reported in the literature.6 Reduced crystallinity typically correlates with smaller particle sizes, which are advantageous for enhancing photocatalytic activity.30 The smaller particle size of Ch-BiOBr aligns with the statistical analysis of its particle size distribution in SEM, confirming that Ch-BiOBr particles are smaller than those of EA-BiOBr. Additionally, XRD analysis was conducted to compare the crystal structures of BiOCl and BiOI before and after sensitization (Fig. S4a and b†). Like BiOBr, Ch-BiOCl and Ch-BiOI exhibit a slight reduction in crystallinity while maintaining sharp diffraction peaks, indicating the structural integrity of the materials.
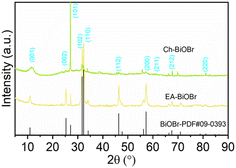 |
| | Fig. 4 XRD patterns of EA-BiOBr and Ch-BiOBr. | |
XPS analysis
The composition and chemical state of the samples were examined using X-ray photoelectron spectroscopy (XPS). For Ch-BiOBr and EA-BiOBr the elemental peaks of Bi, Br, O and C were analyzed in detail. From the full spectrum, there are Mg, N, Br, O and Bi elements, the first two elements from chlorophyll, and the last three elements from BiOBr. However, there is no occurrence of Mg and N elements in the full spectrum of EA-BiOBr (Fig. S5a and b†). High-resolution XPS spectra of Bi, Br, O and C were obtained (Fig. 5a–d). Fig. 5a shows the spectra of Bi in Ch-BiOBr and EA-BiOBr. In Ch-BiOBr the Bi 4f spectrum shows two peaks at 164.2 and 158.9 eV, corresponding to Bi 4f5/2 and Bi 4f7/2, respectively, with a spin-energy separation of 5.3 eV, consistent with the characteristics of Bi(III) in BiOBr. Compared to EA-BiOBr, the binding energies of Bi 4f in Ch-BiOBr at 164.5 eV and 159.2 eV were reduced by 0.3 eV. Fig. 5b shows the spectra of Br in Ch-BiOBr and EA-BiOBr. In Ch-BiOBr, the Br 3d spectrum reveals peaks at 68.9 and 67.8 eV, attributed to Br 3d3/2 and Br 3d5/2, respectively. Compared with EA-BiOBr, the binding energy of Br at 69.3 and 68.4 eV is slightly reduced. Fig. 5c shows the spectra of O in Ch-BiOBr and EA-BiOBr. In Ch-BiOBr at 532.1 eV was due to the O in the O–H bond in chlorophyll, and the peak at 529.4 eV was the O–Bi bond in BiOBr. In EA-BiOBr, only the O–Bi bond from BiOBr appears in 529.9 eV, and there is no O–H bond. Indicating that chlorophyll in Chlorella was loaded on BiOBr. Fig. 5d shows the spectra of C in Ch-BiOBr and EA-BiOBr. In Ch-BiOBr is the high-resolution XPS spectrum of C 1s with C![[double bond, length as m-dash]](https://www.rsc.org/images/entities/char_e001.gif) C bonds at 284.2 eV, C–O bonds at 286.6 eV, and CO bonds at 288.2 eV. These bonds are derived from chlorophyll. The C 1s peak in EA-BiOBr is only 284.7 eV, which is due to the C–C bond in background C, it was also verified that chlorophyll was successfully loaded in Ch-BiOBr. XPS analysis of Ch-BiOCl and Ch-BiOI was also carried out to verify the composition of the samples (Fig. S6 and 7†).
C bonds at 284.2 eV, C–O bonds at 286.6 eV, and CO bonds at 288.2 eV. These bonds are derived from chlorophyll. The C 1s peak in EA-BiOBr is only 284.7 eV, which is due to the C–C bond in background C, it was also verified that chlorophyll was successfully loaded in Ch-BiOBr. XPS analysis of Ch-BiOCl and Ch-BiOI was also carried out to verify the composition of the samples (Fig. S6 and 7†).
 |
| | Fig. 5 XPS spectra of Ch-BiOBr and EA-BiOBr. (a) Bi element, (b) Br element, (c) O element, (d) C element. | |
Optical properties
The UV-visible diffuse reflectance spectra (UV-vis DRS) are shown in Fig. 6. As can be seen from Fig. 6a, Ch-BiOBr exhibits stronger absorbance than EA-BiOBr in the wavelength range of 400–800 nm, which can be attributed to the optical activity of chlorophyll and its sensitization effect on semiconductors.31 Additionally, Ch-BiOBr displays a characteristic absorption peak around 690 nm, corresponding to chlorophyll in Chlorella, whereas this peak is absent in EA-BiOBr, further confirming the successful loading of chlorophyll onto BiOBr. The band gap energy was calculated using the Kubelka–Munk formula:32
where α, h, ν, Eg, and A are the absorption coefficient, Planck's constant, optical frequency, band gap energy, and constant, respectively. And n for BiOBr corresponds to an indirect leap with a value of 4. As shown in Fig. 6b, the calculated Eg values indicate a slight decrease in the band gap of Ch-BiOBr, with Ch-BiOBr exhibiting a band gap of 1.9 eV, compared to 2.4 eV for EA-BiOBr. This reduction is likely due to the adsorption of chlorophyll on the surface of Ch-BiOBr.33 Fig. 6c shows the ultraviolet diffuse reflectance spectroscopy (UV-vis DRS) of chlorophyll extract, in which the absorption peaks of chlorophyll pigment are mainly distributed in the visible region of 350–500 nm and 630–700 nm. The absorption edge of the chlorophyll extract is 690 nm, corresponding to a band energy of 1.79 eV. This value aligns with the lowest unoccupied molecular orbital (LUMO) energy of −1.22 V and the highest occupied molecular orbital (HOMO) energy of 0.57 V for chlorophyll,34 closely matching the band gap value of 1.78 eV reported by Cho et al..35 Consequently, the band gap of Ch-BiOBr is slightly lower than that of EA-BiOBr. The narrower band gap of Ch-BiOX compared to EA-BiOX suggests that Ch-BiOX is more readily activated by visible light, generating a higher number of photogenerated electrons and holes, which is advantageous for photocatalysis. To further compare and validate the visible-light absorption capacity of the other two BiOX compounds before and after chlorophyll sensitization, additional UV-vis DRS measurements were conducted (Fig. S8 and 9†). While both EA-BiOI and Ch-BiOI exhibit the smallest band gaps, this can lead to a higher recombination rate of photogenerated electron–hole pairs, thereby reducing photocatalytic efficiency.26
 |
| | Fig. 6 (a) UV-vis DRS and (b) (αhν)1/2 versus hν curves of BiOBr, (c) UV-vis DRS of chlorophyll extracts. | |
FTIR analysis
FTIR was employed to investigate the functional groups on the surface of the materials. FTIR of EA-BiOBr, Ch-BiOBr and chlorophyll extracts are shown in Fig. 7, the peaks of EA-BiOBr and Ch-BiOBr at 577 cm−1 correspond to the Bi–O bonds in BiOBr, and the peaks of Ch-BiOBr and chlorophyll extracts at 817 and 1039 cm−1 correspond to the tensile vibrations of C–H and C–O–C from chlorophyll, respectively, while EA-BiOBr does not have these two peaks. This indicates that chlorophyll is loaded on BiOBr. At 3200–3500 cm−1, all three have broad peaks, which are attributed to O–H vibrations in H2O. To compare the characteristics of the infrared absorption peaks of BiOCl and BiOI before and after sensitization, Ch-BiOCl and Ch-BiOI also had peaks at 814 and 1039 cm−1 (Fig. S10†), which were attributed to the tensile vibration of C–H and C–O–C in chlorophyll, while EA-BiOCl and EA-BiOI did not have these two peaks, indicating that chlorophyll was loaded on BiOCl and BiOI. The peaks in at 508 cm−1 and at 564 cm−1 are Bi–O bonds in BiOCl and BiOI (Fig. S10a and b†), respectively.
 |
| | Fig. 7 FTIR of Ch-BiOBr, EA-BiOBr and chlorophyll extract. | |
N2 adsorption–desorption isotherms and pore size distribution
N2 adsorption–desorption experiments were performed to assess the specific surface area and pore properties of the as-prepared samples. The isotherms and pore distributions of EA-BiOBr, Ch-BiOBr, EA-BiOCl, Ch-BiOBr, EA-BiOI and Ch-BiOI are shown in Fig. 8, S11 and 12.† The results indicate that the incorporation of chlorophyll increased the specific surface area of all Ch-BiOX compared to their ethanol-synthesized counterparts (Table 1), with Ch-BiOBr exhibiting the most significant increase (Fig. 8b), it corresponds to the smallest average particle size of Ch-BiOBr in SEM. A larger specific surface area generally correlates with more active sites on the material's surface, which enhances the interaction between the composite and pollutant. This increase in surface area improves both the dark adsorption efficiency and the photocatalytic performance under visible light.
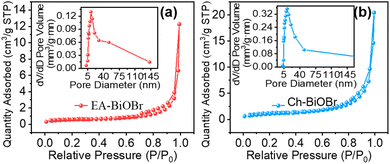 |
| | Fig. 8 N2 adsorption–desorption isotherms and pore size distribution of (a) EA-BiOBr and (b) Ch-BiOBr. | |
Table 1 Specific surface area of EA-BiOX and Ch-BiOX
| Catalyst |
SBET/(m2 g−1) |
| EA-BiOCl |
4.32 |
| EA-BiOBr |
1.71 |
| EA-BiOI |
2.07 |
| Ch-BiOCl |
5.91 |
| Ch-BiOBr |
13.1 |
| Ch-BiOI |
2.98 |
Zeta potential
The stability of sensitized BiOX was determined by measuring the zeta potentials of the samples and extracts. According to the zeta potentials (Table 2), both Ch-BOX exhibit lower zeta potentials compared to EA-BiOX. Specifically, Ch-BiOCl and Ch-BiOI show smaller changes in zeta potential, with a change of 2.03 and 5.07 mV, respectively. In contrast, Ch-BiOBr exhibits a more substantial decrease in zeta potential, from 15.73 to −22 mV, representing a change of 37.73 mV. This indicates that chlorophyll extract exerts a sensitizing effect on all BiOX, with Ch-BiOBr demonstrating the greatest stability at −22 mV, highlighting the strongest sensitizing effect of chlorophyll extract on BiOBr.
Table 2 Zeta potentials of EA-BiOX and Ch-BiOX
| Samples |
EA-BiOCl |
EA-BiOBr |
EA-BiOI |
| Zeta potential (mV) |
−6.14 |
15.73 |
27.83 |
| Samples |
Ch-BiOCl |
Ch-BiOBr |
Ch-BiOI |
| Zeta potential (mV) |
−8.17 |
−22 |
22.76 |
Interpretation of activity enhancement
The influence of initial pollutant concentration, photocatalyst concentration, and the pH of the pollutant solution on the degradation efficiency was investigated in detail. To validate the sensitizing effect of chlorophyll in Chlorella on BiOBr, Ch-BiOBr was immersed in anhydrous ethanol at 50 °C and 200 rpm for 2 days, followed by centrifugation to collect the Ch-BiOBr powders. The photocatalytic degradation of RhB with the treated Ch-BiOBr was compared to that with untreated Ch-BiOBr. As shown in Fig. 9a, the degradation efficiency of ethanol-treated Ch-BiOBr was significantly lower than that of untreated Ch-BiOBr, with a degradation rate of 65.7% at 1.5 h compared to 97.8% for the untreated Ch-BiOBr. This demonstrates the critical role of chlorophyll from Chlorella in enhancing the photocatalytic activity of BiOBr.
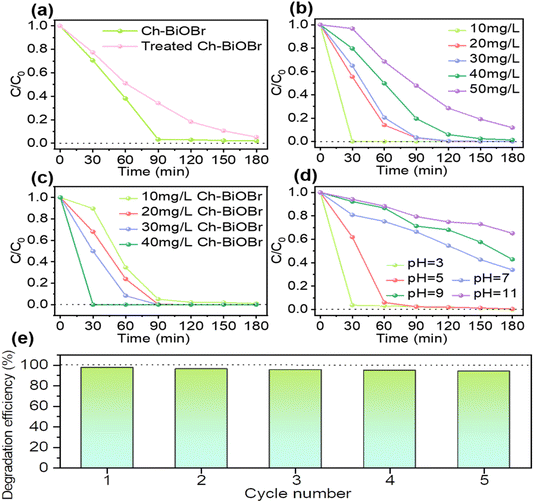 |
| | Fig. 9 Photocatalytic degradation of RhB by Ch-BiOBr samples under blue light irradiation. (a) C/C0 plots of RhB degradation by Ch-BiOBr before and after soaking by ethanol. (b) C/C0 plots of RhB degradation at varying concentrations by a fixed sample amount (0.2 mg L−1). (c) Degradation of RhB (20 mg L−1) by the sample at different concentrations. (d) C/C0 plots of RhB degraded by the samples under different initial pH conditions. (e) Cycling degradation tests of RhB (20 mg mL−1) using a given amount of Ch-BiOBr (10 mg L−1). | |
The degradation of RhB was also evaluated at different initial concentrations (10, 20, 30, 40, and 50 mg L−1) using a fixed amount of Ch-BiOBr (0.02 mg L−1), as shown in Fig. 9b. Ch-BiOBr effectively degraded RhB at all tested concentrations of RhB, except for 50 mg L−1, where a degradation rate of 88% was observed after 3 h. For all other concentrations, complete degradation was achieved within 3 h, with 100% degradation reached in 30 min for 10 mg per L RhB. The increase in initial concentration extended the time required to achieve degradation equilibrium, likely due to the need for more active sites on the catalyst to adsorb and degrade the higher pollutant load.36
Further investigations were conducted on the impact of Ch-BiOBr concentrations on the degradation of 20 mg per L RhB. The results, illustrated in Fig. 9c, indicate that increasing Ch-BiOBr concentration enhanced the degradation rate. The degradation rate did not significantly increase when Ch-BiOBr was raised from 0.2 mg L−1 to 1.0 mg L−1, with equilibrium reached in approximately 1.5 h. However, at 1.4 mg L−1, the degradation rate of RhB reached the degradation equilibrium at 30 min, and the degradation rate reached 100% within 30 min. This improvement is attributed to the increased number of active sites on the catalyst, which facilitates more efficient adsorption and degradation of RhB.37
The impact of initial pH on RhB degradation by Ch-BiOBr was also evaluated (Fig. 9d). The results revealed that photocatalytic degradation efficiency decreased with increasing pH. The highest degradation rata of 96.3% was observed at pH = 3 within 30 min, and 99.6% at pH = 5 after 1 hour. The efficiency was significantly lower at pH 7, 9 and 11. This variation is likely due to the cationic nature of RhB, which adsorbs more effectively onto Ch-BiOBr at lower pH levels, enhancing interaction with the photocatalyst's active sites and promoting degradation. At higher pH values, increased repulsion between the negatively charged surface of Ch-BiOBr and deprotonated RhB reduces degradation efficiency.38
In addition, a cycling test was carried out to evaluate the photocatalytic stability and cycling performance of Ch-BiOBr to degrade RhB. As shown in Fig. 9e, five cycling experiments were carried out, the degradation efficiency of RhB was still 94.2%, indicating that Ch-BiOBr had good cycling stability.
To investigate the photocatalytic degradation mechanism of RhB, various scavengers were employed to selectively remove specific reactive species. The experimental results, detailed in Fig. 10a and b, illustrate the degradation process of RhB with different scavengers and the corresponding rate constants (k-values). The data revealed a significant reduction in the k-value across all scavenger treatments, except for isopropyl alcohol (IPA). This indicates that superoxide radicals (˙O2−), electrons (e−), and holes (h+) are the primary reactive species in RhB degradation, rather than hydroxyl radicals (˙OH). The observed acceleration in degradation with IPA is attributed to the scavenging of ˙OH, which enhances the separation of electron–hole pairs and reduces their recombination. Consequently, the increased availability of ˙O2− and e− improves the efficiency of photocatalytic RhB degradation. The mechanism of chlorophyll-sensitized BiOBr for RhB degradation is shown in Fig. 10c. Here, BiOBr functions as the photocatalyst, hν represents the absorbed visible light energy, VB denots the valence band, and CB indicates the conduction band. While the lowest unoccupied molecular orbital (LUMO) and highest occupied molecular orbital (HOMO) energies correspond to the chlorophylls in Chlorella vulgaris. Calculations for the CB and VB potentials can be derived from eqn (1) and (2):39
where
X represents the absolute electronegativity of the semiconductor, defined as the geometric mean of the absolute electronegativities of the constituent atoms.
Ec is the energy of the free electrons on the hydrogen scale (∼4.5 eV).
4 Eg is semiconductor band gap (∼1.9 eV).
ECB and
EVB are the conduction and valence band positions, respectively. Therefore, BiOBr possesses an
ECB of −0.53 eV and an
EVB of 1.37 eV.
 |
| | Fig. 10 (a and b) Degradation process and k value of RhB by different scavengers. (c) Mechanism of Ch-BiOBr photocatalytic degradation of RhB. | |
Chlorophyll plays a crucial role in photocatalysis by generating electron–hole pairs upon excitation. When chlorophyll absorbs visible photons, electrons transition from the ground state HOMO (0.57 V vs. NHE) to the excited state LUMO (−1.22 V vs. NHE) via a π–π* transition, as represented in eqn (3).40 In this excited state, electrons are subsequently transferred to the conduction band of BiOBr (−0.53 V vs. NHE), facilitating photoreduction reactions. The excited electrons rapidly migrate to the BiOBr surface, triggering reactions that generate reactive oxygen species, such as superoxide (˙O2−) and hydroxyl (˙OH) radicals. The efficiency of electron transfer is influenced by the intrinsic properties of chlorophyll and its interaction with the semiconductor. The process of photocatalytic degradation of RhB by Ch-BiOBr can be represented by the following equation:
| | |
Ch(HOMO) + hν(π–π*) → Ch*(LUMO)
| (3) |
| | |
Ch*(LUMO) → Ch* → Ch(HOMO)
| (4) |
| | |
Ch* → Ch+ + e−(CB of BiOBr)
| (5) |
| | |
e−(CB of BiOBr) + O2 → ˙O2−
| (6) |
| | |
˙O2− + RhB → intermediates + CO2 + H2O
| (10) |
Conclusion
Chlorophyll extracted from Chlorella proved to be an effective sensitizer for BiOX photocatalysts, with BiOBr demonstrating the highest sensitivity and performance enhancements. The incorporation of chlorophyll substantially increased the specific surface area of BiOX, with BiOBr exhibiting a 7.7-fold increase compared to BiOBr synthesized using ethanol. Chlorophyll sensitization also resulted in a significantly more negative zeta potential for BiOBr, enhancing RhB adsorption and photocatalytic degradation efficiency. Under blue light irradiation (50 W, 410–420 nm), BiOBr achieved a RhB degradation rate of 97.8% within 1.5 hours. At pH = 3 and an initial RhB concentration of 20 mg L−1, the degradation efficiency reached 99.8%, highlighting the exceptional photocatalytic capability of chlorophyll-sensitized BiOBr. This study demonstrates that chlorophyll derived from Chlorella biomass can effectively serve as a sensitizer for photocatalytic materials, modulating morphology, structure, and surface potential to enhance photocatalytic performance. These findings provide a theoretical foundation for the application of chlorophyll in sensitizing photocatalysts for environmental remediation.
Data availability
The authors affirm that the data supporting the findings of this study are included in the article, additional data can be made available from the corresponding author upon reasonable request.
Author contributions
Yan Li: methodology, investigation, formal analysis, data curation, writing original draft. Liangbin Lin: formal analysis, conceptualization. Fengrui Wu: formal analysis. Lihong Xu: formal analysis, conceptualization. Yi Zhang: formal analysis. Xinshu Xia: formal analysis, conceptualization. Changlin Cao: writing – review & editing, formal analysis. Weiming Zhou: writing – review & editing, writing – original draft, formal analysis. Liren Xiao: writing – review & editing, resources. Qingrong Qian: writing – review & editing, resources, funding acquisition, conceptualization. Qinghua Chen: writing – review & editing, resources, funding acquisition, conceptualization.
Conflicts of interest
There are no conflicts to declare.
Acknowledgements
This work is gratefully acknowledged by the National Key Research and Development Program of China (2023YFC3906300) and the Fujian Provincial Department of Science and Technology (2023L3006).
References
- Y. Yang, C. Zhang, C. Lai, G. Zeng, D. Huang, M. Cheng, J. Wang, F. Chen, C. Zhou and W. Xiong, Adv. Colloid Interface Sci., 2018, 254, 76–93 CrossRef CAS PubMed
 .
. - R. Kumar, P. Raizada, N. Verma, A. Hosseini-Bandegharaei, V. K. Thakur, L. Quyet Van, N. Van-Huy, R. Selvasembian and P. Singh, J. Cleaner Prod., 2021, 297, 126617 CrossRef CAS .
- J. Liu, H. Li, N. Du, S. Song and W. Hou, RSC Adv., 2014, 4, 31393–31399 RSC .
- J. Sun, C. Jiang, Z. Wu, Y. Liu and S. Sun, Chemosphere, 2022, 308, 136107 CrossRef CAS PubMed .
- X. Yan, H. Zhao, T. Li, W. Zhang, Q. Liu, Y. Yuan, L. Huang, L. Yao, J. Yao, H. Su, Y. Su, J. Gu and D. Zhang, Nanoscale, 2019, 11, 10203–10208 RSC .
- N. Sharma, K. Saszet, T. Szabo, D. Karajz, I. M. Szilagyi, S. Garg, Z. Pap and K. Hernadi, Catal. Today, 2023, 413, 113984 CrossRef .
- J. Hu, X. Wu, C. Huang, W. Fan and X. Qiu, Appl. Surf. Sci., 2016, 387, 45–50 CrossRef CAS .
- C. Huang, J. Hu, S. Cong, Z. Zhao and X. Qiu, Appl. Catal., B, 2015, 174, 105–112 CrossRef .
- R. Zhou, J. Wu, J. Zhang, H. Tian, P. Liang, T. Zeng, P. Lu, J. Ren, T. Huang, X. Zhou and P. Sheng, Appl. Catal., B, 2017, 204, 465–474 CrossRef CAS .
- M. Nadeem, D. Tungmunnithum, C. Hano, B. H. Abbasi, S. S. Hashmi, W. Ahmad and A. Zahir, Green Chem. Lett. Rev., 2018, 11, 492–502 CrossRef CAS .
- T. Chankhanittha, C. Yenjai and S. Nanan, Catal. Today, 2022, 384–386, 279–293 CrossRef CAS .
- A. Rautela, J. Rani and M. Debnath, J. Anal. Sci. Technol., 2019, 10, 1–10 CrossRef .
- O. S. ElMitwalli, O. A. Barakat, R. M. Daoud, S. Akhtar and F. Z. Henari, J. Nanopart. Res., 2020, 22, 1–9 CrossRef .
- A. M. El Shafey, Green Process. Synth., 2020, 9, 304–339 Search PubMed .
- Z. Alhalili, Arabian J. Chem., 2022, 15, 103739 CrossRef CAS .
- N. A. I. Ishak, S. K. Kamarudin and S. N. Timmiati, Mater. Res. Express, 2019, 6, ab4458 Search PubMed .
- A. Thirumurugan, P. Aswitha, C. Kiruthika, S. Nagarajan and A. N. Christy, Mater. Lett., 2016, 170, 175–178 CrossRef CAS .
- C. Lu, Z. Xie, J. Guo, Y. Song, Y. Xing, Y. Han, H. Li and Y. Hou, Int. Biodeterior. Biodegrad., 2020, 148, 104895 CrossRef CAS .
- V. Soni, P. Raizada, P. Singh, H. N. Cuong, S. Rangabhashiyam, A. Saini, R. V. Saini, Q. Van Le, A. K. Nadda, T.-T. Le and V.-H. Nguyen, Environ. Res., 2021, 202, 111622 CrossRef CAS PubMed .
- S. G. Goncalves, P. R. Milanez, M. d. S. Pereira, R. M. Benetti, G. C. Bellettini, F. Elyseu, A. G. Dal-Bo and A. M. Bernardin, Chem. Eng. Sci., 2024, 285, 119598 CrossRef CAS .
- V. Etacheri, C. Di Valentin, J. Schneider, D. Bahnemann and S. C. Pillai, J. Photochem. Photobiol., C, 2015, 25, 1–29 CrossRef CAS .
- N. T. R. N. Kumara, A. Lim, C. M. Lim, M. I. Petra and P. Ekanayake, Renewable Sustainable Energy Rev., 2017, 78, 301–317 CrossRef CAS .
- Y. Zhu, Y. Liu, Q. Ai, G. Gao, L. Yuan, Q. Fang, X. Tian, X. Zhang, E. Egap, P. M. Ajayan and J. Lou, ACS Mater. Lett., 2022, 4, 464–471 CrossRef CAS .
- Y. Zhu and E. Egap, Polym. Chem., 2020, 11, 1018–1024 RSC .
- R. Vinayagam, S. Pai, T. Varadavenkatesan, A. Pugazhendhi and R. Selvaraj, Appl. Nanosci., 2021, 13, 493–502 CrossRef .
- D. Gong, Y. Li, H. Zhou, B. Gu, N. Celi, D. Zhang and J. Cai, Appl. Mater. Today, 2023, 35, 101915 CrossRef .
- Y.-S. Lai, Y. H. Su and M. I. Lin, Dyes Pigm., 2014, 103, 76–81 CrossRef CAS .
- H. Maimaitizi, A. Abulizi, D. Talifu and Y. Tursun, Adv. Powder Technol., 2022, 33, 103562 CrossRef CAS .
- M. Doumeng, L. Makhlouf, F. Berthet, O. Marsan, K. Delbe, J. Denape and F. Chabert, Polym. Test., 2021, 93, 106878 CrossRef CAS .
- S. A. Mousa, D. A. Wissa, H. H. Hassan, A. A. Ebnalwaled and S. A. Khairy, Sci. Rep., 2024, 14, 16713 CrossRef CAS PubMed .
- Z. Wang, Q. Cheng, X. Wang, J. Li, W. Li, Y. Li and G. Zhang, Chem. Eng. J., 2021, 418, 129460 CrossRef CAS .
- L. Wu, X. Li, D. K. Macharia, Z. Chen and L. Zhang, Mater. Lett., 2024, 359, 135831 CrossRef CAS .
- A. Terzopoulou, M. Palacios-Corella, C. Franco, S. Sevim, T. Dysli, F. Mushtaq, M. Romero-Angel, C. Marti-Gastaldo, D. Gong, J. Cai, X.-Z. Chen, M. Pumera, A. J. DeMello, B. J. Nelson, S. Pane and J. Puigmarti-Luis, Adv. Funct. Mater., 2022, 32, 202107421 CrossRef .
- A. Kathiravan, M. Chandramohan, R. Renganathan and S. Sekar, Spectrochim. Acta, Part A, 2009, 71, 1783–1787 CrossRef CAS PubMed .
- C. Cho, K. Nam, G.-Y. Kim, Y. H. Seo, T. G. Hwang, J.-W. Seo, J. P. Kim, J.-I. Han and J.-Y. Lee, Sci. Rep., 2019, 9, 18999 CrossRef CAS PubMed .
- X. Yang, Z. Chen, W. Zhao, C. Liu, X. Qian, W. Chang, T. Sun, C. Shen and G. Wei, J. Alloys Compd., 2021, 864, 158784 CrossRef CAS .
- X. Wang, Y. Ren, Y. Li and G. Zhang, Chemosphere, 2022, 287, 132098 CrossRef CAS PubMed .
- D. Zhao and C. Cai, Mater. Chem. Front., 2019, 3, 2521–2528 RSC .
- L. Usgodaarachchi, C. Thambiliyagodage, R. Wijesekera, S. Vigneswaran and M. Kandanapitiye, ACS Omega, 2022, 7, 27617–27637 CrossRef CAS PubMed .
- K. K. Das, S. Patnaik, S. Mansingh, A. Behera, A. Mohanty, C. Acharya and K. M. Parida, J. Colloid Interface Sci., 2020, 561, 551–567 CrossRef CAS PubMed .
|
| This journal is © The Royal Society of Chemistry 2025 |
Click here to see how this site uses Cookies. View our privacy policy here. 
 Open Access Article
 This Open Access Article is licensed under a Creative Commons Attribution-Non Commercial 3.0 Unported Licence
 *bd,
Weiming Zhou*bd,
Liren Xiao*ad,
Qingrong Qian
*bd,
Weiming Zhou*bd,
Liren Xiao*ad,
Qingrong Qian


