DOI:
10.1039/D5RA00382B
(Paper)
RSC Adv., 2025,
15, 9180-9189
Fabrication of polyvinylpyrrolidone capped nickel nanoclusters as sensing material for enhanced electrocatalytic oxidation of 2-amino-4-chlorophenol
Received
16th January 2025
, Accepted 12th March 2025
First published on 25th March 2025
Abstract
2-Amino-4-chlorophenol (2A-4CP) is a chemical compound with a chlorine-substituted aromatic ring and an amino group; it is a persistent environmental pollutant that poses serious threat to human health. Therefore, its quantification in environmental samples is the need of the hour. This research is focused on the synthesis of polyvinyl pyrrolidone-capped nickel nanoclusters (PVP/Ni-NCs) through a chemical reduction method. The successfully synthesized PVP/Ni-NCs were characterized using advanced analytical techniques, such as scanning electron microscopy (SEM), atomic force microscopy (AFM), X-ray diffraction (XRD) and zeta sizer analyses. SEM and AFM analyses were conducted to evaluate the surface morphology and 3D texture of the prepared PVP/Ni-NCs. XRD and zeta sizer results were utilized for the determination of average particle size of the nanoclusters, which was found 2.95 nm via XRD and 4.513 nm via zeta sizer respectively. The fabricated nanoclusters were used as electrocatalysts for the detection of 2A-4CP. The charge transfer kinetics of PVP/Ni-NCs/GCE was determined using electrochemical impedance spectroscopy (EIS) and cyclic voltammetry (CV). Moreover, under the optimized conditions (scan rate of 100 mV s−1, BRB electrolyte, pH 4 and potential window from −0.4 to 0.7 V), the fabricated sensor manifested exceptional response to 2A-4CP. In the linear dynamic range from 0.1 to 260 μM, the prepared sensor exhibited the lowest limit of detection of 0.079 μM. The high sensitivity of PVP/Ni-NCs/GCE suggests its efficiency to be utilized for the detection of environmental pollutants at a commercial level.
1. Introduction
The increasing global population, rapid industrialization and intensification of agricultural activities are the major reasons behind the continuous rise in environmental pollution as they release a huge amount of contaminants into the environment.1 Most of them are vulnerable, toxic and extremely poisonous, such as toxic inorganic gases, volatile organic compounds (VOCs), heavy metals, personal care products (PPCPs), endocrine-disrupting chemicals (EDCs), dyes, and pharmaceuticals.2–5 These pollutants have been destroying the environmental balance of earth, increasing toxicity at an alarming rate and posing severe threats to human beings and the environment.6,7 Among the broad range of water pollutants, chlorophenols (CPs) are a major group of chemicals used in a variety of biocidal applications and as precursors of several pesticides. CPs are formed as byproducts of many industrial processes, such as the production of antioxidants, dyes and drugs, chlorination of drinking water, and chlorine-bleaching of paper.8,9 They are also frequently present in the waste of coal, gas, and petroleum industries. A massive amount of chlorinated phenols is released into the environment in the form of solvents, degreasers, and other industrially useful compounds.10–12 In particular, CPs are being released into natural water, air and soil during the manufacturing, regular usage and even degradation of other chemicals (e.g. phenoxy kaonic acids), causing severe environmental issues. In addition, they can be readily absorbed via inhalation, oral or dermal routes. Despite their low concentration, these contaminants are a major health concern because of their extremely high endocrine-disrupting potency and genotoxicity.13–15 Pharmacologically, 2-amino, 4-chloro phenol (2A-4CP) is a harmful substance that can irritate the eyes, respiratory system, and skin. The New Jersey Department of Health and Senior Services classifies 2A-4CP as a hazardous substance with acute health effects, including interfering with the ability of the blood to carry oxygen, causing headache, dizziness, and blue coloration of the skin and lips (methemoglobinemia), which may occur immediately or shortly after exposure to it. Higher levels of 2A-4CP can cause trouble in breathing and may lead to collapse and even death.16
Nowadays, various analytical techniques have been employed for the determination of 2A-4C. These methods analyze of this compound as a related substance of drugs or as an environmental water pollutant using colorimetric method.17 The TLC method has been reported for testing 2A-4CP as an impurity in chlorzoxazone bulk powder.18 Different reverse-phase HPLC methods have also been investigated for the determination of 2A-4CP using a UV detector.19 Moreover, 2A-4CP was analyzed using GC/MS methods,20 and capillary electromigration separation techniques were also investigated for the assay of 2A-4CP with other phenolic compounds.21 However, several researchers have reported that that the above-mentioned analytical methods have complicated operating systems, time constrains and usage of extensive hazardous organic solvents; they also require skilled operators for the sample preparation and expensive instrumental setup for the determination of 2A-4CP from the environment effluents. On the contrary, electrochemical analysis has attracted much attention because of low cost, fast response, high selectivity, inexpensive instrumentation, low energy consumption, good reliability, simple operation, quick operation and high sensitivity, especially for the in situ detection of 2A-4CP.22 In addition, electrochemical sensors usually suffer from stability and selectivity issues since many years. These challenges remain major bottlenecks in their development.23 Therefore, different nanomaterials have been broadly tested as modifiable materials for electrochemical sensors to resolve these issues. Amongst the nanomaterials, nanoclusters (NCs) are unique nanomaterials with ultra-small sizes and high efficiency and have been widely used in different modern applications.24
Amongst different NCs, Ni-NCs manifest discrete energy levels and molecular electronic transitions within the conduction band, resulting in interesting electrical and optical properties, especially strong fluorescence emission.25 Ni-NCs also exhibit tunable fluorescence from visible to NIR regions. This tunable fluorescence occurs either through molecular-like electronic transitions within the conduction band or due to the charge transfer from the ligand to metal NPs. Moreover, Ni-NCs exhibit high photoluminescence (PL) quantum yields (QYs) and can be easily prepared.26,27 Fluorescent Ni-NCs form a new class of ultra-small, water-soluble, stable, and biocompatible fluorophores that can complement or even replace conventional fluorescent probes, offering immense opportunities for advancements in sensors and biological labelling technologies.28,29 Ni-NCs have drawn considerable research interest in recent years due to their unique electrical, physical and optical properties for use in electronic devices, catalysis, biological imaging, and chemical sensors. These properties of NCs are very sensitive to their chemical environment, including the cluster size, type of solvent, and surface-protecting ligands.30,31 Moreover, for the long-term efficiency of metal nanoclusters (MNCs), different polymers, such as polyethylene glycol (PEG), polyvinyl alcohol (PVA) and polyvinylpyrrolidone (PVP), are being used in recent years. These polymers prevent the agglomeration of NCs and retain their efficacy for long periods.32,33
For the first time, this work reports the fabrication of PVP-capped Ni-NCs/GCE for the trace-level quantification of 2A-4CP in water samples and industrial effluents. The prepared sensors exhibited high sensitivity, selectivity and long-term stability, which can resolve the problems of high cost, low efficiency and anti-interference profile.
2. Materials and methods
2.1 Chemicals and solutions
The chemicals and reagents used in this study were of analytical grade and used without further purification. Nickle nitrate hexahydrate (NiNO3·6H2O), sodium borohydride (NaBH4) and polyvinylpyrrolidone (PVP) were bought from Merck (Germany). 2-Amino 4-chloro phenol was obtained from Sigma Aldrich (USA). Moreover, a 0.1 M solution of phosphate buffer saline (PBS), Briton Robinson (BRB), borate and NaOH were prepared in deionized water, and the pH of the electrolytes was adjusted using 0.1 M HCl and 0.1 M NaOH.
2.2 Instrumentation
Various analytical tools were used to evaluate the successful synthesis of the engineered PVP/Ni-NCs. The crystalline structure and phase purity of the engineered material were explored using XRD (XRD-7000, Shimadzu Scientific Instruments). The surface texture of PVP/Ni-NCs was analyzed by scanning electron microscopy (SEM-3200 with a tungsten filament). The 3D morphology of PVP/Ni-NCs was investigated by atomic force microscopy (AFM; Park FX-40). The nanometric size of PVP/Ni-NCs was examined using a zeta sizer (Ultra MADLS). The electrochemical parameters were obtained using electrochemical impedance spectroscopy (EIS), differential pulse voltammetry (DPV) and cyclic voltammetry (CV) on a CHI-760 electrochemical instrument, which consisted of a three-electrode system: a glassy carbon electrode (GCE) as the working electrode, Ag/AgCl as the reference electrode and platinum wire as the counter electrode.
2.3 Preparation of PVP/Ni nanoclusters
Ni-NCs were synthesized via polymer–ligand interactions using a reported chemical reduction method. The synthesis procedure of PVP/Ni NCs was as follows. Typically, 0.5 mL of the PVP (polyvinylpyrrolidone) ligand solution was mixed with 1.0 mL of a freshly prepared sodium borohydride solution (100 mM) and 25.0 mL of DI water under continuous magnetic stirring at 1200 rpm on a hot plate for a few minutes. Then, 4.0 mL of a freshly prepared nickel nitrate hexahydrate solution (10.0 mM) was poured into the mixture dropwise; the color of the mixture turned from white to grayish with the evolution of gas. After that, 1 mL of a NaBH4 solution was added, and the reaction mixture was stirred at room temperature for 4 h. Later, the solution was purified by centrifugation at 7000 rpm for 2 min. The as-purified Ni-NCs suspension was stored at 4 °C prior to use.
2.4 Fabrication of PVP/Ni-NCs/GCE
The conductivity and sensitivity of the glassy carbon electrode (GCE) were enhanced by fabricating a modified electrode. This modification process utilized the drop-casting method, as detailed in previous studies.9,34,35 To ensure uniform modification of the GCE surface, 5.0 mg of the synthesized PVP/Ni-NCs were dispersed in 2.5 mL of deionized water. This dispersion was mixed with 60 μL of Nafion, which acted as a binder, and subjected to sonication for 20 min. For surface preparation, the GCE surface was polished with an alumina slurry of 0.5 μm particle size. Subsequently, the electrode was sonicated in ethanol for 30 min to eliminate impurities. Then, 5.0 μL from the dispersion of PVP/Ni-NCs containing Nafion was successfully applied on the surface of the GCE by the drop-casting method. The resulting modified electrode, labeled PVP/Ni-NCs/GCE, was used as the working electrode for the trace-level detection and quantification of 2-A-4CP.
3. Results and discussion
3.1 Crystallinity and size analysis of PVP/Ni-NCs
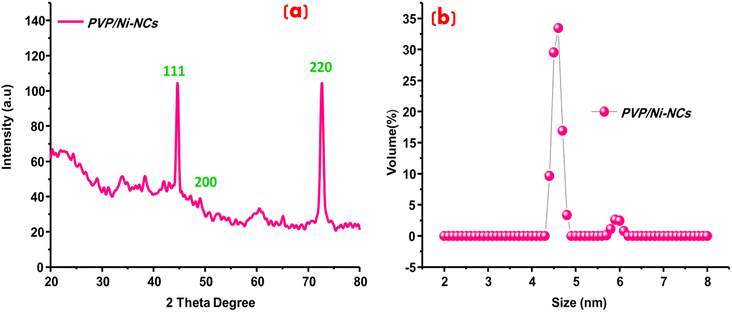
To evaluate the structural features and crystallinity of the prepared PVP/Ni-NCs, XRD analysis was successfully conducted, as displayed in Fig. 1(a). XRD is a powerful analytical tool that can be broadly used even for the determination of the crystallite size of materials. The prepared PVP/Ni-NCs exhibited three intense diffraction peaks representing the 111, 200 and 220 planes36,37 indicating a face-centered cubic structure. These results confirm the successful fabrication of PVP/Ni-NCs with high crystallinity and phase purity. Moreover, the size of the engineered nanoclusters was determined using the Debye–Scherrer equation. The size of PVP/Ni-NCs was calculated to be 2.95 nm, which is in the ultra-small size range. The obtained results were further confirmed by another analytical tool, namely zeta sizer, and the results are shown in Fig. 1(b). Zeta sizer could examine the size of the materials to ultra-small nanoscale level. The successful exploitation of zeta sizer determined the average size of PVP/Ni-NCs as 4.513 nm, which was in good agreement with the particle size calculated from XRD patterns using Debye Sherer equation. Moreover, both XRD and zeta sizer determined the size of PVP/Ni-NCs within 5 nm scale, signifying the ultra-small size of the prepared nanoclusters.
 |
| | Fig. 1 (a) XRD patterns of PVP/Ni-NCs, (b) zeta sizer analysis for the size determination of PVP/Ni-NCs. | |
3.2 Surface morphology and elemental composition of PVP/Ni-NCs
To determine the surface features and morphology of the engineered PVP/Ni-NCs, SEM analysis was employed. The low- and high-resolution SEM images at 10 μm and 1 μm are shown in Fig. 2(a and b), respectively, displaying non-uniform, porous and elongated morphology of the prepared PVP/Ni-NCs. The certain small pores visible on the surface of the PVP/Ni-NCs could be helpful for their use in sensing applications. In addition, to determine the purity and elemental composition of the PVP/Ni-NCs, the EDX analysis was conducted, as shown in Fig. 2(c). The EDX analysis successfully confirmed the high purity of PVP/Ni-NCs without any impurity. The percent elemental composition of the constituent elements was also calculated. The content of carbon, oxygen, nickel and nitrogen from PVP was determined as 22.84%, 39.30%, 36.89% and 0.97%, respectively.38 The EDX analysis successfully confirmed the fabrication of PVP/Ni-NCs and their impurity-free composition.
 |
| | Fig. 2 (a) Low- and (b) high-resolution SEM images of PVP/Ni-NCs and (c) EDX elemental composition of the prepared PVP/Ni-NCs. | |
3.3 FTIR analysis of PVP/Ni-NCs
FTIR is an exceptional analytical tool used for the determination of different functionalities in prepared materials. In Fig. 3, the broad peak at 3405 cm−1 corresponds to the surface-adsorbed water molecules. The peaks at 2963 cm−1 and 1639 cm−1 are attributed to C–H stretching and C![[double bond, length as m-dash]](https://www.rsc.org/images/entities/char_e001.gif) O stretching in PVP, respectively. Moreover, the peaks at 1440 cm−1 and 1288 cm−1 relate respectively to the stretching and bending frequencies of C–N in PVP.39 Moreover, the two peaks at 567 cm−1 and 548 cm−1 can be attributed to the Ni–O and Ni–N, respectively, which are formed through metal ligand bonding. All the characteristic FTIR peaks clearly highlight that PVP-capped Ni-NCs were successfully synthesized.
O stretching in PVP, respectively. Moreover, the peaks at 1440 cm−1 and 1288 cm−1 relate respectively to the stretching and bending frequencies of C–N in PVP.39 Moreover, the two peaks at 567 cm−1 and 548 cm−1 can be attributed to the Ni–O and Ni–N, respectively, which are formed through metal ligand bonding. All the characteristic FTIR peaks clearly highlight that PVP-capped Ni-NCs were successfully synthesized.
 |
| | Fig. 3 FTIR characterization peaks of PVP-capped Ni-NCs. | |
3.4 AFM analysis of PVP/Ni-NCs
Atomic force microscopy is an advanced analytical tool, which is being broadly exploited for the determination of three dimensional (3D) and two dimensional (2D) images of materials at nanoscale level. Therefore, to examine the 3D structure, 2D surface texture and average nanometric size of PVP/Ni-NCs, AFM analysis was performed successfully. The 3D and 2D images along with the size of the PVP/Ni-NCs are presented in Fig. 4(a and b). The AFM analysis revealed a highly dispersed nano-island-like 3D texture of the engineered PVP/Ni-NCs. The nano-islands seem to be very minute in size, and the average size of nano-islands were determined as 5.5 nm, which was in good agreement with the size calculated using XRD and zeta sizer analyses. The size of the prepared nanoclusters was found to be ultra-small, evidencing the successful fabrication of PVP/Ni-NCs.
 |
| | Fig. 4 (a and b) 3D and 2D AFM images, respectively, of PVP/Ni-NCs with small nano-island-like texture. | |
3.5 Characterization of PVP/Ni-NC electrodes
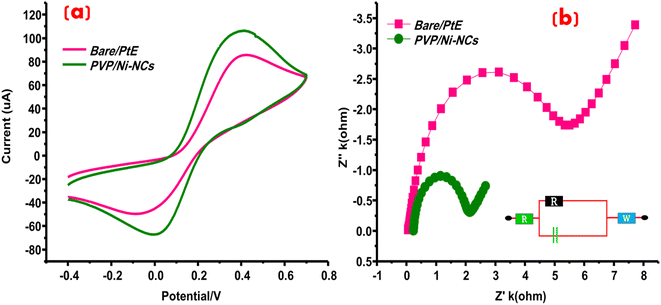
The effectiveness and conductivity of different electrodes, namely bare, bare/GCE, and PVP/Ni-NCs/GCE, were evaluated using cyclic voltammetry (CV). CV is instrumental in characterizing electrodes, enabling the determination of their conductive properties. Precisely, the conductive nature of both unmodified and modified electrodes was explored by immersing them in 0.3 M KCl and 0.4 M solutions of K3Fe (CN)6 and K4Fe(CN)6, which served as supporting electrolytes. As depicted in Fig. 5(a), the modified electrode, denoted as PVP/Ni-NCs/GCE, exhibited the highest redox peak current response. Furthermore, the conductive and resistive properties of the electrodes were verified using electrochemical impedance spectroscopy (EIS), which is an important technique in electrochemical analysis. Nyquist plots generated from EIS results exhibited a characteristic semicircular curve, wherein narrower semicircles corresponded to greater conductivity and vice versa. EIS investigations were conducted under optimized conditions of equilibration time of 2 s, high frequency up to 100![[thin space (1/6-em)]](https://www.rsc.org/images/entities/char_2009.gif) 000 Hz, low frequency of 1 Hz, and an initial potential of 1.2 mV. The resultant EIS Nyquist plots were fitted using appropriate circuit models, as illustrated in Fig. 5(b). The modified PVP/Ni-NCs/GCE exhibited a narrower semicircular curve than bare/GCE, demonstrating exceptional conductivity. These EIS results are in good agreement with the CV measurements. In addition, the comprehensive EIS and CV analyses highlight the remarkable conductivity of PVP/Ni-NCs/GCE, suggesting its potential application as a sensing platform for electroactive analytes.
000 Hz, low frequency of 1 Hz, and an initial potential of 1.2 mV. The resultant EIS Nyquist plots were fitted using appropriate circuit models, as illustrated in Fig. 5(b). The modified PVP/Ni-NCs/GCE exhibited a narrower semicircular curve than bare/GCE, demonstrating exceptional conductivity. These EIS results are in good agreement with the CV measurements. In addition, the comprehensive EIS and CV analyses highlight the remarkable conductivity of PVP/Ni-NCs/GCE, suggesting its potential application as a sensing platform for electroactive analytes.
 |
| | Fig. 5 (a) CV-based redox responses of bare/GCE and PVP/Ni-NCs/GCE at 100 mV s−1 and (b) Nyquist plots of bare/GCE and PVP/Ni-NCs/GCE generated from EIS study. | |
3.6 Determination of 2-amino 4-chlorophenol using PVP/Ni-NCs/GCE
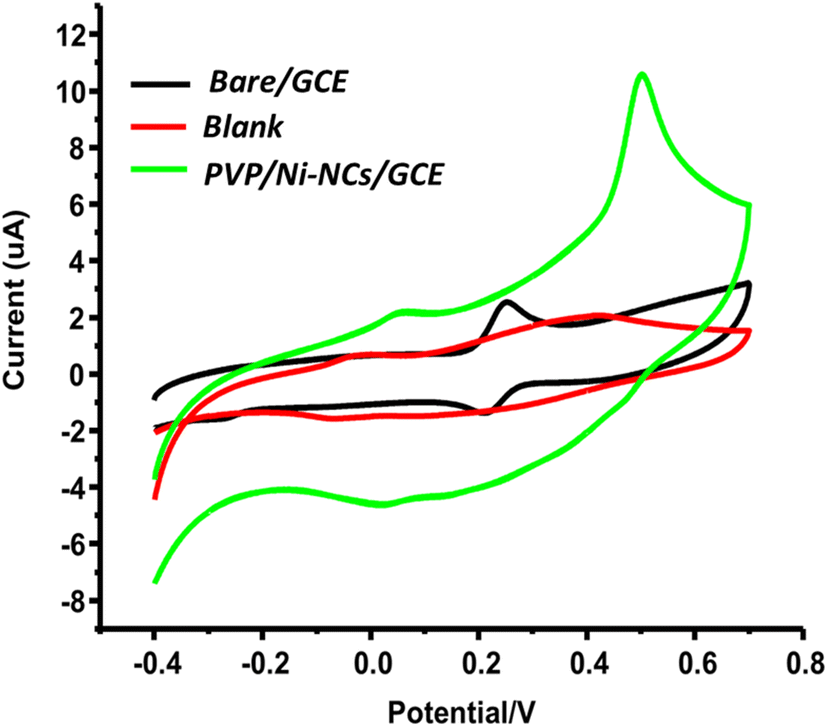
To assess the sensitivity and efficacy of the proposed PVP/Ni-NCs/GCE in detecting 2-amino 4-chlorophenol phenol (2-A-4CP), cyclic voltammetry (CV) measurements were conducted. 2-A-4CP determination was evaluated using 20 μM 2-A-4CP at the scan rate of 30 mV s−1 in the Briton Robinson buffer (BRB) at pH 4. The electrochemical potential window ranging from −0.4 to 0.7 V vs. Ag/AgCl was selected for the quantification of 2-A-4CP at the PVP/Ni-NCs/GCE interface. The comparative analysis demonstrated an enhanced oxidation peak current (Ipa) response of PVP/Ni-NCs/GCE to 2-A-4CP compared with bare/GCE. The PVP/Ni-NCs/GCE exhibited the peak potential of 0.5 V for 2-A-4CP, while the bare/GCE manifested the peak potential of 0.25 V for 2-A-4CP. The fabricated PVP/Ni-NCs/GCE sensor displayed remarkable electrochemical stability over 5 repeated cycles (n = 5). The oxidation behavior of 2-A-4CP at the proposed electrode interface was observed to be facile in a slightly acidic BRB support electrolyte. The increased electrical conductivity can be attributed to the ultra-small size of the prepared nanoclusters. The enhanced Ipa response of PVP/Ni-NCs/GCE to 2-A-4CP is shown in Fig. 6. Moreover, the synthesis of the Ni nanoclusters involved the utilization of polyvinyl pyrrolidine (PVP) as a functionalizing agent, which served the dual purpose of capping and stabilizing the Ni nanoclusters, consequently enhancing its structural characteristics for application as an electrochemical sensor.
 |
| | Fig. 6 CV-based Ipa response of bare/GCE and PVP/Ni-NCs/GCE to 20 μM 2-A-4CP at a scan rate of 20 mV s−1. | |
3.7 Effects of electrolyte and pH
In electrochemical measurements, the selection of supporting electrolytes and the pH of the electrolyte play fundamental roles. Supporting electrolytes greatly affect the process of analyte determination as they facilitate an appropriate medium for both the analyte and the sensing probes, thereby enabling electrochemical reactions to take place. In this investigation, a range of supporting electrolytes was assessed, including a pH 4 Britton Robinson buffer (BRB) for acidic conditions, a pH 12 sodium hydroxide (NaOH) for basic conditions, a pH 6 phosphate-buffered saline (PBS) for slightly acidic conditions, and a pH 8 borate buffer for mildly alkaline conditions. The electrochemical behavior of 2-A-4CP was examined using a 20 μM 2-A-4CP solution at a scan rate of 20 mV s−1.
Apparently, all the employed supporting electrolytes, regardless of their acidic or basic nature, exhibited distinct redox responses for 2-A-4CP. Among these conditions, the BRB medium at pH 3 exhibited the most definite proton transfer in the acidic medium. Moreover, the anodic peak current for borate and PBS in NaOH and H2SO4 electrolytes displayed diminished responses for 2-A-4CP. The CV-based Ipa responses of 2-A-4CP in different electrolytes are depicted in Fig. 7(a). Due to enhanced Ipa response to 2-A-4CP, BRB was selected as the optimal supporting electrolyte for further pH investigations. Subsequently, an investigation on the influence of pH on the electrochemical analysis of 2-A-4CP required preparing BRB electrolytes with varying pH levels, ranging from pH 3 (acidic) to pH 10 (basic). The pH-dependent responses of the sensor to 2-A-4CP are depicted in Fig. 7(b). The acidic pH 3 displayed a little enhancement in the current response to 2-A-4CP with a positive shift in peak potential. On the other hand, the diminished proton transfer process associated with less acidic conditions led to a negative shift in peak potential in response to 2-A-4CP. The maximum Ipa response to 2-A-4CP was observed at pH 4, whereas the current response to the targeted analyte decreased significantly from neutral to basic pH 10. Considering this effect, the pH 4 BRB electrolyte was selected as the optimal electrolyte pH for the determination of 2 A-4CP.
 |
| | Fig. 7 (a) Effect of different electrolytes on the Ipa response to 2-A-4CP at a scan rate of 20 mV s−1 and (b) effect of different pH values of the BRB electrolyte. | |
3.8 Scan rate study
The scan rate is a crucial parameter in electrochemical setups and is widely utilized to investigate diffusion-controlled processes occurring at the sensing probe surface. It determines the speed of cycling and the behavior of the analyte during various scan sweeps. As the scan sweeps are increased, the current response of the analyte should correspondingly rise. Deviations from this behavior indicate the adsorption of ions from the electrolytic medium to the electrode surface. Such ion adsorption usually results in non-uniform and uneven material deposition on the electrode surface. In this study, we increased the scan sweeps from 40 to 150 mV s−1 to explore the impact of the scan rate on the behavior of the analytes at the electrode surface. The anodic peak current response to 2-A-4CP exhibited a linear increase with higher scan rates. This observation strongly suggests a diffusion-controlled process and the uniform movement of ions at the PVP/Ni-NCs/GCE sensor surface. The experiments were conducted in a solution of 30 μM 2-A-4CP in BRB at pH 4. The anodic current responses to 2-A-4CP were recorded under varying scan rates, as illustrated in Fig. 8(a). To assess the consistency of the observed anodic current responses over multiple cycles, repeated runs were tested (n = 5), and a regression equation was obtained. The regression equation for the anodic peak current response displayed high linearity (R2 = 0.9978), as depicted in Fig. 8(b). The linearity of the current responses to 2-A-4CP clearly highlights that the electrochemical process at the surface of the PVP/Ni-NCs/GCE sensor was diffusion-controlled.
 |
| | Fig. 8 . (a) Effect of the scan rate on the Ipa responses of the sensor to 2-A-4CP and (b) plot of scan rate vs. current response with R2 = 0.9978. | |
3.9 Effect of interferants and stability measurement
To investigate the selectivity of the proposed chemically modified electrochemical sensor, an interference study was successfully conducted, as shown in Fig. 9(a). To examine the maximum effect of interferants, different foreign species were added alongside the targeted analyte at a two-fold concentration of 2-A-4CP (50 μM). Both organic co-existing interferants, such as nitrophenol (NP), nitroaniline (NA), diclofenac sodium (DFS), hydrobromic acid (HBA), benzoquinone (BQ), catechol (CC), and inorganic ions, including cadmium (Cd+2), magnesium (Mg+2), nickel (Ni+2), and iron (Fe+3), were added along with 2-A-4CP. None of the added organic and inorganic interferants could fluctuate the current and peak potential of the sensor in response to 2-A-4CP. To assess the reliability of PVP/Ni-NCs/GCE, each cycle was repeated four times (n = 4), and the RSD was also calculated as 3.26%. The calculated RSD clearly demonstrates exceptional selectivity of the proposed sensor to 2-A-4CP. Along with selectivity, the stability of the proposed PVP/Ni-NCs/GCE is also an important parameter in the field of electrochemical sensors. To assess the stability of the proposed PVP/Ni-NCs/GCE, CV analysis was conducted over repeated 30 cycles in the presence of 30 μM 2-A-4CP at a scan sweep of 30 mV s−1, as shown in Fig. 9(b). The proposed sensor manifested excellent stability up to 30 repeated cycles. Furthermore, the RSD for 30 repeated cycles of 2-A-4CP was calculated to be 4.13%, which signifies the excellent stability of PVP/Ni-NCs/GCE.
 |
| | Fig. 9 (a) Effects of different interferants on the Ipa response of the sensor to 2-A-4CP at a 30 mV s−1 scan rate and (b) stability of PVP/Ni-NCs/GCE over 30 repeated cycles. | |
3.10 Calibration study
The sensitivity and reliability of the engineered sensor were assessed through calibration measurements. Specifically, a calibration study was performed for 2-A-4CP using the PVP/Ni-NCs/GCE sensor in the Differential Pulse Voltammetry (DPV) mode in an electrochemical setup in a potential window ranging from 0.2 to 0.8 V. The BRB electrolyte at pH 4 was employed as the supporting electrolyte, and the scan rate was set at 50 mV s−1. To evaluate the effectiveness of the proposed sensor, the Ipa responses to 2-A-4AP were recorded in the concentration range of 0.1 to 260 μM. Within this optimized linear dynamic range, the PVP/Ni-NCs/GCE sensor demonstrated a linear anodic peak current response for 2-A-4CP, as shown in Fig. 10(a). The sensitivity and effectiveness of this engineered sensor were further assessed by determining the detection limit for 2-A-4CP, which was 0.079 μM, notably lower than the LOD reported for other electrochemical sensors. The Limit of Quantification (LOQ) of the developed PVP/Ni-NCs/GCE-based sensor for 2-A-4CP was determined to be 0.265 μM. The linearity of the proposed electrochemical method for 2-A-4CP sensing was verified using regression analysis, yielding a regression equation with an R2 value of 0.9864, as displayed in Fig. 10(b). The repeatability of the proposed method was evaluated over five repeated cycles (n = 3).
 |
| | Fig. 10 (a) Calibration Ipa responses of the sensor to 2-A-4CP in the concentration range of 0.1 to 260 μM; (b) calibration plot with a regression coefficient value of R2 = 0.9864. | |
3.11 Analytical application
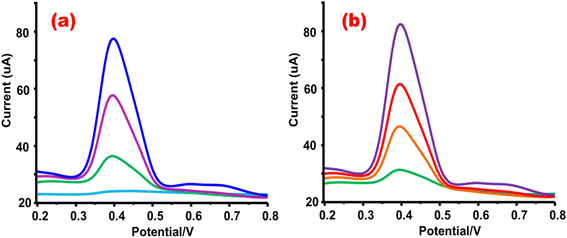
The practical utility and efficiency of the developed PVP/Ni-NCs/GCE sensor were assessed by analyzing river water and industrial wastewater samples collected from different sources. The river water samples were collected from the Indus River near Jamshoro, and the industrial wastewater sample was collected from the industrial region of Jamshoro. Both river water and industrial wastewater samples were filtered through Whatman filter paper to remove solid residues, which might hinder the analysis. The water samples were processed in the laboratory using the standard addition method in a 10 mL electrochemical cell, with a water-to-BRB electrolyte ratio of 1:10. The DPV graphs of the real samples (river water and industrial wastewater) are displayed in Fig. 11(a and b). A careful investigation revealed the presence of 2-A-4CP in the industrial wastewater sample. The recovery values for the river water and industrial wastewater samples were satisfactory. All the recovery and RSD values are presented in Table 1.
 |
| | Fig. 11 Real samples analysis of (a) river water and (b) industrial wastewater using PVP/Ni-NCs/GCE. | |
Table 1 Real sample analyses of 2-A-4CP in river water and industrial wastewater
| Sample |
Added (μM) |
Detected (μM) |
(%) Recovery |
(%) RSD |
| River water |
0 |
0 |
— |
— |
| 10 |
9.8 |
98.0 |
3.53 |
| 20 |
19.7 |
98.5 |
2.95 |
| 30 |
30.4 |
101 |
3.69 |
| Wastewater |
0 |
0.93 |
— |
— |
| 10 |
10.2 |
102 |
2.78 |
| 20 |
19.8 |
99.0 |
4.17 |
| 30 |
30.1 |
100.3 |
2.98 |
4. Conclusion
In summary, the synthesis of polyvinylpyrrolidone (PVP)-capped nickel nanoclusters (NCs) is reported for the electrocatalytic oxidation of 2-amino-4-chlorophenol. This study represents a substantial progression in the field of NC-based electrocatalysis. Ni-NCs were effectively engineered and characterized using various advanced methods, such as XRD for determining crystal structures and dimensions, zeta potential analysis for determining ultra-size properties, SEM for examining surface morphologies, EDX for validating elemental compositions, and AFM for three-dimensional visualization and size assessments. The results derived from these characterizations consistently validated the precision of the Ni-NCs preparation process, notably confirming their size to be ≤ 5 nm. This ultra-small size of PVP/Ni NCs highlights the proficiency of PVP capping in stabilizing the NCs during their fabrication. Furthermore, the electrode modified with these Ni-NCs displayed exceptional electrocatalytic efficacy in detecting 2-A-4CP, boasting an extraordinarily low detection limit of 0.079 μM. Such remarkable sensitivity and performance highlight the prospective use of PVP/Ni-NCs in the field of electrochemical sensing and catalysis. In conclusion, this study not only reports the effective synthesis and characterization of PVP/Ni-NCs but also showcases their elevated electrocatalytic effectiveness in the oxidation of 2-A-4CP. These findings present novel paths for the development of advanced high-performance electrochemical sensors and catalysts, with potential applications in diverse domains, including environmental monitoring and chemical analysis.
Data availability
Data are available from authors upon request.
Author contributions
Saba Ali Memon and Amber R. Solangi: conceptualization, experimental part, writing, data analysis, synthesis and correspondence. Saima Q. Memon, Huma Shaikh: characterization (AFM, XRD, SEM, zeta sizer) and electrochemical measurements. Jamil A. Buledi, Sidra Ameen: real sample analysis, drafting and language checking.
Conflicts of interest
All authors declare that they have no conflict of interest.
References
- H. Ali, A. Ali, J. A. Buledi, A. A. Memon, A. R. Solangi, J. Yang and K. H. Thebo, Mater. Chem. Front., 2023, 22, 5519–5544 Search PubMed.
- J. A. Buledi, S. Amin, S. I. Haider, M. I. Bhanger and A. R. Solangi, Environ. Sci. Pollut. Res., 2021, 28, 58994–59002 Search PubMed.
- A. F. Memon, S. Ameen, N. Qambrani, J. A. Buledi, N. H. Khand, A. R. Solangi, S. I. H. Taqvi, C. Karaman, F. Karimi and E. Afsharmanesh, Chemosphere, 2022, 300, 134634 CAS.
- N. Qambrani, J. A. Buledi, N. H. Khand, A. R. Solangi, S. Ameen, N. S. Jalbani, A. Khatoon, M. A. Taher, F. Moghadam and M. Shojaei, Chemosphere, 2022, 303, 135270 CAS.
- J. A. Buledi, A. Hyder, N. H. Khand, S. A. Memon, M. Batool and A. R. Solangi, in Handbook Of Functionalized Nanostructured MXenes: Synthetic Strategies And Applications From Energy To Environment Sustainability, Springer, 2023, pp. 283–300 Search PubMed.
- Y.-n. Zhang, Q. Niu, X. Gu, N. Yang and G. Zhao, Nanoscale, 2019, 11, 11992–12014 CAS.
- J. A. Buledi, P. A. Buledi, M. Batool, A. R. Solangi, A. Mallah, S. Ameen, I. M. Palabiyik and H. K. Maleh, Appl. Nanosci., 2021, 11, 1889–1902 CrossRef CAS.
- M. Nawaz, H. Shaikh, J. A. Buledi, A. R. Solangi, R. Raza and B. Maher, J. Appl. Electrochem., 2023, 53, 751–764 CAS.
- A. F. Memon, S. Ameen, N. H. Khand, N. Qambrani, J. A. Buledi, B. Junejo, A. R. Solangi, S. I. H. Taqvi, E.-N. Dragoi and N. Zare, Chemosphere, 2022, 303, 135170 CAS.
- C. Saby, K. B. Male and J. H. Luong, Anal. Chem., 1997, 69, 4324–4330 CAS.
- M. Nawaz, H. Shaikh, J. A. Buledi, A. R. Solangi, C. Karaman, N. Erk, R. Darabi and M. B. Camarada, Carbon Lett., 2023, 1–14 Search PubMed.
- J. A. Buledi, H. Shaikh, A. R. Solangi, A. Mallah, Z.-u.-H. Shah, M. M. Khan, A. L. Sanati, H. Karimi-Maleh, C. Karaman and M. B. Camarada, Ind. Eng. Chem. Res., 2023, 62, 4754–4764 CrossRef CAS.
- J. Zolgharnein, T. Shariatmanesh and A. Babaei, Sens. Actuators, B, 2013, 186, 536–544 CAS.
- A. D. Chandio, A. H. Pato, I. A. Channa, S. J. Gilani, A. A. Shah, J. Ashfaq, J. A. Buledi, I. A. Chandio and M. N. B. Jumah, Sustainability, 2022, 14, 14562 CAS.
- A. Hyder, M. Thebo, D. Janwery, J. A. Buledi, I. Chandio, A. Khalid, B. S. Al-Anzi, H. A. Almukhlifi, K. H. Thebo and F. N. Memon, Heliyon, 2023, 9, 1–14 Search PubMed.
- J. J. A. Buledi, A. R. Solangi, A. Hyder, M. Batool, N. Mahar, A. Mallah, H. Karimi-Maleh, O. Karaman, C. Karaman and M. Ghalkhani, Environ. Res., 2022, 212, 113372 CAS.
- F. Belal, M. S. El-Din, F. Aly and M. El-Awady, Int. J. Pharm. Sci. Res., 2011, 2, 829 CAS.
- C. C. Okeke, Int. J. Pharm. Compd., 2007, 11, 302 Search PubMed.
- S. T. Hassib, M. A.-A. Mohammad, A. A. El-Zaher and E. F. El-Kady, J. AOAC Int., 2007, 90, 693–699 CrossRef CAS PubMed.
- S. Lacorte, P. Viana, M. Guillamon, R. Tauler, T. Vinhas and D. Barceló, J. Environ. Monit., 2001, 3, 475–482 RSC.
- E. Dabek-Zlotorzynska, H. Chen and L. Ding, Electrophoresis, 2003, 24, 4128–4149 CrossRef CAS PubMed.
- J. A. Buledi, N. Mahar, A. Mallah, A. R. Solangi, I. M. Palabiyik, N. Qambrani, F. Karimi, Y. Vasseghian and H. Karimi-Maleh, Food Chem. Toxicol., 2022, 161, 112843 CrossRef CAS PubMed.
- J. A. Buledi, Z.-u.-H. Shah, A. Mallah and A. R. Solangi, Curr. Anal. Chem., 2022, 18, 102–115 CrossRef CAS.
- Z. Lei, X.-K. Wan, S.-F. Yuan, Z.-J. Guan and Q.-M. Wang, Acc. Chem. Res., 2018, 51, 2465–2474 CrossRef CAS PubMed.
- L. Shang, S. Dong and G. U. Nienhaus, Nano today, 2011, 6, 401–418 CrossRef CAS.
- H.-T. Sun and Y. Sakka, Sci. Technol. Adv. Mater., 2013, 15, 014205 CrossRef PubMed.
- J. Li, W. Fu, J. Bao, Z. Wang and Z. Dai, ACS Appl. Mater. Interfaces, 2018, 10, 6965–6971 CrossRef CAS PubMed.
- Y. Guo, F. Cao, X. Lei, L. Mang, S. Cheng and J. Song, Nanoscale, 2016, 8, 4852–4863 RSC.
- Y. Lu, W. Wei and W. Chen, Chin. Sci. Bull., 2012, 57, 41–47 CrossRef CAS.
- V. Marjomäki, T. Lahtinen, M. Martikainen, J. Koivisto, S. Malola, K. Salorinne, M. Pettersson and H. Häkkinen, Proc. Natl. Acad. Sci. U. S. A., 2014, 111, 1277–1281 CrossRef PubMed.
- M. Homberger and U. Simon, Philos. Trans. R. Soc., A, 2010, 368, 1405–1453 CrossRef CAS PubMed.
- A. Sathya, T. R. Ravindran and J. Philip, J. Am. Ceram. Soc., 2018, 101, 483–491 CrossRef CAS.
- S. Palmal and N. R. Jana, Wiley Interdiscip. Rev.:Nanomed. Nanobiotechnol., 2014, 6, 102–110 CAS.
- H. Bakhsh, J. A. Buledi, N. H. Khand, B. Junejo, A. R. Solangi, A. Mallah and S. T. H. Sherazi, J. Food Meas. Char., 2021, 15, 2695–2704 CrossRef.
- J. A. Buledi, A. R. Solangi, A. Mallah, S. S. Hassan, S. Ameen, C. Karaman and H. Karimi-Maleh, Ind. Eng. Chem. Res., 2023, 62, 4665–4675 CrossRef CAS.
- K. P. Donegan, J. F. Godsell, D. J. Otway, M. A. Morris, S. Roy and J. D. Holmes, J. Nanopart. Res., 2012, 14, 1–10 CrossRef.
- A. D. Omrani, M. A. Bousnina, L. Smiri, M. Taibi, P. Leone, F. Schoenstein and N. Jouini, Mater. Chem. Phys., 2010, 123, 821–828 CAS.
- M. R. Ahghari, V. Soltaninejad and A. Maleki, Sci. Rep., 2020, 10, 12627 CrossRef CAS PubMed.
- S.-W. Huang, Y.-F. Lin, Y.-X. Li, C.-C. Hu and T.-C. Chiu, Molecules, 2019, 24, 1785 CAS.
|
| This journal is © The Royal Society of Chemistry 2025 |
Click here to see how this site uses Cookies. View our privacy policy here. 
 Open Access Article
 This Open Access Article is licensed under a Creative Commons Attribution-Non Commercial 3.0 Unported Licence
 *a,
Saima Q. Memonb,
Huma Shaikh
*a,
Saima Q. Memonb,
Huma Shaikh