DOI:
10.1039/D5RA02925B
(Paper)
RSC Adv., 2025,
15, 20792-20809
Graphene oxide–carbon nanotube-magnetite nanocomposites for efficient arsenic removal from aqueous solutions
Received
26th April 2025
, Accepted 6th June 2025
First published on 19th June 2025
Abstract
In this study, graphene oxide–carbon nanotube-magnetite (GO/CNT/Fe3O4) nanocomposites were synthesized via a co-precipitation method for wastewater treatment. The obtained results indicated that Fe3O4 nanoparticles exhibited a spherical-shaped morphology, with an average diameter of around 20 nm, and decorated the surface of GO and CNTs. The adsorption data fitted well with the Langmuir isothermal model, exhibiting a coefficient of R2 > 0.998, and the adsorption kinetics followed the pseudo-second-order model. This indicated that the adsorption mechanism involved surface complexation between adsorbents and As(III) ions rather than electrostatic interactions. The As(III) removal results also indicated that the GO/CNT/Fe3O4 nanocomposites exhibited a significantly enhanced adsorption capacity (qmax) of 128.5 mg g−1 compared with those of CNT/Fe3O4 (106.3 mg g−1) and GO/Fe3O4 (113.9 mg g−1) composites. In addition, GO/CNT/Fe3O4 nanocomposites exhibited the highest adsorption efficiency of up to 99.18%. The coexisting ions, such as phosphate and sulfate, showed a negligible influence on the adsorption of As(III) in solutions. The obtained results demonstrated that the GO/CNT/Fe3O4 nanocomposites could be promising candidates for the removal of arsenic and other contaminants from aqueous solutions.
1. Introduction
The development of heavy metal industries including mining, mineral extraction, oil refining, ceramics manufacturing, and industrial chemicals has resulted in significant heavy metal pollution in groundwater, surface water and land.1,2 Arsenic (As) is a widely distributed heavy metal, characterized as an exceptionally toxic and perilous contaminant that exerts significant adverse effects on public health, even at minimal concentrations.3 In light of the prevailing circumstances, it is essential to develop effective processes for the removal of As(III) from contaminated water sources. The methodologies employed in practice encompass chemical coagulation, precipitation, ion exchange, and adsorption. Among these, adsorption is widely preferred due to its cost-effectiveness, operational simplicity, and high removal efficiency compared to the higher costs and complexity of coagulation, precipitation, and ion exchange, making it suitable for wastewater treatment and environmental remediation.4 To remove heavy metal pollutants, many adsorbents, such as metal oxides, slags, clay minerals (zeolites), and charcoal/biochar, have been synthesized or considered for use.5,6 More recently, nanomaterial-based adsorbents have emerged as the most promising materials owing to their large adsorption surface area, more functional groups, and superior physicochemical properties.7,8 Various artificial adsorbents, such as activated carbon, iron and manganese oxides, zeolite, carbon nanotubes (CNTs), graphene (Gr) and graphene oxide (GO)-based materials, have been used to remove As(III) from aqueous solutions. Among the artificial adsorbents, carbon nanomaterials have been recognized as high-potential adsorbents with strong adsorption capacity owing to their large surface area, unique physical and chemical properties, and higher electrical and thermal conductivity.9–15 However, two-dimensional Gr and one-dimensional CNTs tend to agglomerate, leading to a reduction in surface area.16,17 Recently, some studies have been conducted to combine and prepare three-dimensional (3D) nanostructured materials of graphene and CNTs.18 The 3D structures of graphene with aerogels, sponges, and foams have been previously reported to have a higher specific surface area, resulting in a significantly higher adsorption capacity for heavy metals than those of 2D and 1D materials.19,20 To improve the adsorption recovery and recycling after adsorption, it is necessary to integrate these 3D materials with magnetic nanoparticles. Some previous studies demonstrated that Fe3O4 nanoparticles have gained interest in different areas including the field of environmental treatment due to their strong adsorption properties and the ability to separate from the environment upon completion of the adsorption reaction and reuse by the external magnetic field.21,22 However, Fe3O4 nanoparticles tend to aggregate and are susceptible to oxidation due to their small size, resulting in poor dispersion and reduced applications.23 Therefore, the hybridization or modification of the Fe3O4 surface could be a key issue to protect Fe3O4 nanoparticles from agglutination and thus improve their stability.24 In addition, the hybrid structure can exhibit a synergistic effect and improve the efficiency of the adsorption processes in solutions. Previous reports on Fe3O4 surface modification include the use of oleic acid to remove arsenic,24 thiol to remove toxic metals (Hg, Pb, and Cd),25 chitosan for Cu removal,26 humic acid to remove Hg, Pb, Cd, and Cu,27 GO foam to remove Cr(VI),28 graphene macroscopic for arsenic removal,29 GO and rGO to remove arsenic,30 GO/MWCNT/Fe3O4 to remove Cu(II) and MB,19 NH2-SH-GO/MWCNTs to remove Pb(II) and Zn(II),31 nanoporous carbon for arsenic removal,32 and porous carbon foam-combined GO to remove As(III) from solutions.33 To the best of our knowledge, there are currently no research groups focusing on the study of GO/CNT/Fe3O4 nanocomposites prepared by a co-precipitation method for As(III) removal.
Thus, the aim of this study is to prepare GO/CNT/Fe3O4 nanocomposites by a co-precipitation method and investigate their application for the removal of As(III) in solutions. The prepared nanocomposites were characterized by X-ray diffraction (XRD), transmission electron microscopy (TEM), SEM, Raman spectroscopy and FTIR spectroscopy. The As(III) adsorption capacity of these nanocomposite materials was investigated according to the contact time, initial concentration, solution pH and competing anions. In addition, the adsorption kinetic studies according to the Langmuir and Freundlich models, and adsorption isotherm models were also investigated to determine the maximum adsorption capacity of nanocomposites for As(III). Besides, the adsorption mechanism and reusability were studied. This study emphasizes the facile applicability of these materials in the removal and cleaning of environmental pollution.
2. Experimental
2.1. Chemicals and materials
GO with an average thickness and diameter of 3 nm and 1 μm, respectively, was produced using the Hummers process.34 CNTs with an average diameter of 50 nm and a purity >95% were supplied by Chengdu Organic Chemicals Co. Ltd, China. KMnO4, H2SO4 (98%), H2O2 (30%), FeCl3·6H2O, FeCl2·4H2O, Ethanol, HCl, HNO3 and NaOH were purchased from Xylong Chemical Co., Ltd, China. Sodium arsenite (NaAsO2, >98.5%) was supplied by Aladdin Chemical (Shanghai, China). An As(III) stock solution with a concentration of 1000 mg L−1 was prepared using deionized water with the pH adjusted to desired values with HCl or NaOH. All the chemicals were directly used without further purification.
2.2. Preparation of CNT/Fe3O4, GO/Fe3O4 and CNT/GO/Fe3O4 nanocomposites
The preparation processes of CNT/Fe3O4, GO/Fe3O4 and CNT/GO/Fe3O4 nanocomposites are shown in Fig. 1. CNTs with an average diameter of 50 nm (Fig. 2a) were functionalized with a carboxyl group (–COOH) via treatment in a mixture of acids (HNO3![[thin space (1/6-em)]](https://www.rsc.org/images/entities/char_2009.gif) :H2SO4, 1:3) at 70 °C for 5 hours under continuous magnetic stirring. A specific amount of GO (Fig. 2b) and functionalized CNTs were dispersed in distilled water to prepare the CNT and GO solution.
:H2SO4, 1:3) at 70 °C for 5 hours under continuous magnetic stirring. A specific amount of GO (Fig. 2b) and functionalized CNTs were dispersed in distilled water to prepare the CNT and GO solution.
 |
| | Fig. 1 (a) Scheme of the material synthesis steps of GO/Fe3O4, CNT/Fe3O4 and GO/CNT/Fe3O4. (b) Schematic of the synthesis of CNT/Fe3O4 (A), GO/Fe3O4 (B), and GO/CNT/Fe3O4 nanocomposite (C) for As(III) removal. | |
 |
| | Fig. 2 SEM images of (a) CNTs and (b) GO. | |
Nanocomposites were then synthesized by a chemical co-precipitation method. A specific amount of ferrous chloride (FeCl2·4H2O) and ferric chloride (FeCl3·6H2O) salts (weight ratio = 1/2) were dissolved totally in 200 mL solution containing GO or CNTs or a mixture of GO and functionalized CNTs in an ultrasonic bath for 30 minutes. After that, 200 mL solution of NaOH (1 M) was dropped slowly into the obtained solution, under continuous stirring at 80 °C for 5 hours. The GO/Fe3O4, CNT/Fe3O4 and GO/CNT/Fe3O4 nanocomposites were finally obtained by separating them from the solution using a magnetic bar, followed by washing several times with DI water and then drying in an oven at 50 °C. The Fe3O4 nanoparticles were also prepared under the same conditions to compare. Fe3O4, GO/Fe3O4, CNT/Fe3O4 and GO/CNT/Fe3O4 samples were labeled as FO, GOF, CNF and CNGF, respectively.
2.3. Characterization
The XRD patterns of the prepared samples were characterized using an X-ray diffractometer (Bruker D8 Advance, Bruker AXS, Germany). The morphology and the compositions of the samples were analyzed using a field emission scanning electron microscope (FESEM, Hitachi S4800) equipped with an energy-dispersive X-ray spectrometer (EDS). The functional groups of the materials were investigated using a UV-Vis spectrometer (Jasco-V770), a Fourier Transform Infrared (FTIR-6300) spectrometer and a Raman spectrometer (Xplore Plus – Horiba, Japan). The BET-specific surface areas (SBET) of samples were analyzed by N2 adsorption/desorption at 77 K (BET, Builder, SSA-4300).
2.4. Adsorption experiments
The As(III) adsorption experiment was conducted by mixing the Fe3O4, GO/Fe3O4, CNT/Fe3O4 and GO/CNT/Fe3O4 adsorbents with an As(III) solution in conical flasks. The effect of the solution pH on the As(III) adsorption was performed at 0.5 mg mL−1 of the adsorbent with 40 mL As(III) solution of 10 mg L−1 in a 100 mL flask. The pH was adjusted to suitable values with 0.1 M HCl and 0.1 M NaOH solutions. The solution was shaken at 150 rpm at room temperature in a shaker (MaxQ 4000 Benchtop, Thermo Scientific, USA) for 24 hours. After that, the solid and liquid phases were separated by an external magnetic field. The supernatant was filtered through a 0.22 μm filter. The As(III) concentrations were measured initially and after adsorption using an AAS (Hitachi, Z2000).
The adsorption equilibrium kinetic was investigated with an initial concentration of As(III) ranging from 5 mg L−1 to 300 mg L−1 and an adsorbent amount of 0.5 mg mL−1. The adsorption isotherms were calculated using the Langmuir and Freundlich models. The equilibrium adsorption capacity (qe, mg g−1) between the initial concentration (C0, mg L−1) and the equilibrium concentration (Ce, mg L−1) was determined using eqn (1) and the adsorption efficiency (Re) was determined using eqn (2):
| |
 | (1) |
| |
 | (2) |
where
m is the mass of adsorbents (
g) and
V is the volume of As(
III) solution (
L).
2.5. Regeneration and reusability tests
To evaluate the reusability of the FO, CNF, GOF, and CNGF adsorbents, regeneration experiments were conducted after each adsorption cycle. In the initial desorption tests, the As(III)-loaded adsorbents were washed with a 0.1 M NaOH + 0.01 M NaCl solution at room temperature under continuous stirring for 2 hours to desorb the bound As(III) species. After desorption, the materials were thoroughly rinsed several times with deionized water to remove residual desorbing agents and then dried at 50 °C before reuse. This alkaline desorption method was selected as a reference procedure to assess the regeneration efficiency compared to more environmentally friendly alternatives explored later in this study (see Section 3.6). Proper neutralization and disposal of the used regenerant solution were also performed following laboratory safety protocols.
3. Results and discussion
3.1. Effect of Fe content on the As(III) adsorption process
To investigate the effect of Fe(II) and Fe(III) contents on the As(III) removal process of CNTs, GO and CNT-GO and Fe3O4 composites, samples including 0.01, 0.03, 0.05, 0.07 and 0.09 mL of FeCl2·4H2O and FeCl3·6H2O were mixed with CNTs, GO and CNT-GO. The samples were then ultrasonically stirred to obtain a homogeneous solution. Fig. 3 shows the effect of Fe content on the As(III) removal efficiency of nanocomposite materials. The results showed that as the Fe content increased, the As(III) adsorption efficiency increased and then decreased. When the Fe concentration increased from 0 to 0.07 mol, the adsorption efficiency increased from 53.82% to 87.57% for CNF, from 71.06% to 94.18% for GOF, and from 76.31% to 97.42% for CNGF. This demonstrated that the As(III) adsorption efficiency of CNF, GOF and CNGF was significantly improved after modification with Fe and the CNGF composite material had the highest efficiency. However, when 0.09 mol Fe was added, the As(III) adsorption efficiency value decreased to 66.94%, 83.92% and 89.01% for the CNF, GOF and CNGF composite materials, respectively. This could be due to the excessive occupancy of iron oxide particles inside the composite materials, which prevents As from fully contacting the adsorption sites. Therefore, to achieve the best removal efficiency of As(III) ions in the solution, an Fe content of about 0.07 mol should be selected as the optimal condition for the following experiments.
 |
| | Fig. 3 Changes in the As(III) removal efficiency during the adsorption process of nanocomposites decorated with different Fe(II) + Fe(III) contents (pH = 7, m/v = 0.5 g L−1). | |
3.2 Characterization of Fe3O4, CNT/Fe3O4, GO/Fe3O4 and CNT/GO/Fe3O4
Fig. 4 shows the UV-Vis spectra of the GOF, CNF and CNGF nanocomposites before and after As(III) adsorption. For the GOF material, there are two characteristic peaks around 240 nm corresponding to the π–π* – shift of the aromatic C–C bond and a broad peak at 369 nm characterized by the surface plasmon resonance of Fe3O4 nanoparticles in solutions. For the GOF-As material, the characteristic peak shifted to 247 nm, which is believed to be due to the adsorption of As(III) on the surface of GOF. The CNF sample has a characteristic peak at 254 nm (the peak is shifted away from the value at 258 nm of CNT due to the formation of bonds with FO), which is attributed to the π → π* transition of the double bond system in the sp2 structure of CNTs, similar to graphene. After As(III) adsorption, the characteristic peak of the CNF-As sample shifted to 272 nm. For the CNGF sample, the characteristic peak at 240 nm represents an intermediate value when forming a composite between GO and CNT in solutions, and after As(III) adsorption, the peak shifted to 248 nm. These significant changes indicate the binding of As(III) on the surface of the GOF, CNF, and CNGF composites.
 |
| | Fig. 4 UV-Vis spectra of CNF, GOF, and CNGF nanocomposites before and after the adsorption experiment. | |
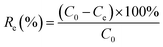
Fig. 5a1–d1 present the SEM images of the Fe3O4, GO/Fe3O4, CNT/Fe3O4, and GO/CNT/Fe3O4 nanocomposites before As(III) adsorption. The obtained results indicated that Fe3O4 nanoparticles exhibit a quasi-spherical morphology with a diminutive average diameter from 10 to 30 nm (Fig. 5a) and are remarkably well-distributed, firmly adhering to the GO sheets (Fig. 5b1), carbon nanotubes (CNTs) (Fig. 5c1), and the CNT/GO materials (Fig. 5d1). Furthermore, the SEM images reveal that the synthesized materials possess a porous architecture with the presence of numerous pores. Fig. 5d1 illustrates that the nanocomposites, comprised of the three constituents, exhibit a three-dimensional structure with robust interconnections among the GO, CNTs, and Fe3O4 nanoparticles. The incorporation of GO sheets and CNTs efficiently inhibits the aggregation of Fe3O4 nanoparticles. This structure provides the material especially beneficial for environmental remediation applications. Fig. 5a2–d2 show the SEM images of Fe3O4, GO/Fe3O4, CNT/Fe3O4, and GO/CNT/Fe3O4 nanocomposites after As(III) adsorption. As can be seen, the morphology of the samples is nearly the same as that of the as-prepared Fe3O4, GO/Fe3O4, CNT/Fe3O4, and GO/CNT/Fe3O4 nanocomposites. It is noted that Fe3O4 remains well-dispersed on the surface of CNTs and GO, confirming its stability even after multiple adsorption cycles and CNTs and GO retain their structure, enabling effective adsorption and reusability.
 |
| | Fig. 5 SEM images of the prepared samples before and after adsorption of (a1 and a2) Fe3O4, (b1 and b2) CNT/Fe3O4, (c1 and c2) GO/Fe3O4 and (d1 and d2) GO/CNT/Fe3O4 nanocomposites. | |
To further demonstrate the As(III) adsorption mechanism onto CNGF nanocomposites, the EDS spectra and elemental mapping of the prepared samples were conducted before, after adsorption, and after desorption. As presented in Fig. 6, the EDS spectra of the samples provided valuable insights into the surface composition, distribution of elements, and effectiveness of As(III) binding sites. These analyses complement the discussion on adsorption mechanisms by confirming the successful attachment of As(III) onto active adsorption sites and providing evidence for the formation of surface complexes. As the results are shown in Fig. 6a, before adsorption, the EDS spectrum of CNGF exhibits peaks corresponding to Fe (from Fe3O4), C (from CNT/GO), and O originating from functional groups (–OH, –COOH) and Fe3O4. After adsorption (Fig. 6b), a new peak corresponding to As appears in the EDS spectrum, confirming the successful adsorption of As(III) onto the CNGF composite. The relative intensity of oxygen (O) peaks increases, indicating the involvement of surface hydroxyl (–OH) groups in As(III) adsorption. The presence of As peaks confirms the direct binding of arsenic species to the adsorbent surface. The increase in oxygen content suggests that As(III) adsorption is facilitated through surface hydroxyl interactions via ligand exchange. The stable intensity of Fe peaks before and after adsorption indicates that Fe3O4 remains structurally intact, supporting its role in surface complexation rather than dissolution. The elemental mapping analysis of CNGF before and after adsorption indicated that Fe, C, and O are uniformly distributed. This demonstrated the well-integrated structure of Fe3O4 nanoparticles with GO and CNTs. The absence of As signals in the as-prepared CNGF confirms that the starting material does not contain any arsenic contamination. Meanwhile, after adsorption, the presence of As was confirmed. As can be seen, As was uniformly distributed throughout the composite, confirming that adsorption occurs over the entire material rather than in localized areas. Increased oxygen signal intensity in the elemental map suggests that hydroxyl (–OH) and carboxyl (–COOH) groups are involved in the adsorption process. No Fe leaching is observed, indicating that Fe3O4 remains intact and serves as a stable adsorption site. The uniform distribution of As suggests that the adsorption is not limited to specific active sites, but rather occurs throughout the composite via multiple interaction pathways. The increase in oxygen signal supports the involvement of ligand exchange mechanisms (Fe–O–As bond formation). The unchanged Fe signal reinforces the stability of Fe3O4, confirming that adsorption is dominated by surface interactions rather than dissolution-precipitation mechanisms. Fig. 6c shows the EDS spectra and elemental mapping of CNGF after desorption. As a result, the composition of the sample remained the same as that of the as-prepared CNGF. This demonstrated that the prepared sample can be reused for As(III) absorption.
 |
| | Fig. 6 EDS spectra and elemental mapping images of CNGF (a) before absorption and (b) after adsorption and (c) desorption of As(III). | |
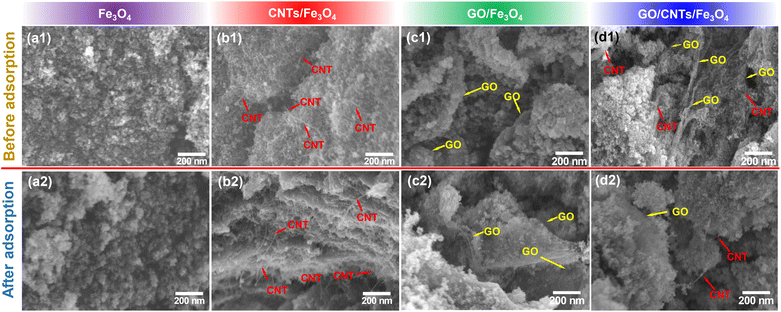
Fig. 7a displays the XRD patterns of Fe3O4, CNT/Fe3O4, GO/Fe3O4 and GO/CNT/Fe3O4 nanocomposites. The typical peaks associated with Fe3O4 nanoparticles at 2θ of 30.17°, 35.47°, 43.36°, 53.72°, 57.13°, and 62.68° correspond to the (220), (311), (400), (422), (511), and (440) planes, respectively, as specified in the JCPDS file, no. 65-3107,35 thereby validating the synthesis of the magnetic spinel nanocrystalline phase of Fe3O4 following the established standards. In comparison to the Fe3O4 sample, the XRD patterns of CNT/Fe3O4, GO/Fe3O4 and GO/CNT/Fe3O4 nanocomposites exhibited diminished intensity of the typical peaks of Fe3O4. This could imply that the Fe3O4 nanoparticles were mixed with GO and CNTs. In the CNT/Fe3O4 sample, an additional typical peak at 2θ of 26.83° corresponding to the (002) plane of CNTs was detected, confirming the presence of CNTs. Regarding the GO/Fe3O4 samples, in addition to the typical peaks of Fe3O4, a peak at a 2θ angle of 10.1° corresponding to the (001) plane was also detected, indicating the presence of GO. Meanwhile, the XRD pattern of GO/CNT/Fe3O4 nanocomposites encompassed all the typical peaks of Fe3O4, CNTs, and GO. The obtained results indicated the integration of the Fe3O4 nanoparticle constituents with GO and CNTs. Fig. 7b presents the magnetization hysteresis loops of Fe3O4, CNT/Fe3O4, GO/Fe3O4 and GO/CNT/Fe3O4 nanocomposites. The obtained results indicated that all samples exhibited supermagnetic characteristics with saturation magnetization (Ms) values of 58.8, 48.5, 46.3, and 41.3 emu g−1, respectively. Consequently, the magnetic attributes of the prepared nanocomposites can be ascribed to the presence of magnetite nanoparticles. The observed decrement in Ms for CNT/Fe3O4, GO/Fe3O4 and GO/CNT/Fe3O4 nanocomposites in comparison to Fe3O4 can be rationalized by the encapsulation of Fe3O4 nanoparticles with GO and CNT, which results in a reduction in the saturation magnetization. Nevertheless, the Ms of GO/CNT/Fe3O4 nanocomposites exhibited a substantial increase, rendering it appropriate for magnetic separation applications utilizing external magnets during the recovery phase (inset in Fig. 7b).
 |
| | Fig. 7 (a) XRD patterns and (b) magnetization curves of Fe3O4 (FO), CNT/Fe3O4 (CNF), GO/Fe3O4 (GOF) and GO/CNT/Fe3O4 (CNGF) nanocomposites. | |
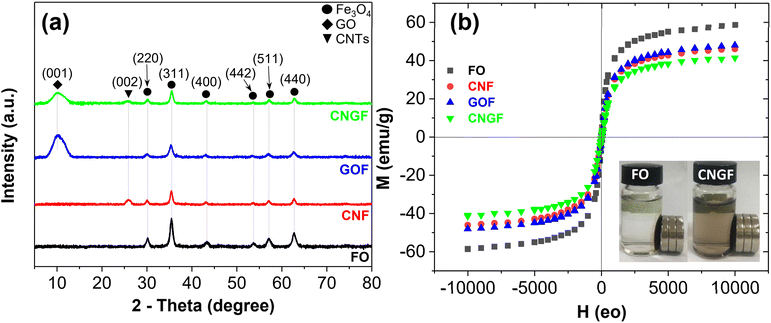
Fig. 8a and b presents the N2 adsorption/desorption isotherm curves and differential logarithmic pore size distribution of FO, GOF, CNF and CNGF samples. BET-specific surface area and total pore volume of FO, GOF, CNF and CNGF were obtained as 81.06 m2 g−1 and 0.286 cm3 g−1, 172.43 m2 g−1 and 0.364 cm3 g−1, 136.23 m2 g−1 and 0.301 cm3 g−1, and 212.68 m2 g−1 and 0.392 cm3 g−1, respectively. It is shown that all the CNF, GOF and CNGF materials after decoration with Fe3O4 nanoparticles exhibited a significantly higher BET surface area and total pore volume than Fe3O4, in which the composite materials of the three components, namely, CNTs, GO and Fe3O4, exhibited the largest surface area and pore volume. This is because when Fe3O4 nanoparticles are decorated on these materials, they produce more mesopores, which increases the heterogeneity of the adsorbent, leading to higher porosity.36 In addition, the significant increase in surface area and porosity for the CNGF nanocomposite can be attributed to the wrinkling change of the graphene sheets as well as the pillaring effect of CNTs and some graphene layers in the 3D structure.36 The porous structure and BET surface area characteristics of FO, GOF, CNF and CNGF are detailed in Table 1.
 |
| | Fig. 8 (a) Nitrogen adsorption–desorption isotherms and (b) differential logarithmic pore size distribution based on BJH, (c) FTIR and (d) Raman spectra of FO, GOF, CNF and CNGF samples. | |
Table 1 Surface parameters of FO, CNF, GOF and CNGF
| Material |
SBET (m2 g−1) |
Average pore diameter (nm) |
Total pore volume (cm3 g−1) |
| FO |
81.06 |
18.43 |
0.286 |
| CNF |
136.23 |
18.38 |
0.301 |
| GOF |
172.43 |
10.73 |
0.364 |
| CNGF |
212.68 |
11.90 |
0.392 |
FTIR spectroscopy was performed to determine the active and binding groups involved in the adsorption of As(III) onto the adsorbents as well as confirm that Fe3O4 nanoparticles were successfully decorated on the surface of CNTs, GO and CNT/GO. As can be seen in Fig. 8c, the broadband with a peak at 3424 cm−1 and a narrower peak at 2361 cm−1 were related to the O–H bonding stretching vibration through the –COOH functional group.37 After As(III) adsorption, both of these stretching vibrations were shifted with significantly reduced intensity for GOF-As, CNF-As and CNGF-As. The peaks at 1566 cm−1 and 1213 cm−1 were assigned to the C![[double bond, length as m-dash]](https://www.rsc.org/images/entities/char_e001.gif) C and C–O stretching vibrations of the aromatic ring, respectively.38 The peak at 1566 cm−1 increased significantly in intensity and was shifted due to As(III) adsorption to 1580 cm−1 for CNGF-As, 1569 cm−1 for GOF-As, and 1581 cm−1 for CNF-As. While the absorption peak at 1213 cm−1 was slightly shifted due to As(III) adsorption. The adsorption peak that appears at 1331 cm−1 can be attributed to the stretching vibration of COO.39 After the adsorption process of As(III), this peak also shifted slightly to 1336 cm−1. Compared with the FO spectrum, the curves of CNF, GOF and CNGF all have a characteristic peak at 576 cm−1, which can be attributed to the Fe–O stretching bond.40 In CNF-As, GOF-As and CNGF-As samples, the intensity of this characteristic peak was significantly reduced which could be related to the interaction of As(III) with the composite sample surface. Therefore, this infrared absorption spectrum is evidence of the adsorption of As(III) onto the surface of GOF, CNF and CNGF, and this result indicates that CNF, GOF and CNGF have been successfully synthesized.41
C and C–O stretching vibrations of the aromatic ring, respectively.38 The peak at 1566 cm−1 increased significantly in intensity and was shifted due to As(III) adsorption to 1580 cm−1 for CNGF-As, 1569 cm−1 for GOF-As, and 1581 cm−1 for CNF-As. While the absorption peak at 1213 cm−1 was slightly shifted due to As(III) adsorption. The adsorption peak that appears at 1331 cm−1 can be attributed to the stretching vibration of COO.39 After the adsorption process of As(III), this peak also shifted slightly to 1336 cm−1. Compared with the FO spectrum, the curves of CNF, GOF and CNGF all have a characteristic peak at 576 cm−1, which can be attributed to the Fe–O stretching bond.40 In CNF-As, GOF-As and CNGF-As samples, the intensity of this characteristic peak was significantly reduced which could be related to the interaction of As(III) with the composite sample surface. Therefore, this infrared absorption spectrum is evidence of the adsorption of As(III) onto the surface of GOF, CNF and CNGF, and this result indicates that CNF, GOF and CNGF have been successfully synthesized.41
To better understand the vibration modes and confirm the hybridization between CNTs, GO and CNT/GO and FO materials, Raman spectroscopy was performed. Fig. 8d shows the Raman spectra of FO, CNF, GOF and CNGF. Peaks appearing at 214, 275 and 384 cm−1 in FO, CNF, GOF and CNGF spectra were attributed to the Eg mode can confirm the success of the decorated FO and CNTs, GO, and CNT/GO. The peak located near 1273 cm−1 in FO spectra was assigned to second-order quadratic scattering of iron oxide, while the D band (at 1346 cm−1) and G band (at 1586 cm−1) peaks are attributed to E2g mode, the relative vibration of the atoms which the perpendicular vibration to the aromatic layers and the sketching vibration in the aromatic layers, respectively.42 After As(III) adsorption, there was no significant change in Raman peak position but there was a slight change in peak intensity. This showed that the Raman vibrational bands of the nanocomposite samples fabricated with GOF, CNF and CNGF were little affected by As(III) adsorption (Fig. 8d).
3.3. Adsorption studies
3.3.1. Effect of pH. The effect of the solution pH on the adsorption of As(III) by FO, CNF, GOF and CNGF at pH values of 2–10 is presented in Fig. 9. The results showed that the As(III) adsorption onto adsorbents depends on the pH of the solution. When the pH of the solution increases from 2 to 10, the As(III) removal efficiency increases significantly and when the pH reaches 6, the adsorption efficiency reaches the maximum value for FO and CNF, while GOF and CNGF reach maximum values in the range of pH 6–8, after which adsorption decreases. The As(III) adsorption capacity of the adsorbent materials increases in the order of FO < CNF < GOF < CNGF in the range of pH 5–10, which can be explained by the specific surface area of CNGF > GOF > CNF > FO (Table 1). At pH 6, the maximum As(III) removal efficiency of FO and CNF were 78.74% and 89.23%, respectively, while at pH 8, the maximum As(III) adsorption efficiency of GOF and CNGF reached 95.24% and 98.69%, respectively. The effect of pH on As(III) removal can be attributed to many competing factors, including attractive or repulsive gravity due to the electrostatic interaction between As(III) ions and the surface of adsorbents.43 The maximum As(III) adsorption occurs at pH 6–8, which correlates with a balance between As(III) species distribution and surface charge conditions. As can be seen from Fig. 9a, the As(III) removal efficiency increases slightly in the range of pH 2–6 possibly due to decrease in the electrostatic repulsion between the H+ in the solution and the positive positions on the adsorbent surface. At pH greater than 6 for FO and CNF, and greater than 8 for GOF and CNGF the slightly reduced adsorption efficiency is due to the repulsion between their negatively charged surface positions and (HO)2As–O−;44 meanwhile, the adsorption efficiency was kept constant in the pH range 6–8 for GOF and CNGF possibly due to the balance of the positive and negative charges on their surface (Fig. 9a). From the above observations, it can be seen that the As(III) adsorption mechanism of the graphene-based nanocomposite materials is controlled by the surface complexing between functional groups and As(III); the same thing is also observed in previous reports.45 In this study, pH 6 for FO and CNF and pH 7 for GOF and CNGF were chosen to conduct As(III) adsorption experiments. As(III) adsorption by the adsorbents depends on the pH of the solution, which can be explained by the point of zero charges (pHpzc) of the adsorbent (as shown in Fig. 9b). At a pH lower than the pH value of pHpzc = 6.78, 7.04, 7.71 and 8.18, the corresponding surfaces of FO, CNF, GOF and CNGF are positively charged, while the surface is negatively charged when the pH value > pHpzc (Table 2). As(III) exists in the nonionic (H3AsO3) form under pH < 9.2 conditions and adsorption occurs due to the electrostatic attraction between the positive positions on the adsorbent and the negative end of (HO)2As–O−–H+), while As(V) is the ionic form (H3AsO4) under pH < 2.2 conditions. Thus, it can be seen that the adsorption mechanism is dependent on both the pH of the solution and the ionization state of arsenic. In addition, the surface functional groups on the adsorbent can be protonated or de-carbonated depending on the pH of the solution.46
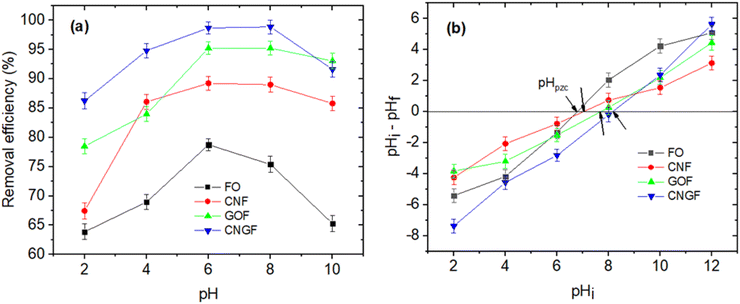 |
| | Fig. 9 (a) Effect of pH on As(III) adsorption onto FO, CNF, GOF and CNGF (0.5 g L−1, As(III) = 10 mg L−1, T = 298 K) and (b) dependence of ΔpH (pHi–pHf) on the initial pH (pHi) value of the adsorbent (2 g L−1 adsorbent, 25 mL of 0.1 M KCl solution, shaking in 24 h at room temperature). | |
Table 2 Point of zero charge (pHpzc) and surface charge of the adsorbents
| Adsorbent |
Point of zero charge (pHpzc) |
Surface charge at pH < pHpzc |
Surface charge at pH > pHpzc |
| FO |
6.78 |
+ |
— |
| CNF |
7.04 |
+ |
— |
| GOF |
7.71 |
+ |
— |
| CNGF |
8.18 |
+ |
— |
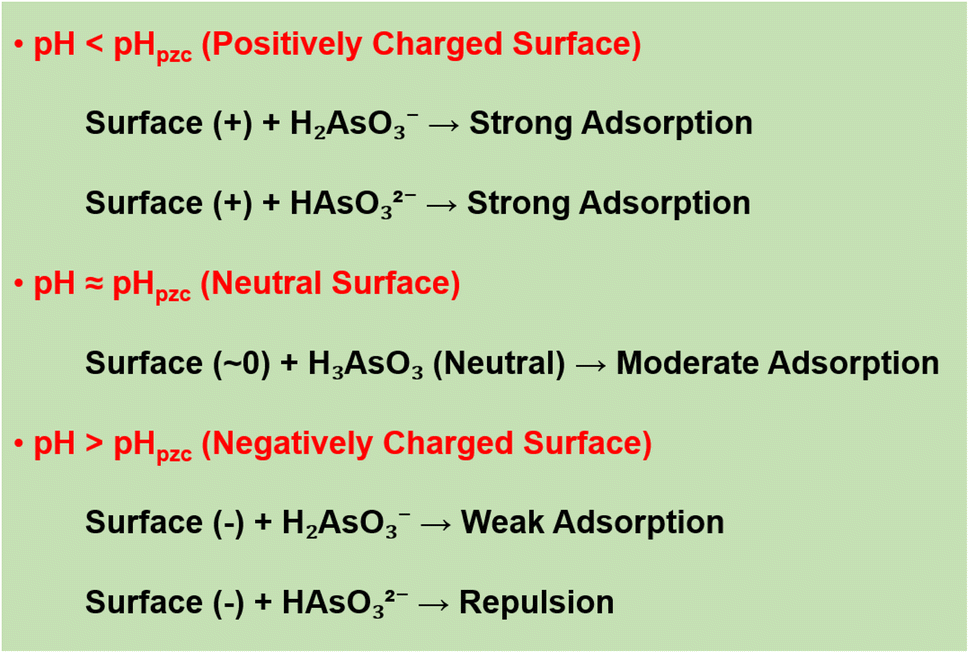
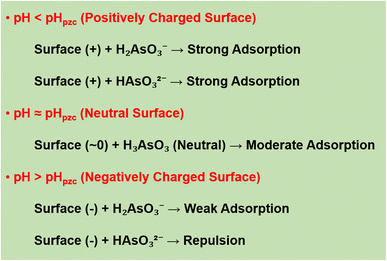
The results of the study indicated that the pH plays an important role in the adsorption of As(III) onto nanocomposite materials due to its effect on the surface charge of the material and the existence state of As(III) in the solution. Based on the results of determining the isoelectric point (pHpzc) of the materials (Table 2), the pHpzc value of CNGF ≈ 8.18, higher than that of single materials such as Fe3O4 (6.78) and GO/Fe3O4 (7.71). When pH < pHpzc, the material surface carries a positive charge, so it can interact strongly with As(III) anions such as H2AsO3−and HAsO32− through electrostatic attraction, helping to increase the adsorption efficiency. When pH ≈ pHpzc, the material surface is almost neutral, resulting in adsorption mainly based on chemical interactions and surface complexation instead of electrostatic attraction. When pH > pHpzc, the material surface becomes negatively charged, reducing the adsorption capacity of As(III) due to the electrostatic repulsion between the material surface and As(III) anions, especially HAsO32−. This result is illustrated in Fig. 10, which shows the change in surface charge of the material and the degree of As(III) adsorption at different pH values. The arsenic system in water has a change in its state of existence according to pH: (i) At pH < 9.2, As(III) exists mainly in the form of H3AsO3 (neutral), which tends to interact weakly with the material surface, leading to a slight decrease in adsorption efficiency. (ii) At pH > 9.2, As(III) exists in the form of H2AsO3− and HAsO32−, which can be adsorbed more strongly at low pH but is repelled from the material surface at high pH due to electrostatic repulsion. Based on the experimental results, the highest adsorption efficiency was achieved at pH 6–8, consistent with the prediction from the analysis of surface charge and the state of existence of As(III). At low pH (pH < pHpzc): adsorption mainly occurs due to charge interactions, when the positively charged CNGF surface can strongly bind to As(III) anions. (i) At neutral pH (pH ≈ pHpzc): adsorption interactions mainly rely on chemical complexation between As(III) and Fe–OH groups on the Fe3O4 surface. (ii) At high pH (pH > pHpzc): adsorption is strongly reduced due to electrostatic repulsion, making it difficult for As(III) to bind to the material surface. These conclusions are consistent with previous studies and are reinforced through surface charge measurements (Table 2) and schematic diagrams, illustrating the adsorption mechanism (Fig. 10).
 |
| | Fig. 10 Diagram depicting the interaction of As(III) species with the surface charge of adsorption materials at different pH values. | |
3.3.2. Adsorption isotherms and kinetic. To determine the maximum adsorption capacity of FO, CNF, GOF and CNGF for As(III), the adsorption isotherms were used. In this study, the adsorption isotherms of As(III) onto FO, CNF, GOF and CNGF samples were performed by mixing the adsorbents with the As(III) solution for 120 minutes at room temperature with the initial concentration of As(III) ranging from 5 to 300 mg L−1 at pH 6 for FO and CNF and at pH 7 for GOF and CNGF. Fig. 11 shows the adsorption isotherms of As(III) onto FO, CNF, GOF and CNGF.
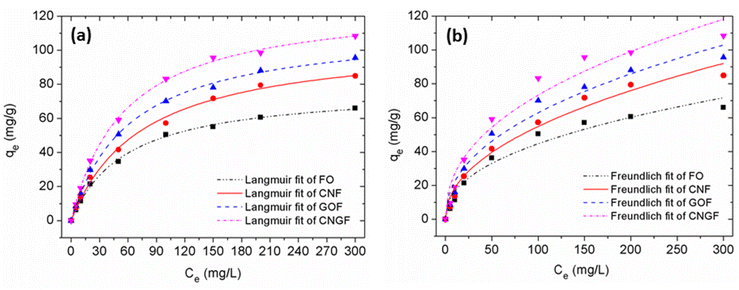 |
| | Fig. 11 Adsorption isotherm data of FO, CNF, GOF and CNGF based on the Langmuir (a) and Freundlich (b) models. | |
To correctly investigate the adsorption isotherm of FO, CNF, GOF and CNGF for As(III), two Langmuir and Freundlich adsorption models were used to fit the experimental data. These two absorption isotherm models are represented using eqn (3) and (4):
| |
 | (3) |
| |
 | (4) |
where
Ce (mg L
−1) and
qe (mg g
−1) are the concentration and adsorption capacity of As(
III) at equilibrium state,
qm (mg g
−1) is the maximum adsorption capacity of As(
III) and
kl (L mg
−1),
kf (L mg
−1), and 1/
n were constants.
Fig. 11 shows the fitting curves of the Langmuir and Freundlich models, and the isothermal constants calculated from the experimental data are presented in Table 3. The results show that the Langmuir model (R2 = 99.59%, 99.85%, 99.88% and 99.56%) was better fitting than the Freundlich model (R2 = 96.55%, 97.81%, 97.34% and 96.25%). The maximum adsorption capacities of FO, CNF, GOF and CNGF samples computed from the Langmuir model are 78.05 mg g−1, 106.31 mg g−1, 113.97 mg g−1 and 128.57 mg g−1, respectively. The qmax values found for CNGF materials are higher than those in almost all composites between GO/FO or CNT/FO reported to date.33,47–57 Table 4 compares the As(III) adsorption capacity achieved (qmax) with the different adsorbents involved. The results showed that the As(III) adsorption capacity by FO, CNF, GOF and CNGF materials increased with BET surface area and porosity. This fact suggests that As(III) ions are adsorbed onto the surface of FO, CNF, GOF and CNGF in the monolayer form and the adsorption mechanism is mainly due to the surface complexing between functional groups and As(III).48,58
Table 3 Parameters and correlation coefficients for the adsorption isotherms of Langmuir and Freundlich models for As(III) adsorption onto FO, CNF, GOF and CNGF
| Model |
Unit |
FO |
CNF |
GOF |
CNGF |
| Langmuir |
| qmax |
m g−1 |
78.05 |
106.32 |
113.97 |
128.57 |
| kl |
L mg−1 |
0.017 |
0.134 |
0.016 |
0.017 |
| R2 |
— |
0.9959 |
0.9985 |
0.9985 |
0.9988 |
|
| Freundlich |
| kf |
L mg−1 |
5.225 |
6.230 |
7.963 |
9.926 |
| 1/n |
— |
0.433 |
0.472 |
0.448 |
0.434 |
| R2 |
— |
0.9655 |
0.9781 |
0.9734 |
0.9625 |
Table 4 Comparison of the As(III) adsorption capacity of prepared samples to those of the adsorbents reported previously
| Adsorbent |
SBET (m2 g−1) |
pH |
qmax (mg g−1) |
Year |
Reference |
| Fe3O4-rGO |
117 |
7 |
13.1 |
2010 |
47 |
| M-GO |
— |
7 |
85 |
2016 |
48 |
| FeOx-GO-80 |
341 |
7 |
147 |
2017 |
49 |
| MGO |
— |
7 |
99.95 |
2019 |
50 |
| Fe3O4/GO-carbon foam |
— |
6 |
111 |
2020 |
33 |
| PNHM/Fe3O4-40 |
64 |
7 |
28.27 |
2020 |
51 |
| Starch-Fe3O4 |
— |
6 |
124 |
2018 |
52 |
| Fe3O4 |
— |
6 |
109 |
2018 |
52 |
| Fe3O4-rGO-MnO2 |
114 |
7 |
14 |
2012 |
53 |
| Ascorbic acid-Fe3O4 |
178.48 |
7 |
46.06 |
2012 |
54 |
| nFe3O4 |
100 |
5 |
66.53 |
2016 |
55 |
| GO/Ag Ch-PVA film |
— |
4 |
54.3 |
2024 |
56 |
| FeOx-GO-CS |
— |
3 |
61.94 |
2024 |
57 |
| GO + GFH hybrid |
— |
7 |
0.0226 |
2023 |
59 |
| Fe3O4@GO-EDA |
117 |
7 |
52.6 |
2022 |
60 |
| GO-MnO2-Goethite Alginate |
— |
4–6 |
27.53 |
2021 |
61 |
| FO |
81.06 |
6 |
66.7 |
— |
This work |
| CNF |
136.23 |
6 |
106.3 |
— |
This work |
| GOF |
172.43 |
7 |
113.9 |
— |
This work |
| CNGF |
212.68 |
7 |
128.5 |
— |
This work |
To further assess the efficiency of CNGF, its performance was compared with other reported As(III) adsorption materials (Table 4). CNGF achieved a maximum adsorption capacity (qmax) of 128.5 mg g−1 and an efficiency of 99.18% at pH 7 (Fig. 12b), outperforming materials such as Fe3O4-rGO (13.1 mg g−1, 2010),47 Fe3O4-rGO-MnO2 (14 mg g−1, 2012),53 and GO/Ag Ch-PVA film (54.3 mg g−1, 2024),56 while being comparable to the FeOx-GO-carbon foam (111 mg g−1, 2020),33 Fe3O4 (109 mg g−1, 2018),52 and starch-Fe3O4 (124 mg g−1, 2018).52 Although FeOx-GO-80 (2017) reported a slightly higher qmax value of 147 mg g−1,49 CNGF's superior efficiency and broader pH tolerance (pH 6–8, Fig. 9) enhance its practical applicability.
 |
| | Fig. 12 Effect of contact time on As(III) adsorption (a), removal efficiency (b) and adsorption kinetic curves (c and d) of As(III) onto FO, CNF, GOF and CNGF. | |
The enhanced adsorption capacity of CNGF is closely tied to its large BET surface area (212.68 m2 g−1, Table 1), which exceeds that of Fe3O4-rGO (117 m2 g−1)47 and Fe3O4/GO-carbon foams,33 providing more active sites for As(III). The 3D structure of CNGF, as shown in the SEM images (Fig. 5d1), prevents Fe3O4 nanoparticle agglomeration, improving site accessibility compared to 2D materials such as Fe3O4-rGO.47 Moreover, the synergy between GO and CNTs introduces π–π interactions and hydrogen bonding, complementing the surface complexation mechanism, which probably boosts its performance over single-component adsorbents like Fe3O4 or Starch-Fe3O4.52
Nevertheless, CNGF faces challenges from competing anions such as PO43−, a common limitation in Fe-based materials.62 Its hybrid structure, however, maintains a higher residual efficiency than FO (28.3%) or CNF (35.6%), underscoring the role of GO and CNTs. Additionally, CNGF's magnetic separability (Ms = 41.3 emu g−1, Fig. 7b) offers an advantage over non-magnetic materials such as GO/Ag Ch-PVA films.56 These attributes highlight CNGF as a promising material for As(III) removal in water treatment, combining high capacity, efficiency, and operational practicality.
To evaluate the adsorption capacity and equilibrium time, time-dependent As(III) adsorption experiments were conducted over a duration ranging from 5 to 180 minutes with the initial concentration of 10 mg L−1 at the optimal pH above. Fig. 12a shows the As(III) adsorption capacity of FO, CNF, GOF and CNGF as a function of the time variable. The results indicated that initially, the adsorption capacity increased rapidly in the range of 5–30 minutes of contact time due to the presence of a large number of active sites on the surface of the adsorbents. Over time, these active sites were filled with As(III) ions, causing the adsorption to slow down in about 30–40 minutes of exposure and remaining almost unchanged after 40 minutes. This is considered the time to reach the adsorption equilibrium of As(III) onto FO, CNF, GOF and CNGF. The results also show that the nanocomposites have a higher adsorption capacity than that of pure Fe3O4, especially the nanocomposites such as CNGF. This is because the CNF, GOF and CNGF materials contain functional groups on the surface that help them disperse better in solutions, increasing their adsorption capacity. The adsorption capacity of FO reached 14.76 mg g−1, while those of CNF, GOF and CNGF were 17.04 mg g−1, 18.51 mg g−1 and 19.60 mg g−1, respectively. The maximum adsorption efficiencies of FO, CNF, GOF and CNGF calculated according to eqn (2) are 74.29%, 85.93%, 93.41% and 99.18% (Fig. 12b), respectively. These results reflect the adsorption process correctly according to the results of the BET surface area and porosity of the above-mentioned adsorbents.
Adsorption kinetics is an important property representing the adsorption capacity of an adsorbent. It describes the relationship between the contact time to reach adsorption equilibrium on the surface of the solution and solids. The adsorption kinetics of As(III) onto FO, CNF, GOF and CNGF were investigated to clearly understand the adsorption properties of As(III) on the adsorbents. To investigate this adsorption mechanism, pseudo-first-order (PFO) and pseudo-second-order (PSO) models were given to fit the experimental data using eqn (5) and (6):
| | |
ln(qe − qt) = lnqe − k1t
| (5) |
| |
 | (6) |
where
qe and
qt are the adsorption amounts of As(
III) (mg g
−1) at equilibrium and time
t, respectively, and
k1 (min
−1) and
k2 (g mg
−1 min
−1) are the rate constants of PFO and PSO adsorption kinetic models, respectively.
Fig. 12c–d and Table 5 present the comparison of As(III) adsorption kinetic data of FO, CNF, GOF and CNGF for PFO and PSO models. The results indicate that, for the PFO model, high k1 values allow for fast adsorption, while for the PSO model, the k2 values are low, indicating a decreased adsorption rate. The R2 values for the PSO model are higher than those for the PFO model. Therefore, it shows that the PSO model is a better fitting than the PFO model.
Table 5 Adsorption kinetic model parameters of As(III) adsorption onto FO, CNF, GOF and CNGF
| Model |
Unit |
FO |
CNF |
GOF |
CNGF |
| PFO |
| qe |
mg g−1 |
14.36 |
16.22 |
17.54 |
18.71 |
| k1 |
g mg−1 × min |
0.128S |
0.187 |
0.229 |
0.274 |
| R2 |
— |
0.9707 |
0.9638 |
0.9678 |
0.9762 |
|
| PSO |
| qe |
mg g−1 |
15.39 |
17.28 |
18.57 |
19.67 |
| k2 |
min−1 |
0.013 |
0.019 |
0.023 |
0.028 |
| R2 |
— |
0.9902 |
0.9955 |
0.9956 |
0.9969 |
3.3.3. Thermodynamic analysis of As(III) adsorption. Temperature is one of the factors affecting the adsorption process of materials. The effect of temperature on the adsorption of As(III) by FO, CNF, GOF and CNGF composite materials was studied by varying the temperature in the range of 296 to 316 K, with a contact time of 120 min and pH 7, as illustrated in Fig. 13. The above-mentioned results showed that, when the temperature increased from 296 to 316 K, the adsorption capacity increased slightly from 14.01 to 15.54 mg g−1 for FO, from 16.48 to 17.24 mg g−1 for CNF, from 18.12 to 19.04 mg g−1 for GOF and from 19.26 to 19.63 mg g−1 for CNGF. This suggests that the adsorption of As(III) is an endothermic process, possibly due to the increase in porosity and total pore volume of the adsorbent, leading to an increase in the number of available active sites on the adsorbent as the temperature increases. However, the increase was not significant. A similar trend has also been observed in some previous studies.30,50–52
 |
| | Fig. 13 Linear fit of thermodynamic parameters for As(III) adsorption onto nanocomposites. | |
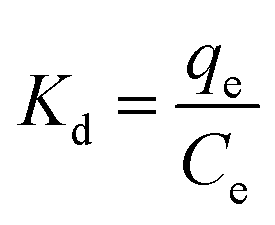
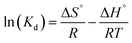
3.3.4. Thermodynamic analysis. Thermodynamic analyses were performed using temperature variations during the adsorption process at three different temperatures, i.e., 296, 306 and 316 K. Thermodynamic parameters including Gibbs free energy change (ΔG°), enthalpy change (ΔH°) and entropy change (ΔS°) were utilized to assess the feasibility and nature of the adsorption process. These parameters were calculated using the following equations:| |
 | (7) |
| |
 | (8) |
| | |
ΔG° = −RTln(Kd)
| (9) |
where R = 8.314 J mol−1 K−1 is the universal gas constant and T (K) is the temperature of the solution. Kd is the adsorption equilibrium constant, which is calculated by plotting lnKd (where Kd = qe/Ce) against Ce and extrapolating Ce to zero. ΔS° and ΔH° are determined from the intercept and slope of the lnKd versus 1/T plot. Fig. 13 shows the thermodynamic plot of As(III) binding to FO, CNF, GOF and CNGF composites. The As(III) adsorption capacities for FO, CNF, GOF and CNGF composites all increased with the increase in temperature and are presented in Table 6. This trend can be attributed to the increase in diffusion and the decrease in the viscosity of the medium. The positive ΔH° values for the composites indicate that the adsorption of As(III) onto FO, CNF, GOF, and CNGF is an endothermic process. This may be related to the preferential arsenate anion with the increase in temperature, replacing more water molecules. In addition, the positive ΔH° values of 8.03, 7.10, 16.37, and 22.87 kJ mol−1 for FO, CNF, GOF, and CNGF, respectively, may be due to the chemisorption process, which involves the dewatering of the metal atoms and the surrounding environment. The degree of freedom of the adsorbed arsenate increases when randomly located at the solid/solution interface, which means that the dewatering mainly occurs in the pore region and outside the iron oxide clusters of the nanocomposites. The adsorption of As(III) on FO, CNF, GOF and CNGF materials is a physical process because the enthalpy value is less than 40 kJ mol−1. The positive entropy value indicates the random collision of As(III) species on the surface of composite materials. At the same time, the value of ΔS° > 0 also reinforces that the adsorption occurs spontaneously with high affinity. Furthermore, the change in Gibbs free energy has a value of ΔG° < 0, and as the ambient temperature increases, ΔG° gradually decreases. This shows that the adsorption of As(III) onto the surface of composite materials becomes more favorable as the temperature increases. This is due to the higher susceptibility of ions to dehydration at high temperatures.
Table 6 Thermodynamic parameters for As(III) adsorption onto FO, GOF, CNF and CNGF
| |
T (K) |
ΔG° (kJ mol−1) |
ΔS° (J mol−1 K) |
ΔH° (kJ mol−1) |
| FO |
296 |
−3.88 |
13.13 |
8.03 |
| 306 |
−4.45 |
| 316 |
−5.22 |
| CNF |
296 |
−5.64 |
19.10 |
7.10 |
| 306 |
−6.19 |
| 316 |
−6.83 |
| GOF |
296 |
−7.55 |
25.59 |
16.37 |
| 306 |
−8.87 |
| 316 |
−10.28 |
| CNGF |
296 |
−10.50 |
35.55 |
22.87 |
| 306 |
−12.56 |
| 316 |
−14.29 |
3.5. Effect of competing anions
The presence of coexisting anions in natural waters, such as NO3−, Cl−, SO42−, PO43− and CO32− may compete with As(III) for adsorption sites, reducing the removal efficiency.62 The impact of these anions (1 mM) on As(III) adsorption by FO, CNF, GOF, and CNGF was investigated (Fig. 14). NO3− and Cl− ions exhibited minimal effects, slightly lowering the adsorption efficiency. Conversely, CO32−, SO42− and PO43− significantly reduced As(III) uptake, decreasing efficiencies from 76.6% to 28.3% (FO), 85.3% to 35.6% (CNF), 93.2% to 40.7% (GOF), and 99.1% to 45.4% (CNGF). The competitive order was PO43− > SO42− ≈ CO32− > Cl− ≈ NO3−, consistent with prior studies.62–64
 |
| | Fig. 14 Effect of anions on As(III) adsorption by FO, CNF, GOF and CNGF. | |
The pronounced inhibition by PO43− stems from its structural similarity to As(III), enabling strong inner-sphere complexation with FeO–OH groups on Fe3O4, competing directly with As(III).65 SO42− and CO32− form stable outer-sphere complexes, as evidenced by the weakened Fe–O peaks (576 cm−1) in the FTIR spectra post-adsorption (Fig. 8c).66 NO3− and Cl−, forming weaker outer-sphere complexes, exhibit negligible competition.63
To mitigate the interference of PO43− and SO42− on As(III) adsorption, several strategies exploiting the high BET surface area (212.68 m2 g−1, Table 1) and functional groups (–OH and –COOH; Fig. 8c) of CNGF are proposed. Surface functionalization with amine (–NH2) or thiol (–SH) groups enhances the As(III) selectivity, as demonstrated by ethylenediamine-functionalized GO-Fe3O4, which exhibited preferential As(III) binding over PO43− and SO42− through coordination interactions60 and thiol-modified adsorbents with improved specificity.25 Ionic molecular imprinting technology (IMIT) can generate As(III)-specific binding sites, reducing competition from PO43− and SO42−, as reported for imprinted Fe3O4-based composites.67 Adjusting the solution pH to 6–8, where the As(III) adsorption reaches 98.69% (Fig. 9a), minimizes interference by favoring the adsorption of neutral H3AsO3, while repelling negatively charged PO43− and SO42− from the negatively charged CNGF surface (pH > pHpzc = 8.18; Table 2).57 Pre-oxidizing As(III) to As(V) using oxidants or Fe-based materials enhances selectivity, as As(V) forms stronger complexes with Fe3O4, outcompeting PO43−.68 Additionally, pre-treating solutions to remove PO43− via ion exchange or calcium-based precipitation reduces competition, thereby improving the As(III) adsorption efficiency.69 These strategies exploit CNGF's physicochemical properties to enhance As(III) selectivity in anion-rich waters. Surface functionalization and pH adjustment are practical for large-scale applications, while IMIT offers high specificity for complex matrices. Future work should explore CNGF modifications with chelating polymers or imprinted sites to further suppress anion interference.67,70
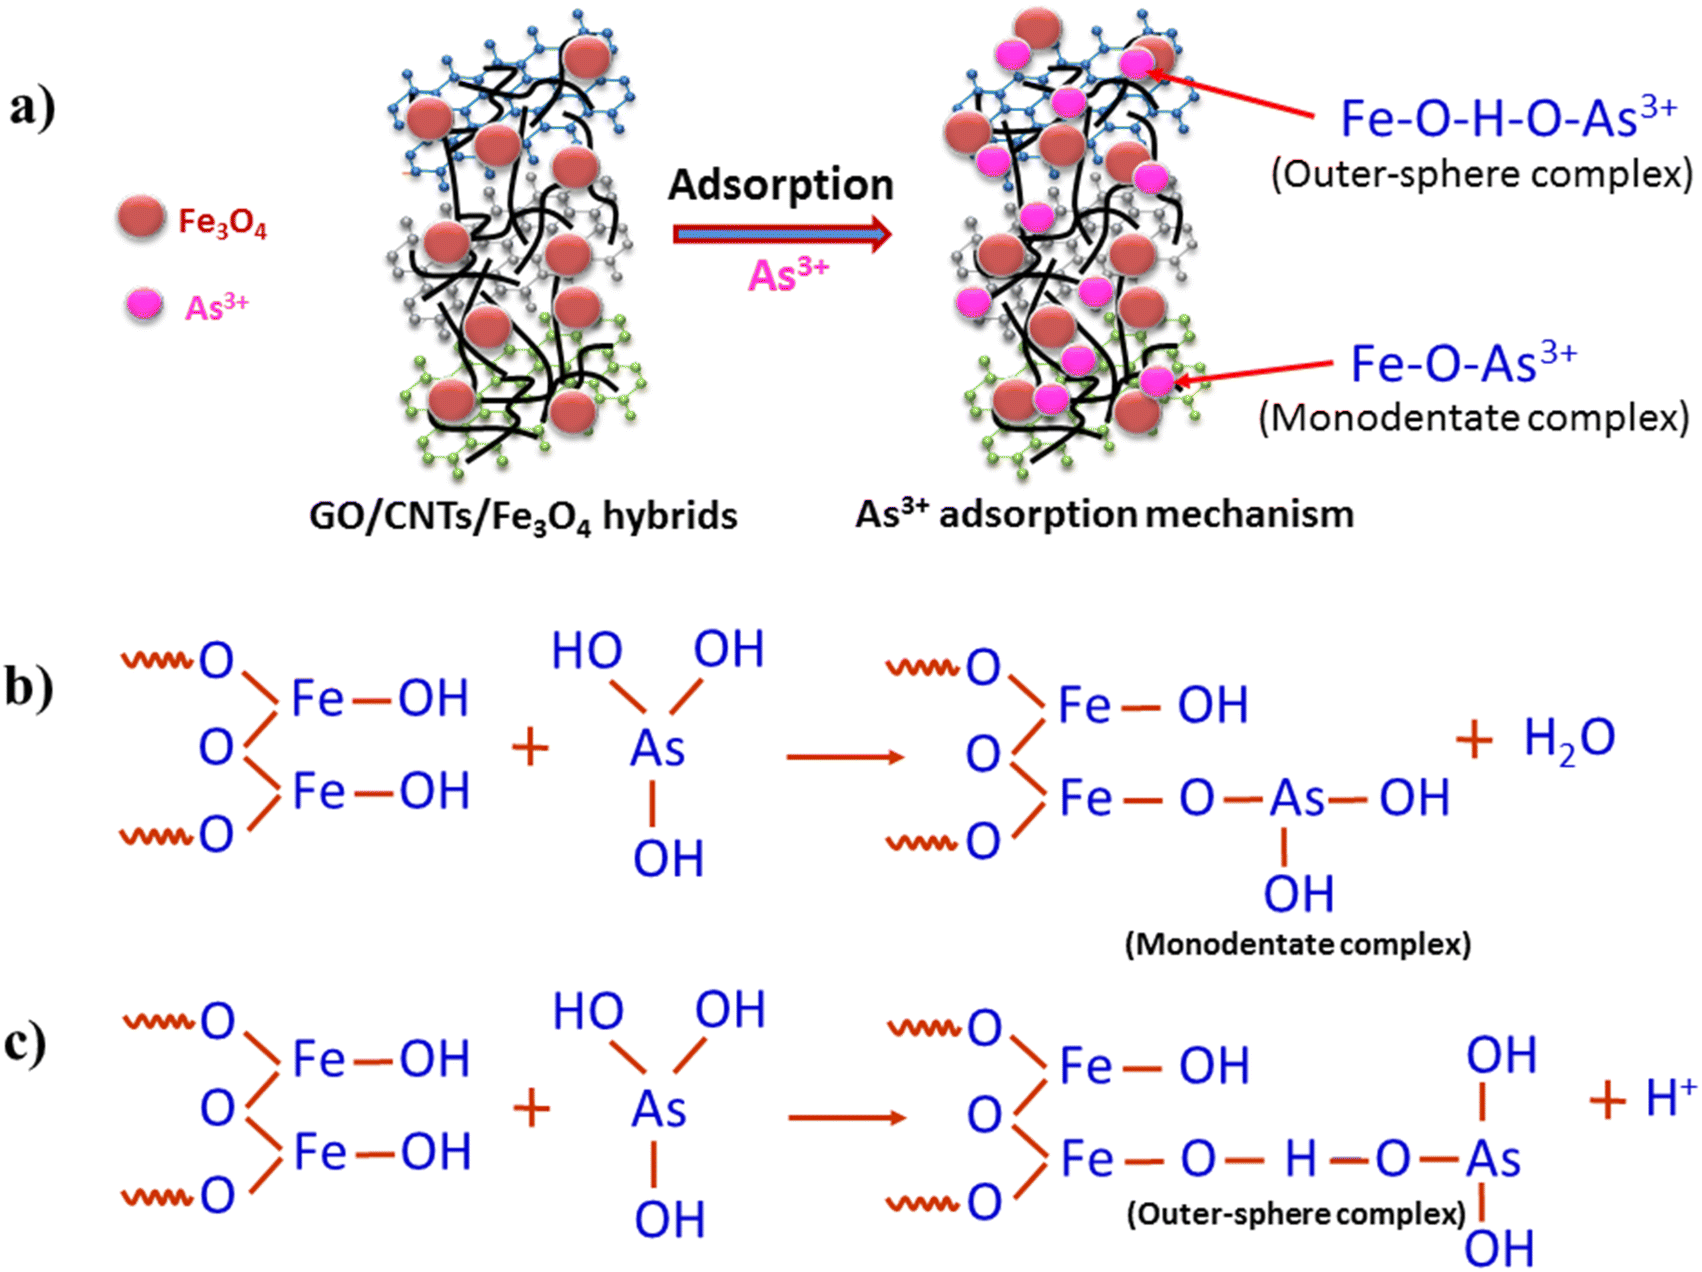
3.6. Proposed As(III) adsorption mechanism
It is well known that the oxygen-containing functional groups of the adsorbents are responsible for controlling the As(III) adsorption rate of GO, CNTs and CNT/GO-based materials.71 When combining them with Fe3O4, the adsorption of the nanocomposites was increased due to the added functional groups. When CNF, GOF, and CNGF nanocomposites are used to adsorb arsenic, it can happen through electrostatic attraction and ion exchange or by surface complexation.72 As analyzed above, As(III) exists in nonionic (stable neutral-H3AsO3) form under conditions of pH < 9.2,46,48 and as a result, the adsorption of As(III) onto CNF, GOF and CNGF due to electrostatic attraction is absent at this pH value. Numerous investigations have previously demonstrated increased adsorption amounts of As(III) within this pH range. Consequently, the adsorption of As(III) on these materials primarily results from the surface complexation.50,52,53,56
Fig. 15a presents the As(III) adsorption onto CNGF nanocomposites that occurs due to the surface complexation between the functional groups of CNGF and As(III) ions. According to48 and some previous reports,73 the As(III) adsorption occurs when the As(III) oxyanion complex with the surface –OH or –OH2 groups is in direct coordination with Fe3+ cations.48 As(III) adsorption occurs mainly due to the formation of a monodentate complex, in which an oxygen atom from As(III) oxyanion combines with a single Fe3+ structure on the Fe3O4 surface (Fig. 15b) or by formation an outer–sphere complex, in which the cation is bonded to the surface of the –OH or –OH2 groups through hydrogen bonds (Fig. 15c). In summary, the strong interaction between As(III) and Fe3O4 contributes greatly to the adsorption capacity of the prepared adsorbent materials to As(III) by the formation of the outer–sphere complex (with As3+–O–H–O–Fe bond) or monodentate complex (with As3+–O–Fe bond). This is further supported by the increase in oxygen signals (O peaks in EDS) and the presence of As throughout the composite in mapping images (Fig. 6).
 |
| | Fig. 15 Schematic of the proposed As(III) adsorption mechanism onto CNF, GOF and CNGF (a) surface complexation between the functional groups of CNGF and As(III) ions, (b) formation of a monodentate complex and (c) formation an outer–sphere complex. | |
Several other mechanisms can be considered. For example, (i) electrostatic interactions (pH-dependent adsorption). The surface charge of the adsorbent plays a crucial role in electrostatic interactions, particularly at different pH levels. pH < pHpzc (Point of Zero Charge): the material is positively charged, enhancing electrostatic attraction with anionic As(III) species (H2AsO3−, HAsO32−). pH > pHpzc: the material becomes negatively charged, leading to the repulsion of As(III) oxyanions, reducing the adsorption efficiency. pH 6–8 is the optimal pH range where adsorption is maximized due to a balance between electrostatic attraction and surface complexation. (ii) Hydrogen bonding. As(III), particularly in its neutral form H3AsO3, interacts with hydroxyl (–OH) and carboxyl (–COOH) groups on GO and CNTs. FTIR analysis shows shifts in –OH peaks after adsorption, confirming hydrogen bonding contributions and The increased oxygen signal in the post-adsorption mapping supports this mechanism. This mechanism enhances adsorption under neutral conditions and complements surface complexation. (iii) π–π interactions (CNTs and GO Contribution). CNTs and GO, rich in conjugated π-electron systems, promote π–π interactions with As(III) species. π–π stacking occurs between the aromatic structures of GO and As(III), facilitating additional adsorption pathways. CNTs further stabilize Fe3O4 nanoparticles, preventing aggregation and ensuring higher adsorption efficiency. This explains why CNGF shows higher adsorption capacity than CNF, as the presence of GO introduces additional adsorption sites. (iv) Effect of competing ions. Phosphate (PO43−), sulfate (SO42−), and carbonate (CO32−) can compete with As(III) for adsorption sites on Fe3O4. Phosphate has the strongest interference, as it forms similar Fe–O–P complexes, reducing As(III) adsorption. However, the presence of CNTs and GO mitigates this effect, as additional functional groups provide secondary adsorption sites. The possible mechanisms involved in As(III) adsorption by CNGF can be summarized (Table 7). However, the exact mechanism of As(III) removal is still unclear and requires further studies.49
Table 7 Possible mechanisms involved in As(III) adsorption by CNGF
| Mechanism |
Description |
Primary contributor |
Effect on adsorption |
| Inner-sphere complexation |
Direct Fe–O–As bond formation |
Fe3O4 |
Strong adsorption |
| Outer-sphere complexation |
H-bonding with –OH groups |
Fe3O4, GO |
Moderate adsorption |
| Electrostatic attraction |
Charge-based attraction |
Fe3O4 |
pH-dependent |
| π–π interactions |
π-electron interactions with As(III) |
CNTs, GO |
Enhances adsorption |
| Competing ions |
Interference from PO43−, SO42− and CO32− |
Fe3O4 |
Reduces adsorption |
These mechanisms can be further contextualized in light of recent comprehensive insights by Xie et al. (2024),74 who systematically reviewed the structure–activity relationship and mechanistic interactions in porous materials for radionuclide separation. Their analysis demonstrates that factors such as surface functional groups (e.g., –COOH, –OH, and –PO43−), pore size distribution and composite heterojunctions significantly influence the selective adsorption of radionuclides, including As species.
3.7. Regeneration study
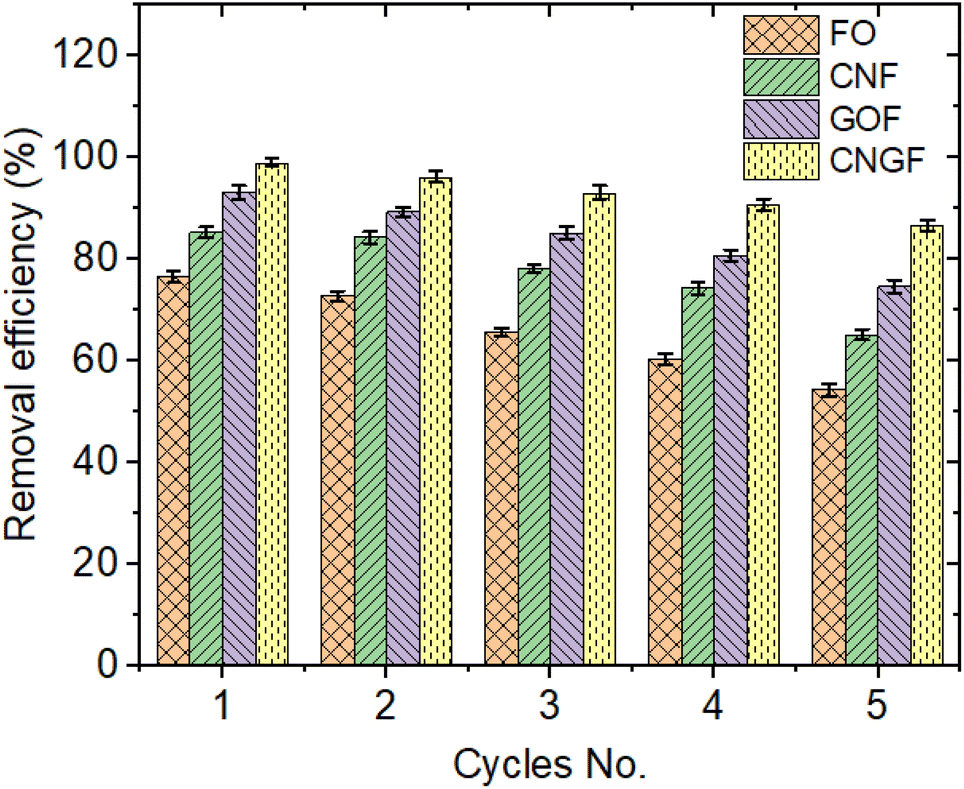
To evaluate their effectiveness in using the prepared adsorbents, we tested their recyclability in 5 cycles. Fig. 16 shows the regeneration of As(III) adsorption over 5 cycles for FO, CNF, GOF and CNGF. The results showed that the adsorption efficiency decreased slightly after 5 cycles for CNGF (reaching 86.7%), while the adsorption efficiencies for GOF, CNF and FO were 74.7%, 65.2% and 54.4%, respectively. This means that the As(III) adsorption capacity of FO, CNF, GOF and CNGF was lost by only about 22.2%, 20.1%, 18.5% and 11.7%, respectively, after 5 consecutive adsorption cycles. In addition to the NaOH/NaCl method proposed in Section 2.5, we examined a green and chemical-free regeneration approach using only hot or cold deionized water. Surprisingly, water-based regeneration showed comparable performance, especially for CNGF, indicating that strong acids, bases, or inorganic salts may not be necessary for practical reuse.75,76
 |
| | Fig. 16 Regeneration cycles of FO, CNF, GOF and CNGF in the removal of As(III). | |
This finding highlights the potential of CNGF for sustainable application in real-world water treatment systems, minimizing environmental risks associated with chemical desorption. Further optimization of temperature and water volume may enhance the desorption efficiency in future scale-up studies. Thus, it can be seen that CNGF nanocomposites have great potential in environmental treatment as well as the potential to be used as a stable adsorbent to treat As(III) effectively. While the NaOH + NaCl method demonstrated effective regeneration of the adsorbents, potential environmental concerns such as elevated pH and salt discharge should be considered. Neutralization and proper management of spent regenerants are required, and alternative green desorption strategies will be explored in future studies to enhance sustainability.
4. Conclusions
In summary, CNT/Fe3O4, GO/Fe3O4 and GO/CNT/Fe3O4 nanocomposites have been successfully prepared by a co-precipitation method to remove As(III) from the solution. The prepared nanocomposites demonstrated excellent removal capacity for As(III) from water, with CNGF achieving an efficiency of up to 99.18% and a maximum adsorption capacity of 128.5 mg g−1, outperforming many reported materials. The adsorption mechanism primarily involves complexation between the surface functional groups of CNGF and As(III) ions, with additional contributions from π–π interactions and hydrogen bonding due to the hybrid GO/CNT structure. The adsorption isotherms closely followed the Langmuir model (R2 = 0.9988), while the kinetics adhered to the pseudo-second-order model (R2 = 0.9969). As(III) interacts with CNGF to form monodentate or outer-sphere complexes, which constitutes the primary mechanism for the As(III) removal. The adsorption efficiency was significantly influenced by the presence of PO43− and SO42− anions, though CNGF's hybrid structure mitigated this effect better than single-component materials. With its high recyclability (11.7% efficiency loss after 5 cycles) and magnetic separability, the GO/CNT/Fe3O4 nanocomposite represents a promising candidate for environmental treatment applications, particularly for the effective removal of heavy metals such as As(III) from aqueous solutions.
Abbreviation
| GO | Graphene oxide |
| CNTs | Carbon nanotubes |
| FO | Fe3O4-magnetite |
| CNF | CNT-Fe3O4-carbon nanotube magnetite |
| GOF | GO-Fe3O4-graphene oxide magnetite |
| CNGF | CNT-GO-Fe3O4-draphene oxide–carbon nanotube-magnetite composite |
| BET | Brunauer–Emmett–Teller surface area analysis |
| SEM | Scanning electron microscopy |
| FTIR | Fourier transform infrared spectroscopy |
| pHpzc | Point of zero charge |
| ΔG° | Gibbs free energy change |
| ΔH° | Enthalpy change |
| ΔS° | Entropy change |
Data availability
The authors confirm that the data supporting the findings of this study are available within the article. Raw data that support the findings of this study are available from the corresponding authors, upon reasonable request.
Conflicts of interest
The authors declare no possible conflict of interests.
Acknowledgements
This research is funded by the Ministry of Education and Training of Vietnam under grant number B2024-SKH-04.
References
- M. Adnan, B. Xiao, M. U. Ali, P. Xiao, P. Zhao, H. Wang and S. Bibi, Ecotoxicol. Environ. Saf., 2024, 274, 116189 CrossRef CAS PubMed.
- M. Sheydaei, Geomicrobiol. J., 2024, 41, 213–230 CrossRef CAS.
- F. Gonzalez-Martinez, B. Johnson-Restrepo and L. A. Quinones, Toxicol. Lett., 2024, 398, 105–117 CrossRef CAS PubMed.
- M. Nazaripour, M. A. M. Reshadi, S. A. Mirbagheri, M. Nazaripour and A. Bazargan, J. Environ. Manage., 2021, 287, 112322 CrossRef CAS PubMed.
- G. A. Kloster, M. Valiente, N. E. Marcovich and M. A. Mosiewicki, Int. J. Biol. Macromol., 2020, 165, 1286–1295 CrossRef CAS PubMed.
- Q. Zheng, J. Hou, W. Hartley, L. Ren, M. Wang, S. Tu and W. Tan, Chem. Eng. J., 2020, 389, 124470 CrossRef CAS.
- S. Wang, H. Sun, H. M. Ang and M. O. Tade, Chem. Eng. J., 2013, 226, 336–347 CrossRef CAS.
- S. S. Kolluru, S. Agarwal, S. Sireesha, I. Sreedhar and S. R. Kale, Process Saf. Environ. Prot., 2021, 150, 323–355 CrossRef CAS.
- N. Mushahary, A. Sarkar, F. Basumatary, S. Brahma, B. Das and S. Basumatary, Results Surf. Interfaces, 2024, 15, 100225 CrossRef.
- R. Singh, M. S. Samuel, M. Ravikumar, S. Ethiraj and M. Kumar, Environ. Res., 2024, 243, 117830 CrossRef CAS PubMed.
- R. H. Krishna, M. N. Chandraprabha, K. Samrat, T. P. Krishna Murthy, C. Manjunatha and S. G. Kumar, Appl. Surf. Sci. Adv., 2023, 16, 100431 CrossRef.
- W. A. Al-Amrani and S. A. Onaizi, Sep. Purif. Technol., 2024, 343, 127018 CrossRef CAS.
- S. Singh, V. Chauhan and P. Barik, Curr. Nanomater., 2023, 10, 11–20 Search PubMed.
- H. Li, T. Li, T. Zhang, J. Zhu, W. Deng and D. He, Polymers, 2022, 14, 4951 CrossRef CAS PubMed.
- N. Van Hao, N. Van Dang, D. H. Tung, P. T. Tan, N. Van Tu and P. Van Trinh, RSC Adv., 2020, 10, 41237–41247 RSC.
- W. Yang, Z. Gao, J. Wang, J. Ma, M. Zhang and L. Liu, ACS Appl. Mater. Interfaces, 2013, 5, 5443–5454 CrossRef CAS PubMed.
- H. Gao, F. Xiao, C. B. Ching and H. Duan, ACS Appl. Mater. Interfaces, 2012, 4, 2801–2810 CrossRef CAS PubMed.
- F. Yang, A. Feng, C. Wang, S. Dong, C. Chi, X. Jia, L. Zhang and Y. Li, RSC Adv., 2016, 6, 16911–16916 RSC.
- Z. Long, Y. Zhan, F. Li, X. Wan, Y. He, C. Hou and H. Hu, J. Nanopart. Res., 2017, 19, 1–16 CrossRef CAS.
- C. Li and G. Shi, Nanoscale, 2012, 4, 5549–5563 RSC.
- M. Liu, Y. Ye, J. Ye, T. Gao, D. Wang, G. Chen and Z. Song, Magnetochemistry, 2023, 9, 110 CrossRef CAS.
- M. M. Ba-Abbad, A. Benamour, D. Ewis, A. W. Mohammad and E. Mahmoudi, JOM, 2022, 74, 3531–3539 CrossRef CAS.
- H. Zhang, X. Zhong, J. J. Xu and H. Y. Chen, Langmuir, 2008, 24, 13748–13752 CrossRef CAS PubMed.
- T. V. Thu and A. Sandhu, Mater. Sci. Eng., B, 2014, 189, 13–20 CrossRef CAS.
- W. Yantasee, C. L. Warner, T. Sangvanich, R. S. Addleman, T. G. Carter, R. J. Wiacek, G. E. Fryxell, C. Timchalk and M. G. Warner, Environ. Sci. Technol., 2007, 41, 5114–5119 CrossRef CAS PubMed.
- Y. C. Chang and D. H. Chen, J. Colloid Interface Sci., 2005, 283, 446–451 CrossRef CAS PubMed.
- J. F. Liu, Z. S. Zhao and G. Bin Jiang, Environ. Sci. Technol., 2008, 42, 6949–6954 CrossRef CAS PubMed.
- Y. Lei, F. Chen, Y. Luo and L. Zhang, J. Mater. Sci., 2014, 49, 4236–4245 CrossRef CAS.
- L. Guo, P. Ye, J. Wang, F. Fu and Z. Wu, J. Hazard. Mater., 2015, 298, 28–35 CrossRef CAS PubMed.
- Y. Yoon, W. K. Park, T. M. Hwang, D. H. Yoon, W. S. Yang and J. W. Kang, J. Hazard. Mater., 2016, 304, 196–204 CrossRef CAS PubMed.
- L. Jiang, C. Li, H. Yu, Z. Zou, F. Shen and X. Hou, Desalination Water Treat., 2017, 97, 272–284 CrossRef CAS.
- S. Joshi, M. Sharma, A. Kumari, S. Shrestha and B. Shrestha, Appl. Sci., 2019, 9, 3732 CrossRef CAS.
- X. Ge, D. Xie and Y. Zhang, New J. Chem., 2020, 44, 12926–12931 RSC.
- N. A. Nguyen, V. H. Nguyen, V. N. Pham, T. T. Le, V. T. Nguyen and V. T. Pham, Adv. Nat. Sci. Nanosci. Nanotechnol., 2021, 12, 035009 CrossRef CAS.
- Y. Zhan, R. Zhao, Y. Lei, F. Meng, J. Zhong and X. Liu, J. Magn. Magn. Mater., 2011, 323, 1006–1010 CrossRef CAS.
- J. L. Gomez-Urbano, J. L. Gomez-Camer, C. Botas, T. Rojo and D. Carriazo, J. Power Sources, 2019, 412, 408–415 CrossRef CAS.
- K. Deng, X. Liu, C. Li, Z. Hou and H. Huang, Anal. Methods, 2017, 9, 5509–5517 RSC.
- A. Baykal, M. Senel, B. Unal, E. Karaoğlu, H. Sözeri and M. S. Toprak, J. Inorg. Organomet. Polym. Mater., 2013, 23, 726–735 CrossRef CAS.
- T. Guo, C. Bulin, B. Li, Z. Zhao, H. Yu, H. Sun, X. Ge, R. Xing and B. Zhang, Adsorpt. Sci. Technol., 2018, 36, 1031–1048 CrossRef CAS.
- G. He, W. Liu, X. Sun, Q. Chen, X. Wang and H. Chen, Mater. Res. Bull., 2013, 48, 1885–1890 CrossRef CAS.
- M. Sharafeldin, G. W. Bishop, S. Bhakta, A. El-Sawy, S. L. Suib and J. F. Rusling, Biosens. Bioelectron., 2017, 91, 359–366 CrossRef CAS PubMed.
- V. H. Nguyen, H. T. Van, V. Q. Nguyen, X. Van Dam, L. P. Hoang, L. T. Ha and L. T. Ha, J. Chem., 2020, 2020, 3080612 Search PubMed.
- Q. Chang, W. Lin and W. chi Ying, J. Hazard. Mater., 2010, 184, 515–522 CrossRef CAS PubMed.
- D. Nandi, K. Gupta, A. K. Ghosh, A. De, S. Banerjee and U. C. Ghosh, J. Nanopart. Res., 2012, 14, 1–14 CrossRef.
- B. K. Kang, B. S. Lim, Y. Yoon, S. H. Kwag, W. K. Park, Y. H. Song, W. S. Yang, Y. T. Ahn, J. W. Kang and D. H. Yoon, J. Environ. Manage., 2017, 201, 286–293 CrossRef CAS PubMed.
- N. K. Asmel, A. R. M. Yusoff, L. Sivarama Krishna, Z. A. Majid and S. Salmiati, Chem. Eng. J., 2017, 317, 343–355 CrossRef CAS.
- S. Lunge, S. Singh and A. Sinha, J. Magn. Magn. Mater., 2014, 356, 21–31 CrossRef CAS.
- Y. Yoon, M. Zheng, Y. T. Ahn, W. K. Park, W. S. Yang and J. W. Kang, Sep. Purif. Technol., 2017, 178, 40–48 CrossRef CAS.
- H. Su, Z. Ye and N. Hmidi, Colloids Surf., A, 2017, 522, 161–172 CrossRef CAS.
- A. I. A. Sherlala, A. A. A. Raman and M. M. Bello, Environ. Technol., 2019, 40, 1508–1516 CrossRef CAS PubMed.
- S. Dutta, K. Manna, S. K. Srivastava, A. K. Gupta and M. K. Yadav, Sci. Rep., 2020,(10), 1–14 Search PubMed.
- G. Bisht and S. Neupane, Nanotechnol. Environ. Eng., 2018, 3, 1–14 CrossRef CAS.
- X. Luo, C. Wang, S. Luo, R. Dong, X. Tu and G. Zeng, Chem. Eng. J., 2012, 187, 45–52 CrossRef CAS.
- L. Feng, M. Cao, X. Ma, Y. Zhu and C. Hu, J. Hazard. Mater., 2012, 218, 439–446 CrossRef PubMed.
- S. L. Iconaru, R. Guegan, C. L. Popa, M. Motelica-Heino, C. S. Ciobanu and D. Predoi, Appl. Clay Sci., 2016, 134, 128–135 CrossRef CAS.
- A. A. Abd-Elghany, M. A. Ramadan, S. T. El-Wakeel, A. K. Alomari and E. A. Mohamad, Mater. Res. Express, 2024, 11, 055009 CrossRef CAS.
- Y. Liu, H. Shan, S. You, H. Mo and H. Zhan, Int. J. Biol. Macromol., 2024, 266, 131078 CrossRef CAS PubMed.
- V. Chandra, J. Park, Y. Chun, J. W. Lee, I. C. Hwang and K. S. Kim, ACS Nano, 2010, 4, 3979–3986 CrossRef CAS PubMed.
- A. K. Tolkou, E. C. Rada, V. Torretta, M. Xanthopoulou, G. Z. Kyzas and I. A. Katsoyiannis, C, 2023, 9, 10 CAS.
- A. A. Tabatabaiee Bafrooee, E. Moniri, H. Ahmad Panahi, M. Miralinaghi and A. H. Hasani, Res. Chem. Intermed., 2021, 47, 1397–1428 CrossRef CAS.
- H. Basu, S. Singh, M. Venkatesh, M. V. Pimple and R. K. Singhal, J. Water Proc. Eng., 2021, 42, 102129 CrossRef.
- X. Ge, Y. Ma, X. Song, G. Wang, H. Zhang, Y. Zhang and H. Zhao, ACS Appl. Mater. Interfaces, 2017, 9, 13480–13490 CrossRef CAS PubMed.
- L. Zhang, T. Zhu, X. Liu and W. Zhang, J. Hazard. Mater., 2016, 308, 1–10 CrossRef CAS PubMed.
- J. Zhu, S. A. Baig, T. Sheng, Z. Lou, Z. Wang and X. Xu, J. Hazard. Mater., 2015, 286, 220–228 CrossRef CAS PubMed.
- K. Yang, H. Peng, Y. Wen and N. Li, Appl. Surf. Sci., 2010, 256, 3093–3097 CrossRef CAS.
- M. Bhaumik, C. Noubactep, V. K. Gupta, R. I. McCrindle and A. Maity, Chem. Eng. J., 2015, 271, 135–146 CrossRef CAS.
- M. N. Pervez, W. He, T. Zarra, V. Naddeo and Y. Zhao, Water, 2020, 12, 733 CrossRef CAS.
- A. K. Tolkou, A. C. Mitropoulos and G. Z. Kyzas, Environ. Sci. Pollut. Res., 2023, 30, 73688–73701 CrossRef CAS PubMed.
- T. Sun, Z. Zhao, Z. Liang, J. Liu, W. Shi and F. Cui, Appl. Surf. Sci., 2017, 416, 656–665 CrossRef CAS.
- S. Bordoloi, R. Chetia, G. Borah and S. Konwer, J. Appl. Water Eng. Res., 2022, 10, 117–128 CrossRef.
- I. E. Mejias Carpio, J. D. Mangadlao, H. N. Nguyen, R. C. Advincula and D. F. Rodrigues, Carbon, 2014, 77, 289–301 CrossRef CAS.
- T. Wen, J. Wang, S. Yu, Z. Chen, T. Hayat and X. Wang, ACS Sustain. Chem. Eng., 2017, 5, 4371–4380 CrossRef CAS.
- B. C. Bostick, C. Chen and S. Fendorf, Environ. Sci. Technol., 2004, 38, 3299–3304 CrossRef CAS PubMed.
- Y. Xie, L. Yu, L. Chen, C. Chen, L. Wang, F. Liu, Y. Liao, P. Zhang, T. Chen, Y. Yuan, Y. Lu, B. Huang, H. Yang, S. Wang, S. Wang, L. Ma, F. Luo, Y. Liu, B. Hu, H. Wang, D. Pan, W. Zhu, N. Wang, Z. Wang, L. Mao, S. Ma and X. Wang, Sci. China Chem., 2024,(67), 3515–3577 CrossRef CAS.
- D. Wu, Y. Wang, Y. Li, Q. Wei, L. Hu, T. Yan, R. Feng, L. Yan and B. Du, J. Mol. Liq., 2019, 277, 181–188 CrossRef CAS.
- T. Liu, X. Han, Y. Wang, L. Yan, B. Du, Q. Wei and D. Wei, J. Colloid Interface Sci., 2017, 508, 405–414 CrossRef CAS PubMed.
|
| This journal is © The Royal Society of Chemistry 2025 |
Click here to see how this site uses Cookies. View our privacy policy here. 
 Open Access Article
 This Open Access Article is licensed under a Creative Commons Attribution-Non Commercial 3.0 Unported Licence
 *bc and
Nguyen Van Hao
*bc and
Nguyen Van Hao