 Open Access Article
Creative Commons Attribution 3.0 Unported Licence
Development and simulation of annular flow photoreactors: integration of light-diffusing fibers as optical diffusers with laser diodes†
Sergio
Carrillo De Hert
 a,
Rafael
Lopez-Rodriguez
 a,
Michael J.
Di Maso
 b,
Jonathan P.
McMullen
 b and
Steven
Ferguson
 *acd
*acd
aI-form, the SFI Centre for Advanced Manufacturing, School of Chemical & Bioprocess Engineering, University College Dublin, Belfield, Dublin, Ireland. E-mail: steven.ferguson@ucd.ie; Tel: +353 (0)1 716 1898
bProcess Research and Development, Merck & Co., Inc., Rahway, New Jersey 07065, USA
cNational Institute for Bioprocess Research and Training, Blackrock, Dublin, Ireland
dSSPC, The Science Foundation Ireland Research Centre for Pharmaceuticals, University College Dublin, Belfield, Dublin, Ireland
First published on 17th October 2024
Abstract
Continuous flow chemical photoreactors have emerged as a highly attractive platform, garnering considerable attention in both industry and academia. Utilizing thin channels, these reactors offer a promising solution for achieving more uniform irradiation in the reactor volume. While advancements have been enabled by the implementation of LEDs, significant limitations persist. These include managing the heat generated by light emitting diodes (LEDs), requiring proximity of electrical equipment and hot surfaces to flammable environments, ensuring operator safety amidst high levels of irradiating light, and addressing efficiency issues arising from irradiation of unintended areas, light scattering, and divergent photon emission. Herein, we introduce a novel approach that involves guiding photons emitted by a laser diode via total reflection optic fiber to an optical diffuser inside the reactor, specifically a light-diffusing fiber (LDF). This system capitalizes on the radial photon distribution capability of LDFs to irradiate the tubular annulus, enclosing all irradiation within it. The Continuous Annular Photoreactor (CAP-Flow system) effectively divorces photon generation from potentially explosive environments, enhancing safety, and operational convenience. The CAP-Flow system underwent testing via actinometry and a C–N coupling reaction across various flow rates and catalyst loadings. Our results found superior efficiency for the CAP-Flow system when compared to current LED configurations. The defined geometry, flow-field and photon absorption distribution facilitated mathematical modeling to de-convolute the reaction kinetics governing the photocatalytic process, offering valuable insights for optimizing operational parameters to enhance process understanding, productivity, and selectivity.
1. Introduction
Since the recent renaissance of radical chemistry,1 photocatalysis has re-emerged as a promising avenue for achieving clean and efficient transformations in the quest to address longstanding synthetic challenges. The widespread interest in photochemistry stems from its ability to grant access to unique reaction pathways and a broad range of substrates that remain unreactive under most chemical contexts. Photochemistry has the potential to reduce the number of processing steps while maintaining mild reaction conditions, avoiding hazardous redox reagents, and ensuring ambient temperature reaction conditions.2,3 The groundbreaking development of iridium and ruthenium chromophore complexes featuring bipyridine-type ligands, exhibiting remarkable light absorbance in the visible region and remarkably long excited state lifetimes,4,5 has synergistically aligned with the advancement of Light Emitting Diodes (LEDs),6 which offer narrow-band monochromatic light and long lifetime at a lower price for wavelengths beyond 365 nm compared to other light sources such as medium pressure mercury-vapour lamps or Xe arc lamps.7 However, the use of LEDs still poses significant challenges in photoreactor design, including heat generation, light scattering, and divergent emission. In this context, we introduce and evaluate a novel laser-driven annular tubular reactor, which addresses these challenges by using radial light emitting fibers, as optical diffusers to distribute photons within a closed reactor volume.One of the most crucial considerations in reactor design revolves around the phenomenon of light attenuation through a medium, which is quantified by the Beer–Lambert Law. This fundamental relationship allows calculation of the photon irradiance (Gλ) at any pathlength (![[small script l]](https://www.rsc.org/images/entities/char_e146.gif) ) if the irradiance at the emitting surface (Gλ,i) is known. For a specific photon wavelength (λ):
) if the irradiance at the emitting surface (Gλ,i) is known. For a specific photon wavelength (λ):
 | (1) |
Light attenuation plays a pivotal role in dictating the rates of photochemical reactions. As light penetrates deeper into the reaction mixture, it diminishes its intensity. This becomes specially pronounced in situations where the penetration depth is large or when the absorbing species are present in high concentrations. This phenomenon presents a significant challenge in scaling up these systems.
In systems where mass transfer processes, such as diffusion, are rate-limiting, light attenuation can intensify spatial variations in reactant concentrations. Regions closer to the light source receive higher photon fluxes, leading to faster reaction rates. However, due to limited mass transfer, these regions do not effectively mix with areas further from the light source, where lower photon fluxes result in slower reaction rates. This lack of mixing sustains the spatial heterogeneity of reactant and product concentrations, ultimately affecting the overall conversion efficiency at the reactor outlet.8–10
The desire for uniform photon irradiation has lead to a plethora of different flow photoreactor designs that rely on the use of microreactors with narrow transparent tubing, thus decreasing the total penetration depth and inhomogeneity.9,11,12 Flow photoreactors, due to their shorter pathlength, can allow more consistent product quality, process analytics, safe operation, easier scalability,12–15 and selectivity compared to batch processes.11,16 However, Elliott et al.14 showed that batch and flow modes provide similar productivity per Watt.
The utilization of light transmission elements in photoreactors has primarily been explored within the context of water treatment17–20 and the treatment of gaseous streams containing volatile organic compounds21 or carbon dioxide.22 These photoreactors have typically relied on UV lamps as light sources, which are efficiently absorbed by solid-supported TiO2 for heterogeneous photocatalysis. Despite UV lamps being cost-effective alternatives for wavelengths below 350 nm,1 coupling them with optic fibers for light transmission can be complex and inefficient. Examples of such diffusing elements include fused-silica rods,17 quartz rods,18 hollow tubes,19 and optic fibers.20–22
Light Emitting Diodes (LEDs) have become common photon source in photoredox catalysis because these have a relatively narrow emission band leading to more selective photochemical reactions23 by reducing the likelihood of exciting other reactants which can lead to competing chemical reactivities3,23 or solvent heating.23 LED lamps are frequently mounted within panels to externally illuminate transparent tubing. This set-up introduces inefficiencies, such as unintentional illumination of areas devoid of tubing (including sections without reagents) and light scattering off the surfaces of the tubing, as highlighted by Swierk.24 Furthermore, the beam angle or divergent emission of LEDs necessitates their close proximity to reactors, a factor that poses challenges in managing heat, particularly in environments where flammable solvents are utilized.25,26 This issue is further compounded by the need to place electrical equipment in close proximity to ATEX (Atmospheres Explosibles) areas, often unavoidable with LED systems. Additionally, the heat generated by LED lamps may adversely impact reaction selectivity. These concerns underscore the safety and operational challenges associated with LED-based photoreactors.
Laser technology offers several compelling advantages over LEDs. Notably, lasers produce highly monochromatic light with narrower spectral bands, enabling precise targeting of the photocatalyst's absorption band, leading to significantly higher conversion rates in photochemical reactions.27 The narrower band also reduces photon absorption by undesired species. Additionally, the low beam divergence of lasers ensures superior spatial control, minimizing photon loss by avoiding unintended areas of illumination. Moreover, employing optical fiber-coupled diode lasers offers several advantages beyond heat management. Firstly, it eliminates the need to position electrical equipment close to the photoreactor, enhancing safety by reducing the risk of ignition in proximity to flammable solvents. Additionally, this set-up has the potential to negate the requirement for ATEX solutions in production areas. Furthermore, the operational convenience of “pumping” photons generated elsewhere into the synthesis area streamlines processes may enhance overall operational ease. These benefits collectively contribute to improved temperature control, safety, and operational efficiency in photoreactor systems.
Despite these advantages, the adoption of lasers in photocatalysis has been limited due to a number of challenges. The restricted number of substrates that can be focused with a laser beam28 and the higher initial cost of laser systems have been notable barriers. However, recent efforts have addressed these limitations. For instance, Harper et al.26 utilized an adjustable lens coupled with a high-power 450 nm fiber-coupled laser, precisely irradiating the top of a Continuous Stirred-Tank Reactor (CSTR). Furthermore, Swierk24 conducted a comprehensive investigation comparing the cost per mole of photons and the external quantum yield (QY) for various reactor types and photon sources. The study showcased the laser-driven continuous CSTR as an outstanding performer, boasting the highest external quantum yield among all setups, surpassing others by a substantial margin.
The research by Swierk24 also shed light on the factors that affect the external quantum yield in flow photoreactors. The study identified potential contributors to photon loss, scattering, and suboptimal photocatalyst concentration. Despite the initial investment, there is compelling evidence that laser-driven photoreactors may prove more profitable in the long run, offering superior photochemical efficiency, reliability, convenience, safety and modularity.
In our study, we introduced a novel system termed CAP-Flow (Continuous Annular Photoreactor for Flow), which integrates a laser diode with an optical diffuser, specifically a light-diffusing fiber (LDF), within an annular photoreactor. The setup is described in detail in section 2. The LDF has the capability to radially disperse light emitted by a laser diode, which led us to hypothesize that they could potentially overcome the limitations associated with LEDs in continuous-flow systems. Section 3 presents the application of the LDF-powered photoreactor in the context of the photocatalytic C–N cross-coupling of 4-bromobenzotrifluoride and pyrrolidine, yielding 1-[4-(trifluoromethyl)phenyl]-pyrrolidine (see Fig. 1), which served as a model system. This reaction represents a broader class of reactions where an Ir(III) or Ru(II) photocatalyst activates a nickel cocatalyst, facilitating C–N bond formation.29 Notably, the adoption of this reaction by other researchers6,26,30 enables meaningful performance comparisons.
In section 4, we developed a mathematical model for the LDF photoreactor, the CAP-Flow system. This model offers the capability to estimate localized conversion at any radial and axial position within the reactor, as well as conversion at the outlet, provided the transport and kinetic properties of the reaction mixture are known. Alternatively, these properties can be estimated using the least squares method if experimental data is available, as demonstrated in section 5.1. Within this section, we not only validated our model but also extracted transport and kinetic parameters specific to the selected reaction, enabling the simulation of fractional conversion profiles. In section 5.2, the model for the CAP-Flow system was leveraged, utilizing parameters derived from experimental data, to simulate novel operational scenarios. This approach enabled the optimization of crucial factors such as flow rate and photocatalyst load, offering valuable insights into the system's performance under a variety of conditions.
2. Materials and methods
2.1. Architecture of the CAP-Flow system
The CAP-Flow system uses a Fibrance Light-Diffusing Fiber 2 (Corning Inc., New York, USA) with a diffusion length (LD) of 1 m to act as an optical diffuser to internally distribute photons within the CAP-Flow system. Light-diffusing fibers (LDFs) with LDs of 5 m and 10 m are also commercially available. These LDFs features a core diameter of 170 μm and an outer diameter of 230 μm.31 The LDFs are designed to effectively irradiate light throughout the wavelength (λ) range of 420 to 700 nm and are flexible, with a 10 mm bend radius. However, the power emitted by the LDF is not uniform along its length, diminishing gradually from the connector. Approximately 90% of the light is distributed radially throughout its length, with the remaining 10% scattered at the tip. The power emitted by the fiber (PLDF) as a function of distance from the connector (L) can be described by PLDF/PLDF,0 = 10−L/LD, where PLDF,0 is the power emitted at L = 0.31The LDF used was equipped with ferrule connectors (FC) at one end, while the polymer jacket is peeled, and the core is cleaved at the opposite end. The installation of the FC and cleaving was commissioned to Fibr8.com B.V (Breda, The Netherlands).
The LDF is connected to a fiber-coupled SC-500 Blue Laser (Fibr8.com B.V, the Netherlands) using an off-the-shelf FC/FC mating sleeve. The SC-500 Blue Laser, with a nominal optical output of 500 mW, emits photons at a wavelength of 447 nm. The laser is equipped with manual control functionality, allowing for adjustable power dimming (%Pd) as needed for experimental requirements. Power measurements at the outlet of the optic fiber for various %Pd settings were obtained using a thermal power sensor. The maximum power output achieved by our setup (%Pd = 100%) at the optic fiber outlet was 475 mW. Further details regarding different %Pd settings can be found in the ESI.†
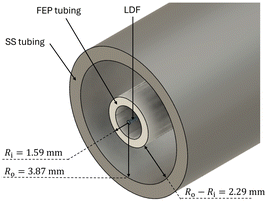
The CAP-Flow system utilized Stainless Steel tubing and fittings from Swagelok (Ohio, US), along with fluorinated ethylene propylene (FEP) tubing to shield the LDF from the reagents with the active annular reactor volume formed between the tubes. Fig. 2 presents a schematic of the cross-sectional area of the CAP-Flow system, highlighting the layers from the innermost to outermost:
• LDF: the light-diffusing fiber.
• FEP tubing: a protective layer of FEP tubing (VICI AG International, Switzerland) featuring internal and external diameters of 3.175 mm and 2.10 mm, respectively.
• SS Tubing: constructed with Butt Weld Stainless Steel-316/316 L, this tubing has external and internal diameters of 9.525 mm and 7.747 mm, respectively.
This concentric tube design not only ensures the safeguarding of the LDF within the CAP-Flow system but also creates an annulus through which chemical species can flow. Unlike many LED-powered photoreactor designs that employ plastic tubing in contact with the cooling/heating fluid, the stainless steel tube offers superior heat transfer capabilities. The size of the annulus can easily be adjusted by selecting internal and external tubing of different diameters. Simultaneously, it effectively encloses all irradiated light, preventing its escape to the exterior.
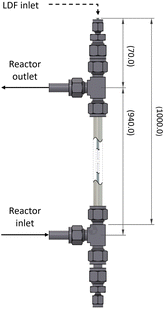
The dimensions, components employed, and inlet/outlet ports are further detailed in Fig. 3. To ensure complete filling of the reactor, it was positioned vertically during operation. The FEP tubing was securely affixed at both ends of the reactor with Swagelok polytetrafluoroethylene (PTFE) compression ferrules, ensuring optimal utilization of the available LDF by cutting the tubing as close as possible to the LDF inlet. The reactor's inlet-to-outlet distance measured 940 mm, while the space between the FC connector of the LDF and the reactor's outlet spanned 70 mm.
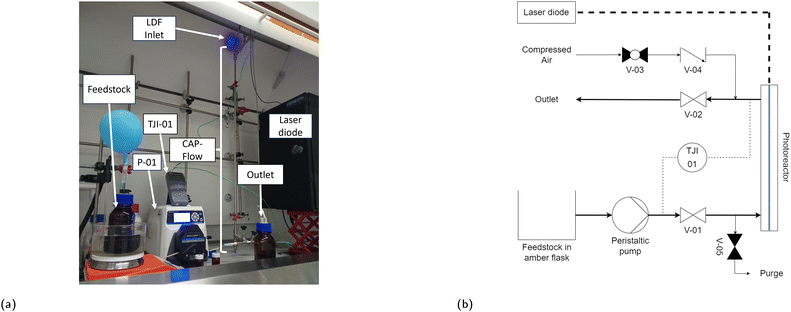
The utilization of off-the-shelf pipe connectors in this proof of concept introduced three notable disadvantages. Firstly, the tangential outlet of the CAP-Flow system aligns at L = 0.07 m, implying that the brightest 0.07 m of the LDF will not contribute to irradiating the species flowing through the annulus. The impact of this section could be reduced by using longer LDFs or by utilizing custom tubing connectors. Secondly, the CAP-Flow system features two dead volumes, one at the bottom and one at the top, which were disregarded during the proof of concept phase. Thirdly, as can be seen in Fig. 4a, some light escaped the CAP-Flow system at the LDF-inlet. At low power levels, this issue can be mitigated by simply covering this section with aluminium foil or employing other light-blocking measures.
The CAP-Flow system was positioned vertically to ensure vapour elimination during priming, as depicted in Fig. 4a. The process flow diagram, shown in Fig. 4b, illustrates the setup. Feedstock, contained in an amber flask on a heating plate, is pumped via a peristaltic pump P-01 (Masterflex L/S, Avantor Inc., Pennsylvania, USA) to the CAP-Flow system. Thermocouples connected to a Temperature Data Logger (TJI01, RS PRO 1384, Radionics Ltd., Ireland) were installed at the inlet and outlet of the reactor to monitor the temperature. Samples at given time intervals can be readily taken from the outlet of the CAP-Flow system. The compressed air and purge line were used to (while closing valves V-01 and V-02) to clean the reactor between trials.
2.2. Actinometry and thermal power measurements
The ferrioxalate actinometry protocol established by Hatchard and Parker32 was used to determine flow rate of photons (Fhv), the radiant flux of LDF in the CAP-Flow system (ϕCAP-Flow, in W) and the radiant flux of the whole LDF (ϕLDF). This actinometer methodology tracks the reduction of the photosensitive ferric ions (Fe3+) to ferrous (Fe2+), a reaction detailed in Rabani et al.33The Actinometry procedure involved pumping the actinometer solution at steady flow rate of 20 mL min−1, allowing three mean residence times before collecting the irradiated actinometer at the outlet of the CAP-Flow system. The experiments were performed across five different laser power levels (%Pd) ranging from 20% to 100% range, with the full outlined in the ESI.†
To evaluate the performance and energy losses of both the LDF and the CAP-Flow prototype, the power output of the transport cable (Po) was measured across various %Pd settings. This measurement utilized an S425C thermal power sensor and a PM100D power meter console (Thorlabs Inc., New Jersey, USA).
2.3. C–N coupling
| Material | C j [mol L−1] | Equivalents [−] |
|---|---|---|
| Fixed | ||
| 4-Bromobenzotrifluoride | 0.40 | 1.00 |
| Pyrrolidine | 0.60 | 1.50 |
| DABCO | 0.72 | 1.80 |
| NiBr2·3H2O | 0.02 | 0.05 |
| Variable | ||
|---|---|---|
| Ru(bpy)3(PF6)2 | 1.0 × 10⁻⁵ | 2.50 × 10⁻⁵ |
| 2.0 × 10⁻⁵ | 5.00 × 10⁻⁵ | |
| 8.0 × 10⁻⁵ | 20.0 × 10⁻⁵ | |
| 2.8 × 10⁻⁴ | 70.0 × 10⁻⁵ | |
The experiments were conducted with the heating plate temperature set to 30 °C. The procedure involved initiating the pump at the desired Q, filling up the CAP-Flow system, turning on the laser diode at %Pd = 100%, and waiting for three mean residence times (3·〈t〉) for steady-state operation to be achieved. No significant variations in conversion were found after 3·〈t〉 following attainment of steady-state (details in ESI†).
2.3.2.1. Spectroscopy. Absorbance spectra were acquired using a UV-1800 Spectrophotometer (Shimadzu, Japan) for all species, including the product (1-[4-(trifluoromethyl)phenyl]-pyrrolidine), dissolved in dimethylsulfoxide (DMSO). Among the species tested, only Ru(bpy)3(PF6)2 (the photocatalyst) and NiBr2·3H2O (the cocatalyst) exhibited absorption at the diode's wavelength (λ = 447 nm). Two types of experiments were performed.
1. Measurements for these two species were conducted at various concentrations (CPC and CNiBr2) in DMSO, using cuvettes of different pathlengths (![[small script l]](https://www.rsc.org/images/entities/char_e146.gif) ). The decadic molar absorptivity (ελ,j) for each species at 447 nm (ε447nm,PC and ε447nm,NiBr2) was estimated using analysis of variance (ANOVA) and the Beer–Lambert law: A447nm,j = ελ,j·Cj·
). The decadic molar absorptivity (ελ,j) for each species at 447 nm (ε447nm,PC and ε447nm,NiBr2) was estimated using analysis of variance (ANOVA) and the Beer–Lambert law: A447nm,j = ελ,j·Cj·![[small script l]](https://www.rsc.org/images/entities/char_e146.gif) .
.
2. Additionally, solutions with fixed feed concentrations (as presented in Table 1) were prepared, with CPC systematically varied for analysis for a fixed ![[small script l]](https://www.rsc.org/images/entities/char_e146.gif) . The ελ,j was obtained by plotting absorbance of each prepared solution A447nm as a function of CPC. The y-intercept is the absorbance of the constant feed matrix; while the slope represents the product ε447nm,PC·
. The ελ,j was obtained by plotting absorbance of each prepared solution A447nm as a function of CPC. The y-intercept is the absorbance of the constant feed matrix; while the slope represents the product ε447nm,PC·![[small script l]](https://www.rsc.org/images/entities/char_e146.gif) from which ε447nm,PC can be obtained.
from which ε447nm,PC can be obtained.
Additional details for both procedures can be found in the ESI.†
2.3.2.2. qNMR. The fractional conversion of 4-bromobenzotrifluoride (XA) was determined via quantitative proton nuclear magnetic resonance (1H NMR) analysis, employing peak comparison between 4-bromobenzotrifluoride and the product. This approach was compared against results obtained using an internal standard, revealing no significant difference. 1H NMR spectra were acquired using a VnmrS 400 MHz spectrometer (Varian Medical Systems Inc., California, USA). A detailed description of the entire procedure and method comparison can be found in the ESI.†
3. Results and discussion
3.1. Actinometry and thermal power measurements
The flow rate of photons (Fhv in einstein s−1), as measured by the actinometer, was analyzed in relation to the percent photodegradation (%Pd) through linear regression (refer to the ESI† for more details). This analysis resulted in the following equation: | (2) |
 | (3) |
| ΦCAP-Flow = 0.229 W·%Pd − 2.24 × 10⁻² W | (4) |
Fig. 5 illustrates the power measured at the outlet of the optic-fiber's FC with the thermal power sensor, alongside the radiant flux captured by the actinometer (ΦCAP-Flow) within the CAP-Flow system. At maximum power (%Pd = 100%), approximately 43.5% of the energy was captured by the actinometer.
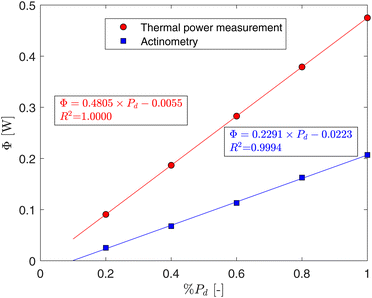 | ||
| Fig. 5 Power at the outlet of the transport optic fiber measured with the thermal power sensor and radiant flux captured by CAP-flow prototype as a function of the diode's dimmer setting. | ||
Certain power losses were anticipated due to the nature of the prototype design, notably the exclusion of the brightest 70 mm of the LDF. However, the theoretical radiant flux irradiated radially by the LDF (ΦLDF) along its entire diffusion length (LD = 1 m) can be estimated using the following integral:
 | (5) |
Additionally, 10% of energy is scattered at the tip of the LDF according to the manufacturer.31
The actinometry results provided crucial insights into the efficiency of our experimental set-up and prototype. By quantifying the radiant flux experimentally, we obtained essential data points for our simulations, enhancing the accuracy and reliability of our computational models.
3.2. C–N coupling
For solutions where only the concentration of the photocatalyst (CPC) varied while keeping the constant matrix from Table 1, linear regression analysis yielded a straight-line fit with a coefficient of determination (R2) equal to 0.999. The resulting molar absorptivity of the photocatalyst was determined to be ε447nm,PC = 1.458 × 10⁶ L mol−1 m−1 and the decadic absorption coefficient of the mixture  is described by:
 | (6) |
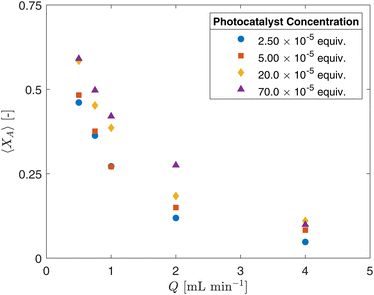 | ||
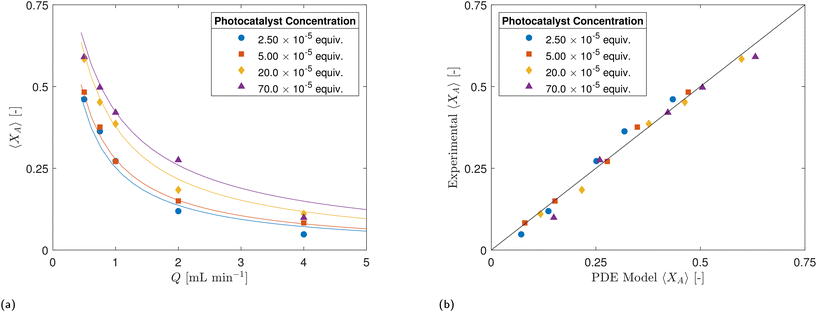
| Fig. 6 Fractional conversion XA as a function of flow rate Q for selected photocatalyst concentrations (CPC). | ||
While there appears to be a general trend suggesting that higher photocatalyst concentrations (CPC) result in higher conversion rates (XA) in Fig. 6, several factors need to be considered. The flow regime within the CAP-Flow system is laminar, this implies variations in the mean residence time across radial positions due to the velocity profile. Additionally, light attenuation caused by the presence of absorbing species translates into the reaction rate being dependent on the radial position. Without the presence of eddies or static mixing elements, only molecular diffusion helps homogenize the concentrations across the annulus. This complex interplay underscores the need for a sophisticated interpretation of results, which can be achieved through modeling, as discussed in section 4.
Recently, Swierk24 proposed the external quantum yield (QY) as a metric to evaluate the performance of photoreactors, which can be calculated by dividing the molar flow rate of the product (FP) at the outlet by the photon flow rate (Fhv). The former is determined as FP = Q·CA,0·XA, while the latter is obtained through actinometry.
The QY varied across different experimental conditions, due to the influence of the concentration of the photocatalyst (CPC) and the volumetric flow rate (Q) on the efficiency of the CAP-Flow system. However, when examining the average QY for each CPC, a discernible trend emerges. Table 2 illustrates this trend, showing that QY generally increases with CPC, providing an indication of CAP-Flow system's performance. This may be anticipated as for lower CPC values, more photons are able to pass through at the gap width and reach the wall of the annulus. A comparison with the QY reported by Swierk24 reveals that CAP-Flow system exhibits the second-best performance, surpassed only by laser-driven CSTR studies conducted by Harper et al.,26 which achieved a QY of 9.661. At high photocatalyst concentrations, the CAP-Flow system shows a QY similar to the 2.567 reported by Steiner et al.34 for the LED-driven Corning Advanced Flow G3 Photo Reactor, with values falling within the error bars. This noteworthy result was achieved despite the inherent limitations of our prototype's architecture and the use of off-the-shelf tubing and optic connectors.
| C PC [equiv.] | QY [mol einstein−1] |
|---|---|
| 2.50 × 10⁻⁵ | 1.51 ± 1.24 |
| 5.00 × 10⁻⁵ | 2.00 ± 0.35 |
| 20.0 × 10⁻⁵ | 2.98 ± 1.46 |
| 70.0 × 10⁻⁵ | 3.08 ± 1.07 |
The experimental results were also plotted in Fig. 7 as a function of the Absorbed Photon Equivalents (ηa,eq). Defined by Corcoran et al.,30ηa,eq represents the ratio of absorbed photons (in einstein s−1) and the molar feed of the limiting reagent (FA,0 = Q·CA,0, in mol s−1). Calculating ηa,eq involves multiplying the number of photons measured through the actinometer (Fhv) by the fraction of photons absorbed through the geometry, denoted by 1 − T, where T represents the fraction of photons transmitted to outer surface of the annulus. Mathematically, this is expressed as:
 | (7) |
 | (8) |
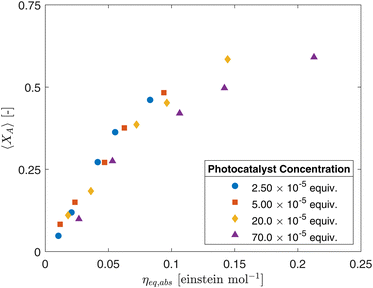 | ||
| Fig. 7 Fractional conversion (XA) as a function of absorbed photon equivalents (ηa,eq) for different photocatalyst concentrations (CPC). | ||
Table 3 provides the estimated fraction of non-absorbed or transmitted photons (T) for the trialed CPC. Notably, a significant portion of photons reaches the outer wall of the annular gap and the data presented in Table 3 suggests the potential for improvement if the surface of the inner Stainless tube could reflect photons. For instance, Louis De Canonville et al.35 measured the reflectance of mirror-finished polished stainless steel for various wavelengths, reporting approximately 60% of light reflected at 450 nm.
| C PC [equiv.] | T [−] |
|---|---|
| 2.50 × 10⁻⁵ | 0.757 |
| 5.00 × 10⁻⁵ | 0.705 |
| 20.0 × 10⁻⁵ | 0.461 |
| 70.0 × 10⁻⁵ | 0.111 |
Despite the seemingly strong correlations, ηa,eq failed to fully collapse the data for different CPC, this is more notable for higher photocatalyst concentrations and conversions. This discrepancy highlights the complexity of the system and the limitations of the current modeling approaches and metrics within literature. The concentration heterogeneity arising from differences in irradiation and velocity profiles within the CAP-Flow system is a critical factor that needs to be addressed. These variations in concentration profiles can significantly impact the overall conversion rates.
To overcome these limitations and accurately predict the effects of different process parameters such as photocatalyst concentration (CPC) or volumetric flow rate (Q), more advanced modeling techniques are required. The models should account for the intricate interplay between various parameters, including fluid dynamics, mass transfer phenomena, light distribution and reaction kinetics. By incorporating these factors into the modeling framework, we may also gain deeper insights into the underlying mechanisms governing the photochemical reactions. This will enable us to optimize the system design and operating conditions for enhanced performance and efficiency, as discussed further in section 4.
4. The CAP-Flow system model
The concentric cylinder geometry of CAP-Flow system is very well-known to Chemical Engineers and many of the tools for modeling the system have been previously derived. If we assume isothermal conditions, negligible axial and azimuthal diffusion, steady-state, and no entrance effect or lateral mixing, the mass balance for a reagent, A, is expressed by the following partial differential equation (PDE): | (9) |
4.1. Velocity profile
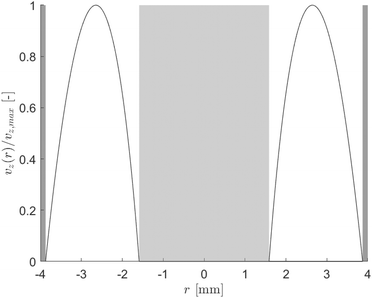
The flow regime within the CAP-Flow system is predominantly laminar, with a transitional regime expected for Reynolds numbers (Re) exceeding 2100. Based on the geometry and materials used for the C–N coupling, this transition is anticipated to occur for flow rates exceeding 1340 mL min−1 (Q > 1340 mL min−1). Additionally, Residence Time Distribution (RTD) experiments were conducted to assess the flow characteristics. These experiments revealed a close correlation between the experimental first appearance time and the theoretical value expected for laminar flow through an annular gap. Further details on these experiments are available in the ESI.†The expression for vz(r) for laminar annular flow is described by Bird et al.36 by the equation:
 | (10) |
 | (11) |
The maximum velocity can be calculated using the following expression:
 | (12) |
4.2. Reaction kinetics
The CAP-Flow system, characterized by its well-defined geometry and photon irradiation fields, lends itself to adopting a rigorous kinetic approach akin to that employed by other researchers.8,38,39 These authors have effectively coupled reaction kinetics with flow and irradiation fields, a methodology equally applicable to the CAP-Flow system.The wavelength-specific rate of reaction (rλ,A) is commonly described by zero-order kinetics:
| rλ,A = ϕλ·eaλ,j | (13) |
The pseudo-zero-order rate law effectively describes kinetics in scenarios characterized by low conversions and when the reagents, rather than the photocatalyst, acts as the absorbing species.8,38,39 However, when utilizing a chromophore photocatalysts, the LVPRA becomes independent of conversion. Consequently, the pseudo-first-order kinetic approach becomes inadequate in such cases, as it has the potential to predicting fractional conversions exceeding unity.
Till et al.29 proposed a comprehensive catalytic cycle for photoredox C–N Cross Coupling, revealing the inherent complexity of the reaction mechanism. The utilization of pyrrolidine as a reagent further complicates the process. In their experiments, pyrrolidine served as the amine, and intriguingly, they observed ϕλ > 1. Moreover, the reaction rate with pyrrolidine was remarkably 16 times higher than with hexylamine, while other factors remained constant. Given the complexity of these reactions, the authors refrained from attempting to derive a rate law directly from the proposed reaction mechanism, opting instead to fit their high conversion data—referring to data points obtained at levels of reaction conversion beyond the range where the assumption of pseudo-first order kinetics applies—to a first-order kinetic model. This decision was made to ensure accurate modeling and analysis, recognizing that traditional pseudo-first order kinetics may not be applicable at higher conversion rates where non-linear relationships between reactant concentration and time become evident.
A first-order kinetic approach was used to fit the data published by several authors that investigated the C–N coupling of 4-bromobenzotrifluoride and pyrrolidine at high conversion rates.6,26,29,30 This analysis aimed to confirm the suitability of a first-order kinetic model approach. Details of the regression exercise can be found in the ESI,† demonstrating that the first-order kinetic approach adequately describes the progress of the C–N coupling photoredox reactions investigated by Lévesque et al.,6 Till et al.,29 Corcoran et al.,30 and Harper et al.26 These fits suggest that the first-order reaction kinetics proposed by Till et al.29 provide a robust framework for characterizing the kinetics of C–N photoredox coupling reactions. Therefore, the general form of the first-order kinetic model in terms of the LVRPA and ϕλ can be represented by the following equation:
| rλ,A = ϕλ·k·eaλ,PC·CA | (14) |
Here, the kinetic constant k is introduced for dimensional consistency, and its units are m3 mol−1 and eaλ,PC refers to the LVRPA of the photocatalyst.
4.3. Photon irradiance and LVRPA
The LVRPA is a function of the irradiance to which the photocatalyst is exposed. The irradiance within the CAP-Flow system is influenced by two factors: the radial position, attributed to species absorbance following the Beer–Lambert law, and divergence; and the axial position, a consequence of the non-uniform irradiance of the LDF across its diffusion length. Notably, irradiance resulting from reflection at the stainless steel interface was not accounted for in this analysis.For the derivation of the model, the Naperian molar absorptivity (αλ,j = ln(10)·ελ,j) and the Naperian absorption coefficients ( and κλ,j = ln(10)·ελ,j·Cj) are preferred.
The Beer–Lambert law, in its differential form and in terms of the Naperian attenuation coefficient, can be expressed as:
 | (15) |
Here, Φλ represents the radiant flux for a specific wavelength λ. In the case of radially irradiating LDFs, light diverges, causing the irradiance Gλ(r) to decrease with distance r as the projected area increases with r. Thus, eqn (15) can be expressed as:
 | (16) |
 | (17) |
The Gλ,i exhibits non-uniformity, influenced by the axial distance from the FC connector (L). Given that the entrance of the CAP-Flow system aligns with L = 1 m, a shift in the frame of reference was implemented. This adjustment designates L = 1 m as z = 0, extending the scale from L = 0 to z = 1 m.
The fraction of radiant power or radiant flux emitted by the LDF between positions z2 and z1 (ΦCAP-Flow) is computed by:
 | (18) |
Considering the axial positions between z and z + Δz, where Δz → 0, the irradiance Gλ,i can be expressed through the following derivation:
 | (19) |
 | (20) |
 | (21) |
 | (22) |
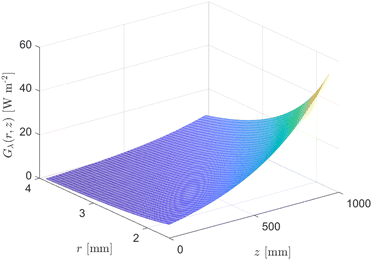 | ||
| Fig. 9 Eqn (22) evaluated from Ri = 1.59 mm to Ro = 3.87 mm and z = 0 to z = 0.94 m for κλ = 379 m−1 and ΦLDF = 0.275 W. | ||
The activation step of photocatalysts is driven by the absorption of photons; therefore, it is important to quantify the amount of photons that are absorbed by a specific species (the photocatalyst) at a given wavelength per unit volume. The LVRPA can be determined by multiplying the irradiance Gλ(r, z) with the Naperian attenuation coefficient of the j-th absorbing species (κλ,j) using the following equation:
 | (23) |
 | (24) |
In the context of the studied reaction, involving only Ru(bpy)3(PF6) and NiBr2·3H2O, these species are assumed to be homogeneously distributed across the radius of CAP-Flow system; therefore κλ,j is independent of z and r.
4.4. Overall conversion
In this section, we derived and discussed the various components essential for the modeling process. The mass balance, presented in eqn (9), served as a foundational equation. Solving this equation required the establishment of both the velocity profile (vz(r)), see eqn (10)) and the rate of reaction (rλ,A, see eqn (14)).Furthermore, the equation for the rate of reaction is intricately linked to the LVRPA (eaλ,PC, see eqn (24)). Determining LVRPA necessitated key information such as the total radiant flux of the LDF (ΦLDF) which calculated through actinometry and the Naperian attenuation coefficients of the feed and of the photocatalyst (κλ and κλ,PC). Substituting the rate law (see eqn (14)) in the mass balance PDE (see eqn (9)) and making CA = CA,0(1 − XA), yields a PDE in terms of the local fractional conversion (XA(z, r)):
 | (25) |
 | (26) |
Further details on the solution methodology using MATLAB (MathWorks, Massachusetts, US) and codes can be found in the ESI.†
The model enables the estimation of the molecular diffusivity Dm and product of the kinetic constants ϕλ·k from experimental data. These parameters can be determined using the least squares method, correlating the experimental conversion at the reactor outlet with the predicted cross-sectional average fractional conversion at z (〈XA〉(z)) for z = 0.94 m. The cross-sectional average fractional conversion can be calculated as:
 | (27) |
4.5. Ideal plug flow model
The objective of this model is to offer insights into the performance of the CAP-Flow system under conditions of perfect mixing or absence of concentration gradients throughout the system. As elaborated in section 5.2, this model effectively represents an infinite diffusivity coefficient in the PDE model.In the scenario of perfect radial mixing, the term ∂CA/∂r in eqn (9) nullifies. Under such conditions, assuming the absence of concentration gradients, all fluid passing through the reactor is presumed to share the same velocity, resulting in a flat velocity profile akin to plug flow, denoted as vz(r) = 〈vz〉. Furthermore, it is plausible to presume that the entire volume of fluid within the reactor undergoes the same rate of reaction across its cross-sectional area, denoted as 〈rλ,A〉. Consequently, the partial differential equation (PDE) eqn (9) simplifies into the ordinary differential equation (ODE) below:
 | (28) |
| 〈rλ,A〉 = ϕλ·k·〈eaλ,PC〉·CA | (29) |
 | (30) |
 | (31) |
Substituting eqn (31) into eqn (29), and subsequently substituting the result into ODE eqn (28), along with the substitutions CA = CA,0(1 − XA) and Q = 〈vz〉·π(R2o − R2i), we can integrate from XA = 0 at z = 0 to XA = 〈XA〉 at z = L. This yields:
 | (32) |
5. Model validation and simulations
5.1. Model validation
The PDE model developed relies on key parameters: ΦLDF, and the Naperian attenuation coefficients for the photocatalyst κλ,PC and the feed κλ. We determined ΦLDF through actinometry, yielding ΦLDF = 0.2755 W. For the attenuation coefficients, the decadic values were obtained experimentally and summarized in eqn (6) (more details in ESI†), resulting in αλ,PC = 3.32 × 10⁶ L mol−1 m−1 and κλ = αλ,PC·CPC + 110.5 m−1.The goodness of fit achieved using the Matlab-coded model is illustrated by the lines in Fig. 10a, while the agreement between experimental and model-predicted data is further demonstrated in the parity plot presented in Fig. 10b. The overall R2 obtained was 0.991. Additionally, the values for Dm and k·ϕλ were determined to be 10–10.2 m−2 s−1 and 0.0179 m3 einstein−1, respectively. As discussed in section 5.2, the value for Dm serves as an indicator of poor interlayer mixing, suggesting that the model would only be capable of providing estimations of the actual Dm within a specific range. When considering the data collected for each of the four CPC values, the R2 values were 0.996 for 2.50 × 10⁻⁵ equiv., 0.998 for 5.00 × 10⁻⁵ equiv., 0.997 for 20.0 × 10⁻⁵ and 0.990 for 70.0 × 10⁻⁵.
The PDE exhibits a strong agreement with experimental data, indicating its effectiveness in capturing the complex dynamics of the irradiation field, flow field, and apparent reaction kinetics in the CAP-Flow system. Its capability to replicate experimental observations suggests that it can be relied upon to guide the design, optimization, and scale-up of CAP-Flow systems. Moreover, the suitability and potential of this type of platform for kinetic experiments are underscored, given its ability to accurately model and predict reaction behavior under varying conditions.
5.2. Simulations and further discussion
The analysis of conversion profiles within the CAP-Flow system unveils intricate spatial dynamics influenced by both flow rate (Q) and photocatalyst concentration (CPC). Fig. 11 presents contour plots of XA(r, z) for varying flow rate (Q) using the fitted values for Dm and k·ϕλ. Our model predicts distinct conversion profiles, emphasizing maximal conversion at the edges of the reactor, influenced by the velocity profile and no-slip conditions. Conversely, the minimum conversion occurs near the annular gap's centerline, with a bias towards the inner radius due to the heightened irradiance Gλ (refer to Fig. 9). This minimum conversion close to the centerline is corroborated by the velocity profile shown in Fig. 8, where the maximum velocity is located near the centerline of the annulus, implying that the portion of fluid in that region receives less irradiance per unit time.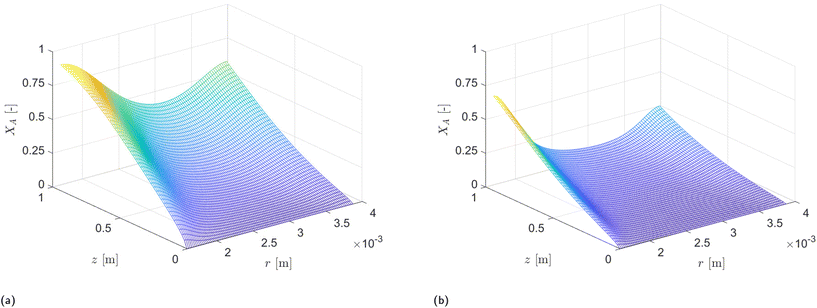 | ||
| Fig. 11 PDE solution XA(r, z) examples for CPC = 20.0 × 10⁻⁵ equiv. for two different flow rates. (a) Q = 0.5 mL min−1. (b) Q = 2 mL min−1. | ||
Insufficient interlayer mixing within the CAP-Flow system can lead to regions characterized by varying concentrations of reagents and products, potentially compromising system performance. Without the presence of static mixers or components that facilitate stretching and folding, mass transfer between layers relies solely on molecular diffusion under laminar conditions. As a result, a sensitivity analysis was conducted on the diffusivity coefficient Dm to evaluate its impact on the efficiency of the system.
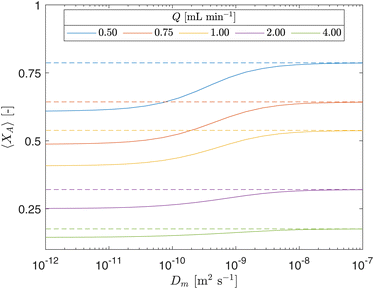
The impact of the diffusivity coefficient (Dm) on fractional conversion (XA) at the reactor outlet across different flow rates (Q) was assessed through a sensitivity analysis, as illustrated by the continuous lines in Fig. 12. The dashed lines represent the results obtained from the ideal plug flow model derived in Section 4.5. In this plot, a high photocatalyst concentration (CPC) was utilized to demonstrate the phenomena, noting that the difference between both models is less pronounced for lower CPC concentrations. The diffusivity coefficient (Dm) serves as an indicator of system homogeneity, where Dm = 0 signifies no mixing, while an infinite Dm implies uniform concentration throughout the cross-section area of the CAP-Flow system. The plot reveals that Dm becomes particularly significant at lower Q values, where radial diffusion dominates over axial flow. Furthermore, the figure highlights the consequence of inadequate interlayer mixing on XA, as an artificially high diffusivity coefficient (e.g., Dm = 10−7 m2 s−1) falsely simulates effective mixing equivalent to our plug flow model derived by assuming no radial concentration gradients. For higher values of Dm, the concentration heterogeneity depicted in Fig. 11 would be less prominent.
The value of Dm determined using the Least Squares Method in section 5.1 was 10–10.2 m2 s−1, indicating poor interlayer mixing. Despite this, the CAP-Flow system outperformed most LED-driven systems, as calculated in section 3.2.2 where the external quantum yield (QY) was determined. Poor interlayer mixing could be mitigated by incorporating static mixer elements along the CAP-Flow system, however some photons would be lost due to the presence of such elements. Another strategy to address this issue would involve recirculating a fraction of the outlet stream of the CAP-Flow system and ensuring thorough mixing.
The radial conversion heterogeneity of the conversion at the outlet of the CAP-Flow system was assessed through the calculation of the Coefficient of Variation (CV) from simulations. The CV is defined as: CV = σXA/〈XA〉, where σXA represents the Q-weighted standard deviation of XA(z = 0.94 m, r). The CV for selected flow rates are depicted in Fig. 13. It is observed that CV increases with CPC and with Q, indicating a more pronounced conversion difference between the edges and the centerline of the annulus. The first is to be expected as the increase in CV is linked to the reduced transmission (T) as CPC rises. Similarly, the increase in CV with Q aligns with expectations, as the species spend less time inside the reactor, allowing for less time for the concentration gradient driving force to homogenize the radial heterogeneity through molecular diffusion.
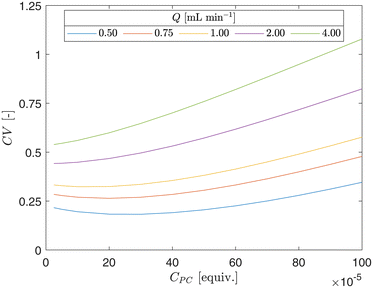 | ||
| Fig. 13 Coefficient of variation (CV) as a function of photocatalyst concentration (CPC) for different flow rates (Q). | ||
It is observed that the CV undergoes a minor decrease followed by a notable increase. The slight decrease is attributed to the lower average fractional conversions (〈XA〉) associated with low photocatalyst concentration (CPC), while the subsequent increase is linked to the reduced transmission (T) as CPC rises.
Furthermore, it's noteworthy that the CV for the plug flow model is zero, as expected, given the uniform mixing inherent in this idealized scenario.
The radial profiles presented in Fig. 11, along with the CV serve as a valuable metrics for anticipating potential photon overexposure, mitigating undesired side reactions,9,11 as local conversion values, especially at the boundaries where the velocity of the fluid is zero under non-slip conditions, can be anticipated.
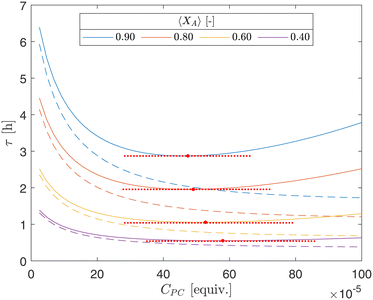
The PDE model serves as a robust tool for optimizing processing conditions within the CAP-Flow system, offering insights into parameter influences and may provide utility outside the CAP-Flow system. In Fig. 14, iso-conversion curves are plotted for varying combinations of CPC and mean residence times (τ). Continuous lines denote results from the PDE model, leveraging constants obtained in section 5.1, notably Dm = 10–10.2, indicative of poor radial mixing as demonstrated in Fig. 12. In contrast, dashed lines represent outcomes from the ideal plug flow model, which embodies perfect radial mixing.
However, the relationship with CPC exhibits a more complex pattern. The concentration of photocatalyst CPC governs the quantity of photocatalyst available to absorb photons and initiate the coupling reaction, necessitating longer residence time (τ) for desired conversion. In the ideal plug flow reactor model (dashed lines), where the absorption of photons is assumed uniform across the reactor cross-sectional area of the CAP-Flow reactor, the diminishing slope with increasing CPC reflects the finite photon supply from the LDF, leading to diminishing returns. For the PDE model (continuous lines), where there is poor mixing, the additional effect of shallower photon penetration as CPC increases is also taken into account. The combination of both effects creates a minima in the curve, indicating optimal CPC values (red markers in Fig. 14). Across curves, the optimal CPC values are relatively close, such as CPC = 47.4 × 10⁻⁵ equiv. for 〈XA〉 = 0.40 and CPC = 57.4 × 10⁻⁵ for 〈XA〉 = 0.90.
It's worth noting that lower CPC corresponds to higher transmittance (T) (referenced in Table 3), offering greater potential for improvement if photons were reflected by metallic walls, as stainless steel can reflect up to 60% of photons at a wavelength of 450 nm.35 Conversely, higher CPC values result in shallower photon penetration, reducing overall conversion; however, reflecting a portion of the photons reaching the annulus's outer radius has a lesser impact on system performance. Nonetheless, including static mixing elements would provide a higher benefit in such scenarios, as demonstrated by the continuous and dashed lines diverging further as CPC increases.
Conclusions
Our study presents a novel approach in the field of photochemical reactor design by coupling light-diffusing fibers (LDF) with a laser diode into an annular photoreactor of well-established geometry and irradiation field. To our knowledge, such integration had not been previously explored. This innovative construction opens new avenues for enhancing the efficiency and control of photochemical reactions, offering a promising solution to the limitations of LED-based photoreactors.By integrating lasers and LDFs into our prototype reactor design, we've achieved superior efficiency compared to LED-based photoreactors. While our prototype shows promising results, there are areas for improvement to further enhance efficiency. These include reflecting photons reaching the outer casing, incorporating static mixing elements, and using optic connectors to minimize losses. These advancements hold the potential to significantly boost performance and productivity in photochemical reactions.
Incorporating lasers and precise optical control enhances safety and control in both laboratory and industrial settings. The CAP-Flow architecture confines irradiation within a stainless-steel casing, preventing unintended illumination. Temperature regulation is facilitated by jacketing the reactor akin to a tubular heat exchanger with the freedom of material selection. Moreover, generating photons in the laser diode and utilizing optic fibers for transport divorces heat generation from the reaction environment, mitigating risks associated with hot surfaces and electrical equipment near flammable materials, a significant improvement over LED-based systems.
The CAP-Flow system provides flexibility through its modular design, allowing for easy modification of various components. For instance, the power of the diode can be adjusted to meet specific productivity requirements, while standard parts enable seamless interchangeability, such as swapping stainless steel tubes for larger diameters. This modularity facilitates quick replacement of parts, minimizing downtime for maintenance or repairs and resulting in increased uptime and productivity.
Facilitated by the defined geometry and irradiation field, we developed a comprehensive Partial Differential Equation (PDE) model aimed at estimating crucial reaction parameters. This model not only advances our understanding of the underlying reaction kinetics but also streamlines the optimization of operating conditions. By elucidating the intricate relationship between catalyst loading, residence time, and reaction efficiency, our model offers valuable insights. Additionally, comparisons with an ideal plug flow reactor model provide further context and understanding of the system's behavior under different conditions. This aspect is particularly significant as photocatalyzed reactions are often overlooked in conventional chemical modeling and scale-up prediction software suites.
The ability to construct accurate kinetic models and well-characterized photoreactors represents a significant step forward in the development of photochemical reactions for drug substance manufacturing. By providing insights into reaction mechanisms and process optimization, our work paves the way for accelerated advancements in pharmaceutical synthesis and production.
The potential for power scalability in the CAP-Flow system is significant, thanks to the availability of highly reliable blue laser diodes capable of delivering powers in the kilowatt range, commonly utilized in industrial welding applications. Accompanying this availability are transmission optic fibers and connectors designed to accommodate both high and low power applications. However, it's essential to note that the limiting factor for achieving higher power scalability lies in the light diffusing element. To our knowledge, radial emitting fibers, though commonly used for illumination purposes, have not been extensively employed in applications requiring high power levels. While radial emitting fibers of varying core diameters and materials are available in the market, information regarding the maximum radiant flux they can handle is often undisclosed. In the eventuality that suitable solutions are not readily available, one possible approach could involve the implementation of rigid quartz rods as a diffusing element. Although rigid and potentially requiring a surface treatment to enhance radial emission, such rods could serve as a viable interim solution to address power scalability challenges until more suitable options become available in the market.
In summary, our research represents a step forward in the development of photochemical reactors and their application in industrial processes. By combining innovative design principles with classical transport phenomena, we have demonstrated the potential for safer, more efficient, and scalable photochemical reactions. Nevertheless, significant improvements in efficiency are foreseeable through ongoing refinements in reactor design and optimization of operating conditions. These findings hold promise for various fields, including pharmaceutical synthesis and chemical manufacturing, where precise control and optimization of reaction conditions are paramount for success. The conclusions of this study highlight the potential for broadening the appeal of manufacturing green synthesis techniques. By leveraging innovative reactor designs and advanced control strategies, our research demonstrates the feasibility of implementing environmentally friendly synthesis methods on a larger scale. These findings not only contribute to the sustainability of chemical manufacturing processes but also offer economic benefits by reducing resource consumption and waste generation.
Data availability
The MATLAB code used for this study is available at https://zenodo.org/doi/10.5281/zenodo.13337657. The metadata for the m-files is included in the ESI.†Author contributions
Sergio Carrillo De Hert: methodology, software, validation, formal analysis, investigation, writing – editing, writing – original draft. Rafael Lopez-Rodriguez: conceptualization, methodology, investigation, writing – review. Michael J. Di Masso: methodology, writing – review, supervision. Jonathan P. McMullen: methodology, writing – review, supervision, project administration, funding acquisition. Steven Ferguson: conceptualization, writing – review, supervision, project administration, funding acquisition.Conflicts of interest
There are no conflicts to declare.Acknowledgements
This publication has emanated from research conducted with the financial support of Science Foundation Ireland under Grant number 16/RC/3872. For the purpose of Open Access, the author has applied a CC BY public copyright license to any Author Accepted Manuscript version arising from this submission. The research also received financial support from Merck Sharp & Dohme LLC, a subsidiary of Merck & Co., Inc., Rahway, NJ, USA. Michael J. Di Masso, and Jonathan P. McMullen are employees of Merck Sharp & Dohme LLC, a subsidiary of Merck & Co., Inc., Rahway, NJ, USA. We extend our gratitude to Francis Behan and Co. from Corning Inc. for facilitating the use of the Fibrance Light-Diffusing Fiber. Special thanks to Pieter van Kaathoven from Fibr8.com B.V. for his invaluable assistance in installing the FC connectors and cleaving the end of the LDF to suit our experimental requirements.References
- C. R. J. Stephenson, A. Studer and D. P. Curran, Beilstein J. Org. Chem., 2013, 9, 2778–2780 CrossRef PubMed.
- E. E. Callard-Langdon, A. Steven and R. J. Kahan, ChemCatChem, 2023, e202300537 CrossRef CAS.
- N. A. Romero and D. A. Nicewicz, Chem. Rev., 2016, 116, 10075–10166 CrossRef CAS.
- C. K. Prier, D. A. Rankic and D. W. C. MacMillan, Chem. Rev., 2013, 113, 5322–5363 CrossRef CAS.
- K. Teegardin, J. I. Day, J. Chan and J. Weaver, Org. Process Res. Dev., 2016, 20, 1156–1163 CrossRef CAS.
- F. Lévesque, M. J. D. Maso, K. Narsimhan, M. K. Wismer and J. R. Naber, Org. Process Res. Dev., 2020, 24, 2935–2940 CrossRef.
- M. Sender and D. Ziegenbalg, Chem. Ing. Tech., 2017, 89, 1159–1173 CrossRef CAS.
- J. Z. Bloh, Front. Chem., 2019, 7, 128 CrossRef CAS.
- M. Zhang and P. Roth, Curr. Opin. Chem. Eng., 2023, 39, 100897 CrossRef.
- T. Aillet, K. Loubière, L. Prat and O. Dechy-Cabaret, AIChE J., 2015, 61, 1284–1299 CrossRef CAS.
- C. Sambiagio and T. Noël, Trends Chem., 2020, 2, 92–106 CrossRef CAS.
- K. Donnelly and M. Baumann, J. Flow Chem., 2021, 11, 223–241 CrossRef CAS.
- J. W. Beatty, J. J. Douglas, K. P. Cole and C. R. J. Stephenson, Nat. Commun., 2015, 6, 7919 CrossRef PubMed.
- L. D. Elliott, J. P. Knowles, P. J. Koovits, K. G. Maskill, M. J. Ralph, G. Lejeune, L. J. Edwards, R. I. Robinson, I. R. Clemens, B. Cox, D. D. Pascoe, G. Koch, M. Eberle, M. B. Berry and K. I. Booker-Milburn, Chem. – Eur. J., 2014, 20, 15226–15232 CrossRef CAS PubMed.
- L. D. Elliott, J. P. Knowles, C. S. Stacey, D. J. Klauber and K. I. Booker-Milburn, React. Chem. Eng., 2018, 3, 86–93 RSC.
- S. D. Zondag, D. Mazzarella and T. Noël, Annu. Rev. Chem. Biomol. Eng., 2023, 14, 283–300 CrossRef CAS.
- K. Hofstadler, R. Bauer, S. Novalic and G. Heisler, Environ. Sci. Technol., 1994, 28, 670–674 CrossRef CAS.
- N. J. Peill and M. R. Hoffmann, Environ. Sci. Technol., 1995, 29, 2974–2981 CrossRef CAS PubMed.
- A. K. Ray and A. A. Beenackers, Catal. Today, 1998, 40, 73–83 CrossRef CAS.
- A. Danion, J. Disdier, C. Guillard, F. Abdelmalek and N. Jaffrezic-Renault, Appl. Catal., B, 2004, 52, 213–223 CrossRef CAS.
- W. Wang and Y. Ku, J. Photochem. Photobiol., A, 2003, 159, 47–59 CrossRef CAS.
- J. C. Wu, H.-M. Lin and C.-L. Lai, Appl. Catal., A, 2005, 296, 194–200 CrossRef CAS.
- L. Buglioni, F. Raymenants, A. Slattery, S. D. A. Zondag and T. Noël, Chem. Rev., 2021, 122, 2752–2906 CrossRef PubMed.
- J. R. Swierk, Org. Process Res. Dev., 2023, 1411–1419 CrossRef CAS.
- K. Lovato, P. S. Fier and K. M. Maloney, Nat. Rev. Chem., 2021, 5, 546–563 CrossRef CAS PubMed.
- K. C. Harper, E. G. Moschetta, S. V. Bordawekar and S. J. Wittenberger, ACS Cent. Sci., 2019, 5, 109–115 CrossRef CAS.
- M. Gondal, A. Hameed, Z. Yamani and A. Suwaiyan, Appl. Catal., A, 2004, 268, 159–167 CrossRef CAS.
- A. G. Griesbeck, N. Maptue, S. Bondock and M. Oelgemöller, Photochem. Photobiol. Sci., 2003, 2, 450–451 CrossRef CAS.
- N. A. Till, L. Tian, Z. Dong, G. D. Scholes and D. W. C. MacMillan, J. Am. Chem. Soc., 2020, 142, 15830–15841 CrossRef CAS.
- E. B. Corcoran, J. P. McMullen, F. Lévesque, M. K. Wismer and J. R. Naber, Angew. Chem., Int. Ed., 2020, 59, 11964–11968 CrossRef CAS.
- Corning Inc., Fibrance Light-Diffusing Fiber 2, Corning Inc. Specification Sheet M1400561- Rev 5, 2020.
- C. G. Hatchard and C. A. Parker, Proc. R. Soc. A, 1956, 235, 518–536 CAS.
- J. Rabani, H. Mamane, D. Pousty and J. R. Bolton, Photochem. Photobiol., 2021, 97, 873–902 CrossRef CAS PubMed.
- A. Steiner, P. M. C. Roth, F. J. Strauss, G. Gauron, G. Tekautz, M. Winter, J. D. Williams and C. O. Kappe, Org. Process Res. Dev., 2020, 24, 2208–2216 CrossRef CAS.
- C. Louis De Canonville, M. Minissale, F. Romero-Lairado, E. Salomon, G. Giacometti, T. Angot, R. Bisson and L. Gallais, Mater. Today Commun., 2023, 36, 106865 CrossRef CAS.
- R. B. Bird, W. E. Stewart and E. N. Lightfoot, Transport Phenomena, John Wiley & Sons, 2nd edn, 2001, p. 912 Search PubMed.
- M. Wörner, Chem. Eng. Sci., 2015, 122, 555–564 CrossRef.
- A. E. Cassano, C. A. Martin, R. J. Brandi and O. M. Alfano, Ind. Eng. Chem. Res., 1995, 34, 2155–2201 CrossRef CAS.
- T. Aillet, K. Loubiere, O. Dechy-Cabaret and L. Prat, Chem. Eng. Process.: Process Intesif., 2013, 64, 38–47 CrossRef CAS.
Footnote |
| † Electronic supplementary information (ESI) available. See DOI: https://doi.org/10.1039/d4re00400k |
| This journal is © The Royal Society of Chemistry 2025 |


