 Open Access Article
A novel Ln3+/Al3+ metallacrown multifunctional material for latent fingerprint detection, luminescent thermometers and luminescent sensors†
Han Yana,
Claudia M. S. Caladob,
Hao Wang a,
Muralee Murugesu
 *b and
Wen-Bin Sun
 *a
*a
aKey Laboratory of Functional Inorganic Material Chemistry Ministry of Education, School of Chemistry and Material Science, Heilongjiang University, 74 Xuefu Road, Harbin 150080, P. R. China. E-mail: wenbinsun@126.com
bDepartment of Chemistry and Biomolecular Sciences, University of Ottawa, Ottawa, Ontario K1N 6N5, Canada. E-mail: m.murugesu@uottawa.ca
First published on 11th February 2025
Abstract
Lanthanide luminescent complexes are active and thriving in various research fields due to their unique optical properties, while optical materials across a wide spectral range and with multiple functions in one were rarely reported. In this work, a new class of Ln3+/Al3+ metallacrowns (MCs) were constructed with excellent luminescence properties in both the visible and near-infrared regions, and the elaborate luminescence modulation can be achieved by doping with different Ln3+ ions. Strikingly, the powder of LnMC was developed as a luminescent nanomaterial for the detection of latent fingerprints (LFPs), and even the third level details of fingerprints can be clearly recognized, which provides a reference for the identification of fingerprints in the field of criminal investigation. More importantly, TbMC and Tb0.1Sm0.9MC can be successfully used as luminescent thermometers with sensitivities of 2.51% °C−1 and 2.33% °C−1, respectively, higher than most reported values. Meanwhile, TbMC was developed as a luminescent probe for Fe3+ and 2,6-pyridinedicarboxylic acid (DPA) with low limits of detection (LOD) of 0.51 μM and 4.26 μM, respectively, representing the first example of MC with luminescence sensing. Also of note is that SmMC, Tb0.1Sm0.9MC and TbMC can be functionalized as luminescent inks and films due to their clear recognizable colours in the visible range, suggesting a new strategy for high-level anti-counterfeiting. In short, the LnMC luminescent material has wide application prospects in many fields, especially rare for multifunctional applications of small-molecule complexes with non-metal–organic frameworks.
Introduction
Metallacrowns (MCs) are a class of multinuclear metal macrocyclic organic complexes that can be viewed as inorganic analogues of standard crown ether rings in which the alkyl carbon atoms are replaced by transition metal ions and nitrogen atoms to form metal–heteroatom repeating-[M–N–O]–n coordination units.1–3 The coordination cavities of the MC macrocycles provide oxygen coordination sites for encapsulation of different metal cation centers.4,5 Attributed to their unique topology, MCs have been widely used in many research areas, such as molecular recognition,6,7 catalysis,8,9 bioactivity,10,11 and single-molecule magnets,12,13 but have been slow to progress in luminescence. Lanthanides are ideal candidates for the preparation of luminescent materials because of their inherent large Stokes shifts, narrow emission spectra, and long lifetimes, which enable high colour purity emission in the visible and near-infrared ranges.14–18 However, the Laporte forbidden 4f–4f electron transition of Ln3+ results in very weak luminescence under direct excitation.19 Fortunately, this low molar absorption coefficient can be overcome by the “antenna effect” with the help of ligands.20 It was not until 2011 that Pecoraro reported the first Ln3+ MC with Zn2+ ion ring metals, realizing NIR luminescence of Nd3+ and Yb3+, opening the door to the luminescence field of MCs.21 Subsequently, a series of Ga3+/Ln3+ MC families with excellent luminescence properties have been continuously developed and breakthroughs have been achieved.22–25 However, such complexes rarely have functionalized applications or are only monofunctional.26,27 Therefore, there is a pressing imperative for developing multifunctional Ln-based MC complexes to meet the demands of a wide range of fields.Human fingerprints vary in patterns, breaks and crossings, and relying on their uniqueness and lifelong invariance, fingerprint identification is an effective means of verifying an individual's identity.28 Therefore, it is necessary to develop detection materials for latent fingerprints (LFPs) to provide valuable evidence for forensic science.29,30 Simultaneously, temperature is closely related to human activities, and its precise measurement is essential in scientific research, daily life, and industry.31–33 Currently, non-contact luminescent thermometers have become an emerging method for temperature measurement.34,35 Luminescent thermometers operate by monitoring an optical signal, such as luminescence intensity or luminescence lifetime, in response to temperature changes, offering non-invasive, convenient, and sensitive detection.36,37 Moreover, it is necessary to monitor heavy metals and pathogenic spores to ensure environmental health safety and biological health.38,39 Among them, the first and foremost are Fe3+ and 2,6-pyridinedicarboxylic acid (DPA) (a biomarker for Bacillus anthracis spores), the former being highly toxic and non-biodegradable, seriously affecting biological health, and the latter posing a serious threat to life safety as an acute infectious disease with high lethality.40–42 In addition, the advent of the information age has promoted rapid economy development, but serious problems of information leakage and counterfeiting have also followed.43–45 This not only raises concerns about information security but also causes economic losses.46 As a result, it is urgent to develop multifunctional materials integrating clear LFP detection, high sensitivity luminescent thermometers, highly selective luminescence sensing, and new anti-counterfeiting technologies.
The selection of ligands matching the energy levels of the lanthanide centers is a key factor in the preparation of luminescent sensing materials. Therefore, in this work, we chose the salicylhydroxamic acid (H3shi) and sodium p-hydroxybenzoate ligands to act as antennas to transmit the excited energy to sensitize the lanthanide centers. A series of novel LnMC compounds exhibiting luminescence emission from the visible to near-infrared range were successfully prepared using trivalent aluminum ions, and luminescence modulation was achieved by energy transfer between Tb3+ and Sm3+ ions. The application of LFP detection is supported by the bright luminescence of LnMC in the visible region, allowing clear identification of the third level of fingerprint details. Meanwhile, the energy transfer between lanthanide ions is intriguing, and the luminescence modulation was favorably achieved by chemically adjusting the molar ratio of Tb3+/Sm3+. Furthermore, the potential of TbMC and Tb0.1Sm0.9MC as luminescent thermometers was systematically explored with sensitivities of 2.51% °C−1 and 2.33% °C−1, respectively, which are comparable to or better than other lanthanide-based luminescent thermometers reported in the literature. In addition, the bright green emission endows TbMC with a luminescent sensor for the detection of Fe3+ and DPA with a limit of detection (LOD) in the low-level range, and the corresponding test papers have been successfully prepared, which can be used for rapid detection in the field. Notably, LnMC has been functionally developed as anti-counterfeiting inks and films, enabling multi-level encryption of information and anti-counterfeiting labels. Overall, the Ln3+/Al3+ MC has excellent luminescence properties with luminescence emission covering almost the full range of the spectral domain and can also be used for LFP detection, for luminescent thermometers and multi-responsive luminescent sensing materials, as well as for anti-counterfeiting applications, which are rare for small-molecule complexes with non-metal–organic frameworks.
Results and discussion
Synthesis and crystal structures
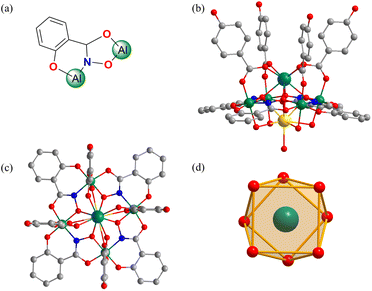
LnMC was synthesized by a one-pot method using H3shi, lanthanide nitrate, aluminum nitrate, and excess of sodium p-hydroxybenzoate. Crystals of DyMC of suitable size and quality for X-ray diffraction were obtained, and the corresponding packing diagram is provided in Fig. S1.† Thermogravimetric analysis of DyMC is shown in Fig. S2.† PXRD analysis confirmed that all LnMC are isostructural (Fig. S3†), allowing a comprehensive discussion of their molecular structures. DyMC crystallizes in a tetragonal space group (Table S1†), and the crystal structure is shown in Fig. 1. Four deprotonated shi3− ligands bridge four Al3+ ions to form four Al–N–O repeating units, resulting in a square-shaped neutral 12-MC-4 macrocycle. Four p-hydroxybenzoate ligands bridge the Dy3+ ion and the four Al3+ ions anchor the central Dy3+ ion above the MC ring constituting an eight-coordinate square antiprism geometry (Fig. 1d), which is confirmed by Continuous Shape Measure (CShM)47 analysis (Table S3†). The carboxylic acid groups bridging the Dy3+ ion and the Al3+ ion on the ring provides additional stability to the MC scaffolds. The sodium ion is located on the opposite side of the MC, bridged by water molecules, providing charge balance.Photophysical properties
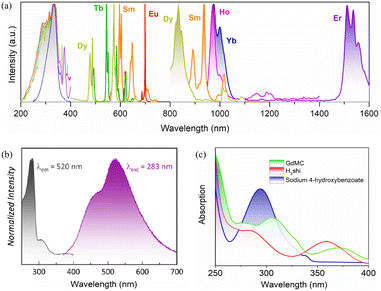
The complex electronic structure of the trivalent lanthanide ions endows Ln3+ with unique optical properties and exhibits characteristic luminescence.48 Photoluminescence spectra are an important means of investigating the spectral properties of materials. The excitation spectra of LnMC (Ln = Sm, Eu, Tb, Dy, Ho, Er, Yb) were collected within the 200–400 nm range, and all of the absorption peaks showed an intense band at 336 nm, which is attributed to the same ligand (Fig. 2a). Therefore, the luminescence emission spectra of LnMC were recorded from visible to near-infrared domains under 336 nm excitation. For SmMC, characteristic emission peaks of Sm3+ were detected; four peaks were observed at 560, 597, 640 and 698 nm in the visible region corresponding to 4G5/2 → 6HJ (J = 5/2–11/2) transitions, and three peaks were also observed at 892, 935 and 1016 nm in the near-infrared range assigning to 4G5/2 → 6FJ (J = 5/2–11/2) transitions. EuMC showed typical emission peaks at 590, 615, 650, and 697 nm, arising from 5D0 → 7FJ (J = 1–4) energy level transitions, where the most intense emission peak appears at 697 nm (5D0 → 7F4), leading to the emission of strong red light. Similarly, TbMC exhibited Tb3+ absorption bands with peaks at 490, 545, 581, and 618 nm due to transitions from the ground state 5D4 to different excited levels 7FJ (J = 6–3). DyMC displayed prominent characteristic emission in both the visible and near-infrared ranges with peaks at 480, 571, 660, 746, 834 and 1009 nm, which are assignable to the 4F9/2 → 6H15/2, 4F9/2 → 6H13/2, 4F9/2 → 6H11/2, 4F9/2 → 6H9/2, 4F9/2 → 6H7/2+6F9/2 and 4F9/2 → 6F7/2 energy level transitions, respectively. It is worth mentioning that the visible range is mainly dominated by 4F9/2 → 6H15/2 and 4F9/2 → 6H13/2 bands, resulting in near-standard white light emission from DyMC with CIE colour coordinates of (0.311, 0.359) and a correlated colour temperature equal to 6398 K. For the remaining HoMC, ErMC and YbMC, all generated near-infrared emission bands. In detail, HoMC obtained two peaks at 975 and 1172 nm corresponding to 5F5 → 5I7 and 5I6 → 5I8 energy level transitions. ErMC and YbMC exhibited fascinating long-wavelength emissions centered at 1538 nm (4I13/2 → 4I15/2) and 975 nm (2F5/2 → 2F7/2), respectively, with the full width at half maxima (FWHM) of about 1.47 × 105 cm−1 and 1.7 × 105 cm−1, which offer the possibility of developing Er3+/Yb3+-doped fiber lasers. These results indicate that the ligand is able to effectively sensitize most of the Ln3+ ions, allowing LnMC to exhibit excellent lanthanide emission properties from the visible to the near-infrared region (Fig. 2a).To further explore energy transfer, it is necessary to determine the triplet state (T1) energy levels of the ligand. The Gd3+ ion complex is an effective probe for assessing the T1, which has a sufficiently high first excited energy level (32![[thin space (1/6-em)]](https://www.rsc.org/images/entities/char_2009.gif) 000 cm−1) to avoid energy transfer from the ligand to the Gd3+ ion.49 GdMC was investigated in the solid state using steady-state and time-resolved luminescence at −196 °C (77 K). Steady-state excitation and emission spectra (Fig. 2b) exhibit the expected ligand bands. To determine the exact position of the excited triplet state in this system, time-resolved emission measurements were conducted with a delay to eliminate singlet (S1) emission. Initially, we hypothesized that the first band (centered at 460 nm) in the emission spectrum was assigned to S1, while the second band (centered at 520 nm) was attributed to T1. However, regardless of the applied delay, either the first emission band was always present, or the entire signal, including the second band, was eliminated. No significant changes were observed in the band after the delay, except for the noise-to-signal ratio (Fig. S4†). This suggests that both bands are likely assigned to two T1 states from the two ligands present in the system, deprotonated shi3− and p-hydroxybenzoate, rather than S1 and T1 emissions. Since the two components of the states could not be separated, it was not possible to calculate the lowest T1 from which the electronic population would transfer to the Ln3+. However, this value should not differ significantly from the one previously reported in the literature for a similar MC system, approximately at 22
000 cm−1) to avoid energy transfer from the ligand to the Gd3+ ion.49 GdMC was investigated in the solid state using steady-state and time-resolved luminescence at −196 °C (77 K). Steady-state excitation and emission spectra (Fig. 2b) exhibit the expected ligand bands. To determine the exact position of the excited triplet state in this system, time-resolved emission measurements were conducted with a delay to eliminate singlet (S1) emission. Initially, we hypothesized that the first band (centered at 460 nm) in the emission spectrum was assigned to S1, while the second band (centered at 520 nm) was attributed to T1. However, regardless of the applied delay, either the first emission band was always present, or the entire signal, including the second band, was eliminated. No significant changes were observed in the band after the delay, except for the noise-to-signal ratio (Fig. S4†). This suggests that both bands are likely assigned to two T1 states from the two ligands present in the system, deprotonated shi3− and p-hydroxybenzoate, rather than S1 and T1 emissions. Since the two components of the states could not be separated, it was not possible to calculate the lowest T1 from which the electronic population would transfer to the Ln3+. However, this value should not differ significantly from the one previously reported in the literature for a similar MC system, approximately at 22![[thin space (1/6-em)]](https://www.rsc.org/images/entities/char_2009.gif) 200 cm−1.50 This energy level is located at an ingenious position which allows the ligand to transfer energy to most of the Ln3+ ions through the antenna effect. Meanwhile, the UV-visible absorption spectra of the ligand H3shi, sodium p-hydroxybenzoate and GdMC in ethanol solution were analyzed. As shown in Fig. 2c, the absorption bands observed with the maxima at 294 nm in the spectrum of sodium p-hydroxybenzoate and at 283 nm and 358 nm in the spectrum of H3shi could be attributed to π → π* transitions. The formation of a GdMC framework caused a redshift of the absorption band and exhibited a broad absorption band that extends from 200 to 400 nm (Fig. 2c).
200 cm−1.50 This energy level is located at an ingenious position which allows the ligand to transfer energy to most of the Ln3+ ions through the antenna effect. Meanwhile, the UV-visible absorption spectra of the ligand H3shi, sodium p-hydroxybenzoate and GdMC in ethanol solution were analyzed. As shown in Fig. 2c, the absorption bands observed with the maxima at 294 nm in the spectrum of sodium p-hydroxybenzoate and at 283 nm and 358 nm in the spectrum of H3shi could be attributed to π → π* transitions. The formation of a GdMC framework caused a redshift of the absorption band and exhibited a broad absorption band that extends from 200 to 400 nm (Fig. 2c).
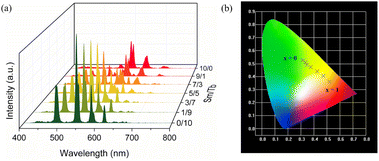
A series of bimetallic centered Tb1−xSmxMC (x = 0, 0.1, 0.3, 0.5, 0.7, 0.9, 1.0) co-doped with varying Tb3+/Sm3+ molar ratios were synthesized for further explorations. It is noteworthy that the varying molar ratios of Tb3+ and Sm3+ lead to different luminescence colours of Tb1−xSmxMC; as the Sm3+ ion content increases, the characteristic emission intensity of Tb3+ ions significantly decreases, and the luminescence colour of Tb1−xSmxMC under 336 nm excitation turns from green to yellow-green, yellow, and orange-red (Fig. 3a). This implies the existence of an energy transfer from Tb3+ to Sm3+, which successfully realizes a series of multicolour emissions of Tb1−xSmxMC. In addition, the CIE chromaticity diagram in clearly shows the process of colour change; the CIE colour coordinates of Tb1−xSmxMC (x = 0, 0.1, 0.3, 0.5, 0.7, 0.9, 1.0) are (0.313, 0.525), (0.334, 0.511), (0.346, 0.490), (0.375, 0.473), (0.426, 0.440), (0.472, 0.405), and (0.521, 0.361), respectively (Fig. 3b).
Latent fingerprint detection
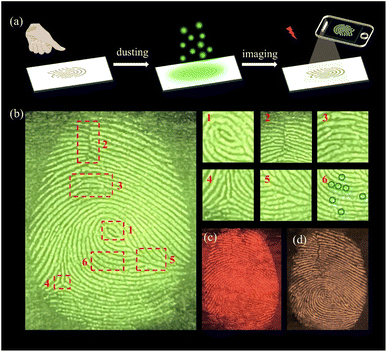
The uniqueness of human fingerprints makes fingerprint recognition an important measure of identification, which is widely used in forensic science, security authentication and other fields.51–53 Powder dusting as an LFP visualization technology, with high sensitivity and simple operation, plays an important role in criminal investigation.54,55 LnMC as a luminescent nanomaterial has the potential to be developed into LFP detection materials attributed to its small size, low cost, and significant luminescence. All fingerprints were collected from the same volunteer. The volunteer pressed one finger on the glass to leave a fingerprint, following which TbMC powder was carefully sprinkled on the fingerprint, and the excess powder was then gently blew away with a rubber suction bulb to obtain a TbMC-stained LFP (Fig. 4a). Under UV light, the luminescence image of the LFP is clearly visible, as shown in Fig. 4b, and the first level macroscopic features including the (1) core and the second level details such as the (2) scar, (3) island, (4) bifurcation and (5) ridge termination of the fingerprint were recognized obviously. In particular, the third level details of (6) sweat pores were also clearly recognized by the naked eye (Fig. 4b), which provide a reference for authenticating the identity in criminal science. Notably, we also developed LFP detection for SmMC (Fig. 4c) and Tb0.1Sm0.9MC (Fig. 4d), and the generated fingerprint images are rendered in red and yellow respectively. The multicoloured LFP meets the needs of various environments and effectively avoids the interference of different backgrounds in the crime scene, which provides a promising method for identifying LFPs in criminal cases.Luminescent thermometers
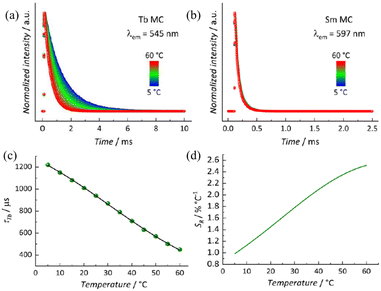
The fascinating photophysical properties of LnMC in the visible region have aroused interest in exploring its potential as a luminescent thermometer. LnMC is stable in ethanol solution, and its luminescence intensity hardly changes after 24 h, which makes it a suitable solvent for testing (Fig. S5†). Initial luminescence measurements in ethanol solution (1 mg mL−1) were conducted on homometallic samples. Upon excitation at 336 nm, the characteristic sharp emission bands of Tb3+ (5D4 → 7FJ) in the visible range were observed (Fig. S6†). Similar results were obtained for the SmMC system regarding the excitation profile (Fig. S6†), as well as typical Sm3+ (4G5/2 → 6HJ) emission bands. The absence of noticeable intraconfigurational 4f–4f transitions in the excitation spectrum indicates a highly efficient antenna effect. The excited state emission decay curves of LnMC were measured by monitoring the most intense emission band of Tb3+ (545 nm) and Sm3+ (597 nm) upon excitation at 336 nm. In both cases, a monoexponential decay curve was observed, yielding a lifetime (τ) of 1011 μs for TbMC and 69 μs for SmMC (Fig. S7†).To gain a better understanding of the system and its emission kinetics, emission decay curves for both systems were measured across a temperature range of 5–60 °C. It is observed that as the temperature increases, τTb decreases (Fig. 5a), while τSm remains nearly constant throughout the studied temperature range (Fig. 5b). This suggests that a back energy transfer (BET) from Tb3+ (5D4 at 20![[thin space (1/6-em)]](https://www.rsc.org/images/entities/char_2009.gif) 500 cm−1) to the ligand T1 might occur as the temperature increases, due to the closer proximity of these states. In contrast, the larger energy gap between Sm3+ (4G5/2 at 17
500 cm−1) to the ligand T1 might occur as the temperature increases, due to the closer proximity of these states. In contrast, the larger energy gap between Sm3+ (4G5/2 at 17![[thin space (1/6-em)]](https://www.rsc.org/images/entities/char_2009.gif) 900 cm−1) and T1 prevents that from happening. The lifetimes for both systems are summarized in Table S4,† with the small variation in τSm being within the instrument's error.
900 cm−1) and T1 prevents that from happening. The lifetimes for both systems are summarized in Table S4,† with the small variation in τSm being within the instrument's error.
 | (1) |
Given its temperature dependence behaviour, τTb was explored as the thermometric parameter (Δ). A Boltzmann-like function (eqn (1)), though without physical significance, was used to fit the thermometric parameter (Fig. 5c).
The relative thermal sensitivity was obtained by applying the fitted function to eqn (2). A maximum relative thermal sensitivity (SRmax) of 2.51% °C−1 was obtained at 60 °C (Fig. 5d). Additionally, the MC has an operational range (SR > 1% °C−1) within the entire temperature range explored.
| SR (%) = [(∂Δ/∂T)/Δ] × 100 | (2) |
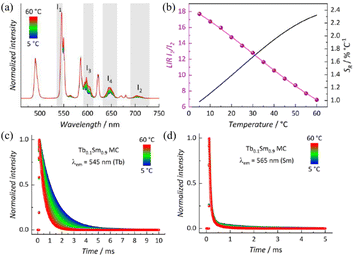
Due to the significant differences in luminescence intensity and lifetime between Tb3+ in TbMC and Sm3+ in SmMC, we developed a novel luminescent mixed-lanthanide thermometer, Tb0.1Sm0.9MC, which also exhibits high temperature sensitivity. Upon excitation at 336 nm and 20 °C, emission bands corresponding to both Tb3+ and Sm3+ 4f–4f transitions are observed (Fig. S8†). The bands centered around 600 nm and 650 nm contain emission components from both ions. Although Sm3+ is the major constituent of this sample, its emission bands are much less intense than those of Tb3+. This is due to a more efficient sensitization of the Tb3+ 5D4 excited state compared to Sm3+ 4G5/2. Furthermore, Sm3+ emission is more susceptible to non-radiative deactivation in solution than Tb3+. Varying-temperature emission spectra were collected from 5 to 60 °C, showing an overall decrease in emission intensity as the temperature is increased (Fig. 6a). The spectra were normalized based on the most intense emission band (545 nm). It was observed that, with increasing temperature, Tb3+ emission was quenched more significantly compared to the Sm3+ emission, which supports the BET Tb3+ → T1 process. This also suggests a possible Tb3+ → Sm3+ energy transfer (ET). To perform thermometry measurements using the luminescence intensity ratio (LIR) as the thermometric parameter, two spectral regions were selected: 535–547 nm (I1) and 689–729 nm (I2). A Boltzmann-like function was used to fit the temperature dependence of LIR, from which the SR was derived (Fig. 6b). A SRmax of 2.33% °C−1 was achieved at 60 °C. Two additional ranges, 591–613 nm (I3) and 631–662 nm (I4), were also tested, but both yielded a lower overall SR (Fig. S8†).
To gain further insight into the luminescence dynamics of this system, decay curves were collected by monitoring the emitting states of Tb3+ (545 nm) and Sm3+ (565 nm). A monoexponential decay was observed for Tb3+ 5D4 (Fig. 6c), while Sm3+ 4G5/2 exhibited a bi-exponential decay behaviour (Fig. 6d). The lifetime values for both emitting states are summarized in Table S5.† The average lifetime (〈τ〉) of Sm3+ was calculated using eqn (3) and applied to the normalized decay curves, where t0 is the time at which the curves reach their maximum intensity (I) and t1 is the time at which they reach the background. It is noteworthy that in the Tb0.1Sm0.9MC system, τTb remains similar to the values obtained for TbMC, while 〈τSm〉 is approximately twice as long as that found for SmMC. This observation supports the Tb3+ → Sm3+ ET process in the Tb0.1Sm0.9MC system.
 | (3) |
Luminescent sensors for Fe3+ and DPA
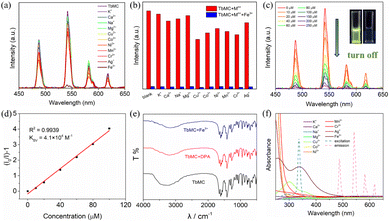
Upon excitation at the ligand-centered absorption band, TbMC in ethanol exhibited the characteristic green emission of the Tb3+ ion. Given its strong luminescence and long lifetime (Table S4†), we explored its potential as a luminescent sensor. A 1 mg mL−1 solution of TbMC in ethanol was prepared and uniformly dispersed using pulsed ultrasound agitation. Various metal ion solutions (K+, Ca2+, Na+, Mg2+, Cu2+, Co2+, Ni2+, Mn2+, Cr3+, Ag+ and Fe3+) of the same concentration were then added to the ethanol solution, and the luminescence intensity was measured before and after the addition to investigate TbMC's response to different metal ions (Fig. 7a). The experimental results indicate that the Fe3+ ion caused a rapid decrease in the emission intensity at 545 nm, with a quenching efficiency of 96%, while other metal ions exhibited much milder quenching effects (Fig. 7a). Even in the presence of equal amounts of competing metal ions, Fe3+ maintained a high quenching efficiency for the luminescence of TbMC, demonstrating its excellent anti-interference ability in selectively detecting Fe3+ (Fig. 7b). This further confirms that TbMC can serve as a luminescent sensor for the selective detection of Fe3+ in organic solvents.Luminescence titration experiments were conducted to further evaluate the sensitivity of TbMC for Fe3+ detection (Fig. 7c). As the Fe3+ ion concentration increased, the luminescence intensity gradually decreased. Data analysis based on the emission peak at 545 nm revealed that the plot of I0/I − 1 against [Fe3+] exhibited good linear correlation within the low concentration range, which can be described by the Stern–Volmer equation I0/I = KSV × [Fe3+] + 1 (Fig. 7d). The quenching constant KSV was used to analyze the quenching ability of the Fe3+ ion.58 The LOD at a low Fe3+ concentration was determined using the formula LOD = 3σ/KSV (where σ represents the standard deviation of the blank measurement).58 This resulted in an LOD value of 0.51 μM, which is lower than or comparable to the LOD values reported for Ln-based luminescent sensors in the literature.58–60
In order to elucidate the luminescence quenching mechanism potentially induced by Fe3+, PXRD and IR spectra were collected before and after detection. The spectra after the sensing experiment were similar to those before being treated with the Fe3+ ion, indicating that the TbMC structure remained intact and no additional new bonds were generated, which suggest that the luminescence quenching was caused by neither structure collapse nor interacting with the Fe3+ ion (Fig. 7e and S1†).20 Furthermore, the UV-vis absorption spectra of all metal ions are shown in Fig. 7f; the emission spectrum of TbMC did not overlap with the UV absorption spectrum of Fe3+, so the possibility of quenching the luminescence by the Förster resonance energy transfer (FRET) mechanism is not considered.61 While the UV-vis absorption spectrum of the Fe3+ ion displayed a strong absorption band between 270 and 350 nm, which significantly overlapped with the excitation spectrum of TbMC (Fig. 7f), implying the existence of competition in the absorption of excitation energy between the Fe3+ ion and Tb3+ ion.20 Therefore, the addition of the Fe3+ ion led to the luminescence quenching of TbMC, which is reasonably attributed to the inner filter effect.62
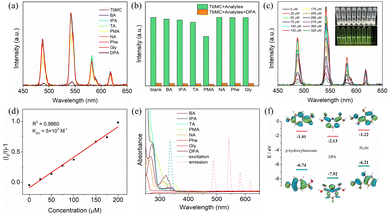
DPA, a biomarker for Bacillus anthracis spores, plays a crucial in the prevention and control of disease outbreaks.63 Leveraging the excellent luminescence properties of TbMC, we adopted a similar metal ion sensing strategy to investigate its luminescent sensing behaviour towards DPA. Various carboxylic acid solutions of the same concentration were added to the ethanol solution, and only DPA demonstrated effective quenching (Fig. 8a). Additionally, seven potential interferents – benzoic acid (BA), isophthalic acid (IPA), trimesic acid (TA), pyromellitic acid (PMA), nicotinic acid (NA), phenylalanine (Phe), and glycine (Gly) – were tested to evaluate the anti-interference performance of TbMC (Fig. 8b). The results indicate that these interferents did not affect the detection of DPA by TbMC, confirming its high selectivity as a luminescent sensor for DPA. As shown in Fig. 8c, increasing the DPA concentration significantly decreased the intensity of all the bands, which was observed as a noticeable decrease in green emission. At low concentrations, the Stern–Volmer plot for DPA shows a strong linear correlation between the luminescence intensity and DPA concentration (R2 = 0.9860) (Fig. 8d), yielding a quenching constant KSV of 5 × 10³ M−1. The LOD was calculated to be 4.26 μM, which is significantly lower than the infectious dose of anthrax spores (60 mM).64 These results suggest that TbMC is an ideal candidate for the luminescent detection of anthrax spores.
To investigate the potential DPA sensing mechanism of TbMC, we analyzed the PXRD (Fig. S3†) and IR (Fig. 7e) results. It is evident that the luminescence quenching of TbMC is neither due to the collapse of the framework nor due to the formation of new coordination or hydrogen bonds with DPA molecules. The UV-vis absorption spectrum of DPA significantly overlaps with the excitation spectrum of TbMC but not with its emission spectrum (Fig. 8e). This overlap indicates that the luminescence quenching is caused by the inner filter effect due to competitive absorption of the excitation spectrum energy, rather than by the FRET mechanism.65 Additionally, the calculated LUMO energy levels of ligands sodium p-hydroxybenzoate and H3shi are −1.41 and −1.22 eV, respectively, whereas DPA has a much lower LUMO energy level of −2.13 eV (Fig. 8f). This calculation suggests that the quenching of lanthanide luminescence is likely due to photoinduced electron transfer, with electrons moving from the LUMO of the ligands to the LUMO of DPA, thereby causing luminescence quenching.37 In summary, the experimental results indicate that DPA induces luminescence quenching in TbMC through multiple mechanisms.
At the same time, the luminescent sensor test papers for detecting Fe3+ and DPA were prepared to further evaluate the practical applications of TbMC. As shown in Fig. 9, blank test papers were immersed in a 1 mg mL−1 TbMC solution and subsequently dried under vacuum. Only the sections exposed to Fe3+ and DPA showed the disappearance of green luminescence under UV light, while no colour change was observed for other substances. The successful preparation of these test papers highlights the potential of TbMC as a luminescent sensor for detecting Fe3+ and the anthrax biomarker DPA, indicating promising applications in public health and safety.
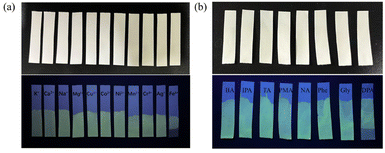 | ||
| Fig. 9 (a) Luminescence photographs of TbMC under daylight and under UV light with metal ions. (b) Luminescence photographs of TbMC under daylight and under UV light with carboxylic acids. | ||
LnMC's anti-counterfeiting inks and films
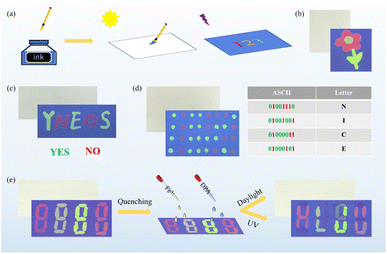
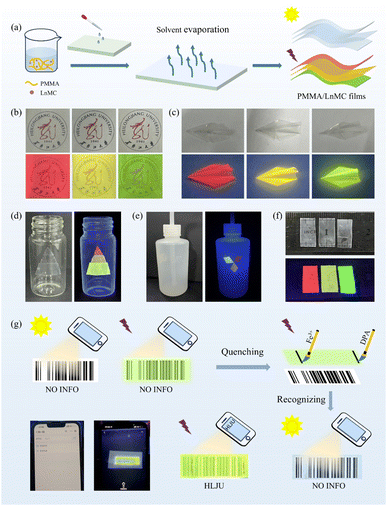
The use of anti-counterfeiting inks to verify product authenticity and protect documents is critical to global commerce, information security and public health.66 LnMC is an ideal candidate for the development of anti-counterfeiting inks due to its excellent luminescence properties and multicolour tunability in the visible region. Therefore, we selected SmMC, Tb0.1Sm0.9MC and TbMC with bright emission colours to be dispersed in DMF to make multicolour luminescent inks that can be used to draw patterns or encrypt information (Fig. 10a). A beautiful flower pattern was created in which the petals were drawn in SmMC ink, the stamens in Tb0.1Sm0.9MC ink and the leaves in TbMC ink. Such pattern is invisible in daylight but visible under UV light where the vibrant colours were clearly recognizable and can be used to identify authenticity (Fig. 10b). Furthermore, a strategy was devised to encrypt the information using disrupted letters; “YES NO” was encrypted as “YNEOS”, where “YES” was written in TbMC ink and “NO” in SmMC ink, and they can be recognized only when properly aligned under UV light (Fig. 10c). To increase the level of encryption for information security, triple encryption was implemented using ASCII binary codes (Fig. 10d). The code created using SmMC and TbMC is not visible in daylight. The decryption consists of three steps: first, the luminous dots are recognized under UV light; second, the green and red luminous dots are converted to binary codes “0” and “1”, respectively; and third, the corresponding letters are decrypted according to the ASCII binary code “NICE” (Fig. 10d). The luminescence responsiveness of Fe3+ and DPA has led to the emergence of erasable luminescent inks, where we can selectively leave or erase luminescent information to regulate its visibility or invisibility on demand. As shown in Fig. 10e, a colourful pattern was drawn using the three inks, some of the luminescence was quenched with two erasing agents (an ethanolic solution of 300 μM Fe3+ or DPA), and the retained luminescence pattern eventually showed the information “HLJU” (the acronym of Heilongjiang University) under UV light. These results demonstrate that the luminescent inks are simple, convenient, and efficient anti-counterfeiting materials and can greatly improve the security of information by cleverly designing various encryption strategies.Luminescent films have attracted a lot of attention due to their unique properties with potential applications in optical devices, sensors and anti-counterfeiting labels.67 In view of the stability of LnMC in solvents and multicolour luminescence properties, PMMA/LnMC (Ln = Sm, Tb0.1Sm0.9 and Tb) luminescent films were successfully prepared by doping LnMC into a polymethylmethacrylate (PMMA) matrix (Fig. 11a). These films exhibit bright red, yellow, and green luminescence under UV light, respectively, and show high transparency over 90% (Fig. S9†) allowing clear patterns to be observed through the films under both daylight and UV light (Fig. 11b). In addition, the flexibility of the films enables them to be easily fabricated into special shapes or cut to any size to meet a variety of needs (Fig. 11c). Accordingly, the LnMC films were cut and assembled into a variety of patterns for further development into anti-counterfeiting labels, which can be directly attached to glass bottles, washing bottles and rulers (Fig. 11d–f). Exposing the labels to UV light showed rich colours, whereas only the transparent films could be observed under natural light (Fig. 11d–f), effectively improving the level of anti-counterfeiting. More interestingly, we developed a new type of anti-counterfeiting barcode by utilizing the quenching effect of Fe3+ and DPA on TbMC luminescence. Under daylight, no information can be recognized by scanning the barcode through the film, but only under UV light the quenched parts of Fe3+ and DPA can be identified as black lines used to assemble a new barcode, which can be recognized by a mobile phone to get the correct information “HLJU” that was hidden (Fig. 11g). Obviously, LnMC films reveal high transparency, good luminescence properties and extraordinary processability, thereby becoming a candidate material for the anti-counterfeiting and information encryption.
Conclusions
In conclusion, a series of novel Ln3+/Al3+ MCs were successfully constructed with multifunctional applications. LnMC exhibited photoluminescence in almost the full spectral range from visible to near-infrared, and luminescence modulation was accomplished by adjusting the molar ratio of Tb3+ and Sm3+ ions. Based on the excellent luminescence performance of LnMC, it has been successfully developed for the detection of LFPs, which can be clearly identified even with the third level of details, and has potential application value in criminal investigation. In addition, TbMC and Tb0.1Sm0.9MC possess potential as luminescent thermometers, with high sensitivities of 2.51% °C−1 and 2.33% °C−1, respectively, in the temperature range of 5–60 °C. Meanwhile, TbMC represents the first multi-responsive MC luminescent sensor that could rapidly and selectively detect Fe3+ and DPA, and the success of the test paper proved its practical applicability. More strikingly, LnMC can also be functionalized into luminescent inks and films to effectively improve the level of anti-counterfeiting. On the whole, the Ln3+/Al3+ MCs present excellent luminescence properties, making them promising multifunctional luminescent sensors and anti-counterfeiting materials.Data availability
The data supporting this article have been included as part of the ESI.† Crystallographic data for DyMC have been deposited at the CCDC (2377154).Author contributions
Han Yan: conceptualization, investigation, data curation, writing – original draft. Claudia M. S. Calado: data curation and writing – original draft. Hao Wang: formal analysis. Muralee Murugesu: supervision and methodology. Wen-Bin Sun: supervision, methodology, writing – reviewing and editing.Conflicts of interest
There are no conflicts to declare.Acknowledgements
This work was supported by National Natural Science Foundation of China (22071047) and Natural Science Foundation of Heilongjiang Province (PL2024B013). All experiments were performed in compliance with relevant laws or guidelines; the volunteer was informed and consented to the use of their fingerprints.Notes and references
- M. Tegoni and M. Remelli, Coord. Chem. Rev., 2012, 256, 289–315 CrossRef CAS.
- G. Mezei, C. M. Zaleski and V. L. Pecoraro, Chem. Rev., 2007, 107, 4933–5003 CrossRef CAS PubMed.
- M. S. Lah and V. L. Pecoraro, J. Am. Chem. Soc., 1989, 111, 7258–7259 CrossRef CAS.
- S. H. Seda, J. Janczak and J. Lisowski, Inorg. Chem. Commun., 2006, 9, 792–796 CrossRef CAS.
- J. Jankolovits, J. W. Kampf and V. L. Pecoraro, Polyhedron, 2013, 52, 491–499 CrossRef CAS.
- C.-S. Lim, J. Jankolovits, P. Zhao, J. W. Kampf and V. L. Pecoraro, Inorg. Chem., 2011, 50, 4832–4841 CrossRef CAS PubMed.
- C.-S. Lim, J. W. Kampf and V. L. Pecoraro, Inorg. Chem., 2009, 48, 5224–5233 CrossRef CAS.
- A. Maspero, S. Brenna, S. Galli and A. Penoni, J. Organomet. Chem., 2003, 672, 123–129 CrossRef CAS.
- M. Casarin, C. Corvaja, C. di Nicola, D. Falcomer, L. Franco, M. Monari, L. Pandolfo, C. Pettinari, F. Piccinelli and P. Tagliatesta, Inorg. Chem., 2004, 43, 5865–5876 CrossRef CAS PubMed.
- C. Dendrinou-Samara, A. N. Papadopoulos, D. A. Malamatari, A. Tarushi, C. P. Raptopoulou, A. Terzis, E. Samaras and D. P. Kessissoglou, J. Inorg. Biochem., 2005, 99, 864–875 CrossRef CAS.
- M. Alexiou, I. Tsivikas, C. Dendrinou-Samara, A. A. Pantazaki, P. Trikalitis, N. Lalioti, D. A. Kyriakidis and D. P. Kessissoglou, J. Inorg. Biochem., 2003, 93, 256–264 CrossRef CAS PubMed.
- S.-G. Wu, Z.-Y. Ruan, G.-Z. Huang, J.-Y. Zheng, V. Vieru, G. Taran, J. Wang, Y.-C. Chen, J.-L. Liu, L. T. A. Ho, L. F. Chibotaru, W. Wernsdorfer, X.-M. Chen and M.-L. Tong, Chem, 2021, 7, 982–992 CAS.
- X. Wen, H. Li, Z. Ju, R. Deng and D. Parker, Chem. Sci., 2024, 15, 19944–19951 RSC.
- J. Wang, Q.-W. Li, S.-G. Wu, Y.-C. Chen, R.-C. Wan, G.-Z. Huang, Y. Liu, J.-L. Liu, D. Reta, M. J. Giansiracusa, Z.-X. Wang, N. F. Chilton and M.-L. Tong, Angew. Chem., Int. Ed., 2021, 60, 5299–5306 CrossRef CAS PubMed.
- Y. Cui, B. Chen and G. Qian, Coord. Chem. Rev., 2014, 273–274, 76–86 CrossRef CAS.
- Y. Zou, W. Lv, Z. Xue, J. Pan, X.-Y. Li and G.-M. Wang, Dalton Trans., 2022, 51, 16383–16388 RSC.
- Y.-J. Ma, F. Xu, X.-Y. Ren, F.-Y. Chen, J. Pan, J.-H. Li, S.-D. Han and G.-M. Wang, Chem. Sci., 2024, 15, 17642–17651 RSC.
- S. E. Bodman and S. J. Butler, Chem. Sci., 2021, 12, 2716–2734 RSC.
- J.-C. G. Bünzli and C. Piguet, Chem. Soc. Rev., 2005, 34, 1048–1077 RSC.
- Z.-J. Hu, M.-J. Tsai, Y.-J. Tu and J.-Y. Wu, Chem.–Eur. J., 2023, 29, e202300081 CrossRef CAS.
- J. Jankolovits, C. M. Andolina, J. W. Kampf, K. N. Raymond and V. L. Pecoraro, Angew. Chem., Int. Ed., 2011, 50, 9660–9664 CrossRef CAS.
- S. V. Eliseeva, E. V. Salerno, B. A. Lopez Bermudez, S. Petoud and V. L. Pecoraro, J. Am. Chem. Soc., 2020, 142, 16173–16176 CrossRef CAS.
- T. N. Nguyen, C. Y. Chow, S. V. Eliseeva, E. R. Trivedi, J. W. Kampf, I. Martinić, S. Petoud and V. L. Pecoraro, Chem.–Eur. J., 2018, 24, 1031–1035 CrossRef CAS PubMed.
- T. N. Nguyen, S. V. Eliseeva, C. Y. Chow, J. W. Kampf, S. Petoud and V. L. Pecoraro, Inorg. Chem. Front., 2020, 7, 1553–1563 RSC.
- E. V. Salerno, S. V. Eliseeva, B. L. Schneider, J. W. Kampf, S. Petoud and V. L. Pecoraro, J. Phys. Chem. A, 2020, 124, 10550–10564 CrossRef CAS.
- E. V. Salerno, A. N. Carneiro Neto, S. V. Eliseeva, M. A. Hernández-Rodríguez, J. C. Lutter, T. Lathion, J. W. Kampf, S. Petoud, L. D. Carlos and V. L. Pecoraro, J. Am. Chem. Soc., 2022, 144, 18259–18271 CrossRef CAS PubMed.
- M. Y. Zhuang, H. Yang, H. G. Zhang, H. Q. Tian, D. C. Li and J. M. Dou, Transition Met. Chem., 2022, 47, 139–146 CrossRef CAS.
- J. Cao, R. Chen, L. Wang, H. Xing, H. Hu, X. Yang, C. Gu, S. Tang and D. Chen, Chem. Eng. J., 2024, 491, 152121 CrossRef CAS.
- L. Li, P. Xi, Q. Li, X. Wang and B. Cheng, Colloids Surf., A, 2022, 652, 129759 CrossRef CAS.
- X. Zhao, Z. Liu, Y. Duan, Z. Xu, X. Feng, Z. Li and T. Han, Chem. Eng. J., 2024, 498, 155525 CrossRef CAS.
- X. Lin, M. Kong, N. Wu, Y. Gu, X. Qiu, X. Chen, Z. Li, W. Feng and F. Li, ACS Appl. Mater. Interfaces, 2020, 12, 52393–52401 CrossRef CAS PubMed.
- S.-N. Zhao, L.-J. Li, X.-Z. Song, M. Zhu, Z.-M. Hao, X. Meng, L.-L. Wu, J. Feng, S.-Y. Song, C. Wang and H.-J. Zhang, Adv. Funct. Mater., 2015, 25, 1463–1469 CrossRef CAS.
- J.-J. Pang, Z.-Q. Yao, K. Zhang, Q.-W. Li, Z.-X. Fu, R. Zheng, W. Li, J. Xu and X.-H. Bu, Angew. Chem., Int. Ed., 2023, 62, e202217456 CrossRef CAS PubMed.
- H. Guan, M. Qi, L. Shi, W. Liu, L. Yang and W. Dou, ACS Appl. Mater. Interfaces, 2023, 15, 18114–18124 CrossRef CAS PubMed.
- D. Errulat, R. Marin, D. A. Gálico, K. L. M. Harriman, A. Pialat, B. Gabidullin, F. Iikawa, O. D. D. Couto Jr, J. O. Moilanen, E. Hemmer, F. A. Sigoli and M. Murugesu, ACS Cent. Sci., 2019, 5, 1187–1198 CrossRef CAS.
- D. Ananias, F. A. A. Paz, D. S. Yufit, L. D. Carlos and J. Rocha, J. Am. Chem. Soc., 2015, 137, 3051–3058 CrossRef CAS PubMed.
- Y. Cui, H. Xu, Y. Yue, Z. Guo, J. Yu, Z. Chen, J. Gao, Y. Yang, G. Qian and B. Chen, J. Am. Chem. Soc., 2012, 134, 3979–3982 CrossRef CAS PubMed.
- X. Wang, K. Gopalsamy, G. Clavier, G. Maurin, B. Ding, A. Tissot and C. Serre, Chem. Sci., 2024, 15, 6488–6499 RSC.
- X. Wang, G. Clavier, Y. Zhang, K. Batra, N. Xiao, G. Maurin, B. Ding, A. Tissot and C. Serre, Chem. Sci., 2023, 14, 5386–5395 RSC.
- D.-M. Chen, N.-N. Zhang, C.-S. Liu and M. Du, J. Mater. Chem. C, 2017, 5, 2311–2317 RSC.
- X. Leng, W. Hao, X. Yang, Z. Zhang, H. Li, Y. Ma, Y. Cheng and D. Schipper, Inorg. Chem., 2022, 61, 8484–8489 CrossRef CAS.
- S. Yang, J. Lin, S. Wang, X. Wu, D. Schipper and X. Yang, Anal. Chem., 2024, 96, 19093–19099 CrossRef CAS.
- J.-Q. Zhao, H.-S. Shi, L.-R. Zeng, H. Ge, Y.-H. Hou, X.-M. Wu, C.-Y. Yue and X.-W. Lei, Chem. Eng. J., 2022, 431, 134336 CrossRef CAS.
- X. Yu, A. A. Ryadun, D. I. Pavlov, T. Y. Guselnikova, A. S. Potapov and V. P. Fedin, Angew. Chem., Int. Ed., 2023, 62, e202306680 CrossRef CAS PubMed.
- C. Zhuo, S. Zhao, X. Huang, Y. Jiang, J. Li and D.-Y. Fu, J. Mol. Liq., 2023, 376, 121442 CrossRef CAS.
- Q. Luo, J. Jiang, S. Yang, D. Li, J. Dai, X. Wang, Y. Xu, B. Zeng, W. Luo, C. Yuan and L. Dai, Chem. Eng. J., 2024, 490, 151898 CrossRef CAS.
- S. Alvarez, P. Alemany, D. Casanova, J. Cirera, M. Llunell and D. Avnir, Coord. Chem. Rev., 2005, 249, 1693–1708 CrossRef CAS.
- X. Wang, H. Chang, J. Xie, B. Zhao, B. Liu, S. Xu, W. Pei, N. Ren, L. Huang and W. Huang, Coord. Chem. Rev., 2014, 273–274, 201–212 CrossRef CAS.
- S. V. Eliseeva, T. N. Nguyen, J. W. Kampf, E. R. Trivedi, V. L. Pecoraro and S. Petoud, Chem. Sci., 2022, 13, 2919–2931 RSC.
- C. Y. Chow, S. V. Eliseeva, E. R. Trivedi, T. N. Nguyen, J. W. Kampf, S. Petoud and V. L. Pecoraro, J. Am. Chem. Soc., 2016, 138, 5100–5109 CrossRef CAS PubMed.
- S. Yang, C.-F. Wang and S. Chen, Angew. Chem., Int. Ed., 2011, 50, 3706–3709 CrossRef CAS PubMed.
- G. P. Darshan, H. B. Premkumar, H. Nagabhushana, S. C. Sharma, S. C. Prashanth and B. D. Prasad, J. Colloid Interface Sci., 2016, 464, 206–218 CrossRef CAS PubMed.
- P. Pan, T. Zhang, B. Yu, R. Ma, Q. Yue, A. A. Alghamdi and Y. Deng, J. Colloid Interface Sci., 2022, 605, 425–431 CrossRef CAS PubMed.
- Z. Lv, Z. Man, Z. Xu, S. Li, Q. Liao and H. Fu, J. Mater. Chem. C, 2021, 9, 7345–7350 RSC.
- L. Li, Q. Li, J. Chu, P. Xi, C. Wang, R. Liu, X. Wang and B. Cheng, Appl. Surf. Sci., 2022, 581, 152395 CrossRef CAS.
- X. Chen, S. Liu, K. Huang, J. Nie, R. Kang, X. Tian, S. Zhang, Y. Li and J. Qiu, Chem. Eng. J., 2020, 396, 125201 CrossRef CAS.
- K. Elzbieciak-Piecka, M. Suta and L. Marciniak, Chem. Eng. J., 2021, 421, 129757 CrossRef CAS.
- X. Wang, S. He, J. Chen, J. Wei, C. Chen, W. Shi, D. Wu, L. Fu and T. Yang, Dalton Trans., 2024, 53, 276–284 RSC.
- B. B. Rath and J. J. Vittal, Inorg. Chem., 2020, 59, 8818–8826 CrossRef CAS PubMed.
- S. Y. Hao, S. X. Hou, Z. C. Hao and G. H. Cui, Spectrochim. Acta, Part A, 2018, 189, 613–620 CrossRef CAS PubMed.
- L. Wu, C. Huang, B. P. Emery, A. C. Sedgwick, S. D. Bull, X.-P. He, H. Tian, J. Yoon, J. L. Sessler and T. D. James, Chem. Soc. Rev., 2020, 49, 5110–5139 RSC.
- J.-Q. Wu, X.-Y. Ma, C.-L. Liang, J.-M. Lu, Q. Shi and L.-X. Shao, Dalton Trans., 2022, 51, 2890–2897 RSC.
- D. D. Evanoff, J. Heckel, T. P. Caldwell, K. A. Christensen and G. Chumanov, J. Am. Chem. Soc., 2006, 128, 12618–12619 CrossRef CAS.
- M. D. Yilmaz and H. A. Oktem, Anal. Chem., 2018, 90, 4221–4225 CrossRef CAS.
- Y. Ma, X. Yang, Z. Xiao, X. Liu, D. Shi, M. Niu and D. Schipper, Chem. Commun., 2021, 57, 7316–7319 RSC.
- H. Zhou, J. Han, J. Cuan and Y. Zhou, Chem. Eng. J., 2022, 431, 134170 CrossRef CAS.
- R. Gao, X. Fang and D. Yan, J. Mater. Chem. C, 2019, 7, 3399–3412 RSC.
Footnote |
| † Electronic supplementary information (ESI) available: General experimental section, including all procedures and equipment used. CCDC 2377154. For ESI and crystallographic data in CIF or other electronic format see DOI: https://doi.org/10.1039/d4sc08549c |
| This journal is © The Royal Society of Chemistry 2025 |

