
 Open Access Article
 This Open Access Article is licensed under a Creative Commons Attribution-Non Commercial 3.0 Unported Licence
An origami colorimetric paper-based sensor for sustainable on-site and instrument-free analysis of nitrite†
Denise Gregucciab,
Maria Maddalena Calabrettaab,
Faisal Nazirab,
Robert Josue Rodriguez Ariasa,
Federico Biondia,
Riccardo Desiderioa and
Elisa Michelini *ac
*ac
aDepartment of Chemistry “Giacomo Ciamician”, University of Bologna, Via P. Gobetti 85, 40129, Bologna, Italy. E-mail: elisa.michelini8@unibo.it
bCenter for Applied Biomedical Research (CRBA), Azienda Ospedaliero-Universitaria Policlinico S. Orsola-Malpighi, 40138, Bologna, Italy
cIRCCS Azienda Ospedaliero-Universitaria di Bologna, Bologna, 40138, Italy
First published on 24th January 2025
Abstract
Paper-based sensors have been widely used thanks to their potential for creating simple, low-cost, and sustainable analytical devices, making them particularly suitable for environmental monitoring. The aim of this work is to develop a ready-to-use colorimetric paper sensor, based on the Griess reaction, for nitrite on-site monitoring. We here address the requirement for a sustainable, sensitive, and low-cost nitrite sensor that combines, for the first time i) the use of paper as a support, ii) the immobilization of Griess reagents, iii) the origami strategy for triggering chemical reactions without the need for handling chemicals, and iv) a smartphone as a detector for quantitative measurements. While previous sensors for nitrite detection rely on a complex assay workflow and require separate instrumentation, our paper sensor simply needs a smartphone or, for qualitative results, the naked eye for instrument-free detection. The paper sensor showed satisfactory analytical performance for analysis of drinking water with recoveries from 87 to 110% and limits of detection and quantification for NO2− of 0.27 mg L−1 and 1.11 mg L−1, respectively. The sustainability of the sensor was also evaluated supporting its potential use for rapid monitoring of nitrites across a range of applications, including water quality assessment in agricultural runoff, wastewater treatment, and surface water monitoring.
1. Introduction
Water quality is of paramount importance, and since the primary strategy for water quality management is contamination prevention, it is essential to monitor the presence of contaminants.Nitrite (NO2−) and nitrate (NO3−) represent the most common nitrogen-containing compounds, posing a significant environmental and health challenge due to increased natural and anthropogenic activities. Nitrite, a well-known inorganic contaminant, naturally occurs in plants, food, and water. However, it is also widely present in foodstuffs because of the use of nitrogen-based compounds as food preservatives, especially in meat and meat products. The use of nitrogen-based fertilizers contributes significantly to increasing nitrite levels in water bodies1,2 by converting urea or ammonia through the microbial nitrification process. Similarly, animal and human waste, known to be rich in organic nitrogen, releases nitrite and nitrate into the surrounding environment after their decomposition, leaching beyond the soil–plant system and reaching water bodies.3 High levels of nitrite can be detected in drinking water sources, posing serious health risks, including methemoglobinemia in infants. The World Health Organization (WHO) set the maximum allowable concentration of nitrite in drinking water at 3 mg L−1, based on assessments of health risks associated with agricultural activities.4,5 A limit of 1 mg L−1 for nitrite in drinking water has been established by the Environmental Protection Agency (EPA) https://www.epa.gov/ground-water-and-drinking-water/national-primary-drinking-water-regulations.
Nitrite ions are monitored in drinking water, surface, and underground water, as well as in industrial and municipal water waste, and different analytical methods have been developed,4 including spectrophotometric and electrochemical techniques, chromatography,6 and capillary electrophoresis analysis.7,8 The most used method is the International Organization for Standardization (ISO) 15923-1:2013 method, which relies on spectrophotometric and turbidimetric analysis of different ions, including nitrite, for water quality. The method is based on the colorimetric Griess reaction,9–12 which follows an azo coupling mechanism, where an aromatic amine (e.g. sulfanilamide – SulfAA), in the presence of nitrite and an acidic catalyst, undergoes diazotization to form a reactive diazonium salt, through an electrophilic aromatic substitution. When this diazonium salt is combined with an electron-rich coupling agent (e.g. N-(1-naphthyl)ethylenediamine – NED), it reacts to produce a highly-colored azo dye. The diazo dye absorbs visible light at a wavelength of 540 nm, resulting in a pink/purple color, with an absorption intensity that is directly proportional to the concentration of nitrites.
Commercially available assays based on the Griess reaction and methods based on redox reactions under acidic conditions13 rely heavily on either complex sample pretreatment or laboratory instrumentation for absorbance measurements (i.e. benchtop spectrophotometers), making on-site and real-time measurements challenging.14
Sensors, that enable on-site and low-cost analysis, appear as highly appealing alternatives. The use of sensors in routine agricultural practices would allow more sustainable management, implementing real-time decision-making and reducing the need for complex laboratory procedures and trained personnel. As an alternative, sensing approaches have been proposed for the detection of nitrite in different matrices, including microfluidic paper-based systems based on the Griess reaction,15–19 exploiting reflectance detection.19 Reflectance detection, i.e., the measure of the fraction of light reflected by a material, is widely used in user-friendly portable paper sensors with colorimetric detection. Paper-based sensors provide the potential to create simple, low-cost, and disposable analytical devices, making them particularly suitable for environmental monitoring. A few paper-based devices for the detection of nitrite and nitrate have been reported.20 Recently a hydrogel chemosensor was developed by Tai et al.,21 whereas Li et al. used a paper strip and a triple-mode sensing method to detect nitrite ions.22 Another study presented a paper-based device and a microanalysis cassette for detecting nitrite levels in food samples using LED lights and a smartphone for image acquisition.23 Smartphone-based sensors are receiving significant attention since they replace optical detectors avoiding the use of further instrumentation.24–32
However, most of these devices still require expensive instrumentation for fabrication (i.e., patterning, cutting) and pre-concentration of the sample, and most importantly, they are not sustainable considering the full life cycle of a disposable sensing device.
This work aims to develop a ready-to-use reflectance origami paper sensor based on the Griess reaction, to detect low concentrations of nitrite without the need for manual handling of liquid reagents. To ensure the portability and the simplicity of the system, without loss of sensitivity, smartphone-based detection was introduced. This approach emphasizes the use of eco-friendly materials, allowing the monitoring of environmental samples, like water sources, in a sustainable way. By exploiting these principles, our sensor addresses the need for effective environmental monitoring, playing a role in promoting the reuse of resources and contributing to more sustainable and responsible water management.
2. Experimental
2.1 Chemicals, reagents and instrumentation
Sodium nitrite, NaCl, MgSO4, K2HPO4, K2CO3, KNO3, MgCl2, CaCl2, FeCl3, FeCl2, urea, glucose, and bovine serum albumin (BSA) were from Sigma-Aldrich (St. Louis, MO). Sulfanilamide (SulfAA) and N-(1-naphthyl)-ethylenediamine (NED) were from the “Nitrite/Nitrate Colorimetric Test” (Roche) kit from Sigma-Aldrich (St. Louis, MO). Whatman 1 CHR cellulose chromatography paper was from GE Healthcare (Chicago, IL, USA) and was used as support for the design of the colorimetric sensing paper. A Phaser 8400 office wax printer (Xerox, Norwalk, CT, USA) was used for wax printing. OnePlus 6T (OnePlus, Shenzhen, China) was used for colorimetric signal acquisitions. A Varioskan LUX multimode microplate reader (Thermo Fisher Scientific Inc., Waltham, MA, USA) was used for absorbance measurements.2.2 Design and method optimization of the NitriPad paper sensor
A preliminary design of the NitriPad, comprising 18 circular areas (a 6 × 3 array of 7 mm-diameter wells), was created using PowerPoint (Microsoft, Redmond, WA, USA) and printed on Whatman 1 CHR chromatography paper using an office wax printer. The hydrophobic areas were created by heating the NitriPad for 2 min at 100 °C to allow the wax to spread through the cellulose fibers. This configuration was used to create a calibration curve for NaNO2 (concentration range 0.05–5.0 mg L−1 in ddH2O) using the Griess reagents. Thus, maintaining the same ratio suggested for the standard 96-well assay; 10 μL of SulfAA + NED solution and 15 μL of NaNO2 standard solutions and a control (0.0 mg L−1 NaNO2 in ddH2O) were dispensed into each well. Images were acquired every 5 minutes up to 15 minutes, and then every 15 minutes up to 2 hours of incubation at room temperature (RT ∼ 22 °C) using a smartphone CMOS sensor and a dark box to avoid light interference during the incubation of the analyte with SulfAA and NED. SulfAA and NED are light-sensitive reagents due to their aromatic amine and conjugated structures, which can degrade or oxidize under light exposure, causing background interference in the colorimetric measurement.To create a ready-to-use paper sensor, the adsorption of the Griess reagents on paper was evaluated and the origami configuration was explored. In particular, the volumes of the Griess reactant and analyte, their ratio, and the paper folding process were investigated. For each experiment, the incubation time for the colorimetric reaction was monitored by acquiring images of the PAD with a smartphone camera. The final configuration of the NitriPad was designed to include a 3 × 2 well array on one side (bottom) and a 3 × 2 well array on the opposite side (top) (Fig. S1†). Three configurations (A, B, and C) were tested by adsorbing NED and SulfAA reagents on different sides of the PAD and changing the order in the procedure of sample addition and paper folding. For each PAD, 3 wells were used for the control (ddH2O) and 3 wells for a standard solution of NaNO2 (5.0 mg L−1). Volumes were optimized by increasing the reagent and analyte total volume (25 and 50 μL) onto the PAD, and changing the Griess reagent/analyte ratio, testing 20 and 30 μL of analyte volume. The adsorption of both NED and SulfAA in the same well was also evaluated, confirming the need to keep the two Griess reagents separate to avoid their competitive reaction during the drying process.
The optimized configuration involves the adsorption of 10 μL of SulfAA to the top side of the NitriPad, and 10 μL of NED to the bottom one for 3 h at room temperature (22 °C) in the dark box to avoid the degradation (oxidation) of SulfAA and NED, due to their light-sensitive nature. Then, the NED part of the PAD is sealed with adhesive tape to prevent sample leakage, the SulfAA part is folded over the NED part, and 30 μL of samples are added to the reverse SulfAA part. In this way, sample addition causes wetting of the two layers of the PAD, thus triggering the chemical reaction (Fig. S1†).
2.3 NitriPad assay optimization and data analysis
Once the procedure has been optimized, a calibration curve was obtained for NaNO2 using the configuration of the NitriPad with an array of 7 × 3 wells for each part of the PAD and the optimized volume for NaNO2 (0.05–5.0 mg L−1), standard solutions and the control. Images were acquired after 0, 5, 10, 15, 20, and 30 minutes of incubation in a dark box at room temperature with a OnePlus 6T smartphone, equipped with a dual integrated camera, composed of a primary sensor (16 MP Sony Exmor RS IMX 519, BSI CMOS ½0.600 color sensor with 1.22 μm pixels, f/1.7 aperture) and a secondary sensor (20 MP Sony Exmor RS IMX 376 K, BSI CMOS ½0.800 color sensor with 1.0 μm pixels, f/1.7 aperture). The native camera app of the smartphone was used to acquire the images with the automatic exposure mode, without any zoom, filter, or other tools. The smartphone was placed at a distance (20 cm) from the plane of the sensing paper to ensure reproducibility of the measurements. To minimize reflectance variations and reduce user input, no other light source apart from the standard room lighting was used uniformly across all sessions, avoiding shadows. Reflectance measurements were analyzed with ImageJ software (v. 1.53t, National Institutes of Health, Bethesda, MD, USA) in the form of colorimetric signals. A circular region of interest (ROI) was defined corresponding to the circular wells. The ROI had a diameter of 70 pixels, corresponding to an area of 3852 pixels. The field of view (FoV) of the image was 418.91 × 192.00 mm, corresponding to the full resolution of 4608 × 2112 pixels, allowing for accurate spatial reference of the selected ROI. The pixel size was calibrated based on the known scale of 7 mm = 77 pixels, resulting in a pixel size of 11.0 pixels mm−1. Pixel brightness was calculated as the mean value within the defined ROI using the grayscale, ranging from 0 (black) to 255 (white). The intensity values were evaluated to assess the colorimetric signals associated with the reflectance of the sample. Data were fitted with the second-order polynomial (quadratic) non-linear regression using GraphPad Prism v.8 software (GraphPad Software, LaJolla, CA, USA). The limit of detection (LOD) was calculated as the mean value of the blank (ddH2O) minus three times the standard deviation of the control (ddH2O). The limit of quantification (LOQ) was calculated as the mean value of the blank (ddH2O) minus ten times the standard deviation of the control (ddH2O). All measurements were performed in triplicate and repeated at least three times.2.4 Real sample analysis and recovery studies
The applicability of the origami colorimetric paper-based sensor to the analysis of complex samples was also evaluated. Bottled water samples (Vera San Giorgio in Bosco, Vera S.p.a., Milano, Italy) with a declared nitrite concentration <0.002 mg L−1 were spiked with NaNO2 by adding known concentrations (0.5, 1.0 and 2.5 mg L−1) of NaNO2 in the samples. The assay procedure was the same as described previously using 30 μL of water sample in triplicate. The % recovery was then calculated using the equation:
2.5 Selectivity, pH effect and storage stability studies
Selectivity studies were performed to evaluate the specificity of the NitriPad sensor in the presence of potential interferents. NaCl, MgSO4, K2HPO4, K2CO3, KNO3, MgCl2, CaCl2, FeCl3, FeCl2, urea, glucose, and BSA solutions (2.0 mM) were prepared in ddH2O and evaluated individually using the optimized procedure described in section “2.3 NitriPad assay optimization and data analysis”. Results were compared to those obtained with the NitriPad tested with 2.5 mg mL−1 NaNO2 (CTR+) and with ddH2O (CTR−) solutions. In addition, the pH effect on the NitriPad was also evaluated by testing NaNO2 sample (1.75 mg L−1) solutions at pH 5.0, 7.0 and, 9.0.Sensor stability was investigated by measuring the colorimetric signals of the NO2− (or NaNO2) sensing papers stored at +4 °C in Petri dishes and sealed with Parafilm tape for 28 days. The sensor response was assessed by the addition of 30 μL of NaNO2 (1.0 mg L−1) (or 0.667 mg L−1 NO2−) with an incubation period of 15 min at room temperature (∼22 °C). Colorimetric signals were acquired with a smartphone camera (OnePlus 6T) and analyzed with ImageJ software. The colorimetric signals obtained at day 0 were normalized as 100% of the signal.
3. Results and discussion
In this work, a foldable colorimetric smartphone paper sensor for monitoring nitrite ions was developed. Exploiting the modified Griess reaction, an azo coupling mechanism, in the presence of nitrite and an acidic catalyst, an aromatic amine (e.g. sulfanilamide – SulfAA) undergoes diazotization to form a reactive diazonium salt through an electrophilic aromatic substitution that, combined with an electron-rich coupling agent (e.g. N-(1-naphthyl)ethylenediamine – NED), produces a highly-colored azo dye with a pink color (Fig. 1). Sulfanilic acid was replaced with sulfanilamide in hydrochloric acid since it yields higher color stability and faster reaction kinetics using a commercially available reagent.33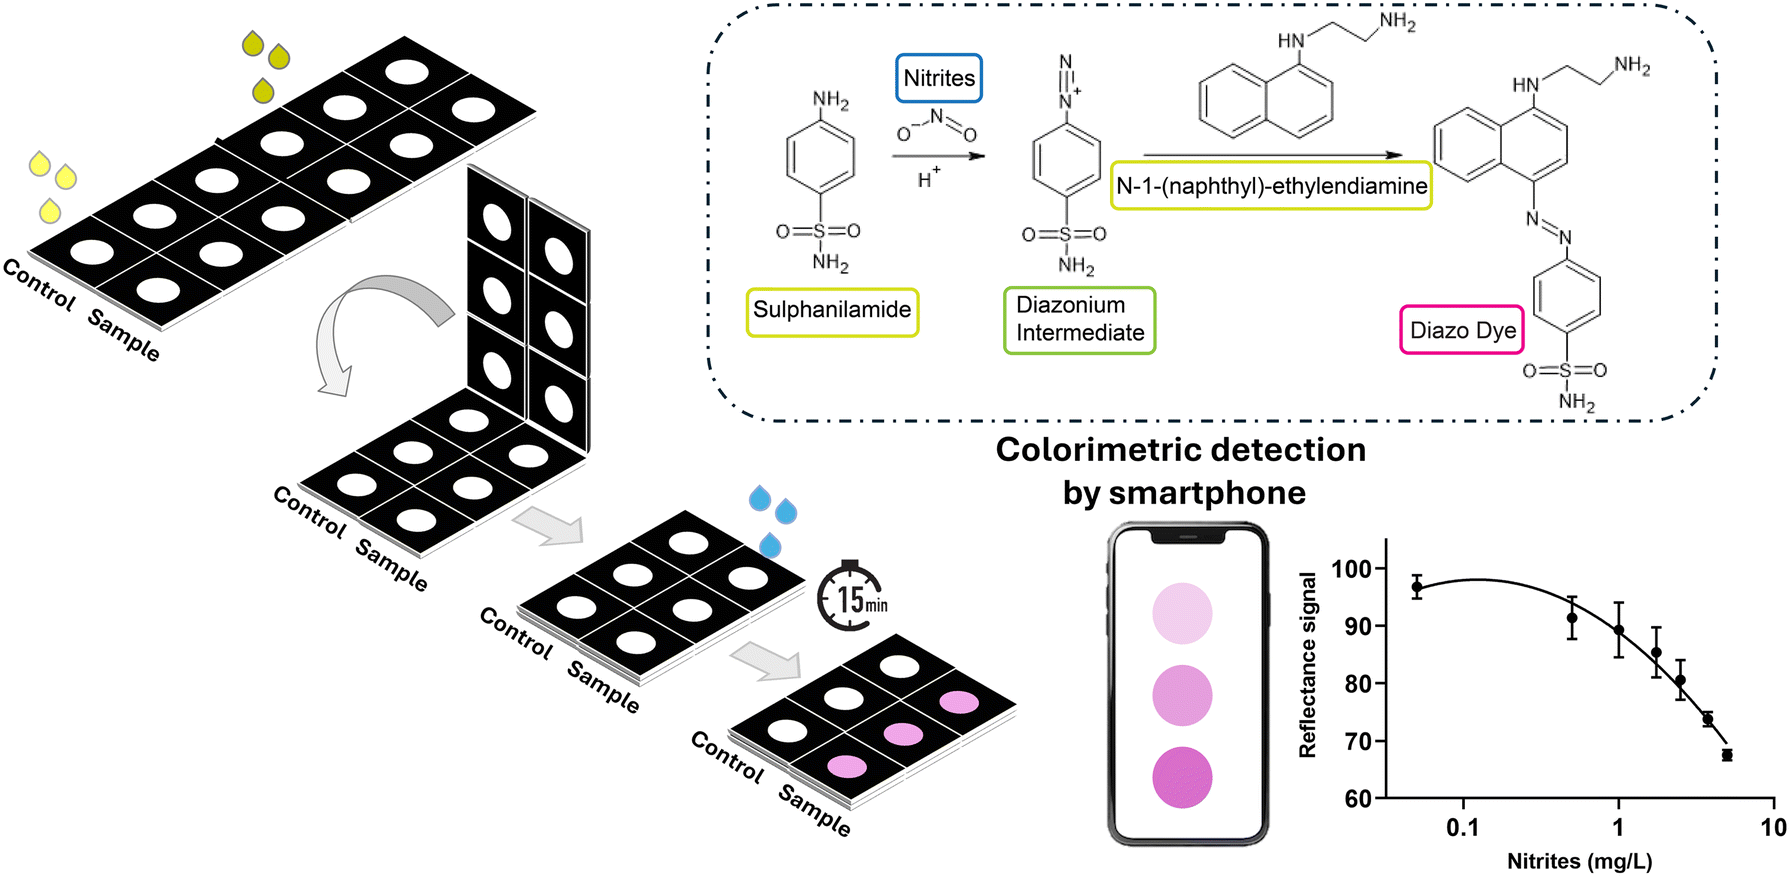 | ||
| Fig. 1 Schematic mechanism of the Griess reaction and the NitriPad assay principle with the optimized configuration. | ||
3.1 Experimental design and method optimization on paper
Different optimizations were performed to implement the Griess reaction on a user-friendly paper sensor for NO2− detection. Firstly, the method was scaled for the paper format by sequentially adding into each well of the paper sensor a 10 μL volume of SulfAA/NED solution in a ratio of 1![[thin space (1/6-em)]](https://www.rsc.org/images/entities/char_2009.gif) :1 and 15 μL of NaNO2 (concentration range from 0.05 to 5.0 mg L−1), and 15 μL of ddH2O for the control. The colorimetric reaction was monitored by incubating the analyte with the colorimetric reagents, SulfAA and NED, in a dark box at room temperature and by acquiring reflectance images with a OnePlus 6T smartphone camera every 5 min for the first 30 min, and every 15 min up to 2 h. The smartphone was used for reflectance measurements to implement the Griess reaction onto a paper-based sensing platform. As shown in Fig. S2,† the presence of NaNO2 produced a color change from colorless (white on paper) to pink visible by the naked eye, even immediately after the addition of the standard analyte solutions to the Griess reagents on paper. Images were analyzed in terms of brightness intensity with ImageJ software using the grayscale as a combination of the R (red), G (green), and B (blue) channels of the RGB system. To avoid differences in the signals due to background light interference, a control sample was tested for each experiment and data were used to normalize the signal of each analyte concentration tested. The normalized brightness intensity was used as an analytical signal, which decreases as the concentration of the analyte increases, as the reflectance signals are calculated in terms of brightness in the grayscale. This signal normalization allowed the robustness of the reflectance data to be improved in which reproducibility and precision are generally affected by light sources having different spectral characteristics. A first calibration curve for NaNO2 on paper was obtained after 15 min of incubation with a LOD of 0.16 mg L−1 (corresponding to 0.11 mg L−1 NO2−).
:1 and 15 μL of NaNO2 (concentration range from 0.05 to 5.0 mg L−1), and 15 μL of ddH2O for the control. The colorimetric reaction was monitored by incubating the analyte with the colorimetric reagents, SulfAA and NED, in a dark box at room temperature and by acquiring reflectance images with a OnePlus 6T smartphone camera every 5 min for the first 30 min, and every 15 min up to 2 h. The smartphone was used for reflectance measurements to implement the Griess reaction onto a paper-based sensing platform. As shown in Fig. S2,† the presence of NaNO2 produced a color change from colorless (white on paper) to pink visible by the naked eye, even immediately after the addition of the standard analyte solutions to the Griess reagents on paper. Images were analyzed in terms of brightness intensity with ImageJ software using the grayscale as a combination of the R (red), G (green), and B (blue) channels of the RGB system. To avoid differences in the signals due to background light interference, a control sample was tested for each experiment and data were used to normalize the signal of each analyte concentration tested. The normalized brightness intensity was used as an analytical signal, which decreases as the concentration of the analyte increases, as the reflectance signals are calculated in terms of brightness in the grayscale. This signal normalization allowed the robustness of the reflectance data to be improved in which reproducibility and precision are generally affected by light sources having different spectral characteristics. A first calibration curve for NaNO2 on paper was obtained after 15 min of incubation with a LOD of 0.16 mg L−1 (corresponding to 0.11 mg L−1 NO2−).
3.2 Optimization of the origami design and experimental procedure
To obtain a ready-to-use sensor, physical adsorption was evaluated to immobilize the Griess reagents on paper and the origami technique for the design of the device. Firstly, we immobilized the Griess reagents, SulfAA and NED, into the same well by creating a solution of SulfAA and NED with a 1:1 ratio and dispensing 10 μL of mix in each well of the PAD. After 1 h incubation at room temperature and in the dark, a color change was observed also by the naked eye in all the wells. Data analysis was performed by comparing the reflectance signals obtained in the wells in which the Griess reactants were immobilized together and the control wells with significant differences (from 8 to 22%) in the decrease of the reflectance signal (Fig. S3†). This is in accordance with previous studies, in which one of the main limitations of the Griess reagents is poor stability when single components are mixed.34–36 To minimize the Griess reagent degradation upon storage SulfAA and NED were immobilized on separate wells. To avoid pipetting and handling toxic solutions and simplify the user procedure, we implemented the origami approach, in which folding the paper sensor allows reagents' mixing and triggering of chemical reactions.37 By implementing the origami approach, the user only needs to add the sample, also with a disposable dropper to simplify the procedure. PADs were designed to contain a bottom and a top part, each consisting of an array of 3 × 2 wells for the immobilization of SulfAA and for NED. Three configurations A, B, and C, in which a 5 μL volume of SulfAA and 5 μL of NED, previously adsorbed on paper for 1 h at room temperature in the dark, were first explored and tested for nitrite detection. Configuration A was designed for PAD A to include SulfAA in the bottom wells and NED in the top ones. The optimized procedure involved sample addition (15 μL of 5.0 mg L−1 NaNO2) to the SulfAA wells, then the folding of the NED part and the acquisition of the reflectance signals after 0, 5, 10, 15, 20, and 30 min of incubation at room temperature and in the dark with the OnePlus 6 smartphone. The same configuration was chosen for PAD B, except that the NED part was first folded over the SulfAA one, and then the sample was added to the reverse NED wells. No color changes were observed up to a period of 4 hours (Fig. S4†). PAD C followed the same procedure used for PAD B, but with SulfAA immobilized onto the top wells, and NED onto the bottom ones. A change in the color of the sample wells was visible immediately after sample addition (15 μL of 5.0 mg L−1 NaNO2), and pictures were taken after 0, 5, 10, 15, 20, and 30 minutes of incubation at room temperature (22 °C) and in the dark.
According to the reaction mechanism, the sequential reaction of SulfAA with nitrite ions led to the formation of the diazonium intermediate, which spontaneously reacts with the NED coupling reagent to form a diazo-colored compound.34,36 Therefore, configuration C was chosen since it provided the highest color variation for the wells containing 5.0 mg L−1 NaNO2 (about 38% decrease in the reflectance signal vs. a 24% decrease obtained with configuration A) and the experimental procedure was very easy, making it an accessible tool for any user (Fig. S5†). Since the sample volume is a critical aspect of the origami technique, acting not only as an analyte but also as a carrier fluid with the task of wetting all the paper layers and allowing mixing of the reagents, the total volume and the ratio between the Griess reagents and analyte were also studied. We evaluated different reagent:analyte ratios (i.e., 2:3 and 1:1 ratio).
We tested the 2:3 ratio using 5 μL of SulfAA, 5 μL of NED, and 15 μL of analyte, and 10 μL of SulfAA, 10 μL of NED, and 30 μL of analyte. We also evaluated the 1:1 ratio by adding 10 μL of SulfAA, 10 μL of NED, and 20 μL of analyte. Quantitative elaboration of the obtained data (Fig. S6 and S7†) confirmed that the optimal ratio of the Griess reactants/sample to ensure wettability of the paper layers and provide higher sensibility was 2:3 and the total volume was 50 μL.
3.3 Analytical performance of the NitriPad
After optimizing the design and the optimal conditions for the colorimetric reaction on paper, the sensitivity of the method was assessed by creating a calibration curve for NaNO2 using the NitriPad composed of a 7 × 3 well array for the NED part and the SulfAA part. After the adsorption of the Griess reactants, adhesive tape was applied to the back side of the NED part, and then the SulfAA part was folded over the NED part. 30 μL of NaNO2 standard solutions (0.05, 0.50, 1.00, 1.75, 2.50, 3.75, 5.00 mg L−1) and the control were added to the wells and incubated in the dark at room temperature (22 °C). After 0, 5, 10, 15, 20, and 30 minutes, images were acquired with the smartphone, and reflectance signals were extracted and analyzed as described in the Experimental section. The colorimetric reaction started immediately after the addition of the standard solutions, and no significant difference was observed after 10, 15, 20, and 30 minutes of incubation (Fig. 2). Therefore the incubation time of 15 minutes was chosen as the best compromise to achieve the best sensitivity with a rapid procedure (Table S1†).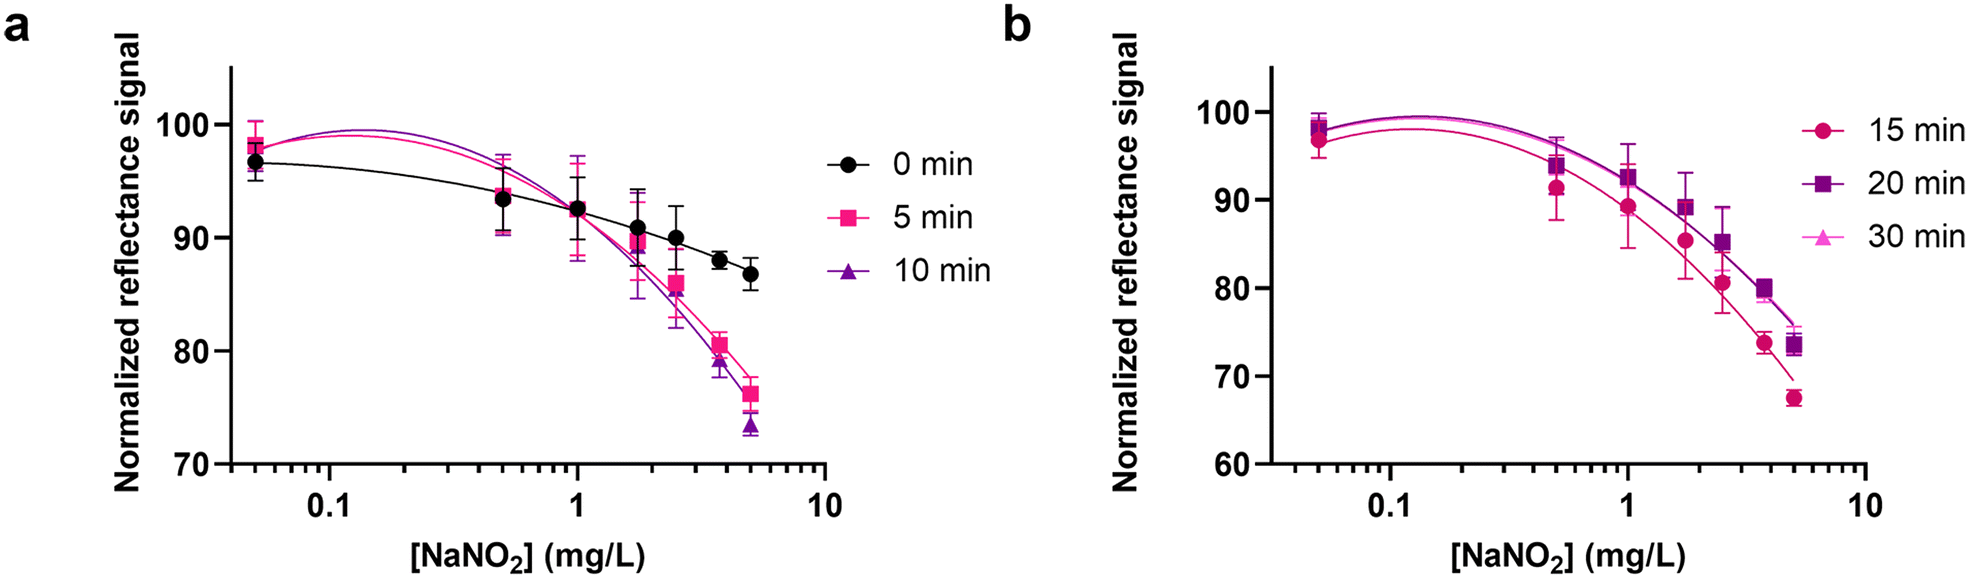 | ||
| Fig. 2 (a) Calibration curve for NaNO2 obtained at 0, 5 and 10 min of incubation in the dark, at RT and (b) at 15, 20 and 30 min acquiring the reflectance signals with the OnePlus 6 smartphone. | ||
A LOD of 0.40 mg L−1 NaNO2 (corresponding to 0.27 mg L−1 NO2−) and a LOQ of 1.67 of NaNO2 (corresponding to 1.11 mg L−1 NO2−) were obtained using the optimized conditions.
Compared to other paper-based methods,32,34,35,38,39 the NitriPad is simple and cost-effective, the preparation of the device does not require any complex apparatus, and no instrumentation is needed for signal detection. This is particularly beneficial for field applications where advanced equipment may not be available. This is a crucial feature for early detection and prevention of nitrite-related issues in environmental monitoring and clinical diagnostics. Klasner et al.39 developed a μPAD for detecting nitrite in saliva samples with a LOD of 5 μM, which is comparable to our sensor. Meanwhile, the μPAD presented by Jayawardane et al. lowered the LOD for nitrites to 1.0 μM.20 However, their method includes the manual addition of fresh Griess reagents to the paper PAD, therefore the end-user should handle chemicals, thus complicating the workflow for non-skilled personnel. In addition, most of the reported sensors40 do not include a calibration curve, therefore, despite having promising analytical performance, separate sensors should be used to construct the calibration curve for achieving quantitative results. Conversely, the proposed paper sensor can be intended for widespread applications in the environmental and agro-food fields, as well as for the analysis of biological fluids.
3.4 Real samples and recovery studies
The performance of the NitriPad was evaluated with real samples of drinking water including commercial bottled water in which the declared nitrite ion content was <0.002 (Fig. 3). | ||
| Fig. 3 Calibration curves for NaNO2 obtained with the NitriPad at 15 min and bottled water samples spiked with different NaNO2 concentrations (0.5, 1, 2.5 mg L−1). | ||
Samples were spiked by adding three different concentrations (0.5, 1.0, and 2.5 mg L−1) of NaNO2, and recoveries, calculated as described in the Experimental section, were 110, 87 and 102%, respectively, thus demonstrating the applicability of the sensor for drinking water (Table 1).
| Added (mg L−1) | Found (mg L−1) | Recovery (%) | RSD (%) |
|---|---|---|---|
| 0.50 | 0.60 | 110 | 5 |
| 1.00 | 0.87 | 87 | 9 |
| 2.50 | 2.60 | 102 | 7 |
3.5 Selectivity and stability studies
Selectivity studies were performed to evaluate the specificity of the NitriPad sensor. As shown in Fig. 4a, the effect of potential interferents including ions (NaCl, MgSO4, K2HPO4, K2CO3, KNO3, MgCl2, CaCl2, FeCl3, FeCl2) and compounds present in environmental or clinical matrices (urea, glucose and BSA) was compared to NaNO2 (2.5 mg L−1) used as CTR(+), and the results were normalized with respect to the ddH2O solution (CTR−). Only Fe3+ was shown to be a potential interferent with a decreased reflectance signal of about 20 ± 4%. This result is in line with tolerance ions studies.41 The effect of pH was also evaluated with NaNO2 solutions (1.75 mg L−1) at pH 5.0, 7.0, and 9.0 (Fig. 4b). Decreased reflectance signals of about 5.7 ± 1.3% and 2.7 ± 1.5% were observed at pH 7.0 and 5.0, respectively, confirming that nitrous acid is the predominant species at pH 5.0.41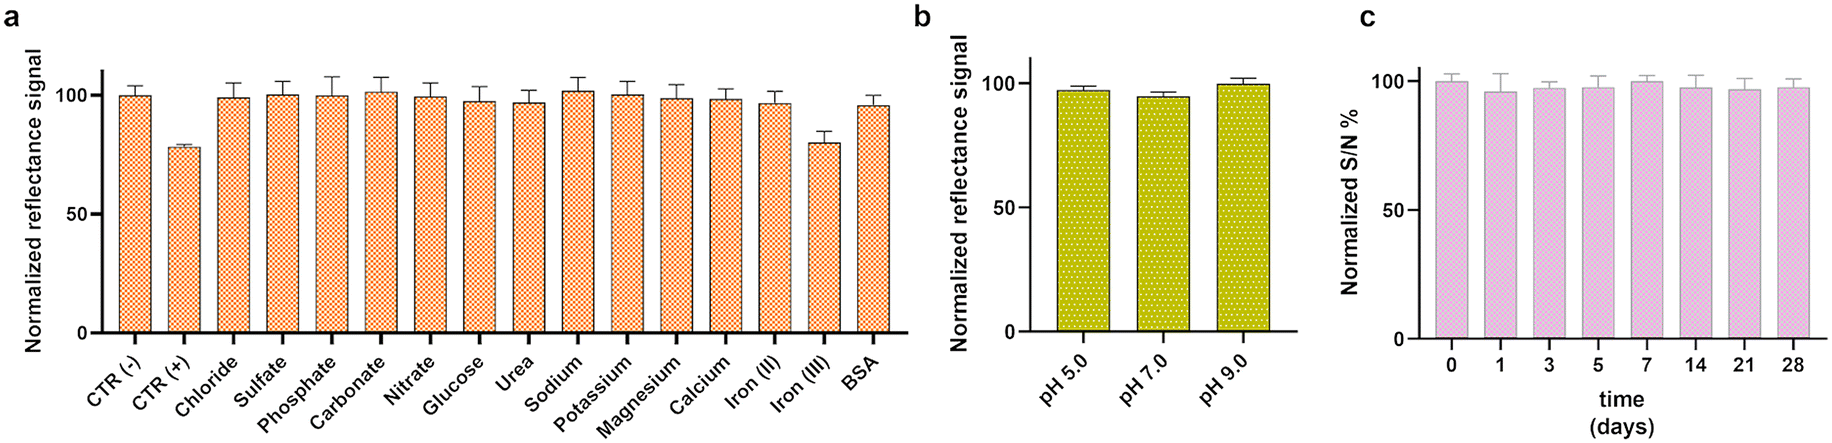 | ||
| Fig. 4 a) Selectivity studies of the NitriPad with different interferents (2 mM) compared to 2.50 mg L−1 NaNO2 (CTR+). Reflectance signals are normalized to the CTR(−), b) pH effects on the NitriPad, and c) stability of the NitriPad stored at +4 °C. Reflectance signals are normalized to day 0. | ||
NitriPad storage stability was evaluated during storage at +4 °C. The analytical performance of the NitriPad method for the detection of NaNO2 was assessed by performing the assay after 1, 3, 5, 7, 14, 21, and 28 days of storage, acquiring the colorimetric images, and normalizing the reflectance signals to the values obtained for the freshly prepared sensing PADs (day 0). As shown in Fig. 4, the assay provided excellent results also after 28 days of storage, with a responsiveness of 98 ± 3.3% compared to the test performed on day 0. This level of stability is notably superior to other paper-based sensors, which often exhibit a significant decrease in sensitivity over shorter time frames.20 This result supports the future applicability of the sensor even when shipping to remote locations is required.
Additionally, the NitriPad demonstrated excellent reproducibility with a relative standard deviation (RSD%) of about 1.6%, which has been investigated using paper PADs produced on the same day and kept at +4 °C using an intermediate concentration of NaNO2 (1.0 mg L−1). The repeatability was evaluated using PADs fabricated the same day, obtaining an impressive RSD% of about 0.2%.
The results of the paper sensor were compared with those obtained with a commercial kit (Nitrite/Nitrate Colorimetric Test, Roche) performed with 96 well-plates and a benchtop spectrophotometer and, according to the F-test, the variances were not significantly different at a 95% confidence level (Table S2†). We also performed a paired t-test showing agreement between the results at a 95% confidence level.
3.6 Sustainability assessment
A fundamental aspect to consider in the development of a new analytical method is sustainability since it ensures that a new analytical method is not only effective but also environmentally friendly, economically feasible, and aligned with broader societal goals. We evaluated the sustainability of the NitriPad through the 12 principles of white analytical chemistry (WAC) using the RGB 12 algorithm.42 The algorithm analyzes the analytical efficiency, the compliance with the green analytical chemistry, and the productivity, together with the practical/economic efficiency. These parameters are represented as the primary colors red, green, and blue components, respectively, in the algorithm, and they assess the overall whiteness of the method. The more saturation in each primary color, the higher the whiteness of the methods, which means an optimal and consistent analytical method. A darker final color reflects the lower sustainability of the method. The NitriPad method was compared to 5 previously reported microfluidic PADs, all relying on colorimetric detection of nitrites using the Griess reactants using a scanner for the acquisition of the colorimetric signals. Data (Tables S3–S5†) and explanation of the RGB score assessment criteria are presented in the ESI.† The sustainability of the NitriPad showed a total whiteness score of 71.1% (Table S5†). The highest score is reached during the blue principles analysis, which considers the feasibility of the method. This method only requires an office wax printer for the preparation of the NitriPad and a smartphone for the detection of the colorimetric signal and achieved a blue score of 93.8%. Additionally, the NitriPads are stable at +4 °C and are safe for the user since all the reagents are immobilized on paper and only the sample is added by the end-user.Conclusions
In this work, an origami paper-based sensor for the quantitative detection of nitrite has been developed using a modified version of the Griess reaction. It is based on a colorimetric reaction, which produces a colored compound visible to the naked eye, and the intensity of the color is proportional to the presence of nitrite ions. The origami technique was chosen to separate the two Griess reagents before performing the test. This technique enhances the portability of the sensor, the sensitivity of the system, and the efficiency of the interaction between the reactant species and the target analyte. The use of a smartphone camera for the acquisition of reflectance signals creates a portable and easy-to-use system that can be used by non-skilled personnel and for on-site analysis.An important key strength of this work is the stability. The performance of our sensor is maintained at 98% for at least 1 month when stored at +4 °C. To the best of our knowledge, this is the first prototype of a paper-based sensor interfaced with a smartphone camera for the detection of nitrite with a limit of detection suitable for analysis of drinking water and storage stability exceeding 1 month. These findings underscore the NitriPad's potential for long-term storage without significant loss of sensitivity, making it a promising tool for practical nitrite detection applications.
The NitriPad represents a valuable tool for the rapid and reliable monitoring of nitrites across a range of applications, including water quality assessment in agricultural runoff, wastewater treatment, and surface and drinking water. Additionally, it represents a versatile nitrite detection tool, since its applicability can be extended to the analysis of biological fluids, such as urine, saliva, and sweat for point-of-care diagnostics, highlighting its potential impact in both environmental and health-related contexts.
Data availability
The article presents reflectance measurements obtained with a OnePlus 6 smartphone and elaborated with ImageJ and Prism v.8 software. All raw data and corresponding images are available at the authors' laboratory at the University of Bologna.Author contributions
Conceptualization, D. G. and E. M.; methodology, D. G., R. J. R. A., F. B. and R. D.; validation, M. M. C. and D. G.; formal analysis, D. G., F. N. and M. M. C.; investigation D. G., M. M. C. and E. M.; resources, E. M.; data curation, M. M. C. and D. G.; writing – original draft preparation, D. G.; writing – review and editing, M. M. C. and E. M.; visualization, D. G. and M. M. C.; supervision, M. M. C. and E. M.; funding acquisition, E. M. All authors have given approval to the final version of the manuscript.Conflicts of interest
There are no conflicts to declare.Acknowledgements
This study was, in part, carried out within the Agritech National Research Center and received funding from the European Union Next-Generation EU National Recovery and Resilience Plan (NRRP), Mission 04 Component 2, investment 1.4-D.D. 1032 June 17, 2022, CN00000022. Part of this work was also funded by the European Union's Horizon Europe project FARMWISE under GA No. 101135533 and by Project PRIN SMARTMASK4CF – code 2022XTCTWH – CUP J53D23007680006 funded by the Italian Ministry of University and Research. D. G. acknowledges the Ph.D. program on green topics (PON “Research and Innovation” 2014-2020) funded by FSE REACT-EU.References
- S. Singh, A. G. Anil, V. Kumar, D. Kapoor, S. Subramanian, J. Singh and P. C. Ramamurthy, Chemosphere, 2022, 287, 131996 CrossRef CAS PubMed.
- F. Serio, P. P. Miglietta, L. Lamastra, S. Ficocelli, F. Intini, F. De Leo and A. De Donno, Sci. Total Environ., 2018, 645, 1425–1431 CrossRef CAS PubMed.
- B. Singh and E. Craswell, SN Appl. Sci., 2021, 3, 518 CrossRef.
- M. Moorcroft, Talanta, 2001, 54, 785–803 CrossRef CAS PubMed.
- World Health Organization, Guidelines for drinking-water quality: fourth edition incorporating the first and second addenda, World Health Organization, Geneva, 2022, Licence: CC BY-NC-SA 3.0 IGO., Geneva, 2022 Search PubMed.
- H. Li, C. J. Meininger and G. Wu, J. Chromatogr. B:Biomed. Sci. Appl., 2000, 746, 199–207 CrossRef CAS PubMed.
- J. E. Melanson and C. A. Lucy, J. Chromatogr. A, 2000, 884, 311–316 CrossRef CAS PubMed.
- R. Michalski and I. Kurzyca, Pol. J. Environ. Stud., 2006, 15, 5–18 CAS.
- D. Tsikas, J. Chromatogr., B, 2007, 851, 51–70 CrossRef CAS PubMed.
- M. Shariati-Rad, M. Irandoust and M. Haghighi, J. Chemom., 2014, 28, 93–99 CrossRef CAS.
- J. B. Fox, Anal. Chem., 1979, 51, 1493–1502 CrossRef CAS.
- L. Váradi, M. Breedon, F. F. Chen, A. Trinchi, I. S. Cole and G. Wei, RSC Adv., 2019, 9, 3994–4000 RSC.
- Y. Thipwimonmas, J. Jaidam, K. Samoson, V. Khunseeraksa, A. Phonchai, A. Thiangchanya, K. H. Chang, A. F. L. Abdullah and W. Limbut, Chemosensors, 2021, 9, 161 CrossRef CAS.
- J. Sun, X. Zhang, M. Broderick and H. Fein, Sensors, 2003, 3, 276–284 CrossRef CAS.
- M. Arvand, N. Arjmandi, M. Shakibaie, S. Jafarinejad, R. Shahghadami and P. Sasanpour, J. Phys. D: Appl. Phys., 2020, 53, 355403 CrossRef CAS.
- S. A. Klasner, A. K. Price, K. W. Hoeman, R. S. Wilson, K. J. Bell and C. T. Culbertson, Anal. Bioanal. Chem., 2010, 397, 1821–1829 CrossRef CAS PubMed.
- T. M. G. Cardoso, P. T. Garcia and W. K. T. Coltro, Anal. Methods, 2015, 7, 7311–7317 RSC.
- B. M. Jayawardane, S. Wei, I. D. McKelvie and S. D. Kolev, Anal. Chem., 2014, 86, 7274–7279 CrossRef CAS PubMed.
- S. A. Bhakta, R. Borba, M. Taba, C. D. Garcia and E. Carrilho, Anal. Chim. Acta, 2014, 809, 117–122 CrossRef CAS PubMed.
- B. M. Jayawardane, S. Wei, I. D. McKelvie and S. D. Kolev, Anal. Chem., 2014, 86, 7274–7279 CrossRef CAS PubMed.
- Y.-T. Tai, C.-Y. Cheng, Y.-S. Chen and F.-H. Ko, Sens. Actuators, B, 2022, 369, 132298 CrossRef CAS.
- D. Li, Y. Ma, H. Duan, W. Deng and D. Li, Biosens. Bioelectron., 2018, 99, 389–398 CrossRef CAS PubMed.
- C.-Y. Hou, L.-M. Fu, W.-J. Ju and P.-Y. Wu, Chem. Eng. J., 2020, 398, 125573 CrossRef CAS.
- Z. Geng, Y. Miao, G. Zhang and X. Liang, Sens. Actuators, A, 2023, 349, 114056 CrossRef CAS.
- L. Cevenini, M. M. Calabretta, A. Lopreside, G. Tarantino, A. Tassoni, M. Ferri, A. Roda and E. Michelini, Anal. Bioanal. Chem., 2016, 408, 8859–8868 CrossRef CAS PubMed.
- J. T. Heggestad, D. S. Kinnamon, J. Liu, D. Y. Joh, C. M. Fontes, Q. Wei, A. Ozcan, A. M. Hucknall and A. Chilkoti, Methods Mol. Biol., 2022, 2393, 343–365 CrossRef CAS PubMed.
- S. Soares and F. R. P. Rocha, Microchem. J., 2021, 162, 105862 CrossRef CAS.
- V. B. dos Santos, L. B. Ayres, H. S. de Sousa, C. D. Garcia and W. Toito Suarez, Sens. Diagn., 2024, 3, 1467–1475 RSC.
- I. S. Resque, V. B. dos Santos and W. T. Suarez, Chem. Pap., 2019, 73, 1659–1668 CrossRef CAS.
- F. T. S. M. Ferreira, R. B. R. Mesquita and A. O. S. S. Rangel, Talanta, 2020, 219, 121183 CrossRef CAS PubMed.
- L. P. dos S. Benedetti, V. B. dos Santos, T. A. Silva, E. B. Filho, V. L. Martins and O. Fatibello-Filho, Anal. Methods, 2015, 7, 4138–4144 RSC.
- P. Rajasulochana, Y. Ganesan, P. S. Kumar, S. Mahalaxmi, F. Tasneem, M. Ponnuchamy and A. Kapoor, Environ. Res., 2022, 208, 112745 CrossRef CAS PubMed.
- M. I. Karayannis, E. A. Piperaki and M. M. Maniadaki, Anal. Lett., 1986, 19, 13–23 CrossRef CAS.
- S. A. Bhakta, R. Borba, M. Taba, C. D. Garcia and E. Carrilho, Anal. Chim. Acta, 2014, 809, 117–122 CrossRef CAS PubMed.
- T. M. G. Cardoso, P. T. Garcia and W. K. T. Coltro, Anal. Methods, 2015, 7, 7311–7317 RSC.
- S. C. Pai, Y. T. Su, M. C. Lu, Y. Chou and T. Y. Ho, ACS ES&T Water, 2021, 1, 1524–1532 Search PubMed.
- N. Colozza, V. Caratelli, D. Moscone and F. Arduini, Biosensors, 2021, 11, 328 CrossRef CAS PubMed.
- M. Arvand, N. Arjmandi, M. Shakibaie, S. Jafarinejad, R. Shahghadami and P. Sasanpour, J. Phys. D: Appl. Phys., 2020, 53, 355403 CrossRef CAS.
- S. A. Klasner, A. K. Price, K. W. Hoeman, R. S. Wilson, K. J. Bell and C. T. Culbertson, Anal. Bioanal. Chem., 2010, 397, 1821–1829 CrossRef CAS PubMed.
- K. Khachornsakkul, R. Del-Rio-Ruiz, H. Creasey, G. Widmer and S. R. Sonkusale, ACS Sens., 2023, 8, 4364–4373 CrossRef CAS PubMed.
- M. Irandoust, M. Shariati-Rad and M. Haghighi, Anal. Methods, 2013, 5, 5977 RSC.
- P. M. Nowak, R. Wietecha-Posłuszny and J. Pawliszyn, TrAC, Trends Anal. Chem., 2021, 138, 116223 CrossRef CAS.
Footnote |
| † Electronic supplementary information (ESI) available. See DOI: https://doi.org/10.1039/d4sd00308j |
| This journal is © The Royal Society of Chemistry 2025 |