
 Open Access Article
 This Open Access Article is licensed under a
 Creative Commons Attribution 3.0 Unported Licence
Fuelling hydrogen futures? A trust-based model of social acceptance†
Joel A.
Gordon
 *ab,
Nazmiye
Balta-Ozkan
a,
Anwar Ul
Haq
c and
Seyed Ali
Nabavi
a
*ab,
Nazmiye
Balta-Ozkan
a,
Anwar Ul
Haq
c and
Seyed Ali
Nabavi
a
aFaculty of Engineering and Applied Sciences, Cranfield University, Bedford, UK. E-mail: joel.gordon@mespom.eu
bInternational Institute for Industrial Environmental Economics, Lund University, Lund, Sweden
cNewcastle Business School, Northumbria University, London, UK
First published on 2nd April 2025
Abstract
Public trust plays a fundamental role in shaping national energy policies in democratic countries, as exemplified by nuclear phase-out in Germany following the Fukushima accident. While trust dynamics have been explored in different contexts of the energy transition, few studies have attempted to quantify the influence of public trust in shaping social acceptance and adoption potential. Moreover, the interaction between public trust and perceived community benefits remains underexplored in the literature, despite the relevance of each factor to facilitating social acceptance and technology uptake. In response, this quantitative analysis closes a parallel research gap by examining the antecedents of public trust and perceived community benefits in the context of deploying hydrogen heating and cooking appliances across parts of the UK housing stock. Drawing on results from a nationally representative online survey (N = 1845), the study advances insights on the consumer perspective of transitioning to ‘hydrogen homes’, which emerged as a topical and controversial aspect of UK energy policy in recent years. Partial least squares structural equation modelling and necessary condition analysis are undertaken to assess the predictive capabilities of a trust-based model, which incorporates aspects of institutional, organisational, interpersonal, epistemic, and social trust. Regarding sufficiency-based logic, social trust is the most influential predictor of public trust, whereas trust in product and service quality corresponds to the most important necessary condition for enabling public trust. Nevertheless, trust in the government, energy sector, and entities involved in research & development are needed to facilitate and strengthen public trust. Overall, this study enriches scholarly understanding of how public trust may shape prospects for trialling novel low-carbon technologies, highlights the need for segment-specific consumer engagement, and advances scholarly understanding of the innovation-decision process in the context of net-zero pathways. As policymakers approach critical decisions on the portfolio of technologies needed to support residential decarbonisation, public trust will prove fundamental to fuelling hydrogen-based energy futures.
1 Introduction
In recent decades, hydrogen has been increasingly discussed as a critical component of accelerating net-zero ambitions,1–3 following earlier hype cycles associated with the global ‘hydrogen economy’4 since the 1970s.5–7 Visions for hydrogen-based energy futures, as discussed in the literature during the mid-2000s,8–11 have gradually morphed into more tangible expectations for developing the global hydrogen supply chain12 to support multi-sectoral decarbonisation targets.13–16 Growing policy commitment towards scaling up hydrogen technologies is mirrored by an upsurge in national hydrogen strategies since the late 2010s.17–20In December 2017, Japan became the first country to publish a hydrogen strategy,18 following long-held policy aspirations for developing a national hydrogen economy.21,22 Subsequently, more than 60 countries have launched national hydrogen strategies or developed roadmaps.19 Notably, the European Union (EU) is seeking a global leadership role following the release of its hydrogen strategy for a climate-neutral Europe in 2020.23 However, there are also notable differences regarding ambitions and pathways for establishing hydrogen economies,24,25 as further discussed in respect to the UK and five other country cases in Section 2.
Notably, the EU strategy identified objectives for three phases, with the second phase commencing in 2025‡ ahead of the final phase from 2030 onwards.23 By contrast, the UK Hydrogen Strategy (August 2021)26 specified illustrative hydrogen demand forecasts for 2030 and 2035 across four key sectors: industry (10–21 TW h and 25–45 TW h); power (0–10 TW h and 10–30 TW h); transport (0–6 TW h and 20–45 TW h), and heat in buildings (<1 TW h and 0–45 TW h). Additionally, the strategy stated that a policy decision on ‘hydrogen homes’ – composed of hydrogen-fuelled technologies for space heating, hot water, and cooking27 – should be taken by 2026,26 which has been affirmed in recent commitments.28 Critically, around 84% of UK homes are connected to the national gas grid,29,30 with the residential sector contributing towards 16% of national greenhouse gas (GHG) emissions (97% carbon dioxide).31 Accordingly, the UK Heat and Buildings Strategy (October 2021) underscored the need to phase out the installation of natural gas boilers by 2035 in support of aspirations for net-zero buildings by 2050.32
Against the backdrop of shifting policy perceptions regarding the role of hydrogen homes in the UK's low-carbon future, this study presents a consumer-oriented perspective;33 focused on understanding the antecedents of and interactions between perceived community benefits, domestic hydrogen acceptance, and willingness to adopt a hydrogen home before 2030. Critically, the conceptual framework tested in this study departs from previous approaches33,34 by modelling public trust, technology perceptions, safety perceptions, and production perceptions as predictors of perceived community benefits (economic, social, and environmental benefits). In turn, the following research questions are tackled by employing partial least squares structural equation modelling (PLS-SEM) and necessary condition analysis (NCA):
• What are the antecedents of public trust in the domestic hydrogen transition?
• Do the antecedents of public trust differ across segments of the UK population?
• What are the antecedents of perceived community benefits in the domestic hydrogen transition?
• What is the relationship between perceived community benefits, domestic hydrogen acceptance, and consumer willingness to adopt a hydrogen home before 2030?
Section 2 further contextualises the study in relation to the emergence of national hydrogen economies and international activities around residential hydrogen, before outlining the methodology in Section 3. Next, Section 4 reviews the literature and formulates hypotheses which comprise the conceptual framework presented in Section 5. Section 6 reports the modelling results from PLS-SEM and NCA, while Section 7 discusses the findings and their implications for transitioning to hydrogen homes. Lastly, Section 8 concludes by outlining a future research agenda and highlighting key lessons for supporting public trust in low-carbon, hydrogen-based energy systems.
2 Recent developments in hydrogen technology and policy for the residential sector
Accelerating heat decarbonisation for the residential sector is among one of the foremost environmental imperatives and challenges of climate policy.35 According to the Intergovernmental Panel on Climate Change (IPCC), the building sector accounted for 21% of global greenhouse gas (GHG) emissions in 2019,36 while the International Energy Agency (IEA) estimates that the operations of buildings accounts for 26% of global energy-related emissions.37 Moreover, the residential sector is the largest contributor to energy sector emissions globally with a 12.5% share, attributed mainly to fossil fuel heating and to a lesser extent, gas cooking.38Table 1 reflects these trends across six major economies (Australia, Canada, Germany, Japan, the Netherlands, and the UK) wherein, on average, natural gas and oil accounted for 70% of residential heating in 2020 (SD = 0.12). Crucially, gas heating is significantly more prevalent, averaging 55% across the sample compared to 16% for oil, with Japan (50%) and Germany (25%) representing outliers in this category. Accordingly, each country has a strong incentive to accelerate residential decarbonisation and has explored the possibility of supporting this imperative through low-carbon hydrogen technologies.
| Country | Launch of national hydrogen strategy | Most recent update to national hydrogen strategy | Proportion of natural gas in residential heating (2020) | Proportion of oil in residential heating (2020) | Need to decarbonise the residential sector | Focus on hydrogen heating and technology pathway |
|---|---|---|---|---|---|---|
| a Source: authors' compilation based on ref. 19, 42 and 43. b 59–70% natural gas and oil in residential heating = high. c 71–80% natural gas and oil in residential heating = very high. d >80% natural gas and oil in residential heating = extremely high. | ||||||
| Australia | Nov-2019 | Sep-2024 | 58% | 1% | Highb | Decreasing and limited focus; fuel cells |
| Canada | Dec-2020 | Apr-2024 | 53% | 7% | High | Sustained and moderate focus; fuel cells and/or boilers |
| Germany | Jun-2020 | Jul-2023 | 46% | 25% | Very highc | Limited focus but openness; fuel cells and/or boilers |
| Japan | Dec-2017 | Jun-2023 | 12% | 50% | High | Strong and sustained focus; fuel cells |
| Netherlands | Apr-2020 | Jul-2021 | 85% | 1% | Extremely highd | Strong and sustained focus; fuel cells and/or boilers |
| UK | Aug-2021 | Dec-2023 | 75% | 9% | Extremely high | Previously strong but declining focus; boilers |
At present, the Netherlands and Japan have the strongest commitments towards deploying hydrogen-fuelled appliances for home heating, both from a technological and policy perspective (see Table 1). Nevertheless, contingent on both international and national developments in the hydrogen and broader energy landscape, other countries such as the UK and Canada may scale up investments and policy support for residential hydrogen in the future. Following recent studies,39–41 the following sub-sections outline the latest developments in hydrogen technology and policy across the countries reported in Table 1, with Section 2.6 providing a more in-depth look at the UK.
2.1 Australia
Australia's National Hydrogen Strategy (November 2019) identified domestic and commercial heating as a potential use case,20 as reflected by pioneering social acceptance research on residential hydrogen.44–46 However, following the September 2024 policy update,47 electrification is now regarded as the main technology pathway for decarbonising the building stock. Nevertheless, the government maintains regulatory support for enabling local hydrogen blending projects. At present, possibilities for larger scale deployment of hydrogen home appliances remains heavily contingent on whether technology advancements are realised in the upcoming years.47 Although Australian households remain highly gas dependent, insights from this study are currently more relevant to other hydrogen uses cases such as fuel cell vehicles and alternative technologies such as heat pumps.2.2 Canada
The Canadian national hydrogen strategy (December 2020) identified a potential role for hydrogen in residential decarbonisation, through blending with natural gas (up to 20% by volume) or as a long-term replacement fuel supplied via dedicated hydrogen pipelines.48 In October 2022, the Canadian-based energy company ATCO started blending 5% hydrogen into the local gas grid at Fort Saskatchewan, which serves around 2100 customers.49 Furthermore, ATCO's Energy Discovery Centre aims to become the first building in North America to be heated by 100% hydrogen. Hydrogen pilot projects for residential and commercial heating are also underway in Alberta and Ontario, with the most recent (May 2024) progress report on Hydrogen Strategy for Canada maintaining ambitions to explore the feasibility of both hydrogen blending and dedicated hydrogen infrastructure for heat decarbonisation purposes.492.3 Germany
Germany's national hydrogen strategy (June 2020) expressed a degree of openness regarding the long-term potential of hydrogen heating, with Measure 21 noting the importance to integrate electricity, heat, and gas infrastructure to accelerate decarbonisation,50 while pathways for hydrogen fuel cells and boilers have been discussed in the literature.51–53 Notably, Measure 18 of the strategy focused on extending the government's program for highly efficient fuel-cell heating systems, while Measure 19 referenced the ambition to support funding for ‘hydrogen readiness’ installations as part of the Combined Heat and Power Act.50 However, the July 2023 update to Germany's national hydrogen strategy sees a limited role for hydrogen in residential applications during the current decade, with activities restricted to pilot projects.54 Nevertheless, hydrogen fuel cells and boilers are recognised as a potentially necessary alternative for buildings that cannot be electrified efficiently; provided there is sufficient hydrogen supply and demand at the local level which is also cost-effective.Overall, the German government acknowledges the potential for hybrid heating systems in niche locations, alongside a role for hydrogen in supplying heat networks, while otherwise taking a cautious approach towards hydrogen heating.54 At the same time, it should be noted that the role of hydrogen heating remains highly politicised, with the green party opposing this option whereas the liberal party is seen to hold a more technology-neutral perspective.55
2.4 Japan
Japan's position as a pioneer in hydrogen fuel cell technology56,57 is reflected by its national program for residential fuel cell development, with the domestically produced ENE-FARM co-generation system providing electricity and hot water.18 As of June 2021, around 400![[thin space (1/6-em)]](https://www.rsc.org/images/entities/char_2009.gif) 000 ENE-FARM units had been deployed in Japan, with the government setting an ambitious target of 5.3 million installations by 2030.58 In June 2023, the government updated its hydrogen strategy and affirmed its commitment to scaling up the deployment of household fuel cells by approximately ten-fold by 2030 through cost reductions and supporting policy mechanisms,59 such as participation in the ‘supply-demand adjustment market’ for nationwide load balancing.60
000 ENE-FARM units had been deployed in Japan, with the government setting an ambitious target of 5.3 million installations by 2030.58 In June 2023, the government updated its hydrogen strategy and affirmed its commitment to scaling up the deployment of household fuel cells by approximately ten-fold by 2030 through cost reductions and supporting policy mechanisms,59 such as participation in the ‘supply-demand adjustment market’ for nationwide load balancing.60
Given ambitions for scaling up the deployment of ENE-FARM units, technology developments in Japan are highly significant in the context of global residential decarbonisation policy. With commercial deployment already underway and policy targets in place, fuel cells may prove a more techno-economically and socio-politically feasible deployment pathway in Japan compared to hydrogen boilers (and cookers) in countries such as the UK and Netherlands (see Section 2.5 and 2.6).
2.5 The Netherlands
The Dutch hydrogen strategy (April 2020) adopted a multi-sectoral focus on hydrogen applications for industrial, residential, and transport sectors; highlighting the long-term potential of hydrogen heating and need to scale up pilot projects before 2030.61 In June 2022, the Minister of Climate and Energy expressed further support for using hydrogen as a replacement for gas heating,62 with the new (right-wing) Dutch government affirming its ambitions to scale up hydrogen and carbon dioxide pipelines.63 Notably, in July 2024, the government reversed the mandate for replacing existing gas boilers with heat pump installations by 2026,64 reflecting growing political advocacy for preserving national gas infrastructure by switching to green gases (i.e. hydrogen and biomethane).65Policy support has been reflected through the scaling up of hydrogen pilot projects in select locations,66–68 with increasing discussions around hybrid solutions wherein a heat pump and hydrogen boiler are integrated into a smart heating system.69 It follows that hydrogen technology and policy developments in the Netherlands, particularly the results from ongoing pilot projects, are instructive to steering decision-making in the UK,28,65 and may also entail wider spillover effects for heat decarbonisation pathways in neighbouring countries such as Germany.
2.6 The United Kingdom
Concentrating on developments in the UK context, the possibility of converting parts of the national gas grid to hydrogen has engaged the research community and attracted interest from policy makers for well over a decade.70–72 The initial push for developing sustainable hydrogen research dates back to a series of multi-million-pound grants awarded to UK institutes by the Engineering and Physical Sciences Research Council (EPSRC) between 2003 and 2017,73–75 as mapped in Fig. 1. | ||
| Fig. 1 Events supporting the development of hydrogen homes in the UK, 2003–2022. Source: authors' illustration. aEngineering and Physical Sciences Research Council. bUsing the UK MARKAL model (now UK TIMES model). cCommittee on Climate Change. dThe Office of Gas and Electricity Markets. | ||
In an early contribution employing the UK MARKAL energy systems model, Dodds and Demoullin71 noted that technical feasibility would likely “depend on the willingness of the UK government and the network owners to invest resources over the next 20 years to prepare for and minimise the costs of a national conversion program.” In a parallel analysis using an improved version of the model, Dodds and McDowall72 concluded that the only economically optimal pathway of achieving large-scale decarbonisation of the gas supply would rely on converting the network to deliver hydrogen for use in micro-combined heat and power (CHP) fuel cells. Subsequent studies have followed suit in both the UK context76 and at the global level,77 following the gradual uptake of fuel cell home heating systems in Japan during the 2010s7 and largely positive consumer experience in small-scale European trials between 2012 and 2017.78
In 2015, the Committee on Climate Change (CCC) reported that no policy was in place for domestic hydrogen (i.e. red status). Following the development of small-scale feasibility studies, the need for a formal strategy was identified by 2016 (i.e. amber status: policy at risk).79 Subsequently, the Leeds City Gate H21 project (see Fig. 1) provided a comprehensive evidence base on the feasibility of decarbonising parts of the existing UK gas network at minimal consumer cost, with several envisioned economic and societal benefits.80 Additionally, the CCC released their ‘Hydrogen in a low-carbon economy’ report in November 2018, which identified a potential role for hydrogen as a hybrid heating solution for UK buildings in conjunction with heat pumps.81
In reflection, during the mid-2010s, UK heat decarbonisation remained strongly characterised by uncertainties regarding future energy demand82 and an associated lack of policy clarity.70 Some scholars attribute political uncertainty to the incumbent gas sector trying to resist large-scale electrification.83 Such a pathway is arguably achievable through the deployment of heat pumps and district heat networks, alongside energy efficiency upgrades to properties.70,84
Boait and Greenough85 conclude that hydrogen will inevitably cost more than natural methane, making strategic decisions around its applications critical to social acceptance for the wider hydrogen economy, while other critiques have cautioned against the use of residential hydrogen.84,86 Nevertheless, it is widely agreed that a moderate hydrogen enrichment of natural gas (up to ∼15–20%) could be technically feasible by repurposing existing pipelines87 and viable for domestic heating without significant modification to existing boiler appliances.88 Additionally, a minority of studies have demonstrated the potential viability of integrating residential hydrogen into the UK's energy future to support security of supply and climate change targets.89,90 Crucially, the release of the UK Hydrogen Strategy26 marked the most definitive policy milestone to date for generating potential conditions for domestic hydrogen awareness and acceptance.
Against this background, the domestic hydrogen transition is confronted by substantial socio-technical barriers,91 which have been exacerbated following recent setbacks in planned village trials92 for the North of England93,94 and an increase policy push towards 100% electrification of the UK residential sector.95 In response, the government has opted to draw more heavily on evidence presented by other hydrogen pioneers, namely, Germany and the Netherlands, while continuing to monitor the techno-economic feasibility of hydrogen homes through its national research.28 Furthermore, the UK government has reaffirmed the need to develop a comprehensive consumer engagement strategy to build social acceptance for rapidly developing and deploying hydrogen networks.26
This study supports the government's objective by elucidating new insights on consumer attitudes towards hydrogen homes, following earlier social science research conducted during the HyDeploy and H21 projects.96–98 Critically, data collection for this research took place towards the end of 2022, thereby measuring public trust prior to the collapse of planned hydrogen village trials, which has reduced the likelihood of launching hydrogen homes in the near-term. Situated at a unique juncture between the publication of the UK Hydrogen Strategy (August 2021)26 and the government's most recent update on hydrogen heating policy (March 2024),28 this case study significantly advances social science scholarship on the dynamics of public trust in low-carbon energy futures and social acceptance.
3 Methodology
3.1 Questionnaire design and data collection
This quantitative study employs an online survey to examine how different segments of the UK public perceive the prospective transition to hydrogen homes. The survey design leverages insights from qualitative data collected via online focus groups,99,100 which included an explicit focus on public trust in key stakeholders influencing the discourse around hydrogen homes.101The evidence base was further supported by extensive rounds of literature review on the topic,91,102,103 ahead of piloting the survey to establish content and face validity.33,34 Data was collected between October and December 2022, with the final sample proving broadly representative of the UK population (N = 1845), as further discussed when conducting multigroup analysis.104 At the sub-group level, the sample is composed of respondents with high levels of technology and environmental engagement (VEG: N = 331), moderate levels of technology and environmental engagement (MEG: N = 458), fuel stressed respondents with less than moderate levels of engagement in technology and the environment (FSG: N = 379), and finally, a control group with less than moderate levels of engagement who are not fuel stressed (BLG: N = 677). In addition to increasing representation across different segments of the housing stock, this approach helps engage directly with segments of the population that will be involved in shaping net-zero pathways, both as citizens and potential consumers.
Importantly, all respondents qualify as property owners (37.2% outright owners; 62.8% mortgage owners) living in homes with gas heating and cooking appliances. Furthermore, each respondent self-reported to having an “at least moderate level of financial involvement in purchasing decisions”, while attributing “at least moderate importance to choosing their heating and cooking technologies”, as described in ESI Note 1 (see SN1†). The filtering methods help account for agency and choice as potential predictors of energy acceptance, while ensuring the sample meaningfully captures demographic groups directly involved in the technology transition under examination.105
Specific details of each survey item and the sample composition are provided in SN2 and SN3,† thus supporting the transparency and reproducibility of the research, while prior publications from this dataset further describe the survey design (e.g. SN5† in ref. 31) and multigroup approach.33,34,104,106 Most pertinent to this analysis, trust in 16 specific actors and stakeholders was measured by administering a single question as described in Section 5, which was evaluated via an 11-point Likert scale (see Section 6.1) and subsequently modelled across five distinct dimensions (i.e. sub-constructs) using PLS-SEM (see Section 6.2.2).
Although data collection for this study is limited to the UK, the analysis has international relevance given that “social mechanisms of trust and confidence” are vital for supporting national energy transitions, both from an investment and consumption perspective.107 Moreover, researchers have increasingly identified an association between public attitudes towards climate policies and political trust,108–110 which has motivated cross-national studies.111,112 The relationship between trust in the media and political trust continues to engage scholars, with Hanitzsch and colleagues113 positing the notion of a ‘trust nexus’; wherein the erosion of trust in the media is associated with a broader sense of public disenchantment with political institutions, at least in more politically polarised societies. Evidence suggests that the so-called trust nexus has strengthened over time following public backlash towards elite groups,113 while Paterson et al.114 document the rise of anti-net zero populism in the UK against a background of declining government trust.
This study presents context- and technology-specific insights on public trust, following data collection in the UK during the final quarter of 2022. While longitudinal and cross-national datasets provide clear grounds to expand the analytical scope, cross-sectional research conducted at the national level provides an important foundation for deriving further insights on the spatio-temporal dynamics of public trust in emerging low-carbon technologies (see Section 7.1). Moreover, the UK shares at least some comparable features to countries such as the Netherlands and Germany regarding its political economy, energy sector, and net-zero ambitions,115–117 making the study partly generalisable to other nations shaping the global hydrogen economy, as briefly discussed in Section 7.1.3.
3.2 Combined use of PLS-SEM and NCA
This research follows the trajectory set by recent studies on the adoption dynamics of domestic hydrogen33,106 by combining the use of partial least squares structural equation modelling (PLS-SEM) and necessary condition analysis (NCA).118,119 Whereas PLS-SEM is grounded in additive sufficiency-based logic (i.e. an increase in X leads to an increase in Y), NCA is predicated in necessity logic to identify the ‘must-have’ (i.e. necessary but not sufficient) factors for enabling a target outcome.120PLS-SEM is a recommended second-generation statistical technique for conducting exploratory social science research,121–123 as evidenced across a wide range of fields124,125 including strategic management,126 e-learning,127 and energy acceptance.103 Among numerous applications, scholars have leveraged PLS-SEM to examine the adoption of solar PV and biofuels,128 smart homes,129–131 energy-efficient heating appliances,132 green information technology,133 and hydrogen fuel cell vehicles (HFCVs).134,135 Foremost, the method supports theory development while bridging the analytical gap between explanation and prediction.136,137 PLS-SEM functions by minimising the unexplained variance of antecedent constructs within a conceptually-grounded path model138 to support a predictive-oriented approach to SEM.136,139
This study employed SmartPLS 4.1 software140 to explore a trust-based model of domestic hydrogen acceptance and adoption, wherein perceived community benefits is operationalised as a mediating construct. The first stage of PLS-SEM involves assessing the measurement model, ahead of evaluating the structural model,141 while adhering to best research practices to ensure methodological rigour.142 In all cases, reflective constructs compose the model since indicators are highly correlated and do not represent the entirety of the construct.143,144 To validate public trust as a higher-order construct composed of five sub-constructs, this study applies the repeated indicators approach as described in SN5.†145
To support results from PLS-SEM, importance-performance map analysis (IMPA) is carried out to further understand the role of public trust in shaping consumer attitudes towards domestic hydrogen. IMPA helps better communicate insights from PLS-SEM to decision-makers,146,147 and is applied at both the construct and indicator level for public trust, in accordance with guidelines in the literature.148,149 In sum, the technique involves plotting unstandardised total effects on the x-axis and latent variable scores on the y-axis (rescaled from 0–100), thereby comparing importance (i.e. total effect size) and performance (i.e. average latent variable score).148
Contrary to methods which operate from an additive perspective (i.e. multiple regression and SEM), NCA identifies critical determinants which cannot be compensated for by alternative factors, while detecting what level of the critical determinant is required to enable the target outcome.150–152 Necessary condition hypothesising153,154 has advanced significantly in recent years, following the formalisation of the method by Dul155 and subsequent methodological contributions.156,157 Since its inception,158,159 NCA has attracted considerable interest from social science researchers to enhance theory-method compatibility and empirical insights,160 as reflected in the context of supply chain management,161,162 ethical consumer decision-making,150 energy, environment and sustainability,163–166 and adoption of artificial intelligence,167 among numerous examples.152,168,169
In brief, NCA establishes a ceiling line above the data in an XY scatter plot to separate areas with and without data observations.120,156 When handling continuous data – as approximated in this study by the use of an 11-point Likert scale – researchers should apply the ceiling regression–free disposal hull (CR-FDH).120,170 The CR-FDH is recommended for handling discrete data, producing a regression line (ordinary least squares) through the corners of the ceiling envelopment-free disposal hull (CE-FDH), which displays a non-decreasing step function ceiling line.120
By generating a ceiling line through the data, NCA gauges whether a potential necessity effect is observed; corresponding to the empty region within the upper left quadrant of the scatterplot, which widens with a stronger necessary condition.120,156 A necessity hypothesis is statistically supported when the effect size (d) exceeds 0.10 together with a significant permutation value (p > 0.05).156 Parameters of 0.1 ≤ d < 0.3, 0.3 ≤ d < 0.5, and d ≥ 0.5 indicate a medium, large effect, and very large effect size, respectively.156 Bottleneck tables support NCA by relaying the configuration of the ceiling line.120,157 Thus, each row represents a target outcome such as public trust or perceived community benefits, while each column states the minimum required value of a corresponding predictor for ensuring the outcome level.167,170
Accordingly, harnessing insights from PLS-SEM and NCA provides a complementary perspective of causality and data analysis to advance theoretical and empirical insights,33 which together with IMPA offers practical value for decision-makers.171 The combined use of PLS-SEM and NCA has featured in the context of public transportation preferences118,172 adoption of electric motorcycles,173 decarbonisation for the transport sector,174 electronic customer-to-customer interaction,175 acceptance of medical wearable devices,176 food waste management,170 green competitive advantage,177 and consumer purchasing behaviour178 including the adoption of blockchain technology179 and e-books,149 among other topics.180,181 In carrying out PLS-NCA, this study follows guidelines for best practice established by the pioneer of NCA, Jan Dul,120,159 in addition to procedures specified by PLS-SEM practitioners, namely Richter and colleagues.149,182
Following the evaluation of public trust, a combined importance-performance map analysis (cIMPA) is undertaken at the construct level for perceived community benefits.119 cIMPA incorporates bottleneck percentages from NCA into the data output, thereby relaying the magnitude of different prerequisite factors.119 Leveraging from traditional IMPA,148,183,184 cIMPA can help support policy formation and managerial action by identifying areas of strategic value for enabling and strengthening the target outcome.119
 | ||
| Fig. 2 Research procedure and data analysis techniques. | ||
4 Literature review and hypotheses development
4.1 Scopus results for public trust
The Scopus search results (N = 43) reflect clear growth dynamics for technology acceptance studies engaging with public trust. Fig. 3 displays results for 39 studies (excluding four studies published in 2024§), with around 69% of the total citation count attributed to studies published within the last four years (2020–2023).¶ Among the top ten most highly cited publications, three engaged directly with the energy sector, focusing on public attitudes towards carbon dioxide storage in the Netherlands,185 social acceptance of electricity generation sources in the Chilean context,186 and offshore wind acceptance in the United States.187 Across the sample, six journals are represented more than once,|| whereas 26 journals are represented by a single study. The representation of 32 journals for a sample of 43 studies, following a relatively narrow keyword search, reflects the diverse nature of public trust in shaping multiple cases of technology and social acceptance.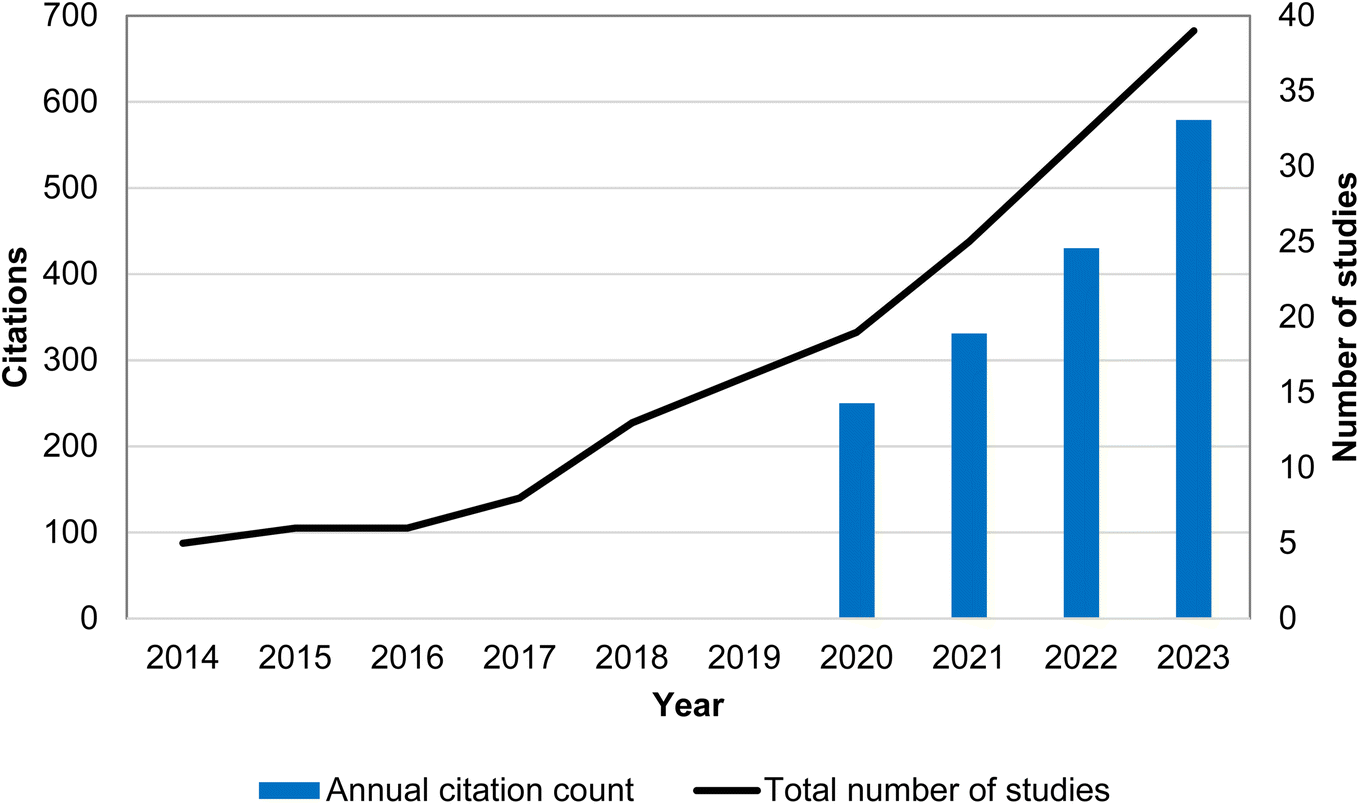 | ||
| Fig. 3 Trends in public trust research based on Scopus search results. | ||
The VOSviewer software tool provides a network visualisation of keywords,188 based here on the association strength between 134 connected items within the Scopus dataset (total = 179). The map was composed of 13 clusters of keywords, spanning from 14 items for the largest cluster to three items for the smallest cluster (M = 10.3, SD = 3.5). Derivatives of trust featured across six clusters: ‘chain of trust’ in Cluster 2 (green: 13 items) in connection to ‘energy transition’ and ‘offshore wind’, among other items; ‘public trust’ in Cluster 4 (yellow: 13 items) in relation to ‘nuclear power’ and ‘renewable energy’; ‘trust’ and ‘trust cultures’ in Cluster 5 (purple: 12 items) linking to ‘smart cites’, ‘autonomous vehicles’, and ‘structural equation modelling’; ‘trust in automation’ and ‘trust in technology’ connecting to ‘driverless cars’, ‘technology adoption’, and ‘artificial intelligence’ in Cluster 6 (turquoise: 12 items); social trust in Cluster 10 (pink: 9 items) with links to ‘green control techniques’ and ‘investing in renewable energy’; and finally, ‘trust gap’ represented in Cluster 12 (blue-grey: 4 items) in association with ‘energy transitions’, ‘nuclear’ and ‘deliberative energy governance’. Additionally, ‘consumer-decision making’ and ‘social acceptance’ featured in Cluster 8 (brown: 11 items), while ‘multi-group structural equation modelling’ and ‘willingness to adopt’ represented in Cluster 9, with ‘public acceptance’ defining Cluster 11 (light green: 8 items), alongside ‘nuclear energy’, ‘nuclear power policy’, and ‘fusion energy’ (see Fig. 4).
 | ||
| Fig. 4 Network visualisation of keywords in Scopus dataset (N = 43): co-occurrence threshold one. | ||
4.2 The dynamics of public trust
Public trust is multi-faceted in nature and highly complexed, as reflected throughout several studies across multiple contexts,189–195 which includes a growing focus on climate change engagement,196 sustainable energy communities,197 and emerging technologies.198–200 For example, in the context of biotechnology, Master and Resnik201 cautioned that media hype could lead to a loss of public trust and social acceptance. As reflected by the Scopus search results, energy researchers have examined how trust influences the social licence to operate for extractive industries,202–207 public engagement in the energy transition and climate policy,208–214 stakeholder perceptions of marine energy futures,215,216 energy-related behaviours,217–220 and adoption of new technologies for the agricultural sector,221–226 among other topics.227–230Donnison et al.231 assessed the social legitimacy of bioenergy with carbon capture and storage (CCS) in the UK, highlighting the importance of media narratives and public trust in the scientific community. Notably, Cooper232 argued that climate change literacy is contingent on media literacy, advocating for scientists to “embrace the maturing discipline of media literacy education” to increase public trust in climate change science. Weitzman and Bailey233 also emphasised the role of mainstream and social media in shaping public trust in Canada's net-pen aquacultural industry, while a follow-up study identified trust as a key mechanism shaping the social acceptance of salmon aquaculture among rural and urban residents of Nova Scotia (N = 495).234 Citizens distrustful of the government were at least three times more likely to hold a negative opinion compared to trustful citizens. Mistrust in salmon farming companies also proved high and more pronounced among rural citizens, whereas respondents had higher trust in the scientific community.234
Yun et al.235 explored trust dynamics in the United States (N = 753) according to public perceptions regarding the reliability of renewable energy companies and trustworthiness of a given State to successfully plan and provide capacity to meet renewable energy demand.** Critically, Dwyer et al.187 concluded that public trust was instrumental to deploying the first commercial US offshore wind farm in Block Island. Specifically, the case study highlights the importance of ‘chains of trust’ between developers, process managers (i.e. governmental and academic entities), and local communities to enable stakeholder acceptance; demonstrating that trust must firstly be established with leaders guiding the process, then in the actual process and finally, in its outcome.187 Similarly, social trust helped accelerate the transition from kerosene to liquified petroleum gas (LPG) among Indonesian households.236
In the context of socio-political and local acceptance for onshore and offshore wind farms in Germany (N = 2009), Sonnberger and Ruddat237 tested the effects of trust in key actors, general attitude toward the energy transition and perceptions of fairness, in addition to the perceived benefits and risks of wind energy. Interestingly, results from multiple linear regression indicated that trust in large energy companies positively influences local acceptance (i.e. wind farm at ca. 500 m distance: β = 0.200, p < 0.01), but negatively influences socio-political acceptance for offshore wind (β = 0.100, p < 0.01), while the effect for onshore wind proved non-significant. However, across the three models, trust in the Federal government, the local government, and municipal utility companies had no significant effect on acceptance.237
Kitt et al.211 developed a trust-based framework to examine the antecedents of public support for low-carbon transportation policies among Canadians (N = 1552). The study concentrated on three dimensions of citizen trust (perceived competence, integrity, and value similarity), in addition to ‘general trust’ (see Table 2). Trust regarding the competence of scientists (∼79%) was markedly higher compared to other groups (M = 49.80, SD = 18.10 across the sample). Among all measurements, the perceived integrity of car manufacturers ranked lowest (∼15%), exhibiting a negative association with support for a vehicle emissions standard. Furthermore, trust in the national government had a significant association with support across all five policies, whereas trust in the provincial government played a limited role in predicting policy support.211
| Source and year | Technology | Country context and sample size | Actors and stakeholders | Results and measurement scale for public trust |
|---|---|---|---|---|
| a The results held consistent when considering the perceived intentions and competence of each actor. b The results are reported for ‘generalised trust’. c Commonwealth Scientific and Industrial Research Organisation. d Measuring perceived trust for communicating accurate and reliable information. | ||||
| 254 | Nuclear power | Switzerland | • Scientists | • M = 3.58, SD = 1.08 |
| 2011 | N = 967 | • Inspecting authorities | • M = 3.52, SD = 1.06 | |
| • Swiss Federal Office of Energy | • M = 3.38, SD = 0.98 | |||
| • Power plant operators | • M = 3.07, SD = 1.22 | |||
| ➢ 5-Point Likert scale | ||||
| 255 | Nuclear power | China | • Scientists | • M = 5.30, SD = 1.51 |
| 2017 | N = 605 | • Government | • M = 4.76, SD = 1.68 | |
| • Nuclear power companies | • M = 4.49, SD = 1.58 | |||
| • The media | • M = 3.94, SD = 1.62 | |||
| ➢ 7-Point Likert scale | ||||
| 256 | Nuclear power | China (Haiyan County) | • Institutions and experts | • 38.8%; 34.5%a |
| 2017 | N = 491 | • Government | • 34.9%; 29.2% | |
| • Power plant operators | • 18.6%; 25.7% | |||
| 209 | Nuclear power | Japan | • Government | • Consistently low levels of trust towards information provided by all sources post-Fukushima |
| 2021 | N = 285 | • Nuclear power specialists | ||
| • Electricity companies | ||||
| • The media | ||||
| • Non-profit organisations or NGOs | ||||
| • The internet | ||||
| 214 | Fusion energy | United States | • University scientists | • M = 6.74 |
| 2024 | N = 2016 | • National Academy of Sciences | • M = 6.57 | |
| • US National Laboratories | • M = 6.27 | |||
| • US Nuclear Regulatory Commission | • M = 6.15 | |||
| • US Department of Energy | • M = 6.10 | |||
| • US Environmental Protection Agency | • M = 6.10 | |||
| • R&D companies | • M = 6.07 | |||
| • Environmental advocacy groups | • M = 5.64 | |||
| • News media | • M = 4.39 | |||
| ➢ 11-Point Likert scale | ||||
| 185 | Carbon capture and storage | Netherlands | • Environmental NGOs | • M = 3.74, SD = 0.99 |
| 2007 | N = 103 | • Government | • M = 2.81, SD = 1.06 | |
| • Industry | • M = 2.03, SD = 0.96 | |||
| ➢ 5-Point Likert scalea | ||||
| 257 | Carbon capture and storage | China | • Researchers | • 29.2% |
| 2016 | N = 349 | • Environmental organisations | • 26.1% | |
| • Government institutions | • 24.4% | |||
| • Enterprises | • 20.3% | |||
| 211 | Low-carbon transportation policiesb | Canada | • Scientists | • ∼80% |
| 2021 | N = 1552 | • Environmental groups | • ∼55% | |
| • Federal government | • ∼41% | |||
| • Provincial government | • ∼39% | |||
| • Car manufacturers | • ∼36% | |||
| 258 | Sustainable commercial aviation | United Kingdom | • Producers of low-carbon jet fuels | • M = 3.55, SD = 0.79 |
| 2022 | N = 1008 | • Scientific community | • M = 3.25, SD = 0.76 | |
| • Policymakers | • M = 2.97, SD = 0.87 | |||
| ➢ 5-Point Likert scale | ||||
| 45 | Hydrogen for domestic use and export | Australia | • CSIROc | • M = 5.43, SD = 1.33 |
| 2021 | N = 3020 | • Universities | • M = 5.24, SD = 1.32 | |
| • Environmental NGOs | • M = 5.18, SD = 1.42 | |||
| • State government | • M = 4.94, SD = 1.51 | |||
| • Federal government | • M = 4.89, SD = 1.64 | |||
| • Local government | • M = 4.84, SD = 1.47 | |||
| • Electricity generation companies | • M = 4.35, SD = 1.65 | |||
| • The media | • M = 4.33, SD = 1.54 | |||
| • Fuel/gas supply companies | • M = 4.08, SD = 1.76 | |||
| ➢ 7-point Likert scale | ||||
| 249 | Green hydrogen to supply power at outdoor events | Scotland | • Academic or research institutions | • M = 4.50 |
| 2023 | N = 340 | • Scottish government | • M = 3.07 | |
| • Energy industry corporations | • M = 2.92 | |||
| • Alternative media | • M = 2.65 | |||
| • UK Government | • M = 2.49 | |||
| • Social media | • M = 2.29 | |||
| ➢ 5-Point Likert scaled | ||||
In the novel context of climate engineering technologies, Merk and Pönitzsch238 focused on the Federal government, the EU, and the United Nations, with German respondents (N = 927) expressing largely neutral levels of institutional trust (M = 2.20, SD = 0.71), as measured using a 4-point Likert scale (1–4). By contrast, Macht and colleagues239 focused on trust in one's municipality when examining citizens' acceptance of bio-based technologies in West Germany (N = 1551). The study employed seven measures focused on aspects of competence- and integrity-based trust, with results proving equivalent for biorefineries and aquaponics as evaluated via a 7-point Likert scale (M = 3.90).239
Lee and Reiner213 found that UK (N = 2016) respondents who prefer solar and wind energy over nuclear power and biomass tend to view companies as a playing a more significant role than government in addressing climate change. Public trust in the government's ability to address climate change (β = 0.068, p < 0.014) and their historical response to climate change (β = 0.092, p < 0.004) predicted support for biomass, whereas confidence in the ability of companies to address the climate change challenge had a significant effect on support for solar energy (β = 0.120, p < 0.001) and wind power (β = 0.153, p < 0.001).213 In the German context, public trust proved a stronger predictor of social acceptance for gas-fired power compared to solar, wind, nuclear, and hydro-power,240 which could imply a critical role for trust in hydrogen-based energy futures.
Engaging with leadership groups in South Korea (N = 267), Choi et al.241 identified the explanatory factors of public fear regarding nuclear power to be a lack of information provision by the press and media, insufficient communication and public relations by experts, and government mistrust, whereas mistrust of nuclear technology was negligible. Surveying the US public (N = 2016), Gupta et al.214 identified a direct positive relationship between trust and support for nuclear fusion, which was highest for technology companies involved in research and development (R&D), followed by university scientists, and the US Nuclear Regulatory Commission, but lower for news media and environmental advocacy groups. Critically, respondents with high levels of trust in the government†† proved significantly more supportive of fusion energy compared to respondents with lower trust levels.214
In their recent investigation of social acceptance for natural-resource management in California, Eriksson et al.227 found that both the public (N = 931) and professionals (N = 216) have much higher trust towards people (M = 67%, M = 68%) compared to the federal government (M = 59%, M = 51%), and state government (M = 48%, M = 32%). Moreover, in a multi-national study focused on climate behaviours and individual support for climate change policies across 35 countries (N = ∼39000), Smith and Mayer242 observed that social trust is a stronger and more consistent predictor than institutional trust. Furthermore, Jordan and colleagues243 cautioned that the public may lack confidence in the ability of democratic processes and political representatives to deliver effective climate change policy, whereas intermediaries such as charities, businesses, and non-governmental organisations (NGOs) may be considered more trustworthy for enacting deep decarbonisation.
Among Dutch respondents, Huijts et al.248 found that trust in one's municipality (M = 3.28, SD = 0.97) and in energy industry (M = 4.01, SD = 0.73) were significantly higher among supporters of a HFS (N = 679) compared to opponents (N = 137: M = 2.58, SD = 1.15; M = 3.33, SD = 1.07), as reported using a 5-point Likert scale. Smith et al.249 evaluated public trust in the novel context of using green hydrogen to supply power at outdoor events. Respondents had higher levels of (integrity-based) trust in academicians and researchers for supporting a sustainable future (M = 4.44), with the Scottish government (M = 3.13) outperforming the UK government (M = 2.29), while the energy industry was viewed neutrally (M = 3.00),249 according to results from a 5-point Likert scale.‡‡ Similar findings have been reported in the Australian context,44,250 wherein Martin et al.45 evaluated public trust in different organisations for acting in the best interest of consumers for driving the country's hydrogen economy (see Table 2).
Regarding the option of blending a percentage of hydrogen into the gas grid, Scott and Powells96 found that UK respondents (N = 742) had higher trust levels in evidence provided by the Health and Safety Executive (HSE), which was also considered a more trustworthy entity compared to the government, industry, and universities. Nevertheless, scientific evidence was also highly valued, whereas national and local media were considered as highly unreliable sources of information and untrustworthy entities. Notably, trust levels were somewhat lower for both the national government and local authorities, while 62% of respondents had ‘no trust’ or ‘little trust’ in their local Member of Parliament (MP). While the gas industry was perceived somewhat neutrally overall, 37.7% of respondents also expressed a lack of trust.96 Furthermore, qualitative responses to this online survey (N = 1213) underscored a sense of mistrust in the government and energy industry regarding their commitment towards fairness and equity in the transition to hydrogen homes.251
The impact of social media narratives has also been illustrated by Uniyal and Nayak252 in capturing Twitter's ‘pulse’ on hydrogen energy between 2013–2022. Relevant to this national case study, the study showed a strong Twitter presence from the UK, accounting for 9.43% of tweets during the time-period and ranking third globally behind Japan (32.96%) and the US (19.31%).252 Notably, the importance of ‘social trust’ for supporting the green hydrogen economy featured prominently in COP28 discussions, defined by panel experts as “the level of confidence individuals have in other stakeholders and the belief that others will act with integrity.”253 Panelists further stressed the role of trust in shaping supply chains, demand creation, and the underlying diffusion of (green) hydrogen into global energy systems.253
Although a rich evidence base has been presented spanning diverse studies, trust-related research in the context of residential energy acceptance and adoption remains far from saturated. Moreover, a multi-dimensional conceptualisation of public trust is particularly pertinent to the social acceptance and adoption intention throughout the early phase of transitioning to hydrogen homes.33,106 Against this background, the following hypotheses are formulated to explore trust dynamics from a sufficiency and necessity perspective, while distinguishing explicitly between social trust and public trust.
H1a: trust in the government will have a positive influence on public trust in the domestic hydrogen transition.
H1b: trust in the government is a precondition for enabling public trust in the domestic hydrogen transition.
H2a: trust in the energy sector will have a positive influence on public trust in the domestic hydrogen transition.
H2b: trust in the energy sector is a precondition for enabling public trust in the domestic hydrogen transition.
H3a: trust in product and service quality will have a positive influence on public trust in the domestic hydrogen transition.
H3b: trust in product and service quality is a precondition for public trust in the domestic hydrogen transition.
H4a: trust in research and development will have a positive influence on public trust in the domestic hydrogen transition.
H4b: trust in research and development is a precondition for enabling public trust in the domestic hydrogen transition.
H5a: social trust will have a positive influence on public trust in the domestic hydrogen transition.
H5b: social trust is a precondition for enabling public trust in the domestic hydrogen transition.
Similar trust-based models have demonstrated explanatory power when evaluating public acceptance for nuclear power,256,261,262 CCS,185,260 hydrogen-powered transportation,248,263 and other environmental contexts such as wastewater reuse schemes.259 For example, Terwel and co-authors264 explored CCS acceptance among a small sample of undergraduate students form Leiden University (N = 73). Modelling results showed that competence-based trust had a positive and significant effect on perceived benefits (β = 0.880, p < 0.01), while the effect of integrity-based trust was marginally significant (β = 0.340, p = 0.10).264
In the Malaysian context (N = 509), social trust in key players (scientists, producers, and policymakers) measured 4.90 (7-point Likert scale), leading to a significant effect on perceived benefits of biodiesel (β = 0.370, p < 0.001).265 Among two groups of citizens in North-Rhine Westphalia, results from PLS-SEM indicated a positive relationship between social trust and local acceptance for biorefineries (β = 0.09, p = 0.031; β = 0.130, p = 0.001) but not for aquaponics (β = 0.03, p = 0.397; β = 0.06, p = 0.175), with a more pronounced effect observed for the region without structural change (Rheinische Revier).239 However, the relationship between social trust and perceived benefits proved non-significant across all models.239
Despite some non-significant findings, the potential for public (or social) trust to shape perceived benefits remains widely acknowledged by technology acceptance research and energy transitions scholars. In this study, public trust is theorised to consist of at least five dimensions including social trust, as described in Section 5. Each aspect is hypothesised to positively predict how consumers perceive the local economic, social, and environmental benefits of domestic hydrogen via the higher-order construct, public trust, as specified in H6a–H6e:
H6a: public trust in the domestic hydrogen transition will positively mediate the relationship between trust in the government and perceived community benefits.
H6b: public trust in the domestic hydrogen transition will positively mediate the relationship between trust in the energy sector and perceived community benefits.
H6c: public trust the domestic hydrogen transition will positively mediate the relationship between trust in product and service quality and perceived community benefits.
H6d: public trust the domestic hydrogen transition will positively mediate the relationship between trust in research and development and perceived community benefits.
H6e: public trust the domestic hydrogen transition will positively mediate the relationship between social trust and perceived community benefits.
4.3 Perceived benefits of emerging technologies
Perceived benefits is among the foremost variables composing technology acceptance models,254,266–268 playing a critical role across a range of contexts such as mobile banking adoption,269 use of online health services,270 technology-enhanced learning.271 Critically, a recent systematic review found that approximately 93% of studies (N = 42) operationalised perceived benefits as an antecedent of domestic energy acceptance, which also held true for around 73% of studies on hydrogen technology acceptance (N = 33).103 Notably, Schulte et al.272 observed that perceived benefits is the most critical factor determining adoption intention for residential solar PV. Other analyses suggest that perceived benefits may exert the strongest influence on predicting social acceptance for renewable electricity generation,186 CCS,267 and nuclear power,254,268 in addition to low-carbon heating technologies.273,274Perceived benefits can be measured at different levels according to the technology context. For example, when evaluating nanotechnology acceptance, Chen and colleagues266 developed a multi-dimensional construct by accounting for economic, social, health, and environmental aspects across six measurement items. In line with the rationale of this study, public trust had a significant effect on the perceived benefits of nanotechnology among the Taiwanese population (β = 0.464, p < 0.001).266 Amin and colleagues265 measured the perceived benefits of biodiesel according to its perceived usefulness to Malaysian society, ability to help solve challenging societal problems, and in terms of outweighing perceived risks. Macht et al.239 evaluated the perceived benefits of biorefineries according to reduction in resource use, promotion of local economies, job creation, and utility for using waste streams, with German respondents scoring around 5.31 on a 7-point Likert scale, whereas the perceived benefits of aquaponics was marginally lower (M = 5.07).
Merk and Pönitzsch238 combined three measures of perceived environmental benefits and a single measure of economic benefits in the context of stratospheric aerosol injection technologies, which returned a moderately positive result (M = 2.46, SD = 0.73), vis-à-vis a 4-point Likert scale. Notably, public trust had a strong direct effect on perceived benefits (β = 0.150, p < 0.001), as well as a significant indirect effect on social acceptance (β = 0.250, p < 0.001).
Arning et al.275 focused exclusively on perceived environmental benefits when evaluating the social acceptance of carbon capture utilisation (CCU) in Germany (N = 509) via PLS-SEM. The five measures composing the construct reflected moderately positive expectations for environmental benefits (M = 3.80, SD = 1.10), as judged by a 6-point Likert scale. Additionally, respondents considered CCU to be a somewhat sustainable and environmentally-friendly technology (M = 5.60, SD = 2.40; M = 5.20, SD = 2.50), but viewed the technology to be immature (M = 4.60, SD = 2.30), as measured via a 10-point scale. Foremost, perceived environmental benefits had a strong positive effect on affective benefits (β = 0.679, p < 0.01).275
Examining perceptions of electricity generation sources in Chile, Bronfman and colleagues186 assessed perceived benefits for society, at the individual level, and for the environment. In the Japanese context, Park and Ohm262 evaluated the perceived benefits of renewable energy technologies according to improving the environment, developing an industrial competitive advantage, and addressing social issues. The study found that public trust in the renewable energy industry positively predicts perceptions of perceived benefits (from renewables), with the effect increasing in the aftermath of the Fukushima nuclear accident of April 2011 (N = 2102: β = 0.201, p < 0.001; N = 1429: β = 0.281, p < 0.001).262
Xu et al.258 found that the perceived benefits of low-carbon jet fuel were similar for the economy and society (M = 3.68, SD = 0.85) and environmental protection (M = 3.69, SD = 0.89), but marginally lower for reducing dependency on foreign oil (M = 3.61, SD = 0.81) and conventional jet fuel dependence (M = 3.63, SD = 0.81), according to a 5-point Likert scale. The least positive perception was associated with GHG emissions reduction as compared to other reduction measures in aviation (M = 3.38, SD = 0.79).258 Additionally, evidence provided to the UK government by Cadent Gas as part of its 2023 hydrogen heating village trial application entailed a three-fold focus on community benefits at the economic, social and environmental level.276 Joshi and Rahman277 also articulate that sustainable consumption involves awareness of environmental, societal, and fair-trade concerns, which may be enacted via adoption of low-carbon energy technologies.278
Notably, perceived environmental benefits emerged as a critical predictor of support for green hydrogen production among Norwegians,281 while information provision about potential environmental benefits has been shown to increase hydrogen support among citizens in the North of England280 and Australia.45 Specifically, Martin et al.45 found that environmental messaging had a small but statistically significant effect on increasing support for hydrogen among Australians, whereas economic messaging also raised support levels but non-significantly. Compared to results collected in 2018, national survey results from Australia in 2021 revealed stronger public perceptions of hydrogen's contribution to climate protection (2021: M = 5.55, SD = 1.30; 2018: M = 4.76, SD = 1.28), alongside more support for the use of hydrogen for domestic energy supply (2021: M = 5.75, SD = 1.22; 2018: M = 5.06, SD = 1.23), with respondents associating hydrogen with reduction of GHG emissions (2021: M = 5.74, SD = 1.22),§§ as calculated via 7-point Likert scale.45
Additionally, in respect to determining willingness to use hydrogen for residential purposes, the 2021 survey (N = 1507) found that safety ranked as the most important determinant (M = 4.50, SD = 0.83), followed by reliability of energy supply (M = 4.27, SD = 0.87), and health benefits such as no carbon monoxide emissions (M = 4.21, SD = 0.94), as gauged via a 5-point Likert scale.45 By contrast, the technological dimension associated with choosing between gas or electricity for cooking proved comparatively less important (M = 3.64, SD = 1.08), as did flame colour/visibility (M = 3.42, SD = 1.24), with both factors proving less relevant than in 2018 (p < 0.05). However, the environmental dimension linked to net-zero emissions proved more influential (M = 3.98, SD = 1.05) than in 2018 (M = 3.89, SD = 1.02), which also reflected a statistically significant increase (p < 0.05).45
Previous analysis testing the STEEEP Framework operationalised a hybrid construct merging perceived community benefits and willingness to adopt hydrogen homes as a proxy for measuring ‘perceived adoption potential’.33 From a sufficiency perspective, it was shown that safety perceptions (β = 0.193, p < 0.001), technology perceptions (β = 0.179, p < 0.001), production perceptions (β = 0.241, p < 0.001), and foremost, positive emotions (β = 0.376, p < 0.001) are significant (positive) predictors, with each factor functioning as a necessary condition with a medium effect size.33 However, to date, no study has combined the use of PLS-SEM and NCA to evaluate perceived benefits in the context of energy technology acceptance. The following hypotheses are developed to address this research gap based on the premise that perceived community benefits will entail economic, social, and environmental dimensions,276,282 which may be influenced by public trust, alongside technology, safety, and environmental perceptions:
H7a: public trust in the domestic hydrogen transition will have a positive influence on the perceived community benefits of transitioning to hydrogen homes.
H7b: public trust in the domestic hydrogen transition is a precondition for perceiving the potential community benefits of hydrogen homes.
H8a: technology perceptions will have a positive influence on the perceived community benefits of transitioning to hydrogen homes.
H8b: positive technology perceptions is a precondition for perceiving the potential community benefits of hydrogen homes.
H9a: safety perceptions will have a positive influence on the perceived community benefits of transitioning to hydrogen homes.
H9b: positive safety perceptions is a precondition for perceiving the potential community benefits of hydrogen homes.
H10a: production perceptions will have a positive influence on the perceived community benefits of transitioning to hydrogen homes.
H10b: positive production perceptions is a precondition for perceiving the potential community benefits of hydrogen homes.
Based on a narrative literature review (N = 17), Gordon et al.102 identified public trust as a ‘significant’ determinant of domestic hydrogen acceptance, alongside safety perceptions and environmental perceptions. Prior research employing this dataset established that perceived community benefits is the most significant predictor of domestic hydrogen acceptance (β = 0.276, p < 0.001), among constructs composing the DHAM.34 In addition, production perceptions had a positive and significant effect on social acceptance (β = 0.214, p < 0.001), followed by public trust (β = 0.198, p < 0.001), and safety perceptions (β = 0.058, p < 0.004).34
This study retains the path between perceived community benefits and domestic hydrogen acceptance (PCB → DHA) as specified in H11a, in addition to testing the relationship from a necessity logic, as expressed in H11b. Furthermore, an alternative model is specified wherein public trust, in addition to technology, safety, and production perceptions, predict perceived community benefits (see Section 4.3.1), which also mediates each path relationship with domestic hydrogen acceptance, as formalised in H12a–H12d:
H11a: the perceived community benefits of transitioning to hydrogen homes will positively influence domestic hydrogen acceptance.
H11b: perceiving potential community benefits in the transition to hydrogen homes is a precondition for enabling domestic hydrogen acceptance.
H12a: the perceived community benefits of transitioning to hydrogen homes will positively mediate the relationship between public trust and domestic hydrogen acceptance.
H12b: the perceived community benefits of transitioning to hydrogen homes will positively mediate the relationship between technology perceptions and domestic hydrogen acceptance.
H12c: the perceived community benefits of transitioning to hydrogen homes will positively mediate the relationship between safety perceptions and domestic hydrogen acceptance.
H12d: the perceived community benefits of transitioning to hydrogen homes will positively mediate the relationship between production perceptions and domestic hydrogen acceptance.
4.4 Interactions between perceived community benefits, social acceptance and adoption intention
To date, specific models have been tested to assess social acceptance and perceived adoption potential for hydrogen homes vis-à-vis the DHAM34 and STEEEP Framework,33 with the latter being modified and further evaluated through a multigroup perspective.104 The DHAM accounted for 66.9% of the observed variance in social acceptance,34 while the STEEP Framework explained 61.2% of the variance in perceived adoption potential.33 However, the critical link between acceptance and adoption intention remains underexplored, while the role of perceived community benefits in shaping each outcome is yet to be integrated into a single model.The literature reflects the importance of examining such relationships before policy decisions are taken regarding the scope and scale of technology deployment. For example, Xu et al.258 recently concluded that perceived benefits increases consumer willingness to pay for sustainable commercial aviation,258 which represents an emblematic long-term technology transition.286 Chen et al.266 found that the perceived benefits of nanotechnology applications positively predicts social acceptance in Taiwan (β = 0.675, p < 0.001), while perceived benefits also proved the most importance predictor of attitude towards biodiesel in Malaysia (β = 0.800, p < 0.001).265
The perceived benefits of renewable energy technologies demonstrated a strong effect on public acceptance in Japan, both prior to and after the Fukushima incident (β = 0.834, p < 0.001; β = 0.775; p < 0.001), which in turn predicted intention to use renewables (β = 0.297, p < 0.001; β = 0.857; p < 0.001).256 Notably, adoption intention for renewables increased significantly post-Fukushima, reflecting heightened risk perceptions of nuclear power as observed in other national contexts such as China.256 Across six models measuring general and local acceptance for two technologies (biorefineries and aquaponics) in two areas of Germany (transition and non-transition regions of North-Rhine Westphalia), Macht et al.239 found that perceived benefits positively and consistently predicts social acceptance (β = 0.220–0.320, p < 0.001), with the exception of aquaponics in the transition region (β = 0.100, p = 0.076).
In the German context, perceived benefits had a strong effect on the social acceptability of stratospheric aerosol injection (β = 0.300, p < 0.001).238 Perceived environmental benefits also predicted general acceptance (β = 0.167, p < 0.05) and local acceptance (β = 0.123 p < 0.05) for CCU in Germany.275 Furthermore, perceived benefits, as evaluated through a single measure of job creation, had a positive effect on wind energy acceptance among the German population (onshore wind: β = 0.110, p < 0.01; offshore wind: β = 0.140, p < 0.01; and local wind farm: β = 0.080, p < 0.01).237
In response, additional hypotheses are formulated to examine the relationship between acceptance and adoption intention for hydrogen homes through a sufficiency-based lens167 and via necessity-based logic.120 In line with research highlighting perceptual shifts between the attitude formation and decision-making phase of technology adoption,287 the final part of the trust-based model also examines whether social acceptance mediates the relationship between perceived community benefits and adoption intention:
H13a: domestic hydrogen acceptance will positively influence willingness to adopt a hydrogen home.
H13b: domestic hydrogen acceptance is a precondition for willingness to adopt hydrogen heating and cooking technologies.
H14: domestic hydrogen acceptance will positively mediate the relationship between perceived community benefits and willingness to adopt a hydrogen home.
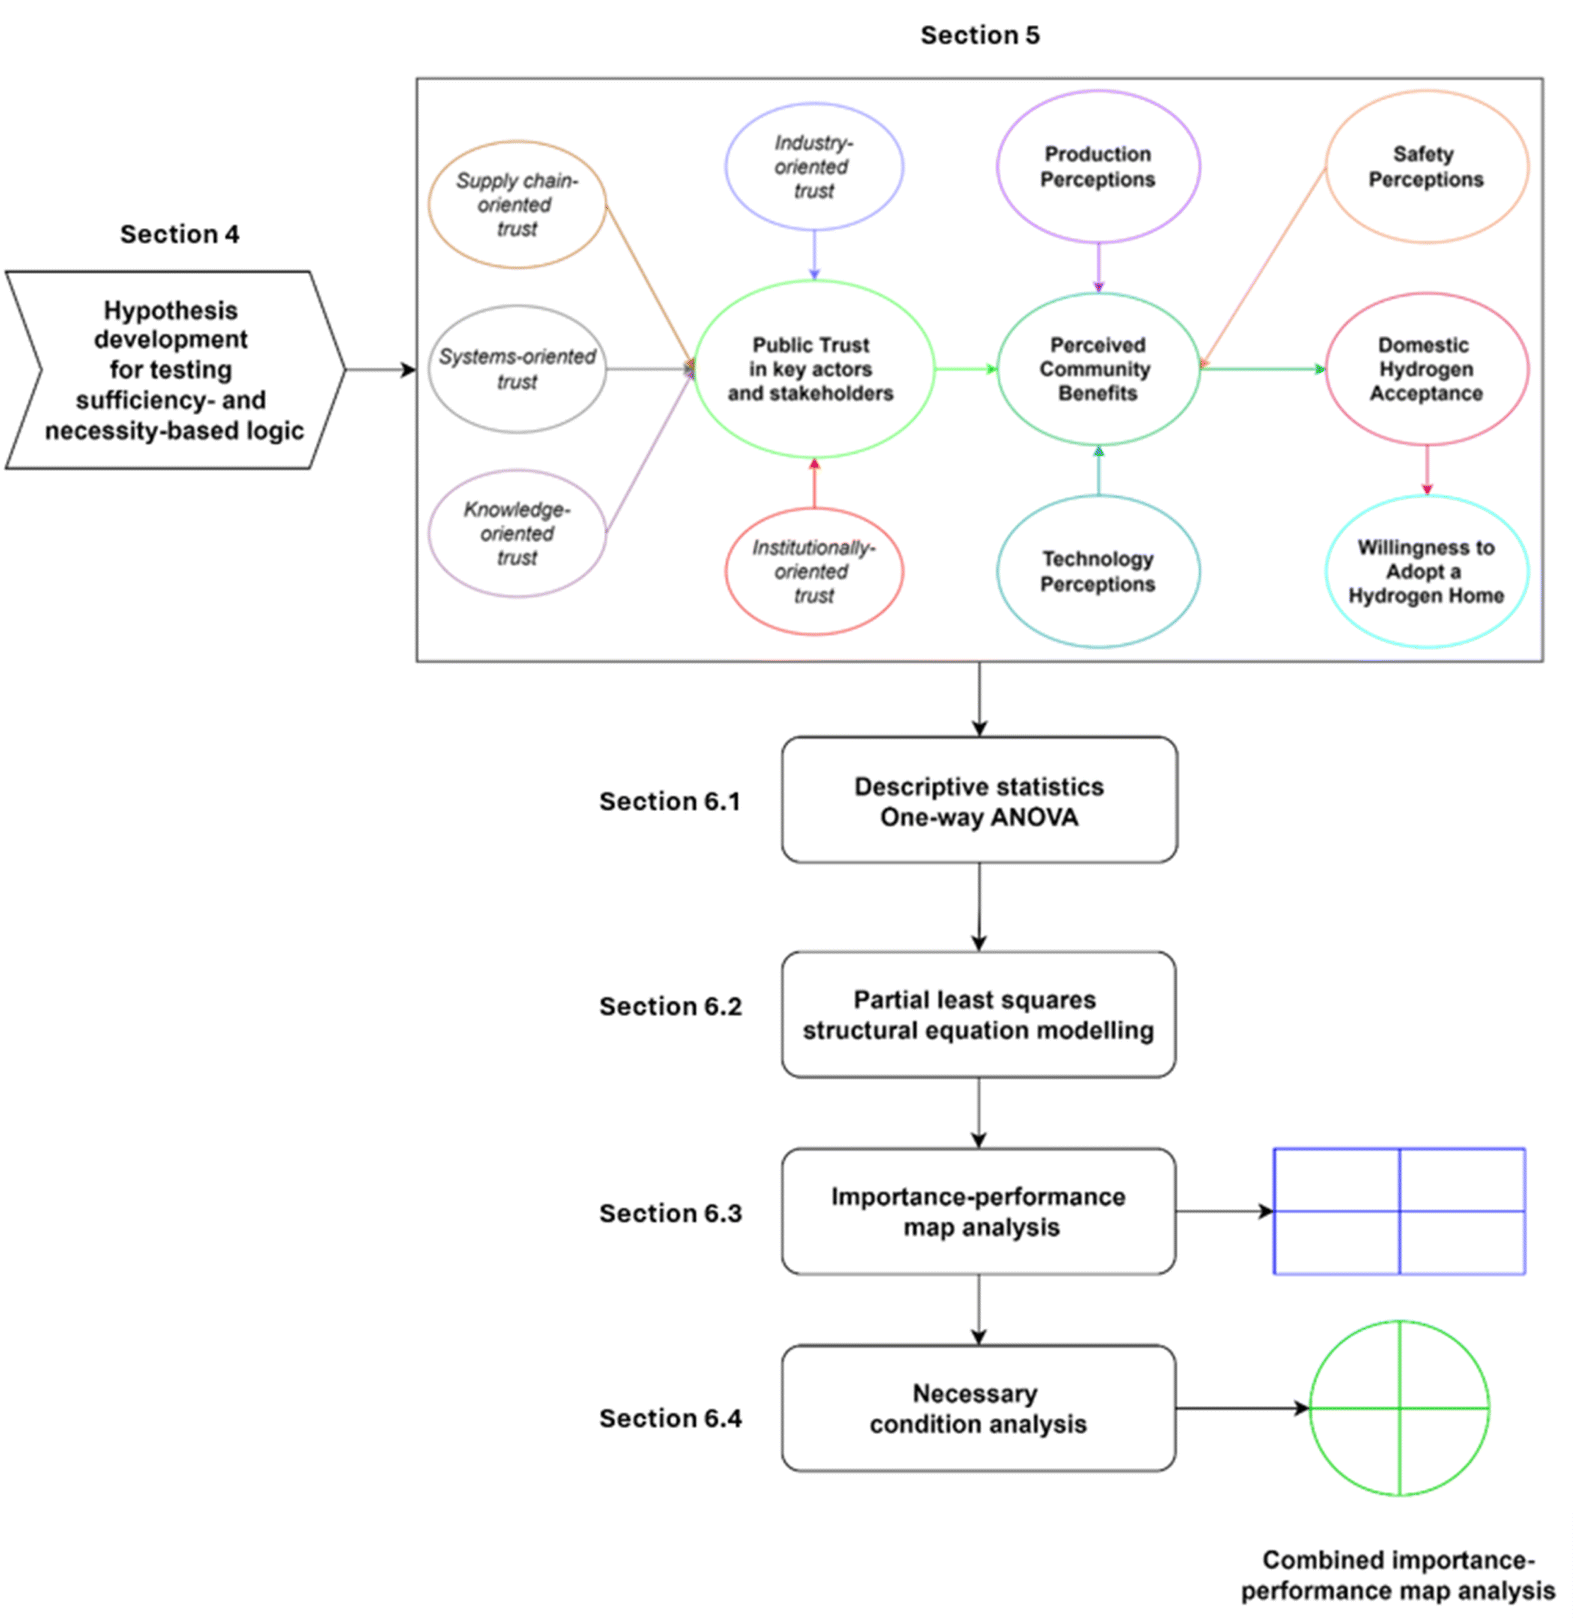
5 Conceptual framework
Based on insights from literature review and stated hypotheses, Fig. 5 develops a conceptual framework to ground the empirical analysis. The novelty of the conceptual contribution emerges from the multi-dimensional focus on public trust and its antecedents. Whereas prior research typically selects social trust or public trust as its point of interest, which may span a focus on several stakeholders and aspects of competence-based and integrity-based trust264 (see Section 4), this study demarcates explicitly between social and public trust,|||| while examining four additional dimensions: trust in the government (GOV); trust in the energy sector (NRG); trust in product and service quality (QUAL); and trust in research & development (R&D).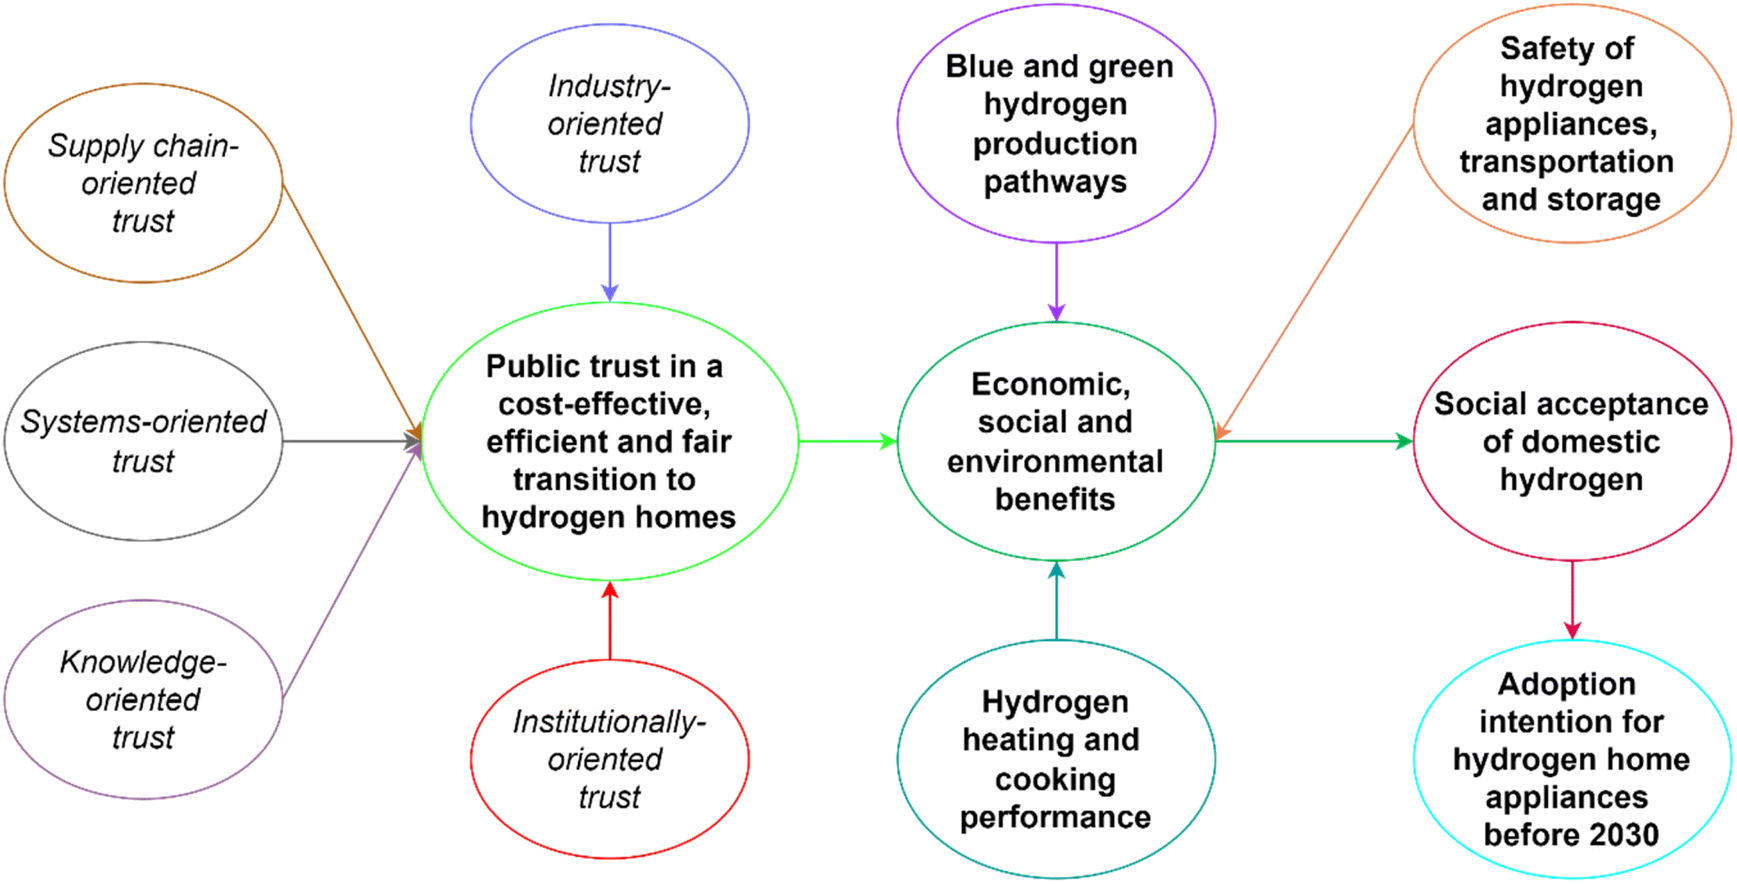 | ||
| Fig. 5 Trust-based framework for examining the dynamics of domestic hydrogen acceptance and adoption intention. | ||
The institutionally-oriented dimension of public trust is captured by measuring three levels, namely, trust in the central government, regional authorities, and local councils. An industry-oriented framing is represented by incorporating three measures related to the energy sector, namely, trust in fuel/gas supply companies, electricity and/or gas suppliers, and renewable energy producers. Additionally, a supply chain-oriented focus is transmitted by measuring trust in trade bodies, boiler manufacturers, and engineers and technicians, as a way of gauging consumer expectations regarding product and service quality for hydrogen home appliances. A knowledge-oriented lens is applied by accounting for trust in NGOs, universities, and other research institutions, thereby engaging with perceptions of R&D-related activities.
Finally, social trust refers to the expectation that entities involved in aspects such as regulation, safety, communication, and financing for hydrogen homes will act competently, ethically, and openly, which is evaluated according to trust in the Office of Gas and Electricity Markets (Ofgem), the media, Gas Distributions Network Operators (GDNOs), and financial institutions. Accordingly, social trust can be considered as a broad measure which is systems-oriented and representative of a mix of competence-based and ethically-driven levers.
Through a multi-dimensional paradigm, the trust-based model incorporates aspects of institutional, organisational, interpersonal, epistemic, and social trust by measuring consumer confidence in policy makers, industry representatives, human capital, technology innovation, and other entities shaping social capital. In total, the proposed model consists of 12 constructs including public trust, which is composed of five sub-constructs and specified as a reflective-formative, higher-order construct.288 The following question was formulated to support the proposed conceptualisation of public trust: how much trust do you have in the following stakeholders for supporting a cost-effective, efficient, and fair transition to hydrogen homes?
In contrast to constructs operationalised within the DHAM34 and STEEEP Framework,33 this study explores mediating relationships to discern more intricate insights into the dynamics of hydrogen acceptance and adoption intention,134,245,263 as realised in prior research on public perceptions of nuclear power,289 and public trust and acceptance of CCS.257 While technology, safety, and production perceptions serve as exogenous constructs (predicting perceived community benefits), public trust, perceived community benefits, and domestic hydrogen acceptance operate as mediators,290,291 with willingness to adopt a hydrogen home completing the model as the final endogenous construct (see Fig. 5).
6 Results
6.1 Public trust in the domestic hydrogen transition
Prior to conducting PLS-SEM, descriptive data analysis was carried out with a primary focus on the trust-based component of the model. In previous research, descriptive results for other constructs are reported for the STEEEP Framework33,104 and DHAM,34 which operationalised five measures of public trust.*** Across the 16 indicators composing the public trust construct, a mean score of 5.16 was recorded (SD = 2.43), as measured on an 11-point Likert scale. Trust in the government (M = 4.41, SD = 2.50) and social trust (M = 4.92, SD = 2.48) fell below the mean value, while trust in R&D (M = 5.70, SD = 2.26), trust in product and service quality (M = 5.64, SD = 2.20), and to a lesser extent, trust in the energy sector (M = 5.21, SD = 2.45) exceeded the mean score.Notably, trust in the government proved lowest at the central level (M = 3.97, SD = 2.62), and highest at the local level (M = 4.74, SD = 2.47), followed by the regional level (M = 4.53, SD = 2.33). A lack of social trust originated primarily from low confidence in the media for supporting a cost-effective, efficient, and fair transition to hydrogen homes (M = 4.03, SD = 2.46), which proved near equivalent to trust in the central government. Respondents were somewhat sceptical of financial institutions as potential ‘trustbrokers’ (M = 4.95, SD = 2.37), but comparatively more trustworthy of Ofgem (M = 5.47, SD = 2.45) and to a lesser degree GDNOs (M = 5.23, SD = 2.38).
At the positive end of the trust spectrum, consumers expressed higher levels of confidence in gas engineers and technicians (M = 5.99, SD = 2.19), universities (M = 5.95, SD = 2.28), other research institutes or organisations (M = 5.91, SD = 2.23), renewable energy producers (M = 5.82, SD = 2.45), and to a lesser extent, boiler manufacturers (M = 5.64, SD = 2.18). The results provide an initial snapshot of the potential actors responsible for shaping public trust in domestic hydrogen futures (see Fig. 6), which will entail raising consumer confidence levels across multiple dimensions.
 | ||
| Fig. 6 Mean score for indicators predicting public trust in the domestic hydrogen transition. Red = trust in the government (GOV); blue = trust in the energy sector (NRG); brown = trust in product and service quality (QUAL); mauve = trust in R&D; grey = social trust (ST). | ||
At the sub-sample level, the trust dynamics associated with the domestic hydrogen transition present significant findings in terms of consumer heterogeneity (see Table 3). Foremost, consumers belonging to the VEG express higher levels of trust across all dimensions and indicators compared to respondents composing the FSG and BLG (see Fig. 7 and SN4†). Compared to the mean trust level across the full sample (M = 5.16), the VEG holds the highest level of public trust (M = 6.11), followed by the MEG (M = 5.30), while the FSG (M = 4.82) and BLG (M = 4.79) proved near equivalent. While the groups diverge according to technology and environmental engagement levels, the variance across different trust dimensions is comparable between groups (SD = 0.62–0.68).
| BLG | MEG | VEG | FSG | |
|---|---|---|---|---|
| a ρ-Values are reported for each comparison, while the effect size given in parentheses. ***Large effect size. **Moderate effect size. *Small effect size. | ||||
| Trust in the government | ||||
| BLG | ||||
| MEG | <0.001 (0.31***) | |||
| VEG | <0.001 (0.30***) | 1.000 (0.02*) | ||
| FSG | 1.000 (0.01*) | <0.001 (0.30***) | <0.001 (0.31***) | |
|
||||
| Trust in the energy sector | ||||
| BLG | ||||
| MEG | <0.001 (0.16**) | |||
| VEG | <0.001 (0.26**) | 0.005 (0.12**) | ||
| FSG | 1.000 (0.01*) | <0.001 (0.17**) | <0.001 (0.29) | |
|
||||
| Trust in product and service quality | ||||
| BLG | ||||
| MEG | <0.001 (0.13**) | |||
| VEG | <0.001 (0.29***) | <0.001 (0.18**) | ||
| FSG | 1.000 (0.00) | 0.001 (0.13**) | <0.001 (0.32***) | |
|
||||
| Trust in research and development | ||||
| BLG | ||||
| MEG | <0.001 (0.16**) | |||
| VEG | <0.001 (0.32***) | <0.001 (0.18**) | ||
| FSG | 1.000 (0.01*) | <0.001 (0.16**) | <0.001 (0.34) | |
|
||||
| Social trust | ||||
| BLG | ||||
| MEG | 0.017 (0.09**) | |||
| VEG | <0.001 (0.31***) | <0.001 (0.23**) | ||
| FSG | 1.000 (0.01*) | 0.112 (0.08**) | <0.001 (0.33***) | |
 | ||
| Fig. 7 Mean score for constructs predicting public trust in the domestic hydrogen transition by consumer sub-group. | ||
Trust perceptions are highly consistent between segments, since all groups share least trust for the government, while social trust ranks second to last at the construct level. Additionally, trust in the energy sector ranks third across all groups, which can be traced to stronger confidence in the role of renewable energy producers. In the case of the BLG, trust in product and service quality (M = 5.29) is marginally stronger than trust in R&D (M = 5.28), whereas across all other groups the latter outranks the former by a small margin. Consequently, the trust dynamics explored within this study exhibit high levels of conformity across the sample at the indicator level (and by proxy, the construct level), but deviate in magnitude according to specific segmentation characteristics.
Among the five constructs composing public trust, trust in the government had the largest variance across the sub-groups composing the sample (GOV: t = 177.60), followed by trust in R&D (R&D: t = 131.52), social trust (ST: t = 110.97), trust in production and service quality (QUAL: t = 107.37), and trust in the energy sector (NRG: t = 93.34), with all results proving highly significant (p < 0.001). Post-hoc tests confirm that the BLG and FSG are highly homogenous in terms of perceived trust across all dimensions. Furthermore, high levels of consistency are observed since the rank order (VEG, MEG, FSG, BLG) was the same across all metrics except NRG, whereby the BLG (Md = 829) ranks marginally ahead of the FSG (Md = 820). While this difference fails to reflect a statistically significant finding, it is nevertheless noteworthy that conditions of fuel stress heighten mistrust in the energy sector.
Regarding trust in the government, the MEG and VEG (r = 0.02) conform alongside the BLG and FSG (r = 0.01), while all remaining pairwise comparisons display a large effect size (r = 0.30–0.31). Considering trust in the energy sector, the largest divergence corresponds to the VEG and FSG (r = 0.29), while other pairwise comparisons excluding the BLG and FSG return a moderate effect size (r = 0.12–0.26). Trust in product and service quality reflects two large effect sizes for the BLG and VEG (r = 0.29) alongside the VEG and FSG (r = 0.32), while three results have a moderate effect (r = 0.13–0.18).
A similar pattern is observed for trust in R&D, with group-specific differences attributed foremost to the BLG and VEG (r = 0.32) and VEG and FSG (r = 0.34), whereas other sub-groups excluding the BLG and FSG are defined by a moderate effect size of similar magnitude (r = 0.16–0.18). Finally, in terms of social trust, similar results are observed between the BLG and VEG (r = 0.31) and VEG and FSG (r = 0.33) as compared to other trust dimensions. However, the MEG and VEG also diverge to a larger extent (r = 0.23), whereas the difference between the BLG and MEG, as well as the MEG and FSG proves more modest (r = 0.08–0.09).
Public trust in domestic hydrogen transition could be strongly influenced by corresponding levels of technology and environmental engagement across the UK population, while individual dimensions of trust may also operate distinctly from one another across consumer segments. Table 4 complements the findings on public trust by reporting descriptive results across each construct and its indicators, wherein different levels of variance are observed across metrics.
| Construct and scale | Indicators and question framing | Mean | Standard deviation |
|---|---|---|---|
| Technology perceptions 11-point | ➢ Perceived performance compared to a natural gas boiler or a natural gas hob | ||
| • TP1: higher level of thermal comfort from a hydrogen boiler | 6.69 | 2.45 | |
| • TP2: higher energy efficiency from a hydrogen boiler | 7.83 | 2.43 | |
| • TP3: smarter heating system provided by a hydrogen boiler | 7.33 | 2.51 | |
| • TP4: more efficient performance from a hydrogen hob | 6.75 | 2.40 | |
| • TP5: smarter cooking system provided by a hydrogen hob | 6.32 | 2.38 | |
| Safety perceptions 11-point | ➢ Compared to natural gas | ||
| • SP1: hydrogen boilers | 5.93 | 2.01 | |
| • SP2: hydrogen hobs | 5.92 | 2.04 | |
| • SP3: hydrogen pipeline transport | 5.80 | 2.03 | |
| • SP4: underground hydrogen storage | 5.68 | 2.14 | |
| • SP5: overall safety level | 5.96 | 1.94 | |
| Production perceptions 11-point | ➢ Support for hydrogen production pathways over different time-horizons | ||
| • PP1: blue hydrogen up to 2030 | 5.57 | 2.00 | |
| • PP2: blue hydrogen after 2030 | 6.78 | 2.04 | |
| • PP3: green hydrogen up to 2030 | 7.28 | 2.06 | |
| • PP4: green hydrogen after 2030 | 6.44 | 1.74 | |
| • PP5: the twin-track production approach | 5.68 | 1.82 | |
| Perceived community benefits 11-point | ➢ In locations that switch to hydrogen homes | ||
| • PCB1: economic benefits such as job opportunities and income security | 6.28 | 2.02 | |
| • PCB2: social benefits such as reduced level of energy poverty and improved health | 6.23 | 2.13 | |
| • PCB3: environmental benefits such as lower carbon emissions and better air quality | 7.02 | 2.07 | |
| Domestic hydrogen acceptance 11-point | ➢ Socio-political, community, and household-level acceptance | ||
| • DHA1: hydrogen becoming a critical part of the UK's energy future | 6.43 | 2.10 | |
| • DHA2: hydrogen replacing natural gas in your local area before 2030 | 6.34 | 2.23 | |
| • DHA3: switching your home to both hydrogen heating and cooking before 2030 | 6.38 | 2.28 | |
| Willingness to adopt a hydrogen home 5-point | ➢ Before the year 2030 | ||
| • WTA1: hydrogen boiler | 2.94 | 1.00 | |
| • WTA2: hydrogen hob | 2.90 | 1.01 | |
| • WTA3: hydrogen home | 2.87 | 1.04 |
6.2 Partial least squares structural equation modelling
Model-specific estimates were employed to validate sample size requirements for conducting PLS-SEM.292 Given the parameters of the trust-based model, a sample size of 1845 was more than adequate for detecting a small effect size (f2 = 0.02) at a 95% significance level (ρ < 0.05), as confirmed via G-Power software analysis293,294 (see SN6†). Common method bias was checked for using Harman's single factor test,295 which returned an overall variance of 36.65%, comfortably under the threshold value of 50% (see SN7†). As a further check for CMB,296 the model was rerun with a new random variable functioning as the (sole) endogenous construct,297 which returned variance inflation factor (VIF) scores below the threshold of 3.0.296 Finally, normality was assessed by measuring skewness and kurtosis tests,298,299 which adhered to the recommended threshold of ±1 (see SN8†). As a result, the initial checks validated data integrity, supporting the decision to conduct PLS-SEM (see SN9†).Item reliability was established since the proposed constructs explain more than half of the variance in their respective indicators,141 as reflected by Cronbach Alpha (CA) values above 0.708 (see Table 5).141,302 In two cases (TP1 = 0.657; PP1 = 0.555), CA fell below the more stringent threshold but still exceeded the guideline of 0.50 for exploratory research.143,303 Both indicators were incorporated into the model to uphold content validity, since other reliability and validity requirements were satisfied. Internal consistency reliability is achieved when composite reliability (CR) values exceed 0.70,143 which was satisfied for all constructs (see Table 5). Although four constructs (DHA, PT, TP, WTA) exceeded the preferred threshold of 0.90, indicator redundancy was ruled out since each CR (ρA) value fell below 0.95.141
| Construct | CA | CR (ρA) | CR (ρC) | AVE | VIF |
|---|---|---|---|---|---|
| a *Lower-order constructs. **Higher-order construct. b Results for validating the higher order construct (PT) are reported in SN5. | |||||
| Trust in the government (GOV)* | 0.889 | 0.893 | 0.932 | 0.819 | 2.370 |
| Trust in energy sector (NRG)* | 0.887 | 0.890 | 0.931 | 0.818 | 3.645 |
| Trust in product service and quality (QUAL)* | 0.862 | 0.863 | 0.916 | 0.784 | 2.784 |
| Trust in research and development (R&D)* | 0.832 | 0.833 | 0.899 | 0.749 | 1.978 |
| Social trust (ST)* | 0.842 | 0.846 | 0.894 | 0.678 | 4.854 |
| Public trust (PT)**b | 0.916 | 0.928 | 0.936 | 0.747 | 1.437 |
| Technology perceptions (TP) | 0.810 | 0.824 | 0.868 | 0.569 | 1.219 |
| Safety perceptions (SP) | 0.918 | 0.920 | 0.939 | 0.754 | 1.463 |
| Production perceptions (PP) | 0.816 | 0.843 | 0.871 | 0.578 | 1.302 |
| Perceived community benefits (PCB) | 0.808 | 0.808 | 0.886 | 0.722 | 1.000 |
| Domestic hydrogen acceptance (DHA) | 0.922 | 0.923 | 0.951 | 0.865 | 1.000 |
| Willingness to adopt H2 home (WTA) | 0.934 | 0.934 | 0.958 | 0.883 | n/a |
Next, convergent validity was supported given that the average variance extracted (AVE) exceeded 0.50 for all constructs (Table 5),143,304 which suggests each construct explains the variance of its indicators.141 Lastly, discriminant validity was satisfied in view of the heterotrait-monotrait (HTMT) ratio of correlations (all values <0.80),305 as well as the Fornell Larcker criterion306 (see SN10†), thereby verifying that each construct could be considered empirically distinct (see Table 6).141
| DHA | PCB | PP | PT | SP | TP | WTA | |
|---|---|---|---|---|---|---|---|
| DHA | |||||||
| PCB | 0.779 | ||||||
| PP | 0.673 | 0.638 | |||||
| PT | 0.631 | 0.574 | 0.508 | ||||
| SP | 0.518 | 0.640 | 0.413 | 0.516 | |||
| TP | 0.437 | 0.692 | 0.333 | 0.290 | 0.453 | ||
| WTA | 0.675 | 0.514 | 0.418 | 0.389 | 0.368 | 0.278 |
With the exception of components of the trust model (NRG = 3.645; ST = 4.854), VIF scores were below the recommended threshold of 3.0 (see Table 5), which indicated limited risk of multicollinearity issues.302 For trust in the energy sector (NRG), the VIF value was well below the more stringent threshold of 5.0, while social trust (ST) presented a higher value but still within limits, as reported in SN11.†
000 sub-samples) in SmartPLS 4.1. Each path relationship proved highly significant (p < 0.001) and demonstrated a positive effect, with complementary partial mediation supported where tested.307,308 Firstly, all predictors of public trust (PT) had a strong influence, ranging from β = 0.205 for trust in R&D to β = 0.263 for social trust (M = 0.230), which confirmed H1a–H1e. Additionally, H2a–H2e were supported since PT positively and significantly mediated the relationship between each trust dimension and perceived community benefits (PCB), as reported in Table 7.
| Hypothesis | β coefficient (SD) | t-Statistic | ρ-Value | f 2 | Result |
|---|---|---|---|---|---|
| a ***Large effect size (f2 ≥ 0.35). **Moderate effect size (0.15 ≤ f2 < 0.35). *Small effect size (0.02 ≤ f2 < 0.15). | |||||
| H1a: GOV → (+) PT | 0.214 (0.003) | 65.892 | <0.001 | n/a | Supported |
| H2a: NRG → (+) PT | 0.236 (0.003) | 74.764 | <0.001 | n/a | Supported |
| H3a: QUAL → (+) PT | 0.233 (0.003) | 68.683 | <0.001 | n/a | Supported |
| H4a: R&D → (+) PT | 0.205 (0.003) | 59.609 | <0.001 | n/a | Supported |
| H5a: ST → (+) PT | 0.263 (0.003) | 90.284 | <0.001 | n/a | Supported |
| H6a: GOV → PT → (+) PCB | 0.037 (0.005) | 7.968 | <0.001 | n/a | Supported |
| H6b: NRG → PT → (+) PCB | 0.041 (0.005) | 7.953 | <0.001 | n/a | Supported |
| H6c: QUAL → PT → (+) PCB | 0.040 (0.005) | 7.841 | <0.001 | n/a | Supported |
| H6d: R&D → PT → (+) PCB | 0.035 (0.005) | 7.726 | <0.001 | n/a | Supported |
| H6e: ST → PT → (+) PCB | 0.045 (0.006) | 7.969 | <0.001 | n/a | Supported |
| H7a: PT → (+) PCB | 0.173 (0.022) | 7.890 | <0.001 | 0.047* | Supported |
| H8a: TP → (+) PCB | 0.354 (0.022) | 16.272 | <0.001 | 0.234** | Supported |
| H9a: SP → PCB | 0.232 (0.022) | 10.537 | <0.001 | 0.084* | Supported |
| H10a: PP → PCB | 0.277 (0.021) | 13.172 | <0.001 | 0.135* | Supported |
| H11a: PCB → (+) DHA | 0.674 (0.016) | 43.138 | <0.001 | 0.833*** | Supported |
| H12a: PT → PCB (+) →DHA | 0.117 (0.015) | 7.582 | <0.001 | n/a | Supported |
| H12b: TP → PCB (+) →DHA | 0.238 (0.015) | 16.020 | <0.001 | n/a | Supported |
| H12c: SP → PCB →DHA | 0.157 (0.016) | 10.087 | <0.001 | n/a | Supported |
| H12d: PP → PCB →DHA | 0.187 (0.015) | 12.297 | <0.001 | n/a | Supported |
| H13a: DHA → (+) WTA | 0.628 (0.015) | 41.656 | <0.001 | 0.650*** | Supported |
| H14: PCB → DHA (+) → WTA | 0.423 (0.015) | 27.511 | <0.001 | n/a | Supported |
PT had a small effect on PCB (β = 0.173, f2 = 0.047), whereas technology perceptions (TP) had a moderate effect (β = 0.354, f2 = 0.234). Production perceptions (PP: β = 0.277, f2 = 0.135) proved more significant than safety perceptions (SP: β = 0.232, f2 = 0.084) and PT, but less influential than TP. As a result, H7a–H10a were supported, while PCB had a large effect on domestic hydrogen acceptance (DHA: β = 0.674, f2 = 0.833). PCB also positively mediated the relationship between PT, TP, SP, and PP in predicting DHA, thus confirming H12a–H12d, in addition to H11a. Compared to the direct effect of PT, TP, SP, and PP on PCB, the indirect effect of each construct on DHA decreases by ∼32%.
Finally, DHA had a large effect on willingness to adopt a hydrogen home (WTA) (β = 0.628, f2 = 0.650). Consequently, DHA positively mediates the relationship between PCB and WTA (β = 0.423, p < 0.001), confirming support H13a and H14. The modelling approach provides a robust theoretical and empirical starting point for understanding the dynamics of domestic hydrogen acceptance and adoption, as supported by graphical outputs displayed in Fig. 8a and b (see SN12†).
 | ||
| Fig. 8 (a) Structural model path coefficients and indicator loadings. (b) Structural model path coefficients and t-statistics. | ||
In predicting perceived community benefits, the trust-based model demonstrated moderate levels of explanatory predictive power (R2 = 0.561). However, in-sample predictive power was somewhat lower for domestic hydrogen acceptance (R2 = 0.454) and willingness to adopt a hydrogen home (R2 = 0.394). By comparison, the DHAM demonstrated stronger predictive power by operationalising ten exogenous constructs (R2 = 66.9%), as did the STEEEP Framework when measuring perceived adoption potential via five exogenous predictors and a higher-order construct for technology perceptions (R2 = 61.2%). However, both frameworks incorporated the emotional dimension into the modelling approach, among other constructs, which largely explains the discrepancy in results. Overall, the trust-based model performs comparably or outperforms similar approaches in the literature,287 as further discussed in Section 7.
The cross-validated predictive ability test (CVPAT)‡‡‡ is a recommended technique for statistically assessing out-of-sample predictive power.137 The trust-based model demonstrated predictive validity by outperforming the indicator average (IA) prediction benchmark, as reflected by a negative and significant difference for all endogenous constructs and the overall model (see Table 8).137 However, refinements are needed to raise predictive accuracy since the model failed to outperform the more conservative linear model (LM) prediction benchmark,316 following a positive average loss difference in all cases. Accordingly, research innovations are required to increase the predictive power of trust-based, hydrogen technology acceptance models, as highlighted in Section 7.
| Target construct | PLS-SEM vs. indicator average (IA) | ||||
|---|---|---|---|---|---|
| PLS loss | IA loss | Average loss difference | t-Value | p-Value | |
| Domestic hydrogen acceptance | 3.046 | 4.874 | −1.828 | 18.541 | <0.001 |
| Perceived community benefits | 2.580 | 4.316 | −1.736 | 17.55 | <0.001 |
| Public trust | 2.346 | 5.534 | −3.188 | 30.878 | <0.001 |
| Willingness to adopt H2 home | 0.875 | 1.039 | −0.164 | 11.875 | <0.001 |
| Overall | 2.282 | 4.769 | −2.488 | 31.798 | <0.001 |
| Target construct | PLS-SEM vs. linear model (LM) | ||||
|---|---|---|---|---|---|
| PLS loss | LM loss | Average loss difference | t-Value | p-Value | |
| Domestic hydrogen acceptance | 3.046 | 2.471 | +0.575 | 9.491 | <0.001 |
| Perceived community benefits | 2.580 | 2.433 | +0.146 | 5.796 | <0.001 |
| Public trust | 2.346 | 0.000 | +2.346 | 52.707 | <0.001 |
| Willingness to adopt H2 home | 0.875 | 0.823 | +0.052 | 4.539 | <0.001 |
| Overall | 2.282 | 0.687 | +1.594 | 52.819 | <0.001 |
6.3 Results from importance-performance map analysis
To further examine the antecedents of public trust in the domestic hydrogen transition, importance-performance map analysis (IMPA) is undertaken at both the construct and indicator level (see Fig. 9). Following the structural model, social trust has the largest effect size (i.e. importance) while trust in R&D has least importance, as reflected by a degree of separation on the matrix. | ||
| Fig. 9 Importance-performance map analysis for public trust. Blue = trust in the energy sector (NRG); red = trust in the government (GOV); brown = trust in product and service quality (QUAL); mauve = trust in R&D; grey = social trust (ST). | ||
In terms of both importance and performance, there is negligible difference between trust in the energy sector and trust in product and service quality. However, trust in R&D outperforms trust in the government, therefore, more resources should be allocated towards improving trust in the central government, regional authorities, and local councils, as compared to trust in NGOs, universities, and other research institutes or organisations.
At the indicator level, alongside trust in the central government (LV = 39.653), trust in the media (LV = 40.336) has the lowest performance. By comparison, the mean performance level across all 16 indicators is 51.609 (SD = 6.38), with seven indicators falling below the mean (3 for GOV, 2 for NRG, 2 for ST). However, there is less variance in terms of importance (M = 0.082, SD = 0.006). The largest effect sizes are attributed to trust in boiler manufacturers (β = 0.091), electricity and/or gas suppliers (β = 0.089), and fuel/gas supply companies (β = 0.088). The finding signals the importance of raising confidence in the energy sector and supply chain to support the deployment of hydrogen home appliances.
Additionally, improving the credibility of the media would help support the domestic hydrogen transition through stronger public trust. Furthermore, raising social trust calls for a combined strategy to improve public perceptions of GDNOs, financial institutions, and Ofgem. Overall, the systems-oriented dimension of public trust should be raised first and foremost (i.e. ST), followed by the industry-, supply-chain-, institutionally-, and knowledge-oriented dimensions (i.e. NRG, QUAL, GOV, and R&D).
6.4 Necessary condition analysis
| Construct | Accuracy (%) | Number of observations above ceiling zone | Slope | Intercept | Effect size |
|---|---|---|---|---|---|
| a **Medium effect size. *Small effect size. | |||||
| H1b: GOV | 99.512 | 9 | 0.410 | 58.58 | 0.184* |
| H2b: NRG | 99.187 | 18 | 0.655 | 35.89 | 0.293* |
| H3b: QUAL | 98.753 | 23 | 0.751 | 26.76 | 0.337** |
| H4b: R&D | 98.916 | 20 | 0.712 | 33.42 | 0.291* |
| H5b: ST | 99.079 | 17 | 0.629 | 36.67 | 0.296* |
 | ||
| Fig. 10 (a) NCA scatterplot for trust in product and service quality as a predictor of public trust. (b) NCA scatterplot for trust in the energy sector as a predictor of public trust. (c) NCA scatterplot for trust in product and service quality as a predictor of public trust. (d) NCA scatterplot for trust in research & development as a predictor of public trust. (e) NCA scatterplot for social trust as a predictor of public trust. | ||
Following the NCA significance test, Table 10 displays the level each (sub-)factor must reach to enable specific levels of public trust (i.e. necessary conditions in degree).120 According to the bottleneck analysis, reaching up to 20% of PT requires no minimal level of trust in the government, energy sector, product and service quality, R&D, or ST (see SN13†). However, at the 30% level of public trust, QUAL becomes a necessary condition, while at the 40% level all factors except for GOV are preconditions for enabling the target outcome. Notably, GOV only becomes a prerequisite factor at the 70% level, where 18.65% of respondents fell short of meeting this threshold. By contrast, once public trust reaches 60%, the failure rate (FR) for NRG, QUAL, and ST already reaches over 20% (M = 21.79%, SD = 0.27).
| Target outcome | Failure rate per construct (%) | ||||
|---|---|---|---|---|---|
| PT | GOV | NRG | QUAL | R&D | ST |
| 0 | NN | NN | NN | NN | NN |
| 10 | NN | NN | NN | NN | NN |
| 20 | NN | NN | NN | NN | NN |
| 30 | NN | NN | 0.76 | NN | NN |
| 40 | NN | 2.44 | 3.14 | 1.62 | 1.70 |
| 50 | NN | 8.29 | 8.29 | 4.93 | 7.97 |
| 60 | NN | 21.79 | 21.52 | 12.79 | 22.06 |
| 70 | 18.65 | 38.21 | 45.37 | 28.67 | 45.31 |
| 80 | 49.49 | 67.86 | 70.35 | 56.48 | 76.59 |
| 90 | 85.47 | 88.40 | 91.76 | 81.90 | 94.91 |
| 100 | 99.19 | 98.48 | 98.37 | 96.59 | 99.78 |
It follows that at medium levels of public trust, three of the must-have factors largely converge as necessary conditions, while GOV is the least critical factor followed by QUAL. However, at the maximum level of public trust, all five factors show strong levels of convergence, wherein few respondents satisfied the threshold level for realising the desired outcome (M = 98.48%, SD = 1.20).
In view of the observed patterns up to the 60% level and at the 100% level, Fig. 11 provides the bottleneck chart results for 70–90% of public trust, which may prove feasible to secure through strategic interventions.§§§ Building on the observations reported for the 70% level, once public trust reaches 80%, social trust becomes the most critical factor, followed closely by trust in product and service quality, and the energy sector. However, trust in R&D and the government remain comparatively less critical, although more than half of the sample already fail to meet the required threshold (M = 52.30%, SD = 4.94). The result underscores the extent to which the domestic hydrogen transition is currently constrained by an underlying deficit in public trust, which cuts across multiple dimensions.
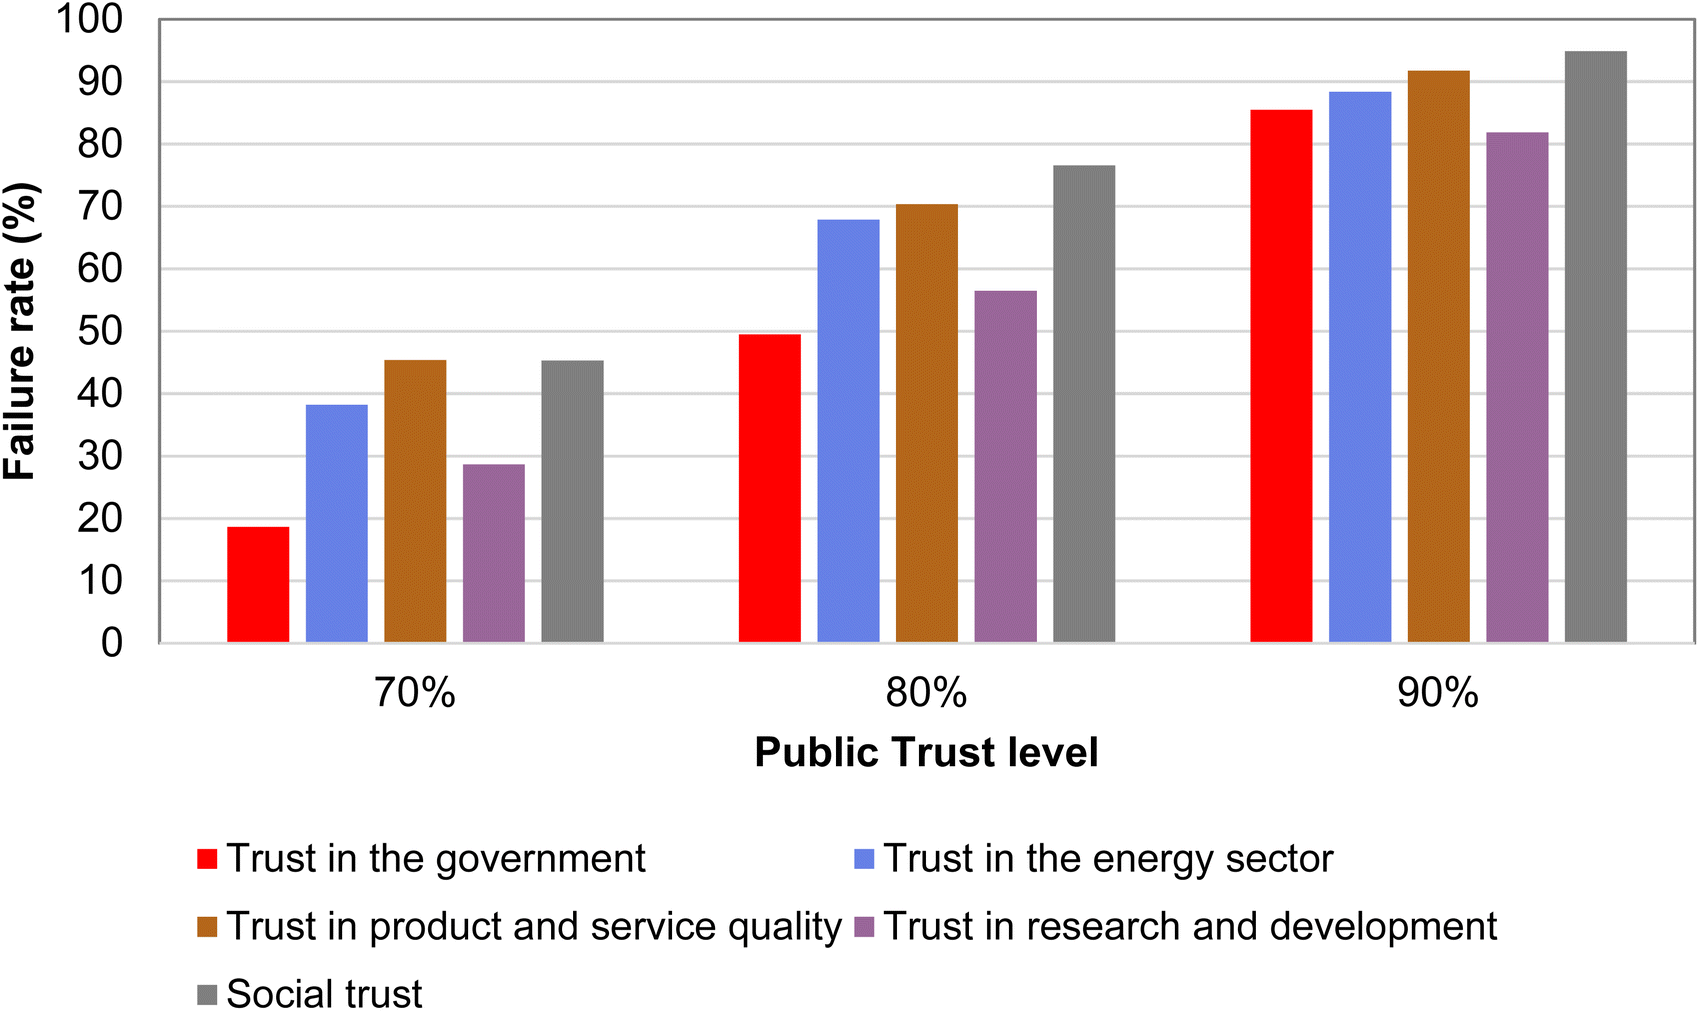 | ||
| Fig. 11 Bottleneck charts for public trust in the domestic hydrogen transition. | ||
While the variance between trust factors is similar at the 60–80% level of public trust (60%: M = 15.63%, SD = 9.57; 70%: M = 35.24%, SD = 11.53; 80%: M = 64.15%, SD = 10.96), critical thresholds begin to converge more closely at the 90% level (M = 88.49%, SD = 5.11). At this level, social trust is the most important prerequisite for securing public trust (FR = 94.91%), while trust in R&D is the least important precondition (FR = 81.90%).
In summary, it emerges that public trust in the domestic hydrogen transition will be disabled when social trust, in addition to trust in the government, energy sector, product and service quality, or R&D are absent. At present, achieving a medium-to-high level of public trust is constrained by a substantial deficit across each of the five dimensions presented Fig. 7, which operate as both should-have and must-have factors for enabling public trust in domestic hydrogen futures,33,106 as described in Table 11.
| Construct | PLS-SEM results (path coefficient; p-value) | NCA results (d; p-value) | Combined result |
|---|---|---|---|
| Trust in the government (GOV) | H1a: significant determinant (0.214; <0.001) | H1b: necessary condition (0.184; <0.001) | • Significant determinant and a necessary condition |
| Trust in the energy sector (NRG) | H2a: significant determinant (0.236; <0.001) | H2b: necessary condition (0.293; <0.001) | • Significant determinant and a necessary condition |
| Trust in product and service quality (QUAL) | H3a: significant determinant (0.233; <0.001) | H3b: necessary condition (0.337; <0.001) | • Significant determinant and a necessary condition |
| Trust in research and development (R&D) | H4a: significant determinant (0.205; <0.001) | H4b: necessary condition (0.291; <0.001) | • Significant determinant and a necessary condition |
| Social trust (ST) | H5a: significant determinant (0.263; <0.001) | H5b: necessary condition (0.296; <0.001) | • Significant determinant and a necessary condition |
| Construct | Accuracy (%) | Number of observations above ceiling zone | Slope | Intercept | Effect size |
|---|---|---|---|---|---|
| H7b: PT | 99.675 | 6 | 1.340 | 60.19 | 0.061 |
| H8b: TP | 99.675 | 6 | 0.766 | 59.78 | 0.106* |
| H9b: SP | 98.621 | 7 | 3.439 | 24.94 | 0.083 |
| H10b: PP | 98.729 | 5 | 1.986 | 22.02 | 0.143** |
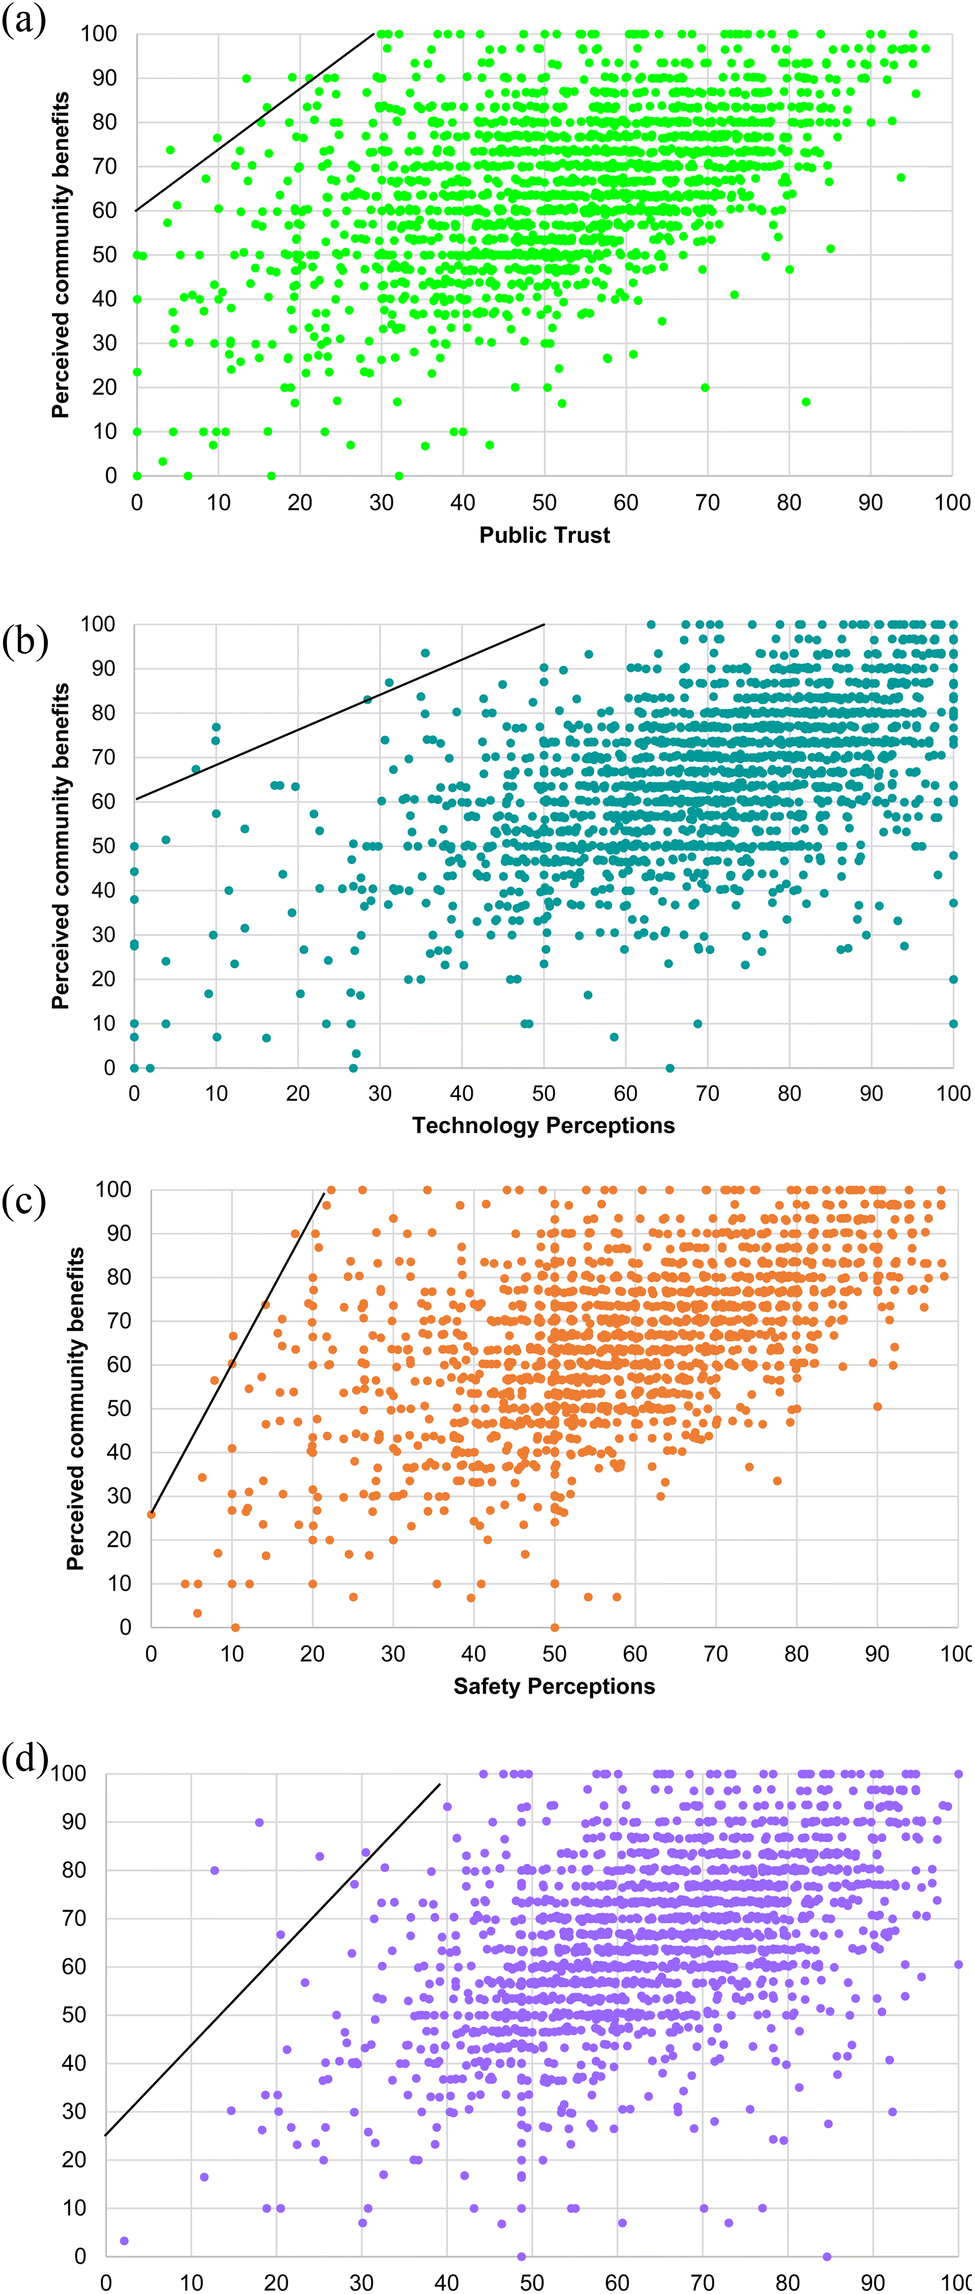 | ||
| Fig. 12 (a) NCA scatterplot for public trust as a predictor of perceived community benefits. (b) NCA scatterplot for technology perceptions as a predictor of perceived community benefits. (c) NCA scatterplot for safety perceptions as a predictor of perceived community benefits. (d) NCA scatterplot for production perceptions as a predictor of perceived community benefits. | ||
To further unpack the dynamics for enabling specific levels of perceived community benefits, Table 13 presents the bottleneck results for each construct. Firstly, it emerges that no specific level of public trust, technology perceptions, safety perceptions or production perceptions is needed to enable perceived community benefits up to the 20% level (see SN14†). However, by the 30% level, a fraction of respondents fail to satisfy the required threshold for safety and production perceptions to enable perceived community benefits. However, technology perceptions only becomes critical to enabling the 60% level, while public trust is influential at the 70% level, which reflects the insignificant finding in Table 12.
| Target outcome (%) | Failure rate per construct (%) | |||
|---|---|---|---|---|
| PCB | PT | TP | SP | PP |
| 0 | NN | NN | NN | NN |
| 10 | NN | NN | NN | NN |
| 20 | NN | NN | NN | NN |
| 30 | NN | NN | 0.05 | 0.05 |
| 40 | NN | NN | 0.11 | 0.05 |
| 50 | NN | NN | 0.27 | 0.16 |
| 60 | NN | 0.49 | 0.76 | 0.43 |
| 70 | 1.19 | 1.19 | 1.08 | 0.92 |
| 80 | 2.93 | 2.06 | 1.57 | 1.84 |
| 90 | 6.40 | 6.18 | 2.01 | 2.87 |
| 100 | 10.57 | 17.51 | 3.31 | 5.42 |
In view of these dynamics, Fig. 13 presents the bottleneck chart results for the 70% level of perceived community benefits through to the maximum level. By visualising the bottleneck results, areas of convergence and divergence can be highlighted. For example, the average failure rate at the 70% level is comparable across all metrics (M = 1.10%, SD = 0.13), while the difference remains negligible at the 80% level (M = 2.10, SD = 0.59). However, at the 90% level, the failure rate is above the mean (M = 4.37, SD = 2.23) for public trust (FR = 6.40%) and technology perceptions (FR = 6.18%). At the maximum level of perceived community benefits, this pattern is partially preserved since public trust (FR = 10.57%) and technology perceptions (FR = 17.51%) fall above the mean value (M = 9.20, SD = 6.32).
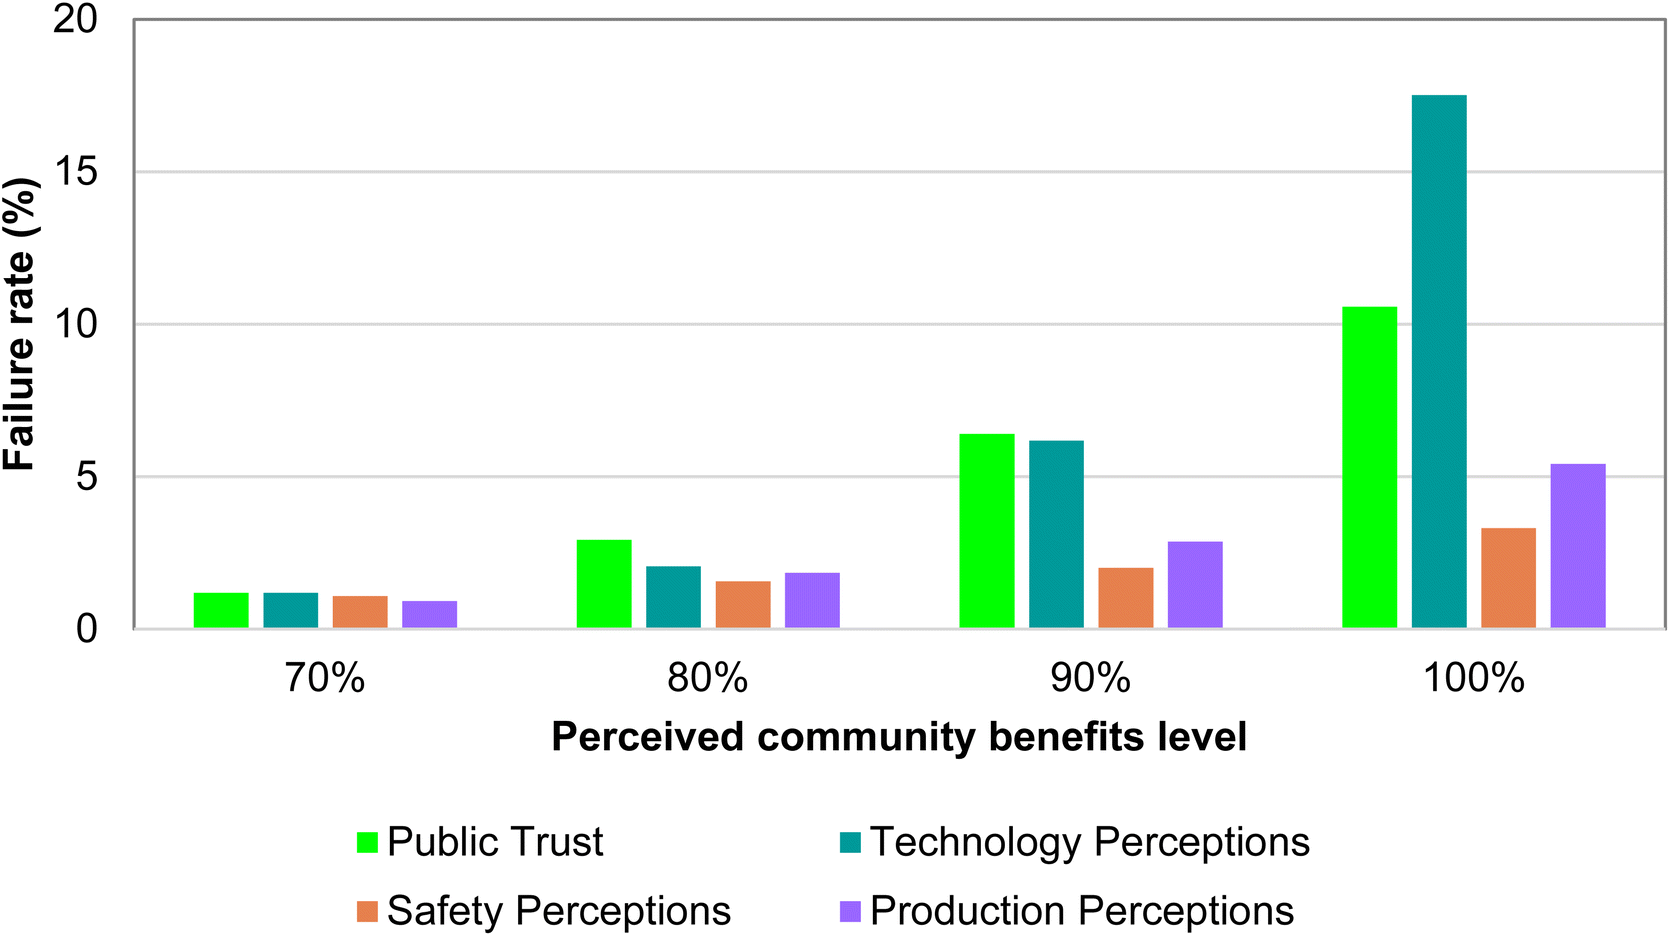 | ||
| Fig. 13 Bottleneck charts for perceived community benefits of transitioning to hydrogen homes. | ||
Accordingly, bottleneck analysis provides a more nuanced interpretation of the role of public trust, technology, safety, and production perceptions in shaping perceived community benefits. While the permutation test indicates that production perceptions and technology perceptions have a small effect size, the significance of public trust and safety perceptions should not be overlooked outright since both factors constrain the potential for maximising perceived community benefits.
Notably, compared to production perceptions, close to twice as many respondents fell short of the required threshold level of public trust to maximise the target outcome. Most strikingly, more than three times as many cases failed for technology perceptions compared to production perceptions, which demonstrates the necessity for improving consumer attitudes towards the technological dimension of hydrogen heating and cooking. Nevertheless, it should be emphasised that other factors can potentially compensate for the absence of public trust and positive safety perceptions, which emerge as should-have factors. By contrast, positive technology and production perceptions are preconditions for facilitating perceived community benefits, as summarised in Table 14.
| Construct | PLS-SEM results (path coefficient; p-value) | NCA results (d; p-value) | Combined result |
|---|---|---|---|
| Public trust (PT) | H7a: significant determinant (0.173; <0.001) | H7b: not a necessary condition (0.061; <0.001) | • Significant determinant but not a necessary condition |
| Technology perceptions (TP) | H8a: significant determinant (0.354; <0.001) | H8b: necessary condition (0.106; <0.001) | • Significant determinant but not a necessary condition |
| Safety perceptions (SP) | H9a: significant determinant (0.232; <0.001) | H9b: not a necessary condition (0.083; <0.001) | • Significant determinant but not a necessary condition |
| Production perceptions (PP) | H10a: significant determinant (0.277; <0.001) | H10b: necessary condition (0.143; <0.001) | • Significant determinant but not a necessary condition |
 | ||
| Fig. 14 Combined importance-performance map analysis for 100% level of perceived community benefits. Construct's average importance = 0.259. Constructs' average performance = 61.036. Bubble size = percentage of cases that have not met the critical threshold. | ||
Additionally, and supplementing the path analysis (see Fig. 8), the four constructs present a linear relationship in terms of performance whereby technology perceptions outperforms public trust by a significant margin (+17.625). Nevertheless, there is still relatively large scope to improve technology perceptions (LV = 69.627), which should be the foremost policy and managerial priority, followed by raising production perceptions (LV = 63.849). While public trust contributes comparatively less significantly to perceived community benefits, decision-makers should nevertheless recognise the underlying opportunity to raise consumer confidence in the prospect of hydrogen homes through awareness campaigns and public engagement.
Accordingly, strengthening public trust may be viewed as a more long-term strategic intervention for fuelling hydrogen futures, which is necessary to counteract risk perceptions and community concerns.317 Importantly, at the maximum level of perceived community benefits, public trust presents a larger bottleneck than production and safety perceptions, reflecting the dynamics observed in Fig. 6 and 7.
| Construct | Accuracy (%) | Number of observations above ceiling zone | Slope | Intercept | Effect size |
|---|---|---|---|---|---|
| H11b: PCB (→DHA) | 99.837 | 3 | 1.022 | 53.798 | 0.104 |
| H13b: DHA (→WTA) | 99.837 | 3 | 1.065 | 43.989 | 0.147 |
 | ||
| Fig. 15 NCA scatterplot for perceived community benefits as a predictor of domestic hydrogen acceptance. | ||
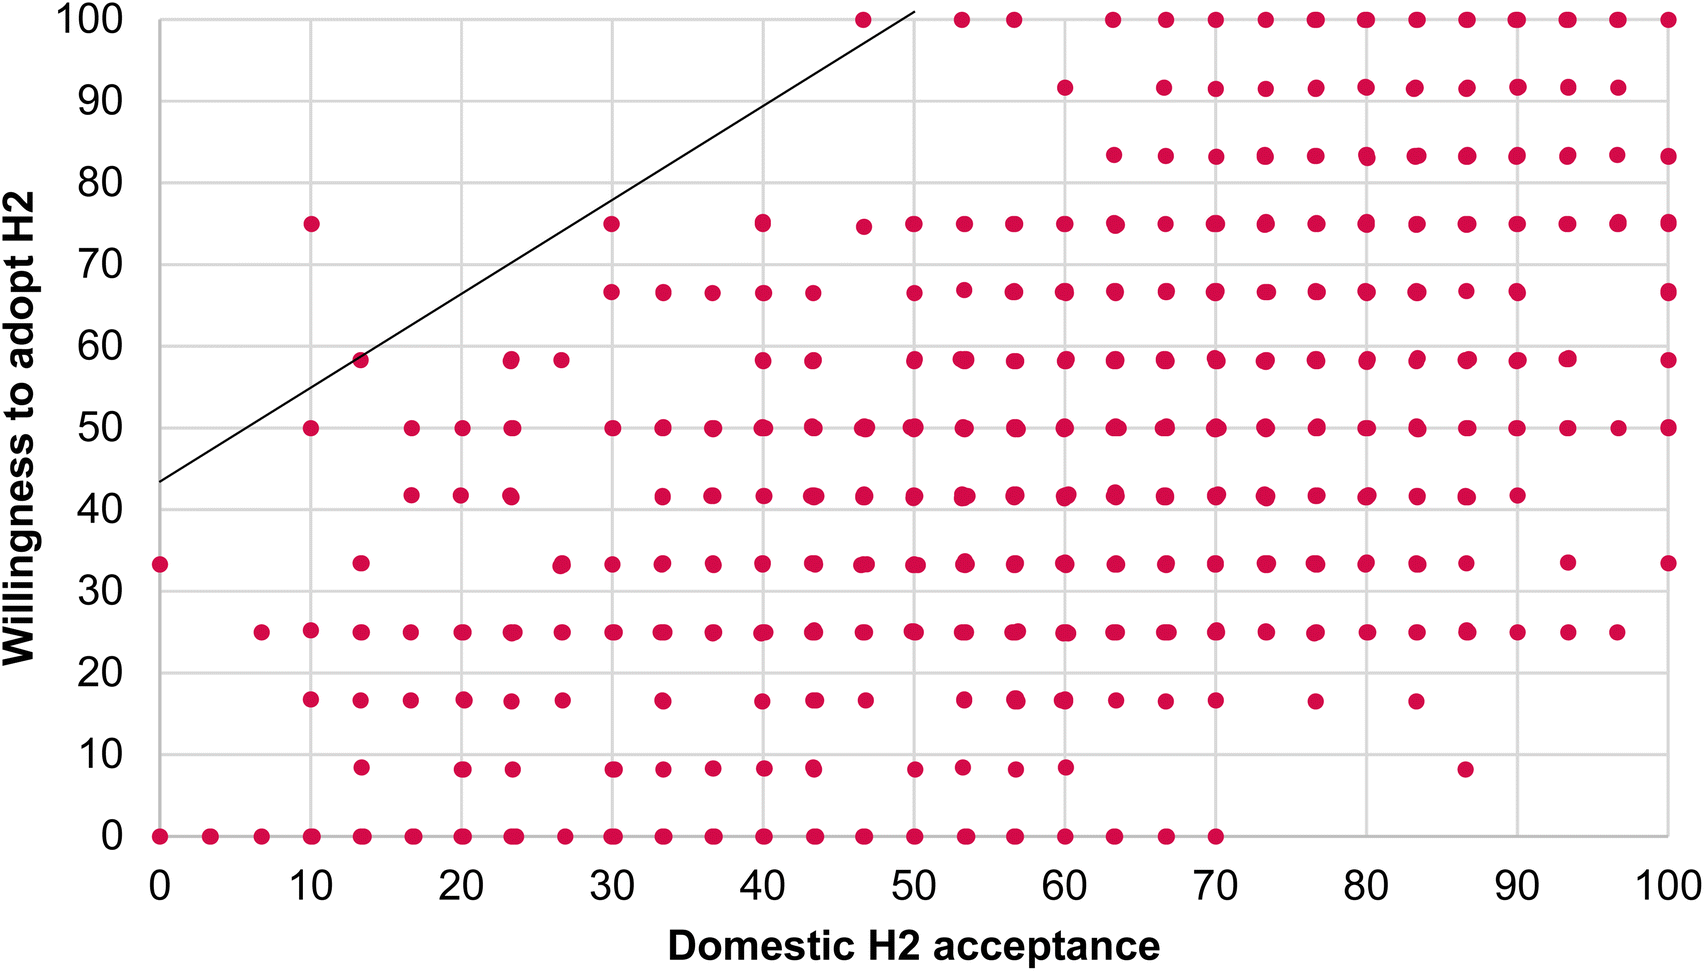 | ||
| Fig. 16 NCA scatterplot for domestic hydrogen acceptance as a predictor of willingness to adopt a hydrogen home. | ||
The bottleneck analysis expounds the dynamics of each relationship, as captured in Table 16 (see SN16†). Perceived community benefits becomes a precondition for enabling social acceptance at the 60% level, while social acceptance is required to facilitate adoption willingness at the 50% level. In response, the bottleneck charts presented in Fig. 17 focus on the 60% level of each target outcome through to the maximum level. The following dynamics are observed: the failure rate for domestic hydrogen acceptance as an enabler of adoption willingness is 7.6, 5.1, 4.3, 2.6, and 2.4 times greater at the 60, 70, 80, 90, and 100 percent level than for perceived community benefits as an enabler of domestic hydrogen acceptance. This translates to 27.0% of respondents failing to meet the threshold for social acceptance to maximise adoption willingness, compared to 11.4% for perceived community benefits when maximising social acceptance.
| Target outcome (%) | Failure rate | Target outcome (%) | Failure rate (%) |
|---|---|---|---|
| DHA | PCB | WTA | DHA |
| 0 | NN | 0 | NN |
| 10 | NN | 10 | NN |
| 20 | NN | 20 | NN |
| 30 | NN | 30 | NN |
| 40 | NN | 40 | NN |
| 50 | NN | 50 | 0.71 |
| 60 | 0.33 | 60 | 2.49 |
| 70 | 1.03 | 70 | 5.20 |
| 80 | 2.01 | 80 | 8.62 |
| 90 | 4.82 | 90 | 12.74 |
| 100 | 11.38 | 100 | 26.99 |
 | ||
| Fig. 17 Bottleneck charts for domestic hydrogen acceptance and willingness to adopt a hydrogen home. | ||
The combined use of PLS-SEM and NCA suggests that perceived community benefits is both a should-have (β = 0.674, p < 0.001) and must-have factor (d = 0.104, p < 0.001) if domestic hydrogen acceptance is to manifest across society. The same holds true when considering the role of domestic hydrogen acceptance in shaping adoption prospects, however, the sufficiency relationship is marginally weaker (β = 0.628, p < 0.001) compared to PCB → DHA, while the necessity relationship is somewhat stronger (d = 0.147, p < 0.001).
These observations enable key stakeholders to reflect on the relative importance of securing economic, social, and environmental benefits for local communities directly involved in the transition to hydrogen homes. In parallel, the results underline the importance of social acceptance as a stepping-stone towards market acceptance and potential technology diffusion.
7 Discussion
This study set out to answer four distinct research questions by examining the antecedents of domestic hydrogen acceptance and adoption via a sufficiency- and necessity-based perspective. The presented evidence bridges a research gap on the dynamics of public trust, while consolidating understanding on the interactions between perceived (community) benefits, social acceptance, and potential technology adoption for supporting the energy transition.7.1 Unpacking the antecedents of public trust in hydrogen homes
Regarding the first research question, the modelling results underscore the extent to which public trust is an inherently multi-dimensional process, shaped by aspects of institutionally-, industry-, supply-chain-, knowledge-, and systems-oriented trust (see Fig. 5). NCA suggests trust in product and service quality for hydrogen appliances is the most important precondition for enabling public trust. This result is validated within the model since technology perceptions has the largest influence on shaping perceived community benefits (see Fig. 8), in addition to functioning as a necessary condition (see Fig. 12b). While trust in the hydrogen supply chain presents a potentially critical bottleneck to establishing public trust, institutional trust is comparatively less imperative (see Table 12). However, in terms of increasing public trust, the systems-oriented dimension carries the most weight (see Fig. 8) and presents the largest bottleneck (see Fig. 11).It follows that building social trust, as characterised within the context of this study (see Section 5), is the most direct measure for increasing public trust in hydrogen homes, which aligns to the multi-country findings captured by Smith and Mayer242 when examining public engagement with climate change. Nevertheless, public trust is also contingent upon sufficient levels of trust in the energy sector, and to a lesser degree, entities involved in R&D-related activities. Importantly, Emmerich and colleagues245 highlighted that trust in industry is significant for generating both general and local acceptance in HFSs across the German population. The crucial role of the energy sector as brokers of public trust is reflected in the modelling results since production perceptions emerged as the most important precondition of enabling perceived community benefits. Relatedly, in the UK context, Lee and Reiner213 observed that pro-renewable respondents assign more importance to the role of companies compared to the government when it comes to addressing climate change.
Notably, the largest deficits in public trust stem from negative perceptions of the central government and media (see Fig. 6), which is consistent with national survey data collected in 2022 (N = 3162)318 and reflective of the political challenges facing deep decarbonisation.243 Consolidating social trust will hinge on both sets of actors, since national media coverage frequently reflects the sub-par performance of the UK government and its energy policy representatives.319–321 It follows that media narratives and discourses may impede public trust in the domestic hydrogen transition.322–324
Fig. 18 relays the extent to which trust in the government, and by proxy public support for net-zero technologies such as hydrogen appliances, may be contingent on the political cycle and macro-economic events.64 It can be deduced that trust in the government and media is quite closely correlated, although historically the UK public has proved more trusting of the government. Recent trends caution that political mistrust may present a significant bottleneck to enacting net-zero mandates,79 while public trust in the business sector and NGOs has declined slightly since 2020.
 | ||
| Fig. 18 UK trust index, January 2020 to October 2023. Source: authors' illustration based on Edelman Trust Barometer.325–327 Dotted black line = time of data collection for this study (Oct–Dec 2022). | ||
Interestingly, average trust levels were lowest In February 2022 (M = 33), likely due to the ramifications of COVID-19 alongside the energy crisis but recovered somewhat by November 2022 (M = 43) before declining again in 2023 (M = 37). Overall, November 2022 is closely representative of the four-year period (M = 42.0, SD = 5.7; interquartile range (IQR) = 37.0–44.5), highlighting the relevance of analysing the current dataset (i.e. also collected in Q4 of 2022). Moreover, public trust levels were higher between 2020 and 2021 (M = 47, M = 44), which coincided with a period of relative political momentum towards advancing hydrogen homes (see Fig. 1). By contrast, the collapse of planned village trials for the North of England transpired during a year of underlying distrust. Extrapolating these observations, it can be concluded that trialling hydrogen homes may prove more socio-politically feasible under conditions of stronger public trust.
Kitt et al.211 also found higher levels of competence-based and integrity-based trust in the Federal government compared to the provincial government when evaluating public attitudes towards low-carbon transportation policies in Canada. Whereas trust in the nationwide energy transition among Dutch homeowners¶¶¶ fell more comfortably above the mid-point (M = 3.96 on a 7-point scale),328 this study reveals lower levels of public trust in hydrogen homes across the UK population. Given the evidence presented in Section 4.2, this study further motivates the need for cross-national comparative research on trust mechanisms shaping hydrogen-fuelled futures.329,330
Given that the Edelman Trust Barometer331 ranked the UK as having the fourth lowest (43/100 points) and lowest trust ranking (39/100 points) out of 28 countries for 2023 and 2024, respectively, this analysis reflects trust dynamics in the hydrogen transition under unfavourable socio-political conditions (see Fig. 18). Notably, ten other countries in addition to the UK were allocated a ‘distrust’ rating for 2023 and 2024 (Sweden, Ireland, United States, France, South Africa, Germany, Spain, Argentina, Japan, and the Republic of Korea).331 Alongside the UK, most of this group has advanced national hydrogen strategies, with several members taking a leadership position in the emerging global hydrogen economy.||||||25
Fig. 19 provides additional comparative insights by incorporating average trust ratings for the six countries reviewed in Section 2, wherein three countries qualify for the ‘neutral’ category (i.e. trust index >50), namely, the Netherlands (M = 57), Canada (M = 54), and Australia (M = 51). Alongside the UK (M = 43), Japan and Germany correspond to the ‘distrust’ category. Japan ranks below the UK (M = 40), while Germany performs marginally better (M = 47). Cumulatively, the small sample averages a distrust rating of 48.5 (SD = 6.7; IQR = 43.0–54.0), while Edelman331 report higher levels of public trust in developing countries (M = 63) compared to developed countries (M = 49). Foremost, China (M = 80) and India (M = 75) enter the ‘trust’ category, although China had a democracy index of 2.1 in 2023 compared to 7.2 for India, reflecting the pronounced political distinction between the world's most populous countries.
 | ||
| Fig. 19 Edelman Trust Index, 2019–2024. Source: authors' illustration based on the Edelman Trust Barometer.331,343–346 | ||
The countries composing the small sample rank closely on the 2023 Democracy Index (M = 8.7, SD = 0.3; IQR = 8.4–8.9), while the Kendall's tau-b (τb) (non-parametric) correlation test returns a statistically insignificant result when evaluating the association between democracy and public trust (τb = 0.527, ρ = 0.207). Although the two variables hold a weak positive association (inferring that stronger democracies may partially encouraging higher levels of public trust), the non-significant finding is supported in view of China's leading position in the Edelman Trust Barometer and also aligns with Jordan et al.‘s perspective of public trust in climate policy.243
While the Edelman Trust Barometer is but one source of information and not without its limitations,332 it is notable that Japan and South Korea were the first countries to launch national hydrogen strategies67 but continue to face social acceptance challenges in this domain.22,333 In April 2020, the Netherlands became the first European country to publish its national hydrogen strategy and like the UK has ambitious plans for developing an industrially-based hydrogen economy.334 Notably, hydrogen acceptance research has been pioneered by Dutch scholars since the early 2000s335,336 and substantially extended thereafter.248,337,338 Crucially, the Netherlands has experienced greater success in trialling hydrogen homes compared to the UK.339,340 Given that UK government funding has also supported social science research on hydrogen acceptance,280,341,342 one explanatory factor for this divergence could be public trust (see Fig. 19).
| Actor/stakeholder | NL, 2014 (H2 supporters)248 | NL, 2014 (H2 opponents)248 | AU, 2018 (ref. 44) | AU, 2019 (ref. 250) | AU, 2021 (ref. 45) | DE, 2020 | DE, 2023 (ref. 347) | GB-SCT, 2023 (ref. 249) | This dataset (GB, 2022) | Sample mean | Difference (this dataset-mean) |
|---|---|---|---|---|---|---|---|---|---|---|---|
| a Calculated by taking the average for trust in research organisations (M = 8.96) and other publicly funded research agencies (M = 9.02). b Specifically, environmental-NGOs. c In the German context, these measures refer to ‘European institutions’, ‘federal politicians’, and ‘local politicians’, respectively. d Denotes ‘larger companies’, whereas small and medium-sized companies are less trusted (M = 5.54). e Calculated by taking the average for trust in the UK government (M = 4.98) and Scottish government (M = 6.14). f Denotes ‘energy industry corporations’. g Calculated by taking the average for trust in alternative media (M = 5.30) and social media (M = 4.58). | |||||||||||
| Central government | n/a | n/a | 6.64 | 6.22 | 7.06 | n/a | 6.00c | 5.56e | 4.33 | 5.97 | −1.64 |
| Regional authorities | n/a | n/a | 6.64 | n/a | 6.99 | n/a | 5.98c | n/a | 4.94 | 6.14 | −1.20 |
| Local councils | 8.02 | 6.66 | 6.46 | n/a | 6.91 | 7.29 | 5.98c | n/a | 5.17 | 6.64 | −1.47 |
| Fuel/gas supply companies | 6.56 | 5.16 | 5.94 | n/a | 5.83 | n/a | 7.32d | 5.84f | 5.32 | 6.00 | −0.67 |
| Electricity/gas suppliers | n/a | n/a | 5.98 | n/a | 6.19 | n/a | 7.32d | 5.84f | 5.39 | 6.14 | −0.75 |
| Trade bodies | n/a | n/a | n/a | 7.18 | n/a | n/a | n/a | n/a | 5.76 | 6.47 | −0.71 |
| H2 appliance manufacturers | n/a | n/a | 6.30 | 6.82 | 6.43 | 7.34 | n/a | n/a | 6.15 | 6.61 | −0.46 |
| NGOs | n/a | n/a | n/a | 7.44 | 7.40b | n/a | 6.24 | n/a | 5.72 | 6.70 | −0.98 |
| Universities | n/a | n/a | 7.28 | 9.10 | 7.49 | n/a | 5.34 | 9.00 | 6.49 | 7.45 | −0.96 |
| Other research institutions | n/a | n/a | 7.62 | 8.99a | 7.76 | n/a | 4.62 | 9.00 | 6.45 | 7.41 | −0.96 |
| Independent organisation | n/a | n/a | n/a | 8.12 | n/a | n/a | n/a | n/a | 5.97 | 7.04 | −1.08 |
| Media | n/a | n/a | 6.04 | 5.46 | 6.21 | n/a | 6.00 | 4.94f | 4.40g | 5.51 | −1.11 |
| Mean | 7.29 | 5.91 | 6.54 | 7.42 | 6.83 | 7.32 | 6.09 | 6.70 | 5.51 | 6.48 | −0.97 |
Additionally, only four countries compose the small sample, namely, Australia (N = 3), Germany (N = 2), the Netherlands (N = 1), and Scotland (N = 1), leaving a specific research gap on public trust dynamics in Canada and Japan. Whereas over-representation from Australia provides a longitudinal evidence base on trust in hydrogen between 2018–2021,44,45,250 the Dutch study dates to 2014 and provides just two data points, albeit for both hydrogen ‘supporters’ and ‘opponents’ of fuelling stations.248 Critically, trust in industry (fuel station owner and supplier) and in the municipality is significantly higher among supporters, reflecting the positive relationship between public trust and hydrogen acceptance.248
Overall, from a maximum potential of 108 data points, only 60 measures are provided across the sample (∼55.6%) and no study engages directly with residential hydrogen as an end-use. A further drawback is the use of a range of Likert scales, which deviate in their descriptions by incorporating options such as ‘neither agree nor disagree’ or ‘don't know’ as mid-points, whereas this study employs an 11-point scale measuring from ‘No trust’ (0) to ‘Total trust’ (10). Accordingly, all results have been converted to a 10-point scale (1–10) for uniformity.
At the national level, Table 17 shows that public trust in various stakeholders is highest, on average, in Australia (M = 6.93), followed by Germany and Scotland (M = 6.70), and the Netherlands (M = 6.60), compared to a mean score of 5.51 for this dataset. Put into context, the results suggest comparatively higher levels of public trust under the following conditions: (1) stakeholder communication regarding the risks and benefits of hydrogen in Australia, as gauged during 2018;44 (2) whether key actors will act in the best interest of consumers in respect to developing Australia's hydrogen economy, as measured in 2019 and 2021.45,250 In the German context, the earlier study (similar to the Dutch example) takes HFSs as its use case, while the more recent study asked respondents to evaluate the “extent to which they consider different actors to be generally trustworthy sources of information about energy technologies”, as framed to the context of green hydrogen production.347
Finally, the Scottish study249 focuses on green hydrogen as a power source for outdoor festivals, while also adopting a generic approach by asking survey respondents to evaluate “trust in organisations to communication with the public reliable and accurate information about energy technologies.” Thus, the comparative results provide initial proxies for judging whether public trust in hydrogen-based energy futures may differ according to socio-economic and cultural dynamics, and other contextual factors. While serving as useful indicators, the results should not be extrapolated beyond reason given the significant variance in time-periods, research designs, and hydrogen use cases, which may also vary in terms of their current activities in each country (see Section 2).
In summary, the following patterns can be observed in the data when considering how the UK public compares internationally (including Scotland as a single entity): (1) the trust deficit is most pronounced in relation to trust in the government, which is consistently higher across all three levels; (2) trust in the media is also significantly lower in the UK; (3) independent organisations in other countries are more trusted compared to Ofgem in the context of this study; (4) trust in R&D is also lower but varies minimally between NGOs, universities, and other research institutions (M = −0.97, SD = 0.01); (5) trust in fuel/gas suppliers, electricity/gas suppliers, and trade bodies is lower and clustered closely, but less pronounced by comparison (M = −0.71, SD = 0.04); and finally, (6) there is limited difference regarding trust levels in different hydrogen appliance manufacturers (i.e. boiler industry and car industry). The latter observation suggests trust in industry remains slightly higher compared to trust in the energy sector, which aligns with the results presented in Fig. 7.
One of the key takeaways is that public trust across different regions of the UK may differ substantially, with evidence suggesting that hydrogen applications may encounter less social resistance in Scotland348,349 compared to England and Wales.324,350,351 Similar dynamics could also prevail between different autonomous regions in other countries, motivating the need to evaluate trust dynamics at the sub-national level in future research.
7.2 Insights on public trust from a multigroup perspective
The need to account for distinct consumer profiles has been emphasised by Huan et al.317 when examining risk perceptions of hydrogen infrastructure in the Japanese context. Specifically, the researchers performed a multigroup comparison between accident-aware and accident-unaware groups, which detected five statistically significant differences from 14 hypotheses. However, the path relationships involving trust in hydrogen technology failed to demonstrate group-specific differences.**** By contrast, in respect to the second research question, evidence suggests that the antecedents of public trust vary significantly across parts of the UK population, as represented within this sample (see Section 3.1).The multigroup analysis presented in Section 6.1 underscores the degree to which higher levels of technology and environmental engagement strengthens consumer confidence across all five sub-dimensions of public trust. Moreover, given the consistency of the trends observed in Fig. 7, it is suggested that fuel stressed citizens are not distinct from non-fuel-stressed citizens, provided both sub-groups have a less than moderate level of engagement in technology and the environment.
The observed disparity between specific sub-groups may support the notion that income inequality diminishes the capacity for trust,352 since the VEG had a higher proportion of respondents with an annual income greater than £41500 (+13.4%) compared to the sample average and foremost the FSG (−6.9%).†††† The literature has also identified a largely universal pattern regarding the positive effect of age on generalised trust, which could translate to the current context since the FSG was significantly under-represented by respondents aged 55+ (−7.4%), whereas both the MEG (+5.7%) and VEG (+2.8) were over-represented compared to the sample average and the BLG (−1.1%).
While several variables could potentially moderate the trust-based relationships in domestic hydrogen futures, the modelling results suggest public perceptions regarding the role of different stakeholders in supporting ‘a cost-effective, efficient, and fair transition to hydrogen homes’ may depend on pre-existing levels of climate change awareness, engagement in renewable energy technologies, and consumer innovativeness. In response, policy makers and key actors including GDNOs can respond more directly to the underlying deficit in public trust101 by targeting improvements across specific areas such as trust in the central government and energy industry, while ensuring direct outreach towards fuel stressed households is prioritised.
The presented findings have marked implications for deepening understanding of trust dynamics in hydrogen futures353 and associated governance mechanisms pertaining to public trust.354 The findings motivate further investigation regarding the mediating effect of technology and environmental engagement in shaping trust levels and social acceptance. Optimally, researchers should test the combined and individual effect of technology engagement and environmental engagement to discern clearer insights, while recognising the need to gather longitudinal evidence on how trust and social acceptance dynamics change over time,355,356 in line with macro-level events such as political elections and economic crises.101
Ultimately, further research should be conducted to verify the extent to which raising technology and environmental engagement levels across the general population may precipitate increased trust and optimism towards domestic hydrogen futures.91,357 A case in point is the laggard diffusion of smart meters in the UK (∼57% in 2023),358 which has seen the 2019 target for nationwide deployment missed by a sizeable margin.359 In response, the government has extended legislative powers up to 2028 for enacting the smart meter rollout.360,361 To date, consumer resistance has originated from a lack of perceived benefits and heightened financial concerns for at-risk consumers, which has instilled a sense of scepticism and mistrust in the rollout.359,362 In the context of this research, the foremost priority should be to extract lessons from the smart meter rollout for navigating deployment challenges in the residential context,363 while broadening the cross-national evidence base on the relationship between energy transition-related consumer engagement, public trust, and (domestic) hydrogen acceptance.
7.3 Unpacking the antecedents of perceived community benefits in hydrogen homes
Tackling the third research question, this study suggests the perceived community benefits of domestic hydrogen will be shaped strongly by technology and production perceptions, and to a lesser extent safety perceptions and public trust. However, production perceptions is the foremost necessary condition for manifesting perceived community benefits, followed by technology perceptions. By contrast, safety perceptions and public trust, while having a small effect size from an NCA perspective, are not prerequisites for facilitating perceived community benefits. By integrating PLS-SEM and NCA, the study elucidates critical insights regarding the antecedents of perceived economic, social, and environmental benefits, which are crystallised via cIMPA (see Fig. 14).It follows that perceptions of hydrogen boiler and hob performance translate strongly into how consumers view potential socio-economic and environmental benefits, which may be anticipated due to presumed energy efficiency improvements and reduced carbon emissions. Relatedly, public support for hydrogen production pathways – vis-à-vis the twin-track production approach – contributes towards expectations for better air quality and improved health, which may be associated with boosting local (hydrogen) economies, reducing energy insecurity, and alleviating fuel poverty pressures. Safety is paramount to deploying hydrogen homes,33 with positive attitudes towards hydrogen appliances, pipeline transport, and underground storage serving to strengthen perceived community benefits, thus bolstering social acceptance.34 Nevertheless, safety perspectives are non-essential to securing perceived community benefits as a target objective. As highlighted in Table 14, the same relationship holds true for public trust, despite its underlying contribution towards raising domestic hydrogen acceptance.34
A likely explanation for the dichotomy observed in Fig. 14 is the lower extent to which safety-related aspects and public trust map directly on to socio-economic or environmental benefits at the community (or individual) level. While both factors constrain perceived community benefits to an extent, neither safety perceptions nor public factor is essential for ensuring the target outcome. Thus, alongside technology and production perceptions, other factors can compensate for the absence of positive safety perceptions and public trust regarding hydrogen homes. It is probable that perceptions of procedural and distributional justice will play a critical role in shaping and strengthening the perceived community benefits of hydrogen homes,102,251 as recognised in the context of low-carbon retrofitting in Wales,364 HFSs in the Netherlands and Germany,245,248 and CCS,365,366 among other technologies and contexts.367–369
In view of the presented evidence base, stakeholders should dedicate resources towards solidifying the environmental credentials of the twin-track production approach. However, this important course of action may call for clearer distinction between the merits of a blue and green hydrogen production pathway when relaying policy plans and decarbonisation targets to local communities.25,99 The technological and environmental dimensions of domestic hydrogen futures are inextricably linked,33 motivating energy suppliers, appliance manufacturers, and other supply-chain actors to take stock of whether converting to hydrogen homes can secure a relative advantage over natural gas,103 in addition to supporting net-zero ambitions.14,15 Absent of overcoming well-documented techno-economic barriers,84,86,91 the stark reality is that hydrogen heating and cooking technologies will continue to face seemingly insurmountable social acceptance challenges to being trialled in UK homes.
Prior research has distinguished between the perceived individual and collective benefits shaping behavioural acceptance for low-carbon energy technologies.105,370–372 Surveying the German public, Korcaj et al.373 found that collective benefits (perceived environmental benefit and perceived economic benefit) and individual benefits (perceived social status benefit, perceived autarky benefit, perceived financial benefit, and perceived overall cost) explained 68% of the variance in consumer attitude towards solar PV. However, attitude, subjective norm, and perceived behavioural control explained no more than 42% of the variance in purchase intention. A more recent model applying an extended theory of planned behaviour (TPB) approach explained 63.3% and 46.6% of the variance in behavioural attitude towards solar PV and adoption intention.287 By contrast, while behavioural attitude was explained to a similar extent for energy efficient appliances (66.4%), the model explained just 25.2% of the variance in adoption intention, underlining the need to move beyond a TPB-based research lens. Accordingly, this study further highlights the challenge posed by the behaviour-intention gap, while drawing attention to the importance of perceived individual and collective benefits in shaping technology acceptance and adoption.
7.4 Distilling the dynamics of domestic hydrogen acceptance adoption potential
Regarding the remaining research question, perceived community benefits explains 45.4% of the observed variance in domestic hydrogen acceptance, which in turn explains close to 40% of the variation in willingness to adopt a hydrogen home (see Fig. 8). Thus, when operationalised as a mediator within the trust-based framework, the influence of perceived community benefits (β = 0.674, f2 = 0.833) increases substantially compared to the DHAM (β = 0.276, f2 = 0.111).34 Additionally, this study aligns to prior results in finding perceived environmental benefits to be a more significant predictor than perceived socio-economic benefits, while further underscoring that social acceptance and adoption intention will be strong shaped by individual motivations.373Crucially, if perceived community benefits for hydrogen homes fail to materialise, domestic hydrogen acceptance will not transpire. Similarly, and to a more significant extent, social acceptance must be secured to enable prospects for technology acceptance, as demonstrated across a range of energy deployment contexts.187,214,238,248,263,266 At the dimensional level, it follows that community acceptance must first be established vis-à-vis perceive benefits to facilitate the trialling of hydrogen homes. Community acceptance would help reinforce the necessary conditions for enabling social acceptance, which is a prerequisite for realising market deployment and behavioural acceptance.341
A priority list of actionable steps or ‘target interventions’ for increasing domestic hydrogen acceptance is detailed in Gordon et al.,104 which should be internalised by policymakers and key stakeholders alongside the presented findings on public trust. Ultimately, ahead of prescribing measures to help build public trust and community-level support for emerging hydrogen technologies, it is necessary to firstly evaluate how trust dynamics are unfolding across the actor-network,91,101,102 as advanced within this analysis. Adopting a holistic perspective of how trust mechanisms operate across multiple dimensions (see Fig. 6 and 7) can help support a two-fold objective: (1) increasing the feasibility of achieving a more optimal allocation of resources to support the national hydrogen economy by strategically strengthening trust deficits; (2) enacting measures to correct areas that undermine social trust and thus leveraging opportunities to strengthen hydrogen acceptance by tackling these ‘at risk’ dimensions.
8 Conclusion
Following several years of policy interest in converting the natural gas grid to hydrogen, the UK government is approaching a critical juncture for deciding whether hydrogen homes should support net-zero ambitions in some capacity. Alongside industrial decarbonisation,13,14 reducing household emissions in gas-dependent nations is among the most challenging aspects of the net-zero agenda. Hydrogen technologies could yet prove fundamental to delivering climate change objectives in countries such as the UK, but this possibility will remain highly precarious if public resistance persists. Failure to secure social acceptance for community-level trials in the North of England has cast significant doubt over the future of domestic hydrogen, which can be seen to reflect a climate of public mistrust in the government and energy sector.101This study enhances the discourse on trust mechanisms underlying domestic hydrogen futures by capturing consumer perceptions following the release of the UK Hydrogen Strategy26 and subsequent British Energy Security Strategy;374 but prior to the collapse of planned hydrogen trials for Whitby village93 and Redcar,94 which has curtailed momentum for deploying hydrogen homes.92 It follows that public trust in the domestic hydrogen transition may have decreased since the end of 2022 (see Fig. 18), which should be verified in follow-up research.
The results are noteworthy in demonstrating areas of convergence and divergence when evaluating trust dynamics in a novel context, wherein multiple stakeholders and actors shape public trust levels.214 It follows that social acceptance should be prioritised to a similar level as techno-economic factors (e.g. low capital costs and net energy gain),375 while neutral intermediaries may be needed to engender public trust in emerging technical solutions to environmental challenges.376 As argued by Hanusch and Schad,377 “expertise on the societal effects of the hydrogen transition is in its infancy,” but will prove indispensable to realising desirable visions for national hydrogen economies,378–380 as underscored by industry, policy, and research experts.381
Public trust may partly determine the trajectory of national energy transitions,382 which are shaped by systemic drivers383 and countervailing forces.384 Evidently, a deficit in institutional trust is somewhat pervasive in the UK, with national survey data indicating that 49% of the population do not trust the national government, compared to 35% expressing trust, whereas average trust levels are somewhat higher across the Organisation for Economic Cooperation and Development (OECD).318 As a globally-relevant mechanism shaping the clean energy transition (see Table 2),187,243 researchers should aim to dissect how different components of public trust can be restored, preserved, and strengthened over time. Accordingly, a future research agenda grounded in the approach of this study should incorporate a direct focus on key technologies such as heat pumps and electric vehicles, alongside other use cases beyond the domain of the hydrogen economy.
Although rich in data analysis and supported by an explicit conceptual foundation grounded in the literature, this study is not without its limitations. As noted, survey responses were gathered during a specific time-period (October to December 2022) to support a cross-sectional study engaging with a potential scenario of hydrogen adoption before 2030. It is well documented in the literature that consumer attitudes, perceptions, and intentions may fail to translate into specific real-world behaviours385,386 such as low-carbon technology adoption.105,387 Nevertheless, an interim opportunity for enhancing the evidence base lies with surveying the residents of Whitby village and Redcar following the cancellation of planned hydrogen trials.
Insights from citizens previously engaged in, affected by, or simply exposed to and familiar with hydrogen-related developments in such locations would shed clearer insights on the dynamics of public trust under examination in this study. As already established to a degree in Japan22 and Australia,45 disseminating such studies to the public domain would add momentum towards developing a more explicit longitudinal evidence base, which can be targeted directly in subsequent research projects. Expounding this evidence base has time-sensitive implications, as a hydrogen village trial for Fife in East-central Scotland remains under development,388,389 while similar activities are underway internationally,390–392 as identified in Section 2.
In the context of climate change risk perception, Smith and Mayer242 recognise that trust may entail non-linear dynamics (see Fig. 18 and 19), which warrants significant attention in the context of emerging low-carbon energy technologies such as domestic hydrogen. In response, a public trust tracker is recommended for monitoring citizen perceptions of national hydrogen economies. Qualitative research engagement with different segments of the population is also needed to enrich observations extracted from quantitatively-driven analysis, thereby maximising the benefits of a mixed-methods research paradigm.386,393
Regarding the technological dimension, this study incorporated a dual focus on hydrogen heating and cooking, as reflected by three and two measurement items, respectively. An alternative approach lies with evaluating each aspect independently or otherwise ensuring that an equal number of indicators are employed to support a more balanced representation of hydrogen boilers and hobs in the model. The predictive capabilities of the proposed framework can be further enhanced by integrating additional constructs such as perceived financial benefits287,373 and emotional response239,394,395 into the modelling approach. Supporting this direction, Scheller et al.287 found that product-specific benefits (perceived financial benefits and perceived environmental benefits) had the strongest influence in shaping attitudes and intentions toward low-carbon technologies in the German context. Furthermore, as homeowners progress through the innovation-decision making process,106 perceived financial benefits proved a more salient predictor of adoption intention than perceived environmental benefits for each technology case (rooftop photovoltaic systems, energy efficient appliances, and green electric tariffs),287 which has been observed in related case studies.396–398
Future research should also explore different loci of hydrogen trust and validate new measurement items to improve the predictive performance of the model. Alternative models can be explored and compared in follow-up studies, which may include examining the relationship between cognitive factors (objective and subjective knowledge), trust in hydrogen technology, emotional response (positive and negative affect), safety perceptions, and behavioural response, as discussed in the context of HFSs.317 Critically, Huan et al.317 also underlined the importance of supporting “a continuous and constructive civic discourse to address public concerns and cultivate a milieu of trust for all relevant stakeholders” involved in the Japanese transition to HFCVs, which is a clear imperative for deploying hydrogen homes in the UK.
In addition to pursuing the outlined research direction in the UK context, resources should be allocated towards establishing a cross-national evidence base on public perceptions of the hydrogen homes in relevant countries such as the Netherlands. To date, research on the societal dimensions of hydrogen remains scarce, as well as fragmentary in terms of its geographical scope.377 This trajectory would mark an important step towards understanding cultural differences in perceptions of hydrogen technologies for the residential sector399,400 and can be expanded to compare attitudes across different use cases such as road transport, aviation, and industry, as initiated to an extent in Table 17.
Leveraging a multi-stage empirical analysis, this study enriches the body of knowledge on the trust dynamics of low-carbon energy futures,353 enhances awareness of the need for common but differentiated consumer engagement strategies,401 develops critical insights on the role of perceived community benefits in shaping energy acceptance,402 and advances understanding of the innovation-decision process shaping technology adoption.106,287 By virtue of its scope, novelty and rigour,403 this analysis contributes towards recent efforts to advance a balanced representation of developments in the global hydrogen economy.14,91,404 As tensions in the energy transition continue to be navigated,405,406 accounting for parallel tensions in public trust and associated implications for social acceptance will prove fundamental to fuelling hydrogen-based energy futures.
Data availability
The data supporting this article have been included as part of the ESI.† Survey data is available at the Cranfield Online Research Data (CORD) Repository: https://dspace.lib.cranfield.ac.uk/items/aa4d197c-fa88-4acb-9b84-d67a5acbd574.Author contributions
Joel A. Gordon: conceptualization, investigation, data curation, data analysis, visualization, theoretical framework, writing – original draft, writing – review & editing. Nazmiye Balta-Ozkan: conceptualization, funding acquisition, supervision, review & editing. Anwar Haq: theoretical framework, review & editing. Seyed Ali Nabavi: conceptualization, funding acquisition, supervision, review & editing.Conflicts of interest
The authors declare that they have no known competing financial interests or personal relationships that could have appeared to influence the work reported in this paper.Acknowledgements
This research was supported by the UK Research and Innovation Engineering and Physical Sciences Research Council (UKRI-EPSRC) Grant EP/T518104/1, and sponsored by Cadent Gas Ltd.References
- S. Dunn, Int. J. Hydrogen Energy, 2002, 27, 235–264 CrossRef CAS.
- E. S. Hanley, J. P. Deane and B. P. Ó. Gallachóir, Renewable Sustainable Energy Rev., 2018, 82, 3027–3045 Search PubMed.
- W. McDowall, Futures, 2014, 63, 1–14 Search PubMed.
- J. O. M. Bockris, Int. J. Hydrogen Energy, 2013, 38, 2579–2588 CAS.
- S. Bakker and B. Budde, Technol. Anal. Strateg. Manag., 2012, 24, 549–563 Search PubMed.
- S. Bakker, Energy Policy, 2010, 38, 6540–6544 Search PubMed.
- I. Staffell, D. Scamman, A. V. Abad, P. Balcombe, P. E. Dodds, P. Ekins, N. Shah and K. R. Ward, Energy Environ. Sci., 2019, 12, 463 CAS.
- W. McDowall and M. Eames, Int. J. Hydrogen Energy, 2007, 32, 4611–4626 CAS.
- M. Eames and W. McDowall, Technol. Anal. Strateg. Manag., 2010, 22, 671–692 Search PubMed.
- W. McDowall and M. Eames, Energy Policy, 2006, 34, 1236–1250 Search PubMed.
- M. Eames, W. McDowall, M. Hodson and S. Marvin, Technol. Anal. Strateg. Manag., 2006, 18, 361–374 Search PubMed.
- S. Harichandan and S. K. Kar, Environ. Sci. Pollut. Res., 2023, 1, 1–18 Search PubMed.
- S. Griffiths, B. K. Sovacool, J. Kim, M. Bazilian and J. M. Uratani, Energy Res Soc Sci., 2021, 80, 102208 Search PubMed.
- B. K. Sovacool, D. F. Del Rio, K. Herman, M. Iskandarova, J. M. Uratani and S. Griffiths, Energy Environ. Sci., 2024, 17, 3523–3569 Search PubMed.
- M. van der Spek, C. Banet, C. Bauer, P. Gabrielli, W. Goldthorpe, M. Mazzotti, S. T. Munkejord, N. A. Røkke, N. Shah, N. Sunny, D. Sutter, J. M. Trusler and M. Gazzani, Energy Environ. Sci., 2022, 15, 1034–1077 Search PubMed.
- X. Yang, C. P. Nielsen, S. Song and M. B. McElroy, Nat. Energy, 2022, 7(10), 955–965 CAS.
- US Department of Energy, U.S. National Clean Hydrogen Strategy and Roadmap, 2023 Search PubMed.
- Ministry of Trade and Economy Economy, Basic Hydrogen Strategy, 2017 Search PubMed.
- Center on Global Energy Policy, National hydrogen strategies and roadmap tracker, https://www.energypolicy.columbia.edu/publications/national-hydrogen-strategies-and-roadmap-tracker/, accessed 15 May 2024.
- Council of the Australian Government, Australia's National Hydrogen Strategy, COAG Energy Council Hydrogen Working Group, 2019 Search PubMed.
- V. A. Goltsov and T. N. Veziroglu, Int. J. Hydrogen Energy, 2001, 26, 909–915 CAS.
- J. Yap and B. McLellan, Int. J. Hydrogen Energy, 2024, 54, 66–83 Search PubMed.
- European Commission, A Hydrogen Strategy for a Climate-Neutral Europe, Brussels, 2020 Search PubMed.
- A. Kovač, M. Paranos and D. Marciuš, Int. J. Hydrogen Energy, 2021, 46, 10016–10035 CrossRef.
- W. Cheng and S. Lee, Sustainability, 2022, 14, 1930 CrossRef CAS.
- HM Government, UK Hydrogen Strategy, 2021 Search PubMed.
- M. Scott and G. Powells, Int. J. Hydrogen Energy, 2020, 45, 3870–3882 CrossRef CAS.
- Department for Energy Security & Net Zero, Hydrogen heating: overview, https://www.gov.uk/government/publications/hydrogen-heating-overview/hydrogen-heating-overview--2, accessed 15 April 2024.
- Committee on Climate Change, Annex 2, Heat in UK Buildings Today, 2017 Search PubMed.
- Frazer-Nash Consultancy, Appraisal of Domestic Hydrogen Appliances, Prepared for the Department of Business, Energy & Industrial Strategy, 2018 Search PubMed.
- Department for Business, Energy & Industrial Strategy, 2020 UK Greenhouse Gas Emissions, Final Figures, 2022 Search PubMed.
- HM Government, Heat and Buildings Strategy, 2021 Search PubMed.
- J. A. Gordon, N. Balta-Ozkan, A. Haq and S. A. Nabavi, Int. J. Hydrogen Energy, 2024, 69, 982–1021 CrossRef CAS.
- J. A. Gordon, N. Balta-Ozkan, A. Haq and S. A. Nabavi, Energy Res Soc Sci., 2024, 110, 103437 Search PubMed.
- European Environment Agency, Decarbonising Heating and Cooling: a Climate Imperative, 2023 Search PubMed.
- IPCC Working Group III, IPCC Sixth Assessment Report: Chapter 9 - Buildings, 2021 Search PubMed.
- International Energy Agency, Tracking Clean Energy Progress 2023: Assessing Critical Energy Technologies for Global Clean Energy Transitions, 2023 Search PubMed.
- M. Ge, J. Friedrich and L. Vigna, Where Do Emissions Come from? 4 Charts Explain Greenhouse Gas Emissions by Sector Search PubMed.
- R. Koneczna and J. Cader, Int. J. Hydrogen Energy, 2024, 59, 430–446 Search PubMed.
- Y. Lee, M. H. Cho, M. C. Lee and Y. J. Kim, Int. J. Hydrogen Energy, 2024, 54, 1521–1531 CrossRef CAS.
- M. Inci, Sustain. Energy Technol. Assessments, 2022, 53, 102739 Search PubMed.
- Economist Intelligence Unit (2006–2023), Our World in Data: Democracy Index, 2023, 2023, https://ourworldindata.org/grapher/democracy-index-eiu, accessed 18 December, 2024.
- International Energy Agency, Proportion of residential heating energy consumption by fuel source in selected countries, 2020, https://www.iea.org/data-and-statistics/charts/proportion-of-residential-heating-energy-consumption-by-fuel-source-in-selected-countries-2020, accessed 18 December, 2024.
- V. Lambert and P. Ashworth, The Australian Public's Perception of Hydrogen for Energy, Report for the Australian Government's Renewable Energy Agency, 2018 Search PubMed.
- V. Martin, P. Ashworth, S. Petrova, B. Wade, K. Witt and E. Clarke, Public Perceptions of Hydrogen: 2021 National Survey Results, Future Fuels CRC, 2021 Search PubMed.
- O. Sandri, S. Holdsworth, J. Hayes, N. Willand and T. Moore, Energy Res Soc Sci., 2021, 79, 102179 CrossRef.
- Australian Government, Department of Climate Change, Energy, the Environment and Water, National Hydrogen Strategy 2024, Barrington Stoke, 2024 Search PubMed.
- National Research Council, Hydrogen Strategy for Canada: Seizing the Opportunities for Hydrogen: A Call to Action, 2020 Search PubMed.
- Government of Canada, Hydrogen Strategy for Canada: Progress Report, 2024, https://natural-resources.canada.ca/climate-change/canadas-green-future/the-hydrogen-strategy/hydrogen-strategy-for-canada-progress-report/25678, accessed 18 December, 2024.
- The Federal Government, The National Hydrogen Strategy, 2020 Search PubMed.
- C. Baldino, J. O'Malley, S. Searle and A. Christensen, Hydrogen for Heating? Decarbonization Options for Households in Germany in 2050, 2021 Search PubMed.
- A. von Döllen and S. Schlüter, Energies, 2024, 17, 3053 Search PubMed.
- K. Knosala, L. Langenberg, N. Pflugradt, P. Stenzel, L. Kotzur and D. Stolten, Energy Build., 2020, 276, 112480 Search PubMed.
- Federal Ministry for Economic Affairs and Climate Action, National Hydrogen Strategy Update, 2023 Search PubMed.
- F. Kern, F. Schmelzle and M. Hummel, Environ. Res. Lett., 2023, 18, 114017 Search PubMed.
- R. A. Felseghi, E. Carcadea, M. S. Raboaca, C. N. Trufin and C. Filote, Energies, 2019, 12, 4593 CAS.
- L. Fan, Z. Tu and S. H. Chan, Energy Rep., 2021, 7, 8421–8446 Search PubMed.
- G. Simader and P. Vidovic, E3S Web Conf., 2022, 334, 04007 CAS.
- The Ministerial Council on Renewable Energy, Hydrogen and Related Issues, Basic Hydrogen Strategy, 2023 Search PubMed.
- N. Yamaguchi, N. Totsuka, K. Kakimoto, S. Mizuno and K. Shibata, E3S Web Conf., 2020, 152, 02003 Search PubMed.
- Government of the Netherlands, Government Strategy on Hydrogen, 2020 Search PubMed.
- L. Klapwijk, Dutch government gives update on hydrogen policy, 2022, https://www.vandoorne.com/en/artikelen/dutch-government-gives-update-on-hydrogen-policy-localized-en/, accessed 18 December, 2024.
- E. Laity, Dutch government prioritises hydrogen and CO2 pipelines despite delays, 2024, https://www.h2-view.com/story/dutch-government-prioritises-hydrogen-and-co2-pipelines-despite-delays/2118322.article/, accessed 18 December, 2024.
- Consultancy.eu, Analysis: The new climate & energy policy of the Dutch government, 2024, https://www.consultancy.eu/news/10707/analysis-the-new-climate-energy-policy-of-the-dutch-government, accessed 18 December, 2024.
- A. Devenish and M. Lockwood, Energy Policy, 2024, 187, 114027 Search PubMed.
- Authority for Consumers and Markets, Second pilot project is launched involving hydrogen for the heating of homes following ACM's approval, 2023, https://www.acm.nl/en/publications/second-pilot-project-launched-involving-hydrogen-heating-homes-following-acms-approval, accessed 18 December, 2024.
- Heavenn, First homes in Hoogeveen are switching to hydrogen, 2024, https://heavenn.org/news/homes-hoogeveen-switching-to-hydrogen/, accessed 18 December, 2024.
- P. Martin, Hydrogen heating pilot in the Netherlands gets green light after a year's delay, 2024, https://www.hydrogeninsight.com/policy/hydrogen-heating-pilot-in-the-netherlands-gets-green-light-after-a-years-delay/2-1-1637247, accessed 18 December, 2024.
- R. Parkes, Popular hydrogen heating town pilot is feasible when used alongside hybrid heat pumps, IEA expert, 2024, https://www.hydrogeninsight.com/innovation/popular-hydrogen-heating-town-pilot-is-feasible-when-used-alongside-hybrid-heat-pumps-iea-expert/2-1-1730648, accessed 18 December, 2024.
- R. Lowes and B. Woodman, Energy Policy, 2020, 142, 111494 CrossRef.
- P. E. Dodds and S. Demoullin, Int. J. Hydrogen Energy, 2013, 38, 7189–7200 CrossRef CAS.
- P. E. Dodds and W. McDowall, Energy Policy, 2013, 60, 305–316 CrossRef.
- Engineering and Physical Sciences Research: GR/S26965/01, 2003 Search PubMed.
- Engineering and Physical Sciences Research: EP/E040071/1, 2007 Search PubMed.
- Engineering and Physical Sciences Research: EP/J016454/1, 2012 Search PubMed.
- D. Parra, M. Gillott and G. S. Walker, Int. J. Hydrogen Energy, 2014, 39, 4158–4169 Search PubMed.
- P. E. Dodds, I. Staffell, A. D. Hawkes, F. Li, P. Grünewald, W. McDowall and P. Ekins, Int. J. Hydrogen Energy, 2015, 40, 2065–2083 Search PubMed.
- E. R. Nielsen, C. B. Prag, T. M. Bachmann, F. Carnicelli, E. Boyd, I. Walker, L. Ruf and A. Stephens, Fuel Cells, 2019, 19, 340–345 Search PubMed.
- Committee on Climate Change, Meeting Carbon Budgets-2016 Progress Report to Parliament, 2016 Search PubMed.
- Sadler, A. Cargill, M. Crowther, A. Rennie, J. Watt, S. Burton and M. Haines, Leeds City Gate H21, Northern Gas Networks, Leeds, UK, 2016 Search PubMed.
- The Committee on Climate Change, Hydrogen in a Low-Carbon Economy, 2018 Search PubMed.
- N. Eyre and P. Baruah, Energy Policy, 2015, 87, 641–653 CrossRef.
- R. Lowes, B. Woodman and J. Speirs, Environ. Innov. Soc. Transit., 2020, 37, 1–17 CrossRef.
- J. Rosenow, Cell Rep. Sustain., 2024, 1, 100010 Search PubMed.
- P. J. Boait and R. Greenough, Energy Build., 2019, 194, 75–84 CrossRef.
- J. Rosenow, Joule, 2022, 6, 2225–2228 CrossRef.
- S. Kuczynski, M. Łaciak, A. Olijnyk, A. Szurlej and T. Włodek, Energies, 2019, 12, 569 CrossRef CAS.
- F. Schiro, A. Stoppato and A. Benato, Carbon Resour. Convers., 2020, 3, 122–129 CrossRef CAS.
- P. Hoseinpoori, R. Hanna, J. Woods, C. N. Markides and N. Shah, Energy Strat. Rev., 2023, 49, 101142 CrossRef.
- N. A. Al-Mufachi and N. Shah, Energy Policy, 2022, 171, 113286 CrossRef CAS.
- J. A. Gordon, N. Balta-Ozkan and S. A. Nabavi, Appl. Energy, 2023, 336, 120850 CrossRef.
- P. A. Rocha, UK shelves hydrogen town in blow for using fuel in home heating, https://www.bloomberg.com/news/articles/2024-05-09/uk-shelves-hydrogen-town-in-blow-for-using-fuel-in-home-heating?, accessed 11 May 2024.
- D. Mavrokefalidis, Hydrogen village trial in Whitby rejected, https://www.energylivenews.com/2023/07/11/hydrogen-village-trial-in-whitby-rejected/, accessed 17 July 2023.
- A. Jasi, UK's Redcar ‘hydrogen village’ trial cancelled due to insufficient feedstock supply, https://www.thechemicalengineer.com/news/uk-s-redcar-hydrogen-village-trial-cancelled-due-to-insufficient-feedstock-supply/, accessed 17 December 2023.
- National Infrastructure Commission, Technical annex: Hydrogen heating, https://nic.org.uk/studies-reports/national-infrastructure-assessment/second-nia/hydrogen-for-heat-annex/, accessed 17 March 2024.
- M. Scott and G. Powells, Blended Hydrogen: the UK Public's Perspective, Newcastle University School of Geography, Politics and Sociology, 2019 Search PubMed.
- Z. Robinson, A. Peacock, M. Thompson and P. Catney, Consumer Perceptions of Blended Hydrogen in the Home: Learning from HyDeploy, 2022 Search PubMed.
- F. Fylan, M. Fletcher and S. Christmas, H21: Public Perceptions of Converting the Gas Network to Hydrogen, Leeds Beckett University, 2020 Search PubMed.
- J. A. Gordon, N. Balta-Ozkan and S. A. Nabavi, Int. J. Hydrogen Energy, 2024, 49, 75–104 CrossRef CAS.
- J. A. Gordon, N. Balta-Ozkan and S. A. Nabavi, Energy Res Soc Sci., 2022, 104, 103204 Search PubMed.
- J. A. Gordon, N. Balta-Ozkan and S. A. Nabavi, Renewable Sustainable Energy Rev., 2023, 188, 113810 Search PubMed.
- J. A. Gordon, N. Balta-Ozkan and S. A. Nabavi, Renewable Sustainable Energy Rev., 2022, 164, 112481 CrossRef CAS.
- J. A. Gordon, N. Balta-Ozkan and S. A. Nabavi, Int. J. Hydrogen Energy, 2024, 56, 498–524 CrossRef CAS.
- J. A. Gordon, N. Balta-Ozkan, A. Haq and S. A. Nabavi, Sustain. Energy Fuels, 2024, 8, 2601–2648 RSC.
- L. Legault, S. Bird and M. D. Heintzelman, Energy Res Soc Sci., 2024, 111, 103481 CrossRef.
- J. A. Gordon, N. Balta-Ozkan, A. U. Haq and A. Nabavi, Int. J. Hydrogen Energy, 2024, 94, 554–579 CrossRef CAS.
- C. Büscher and P. Sumpf, J. Sustain. Energy, 2015, 5, 1–13 Search PubMed.
- S. Bjarnadóttir, M. Fairbrother, S. Ólafsdóttir and J. Beckfield, Environ. Sociol., 2024, 1–12 Search PubMed.
- S. Drews and J. C. Van den Bergh, Clim. Policy, 2016, 16, 855–876 Search PubMed.
- J. Kulin and I. Johansson Sevä, Clim. Policy, 2021, 21, 33–46 Search PubMed.
- D. Davidovic and N. Harring, Environ. Res. Soc. Sci., 2020, 70, 101785 Search PubMed.
- J. Kulin, I. Johansson Sevä and M. Fairbrother, Environ. res. commun., 2024, 6, 095013 Search PubMed.
- T. Hanitzsch, A. Van Dalen and N. Steindl, Int. J. Press/Politics, 2018, 23, 3–23 Search PubMed.
- M. Paterson, S. Wilshire and P. Tobin, J. Comp. Policy Anal.: Res. Pract., 2024, 26, 332–350 Search PubMed.
- F. W. Geels, F. Kern, G. Fuchs, N. Hinderer, G. Kungl, J. Mylan, M. Neukirch and S. Wassermann, Res. Policy, 2016, 45, 896913 Search PubMed.
- S. Hielscher, J. Wittmayer and A. Dańkowska, Extr. Ind. Soc., 2022, 10, 101073 Search PubMed.
- E. Laes, L. Gorissen and F. Nevens, Sustainability, 2014, 6, 1129–1152 Search PubMed.
- A. Sukhov, M. Friman and L. E. Olsson, J. Retail. Consum. Serv., 2023, 74, 103424 CrossRef.
- S. Hauff, N. F. Richter, M. Sarstedt and C. M. Ringle, J. Retail. Consum. Serv., 2024, 78, 103723 CrossRef.
- J. Dul, Organ. Res. Methods, 2016, 19, 10–52 CrossRef.
- J. F. Hair Jr, L. M. Matthews, R. L. Matthews and M. Sarstedt, Int. J. Multivariate Data Anal., 2017, 1, 107–123 CrossRef.
- P. B. Lowry and J. Gaskin, IEEE Trans. Prof. Commun., 2014, 57, 123–146 Search PubMed.
- R. D. Dennis and L. Forzani, J. Bus. Res., 2023, 167, 114132 CrossRef.
- J. M. Becker, J. H. Cheah, R. Gholamzade, C. M. Ringle and M. Sarstedt, Int. J. Contemp. Hosp. Manag., 2022, 35(1), 321–346 CrossRef.
- J. H. Cheah, S. Amaro and J. L. Roldán, J. Bus. Res., 2023, 156, 113539 CrossRef.
- V. Shela, T. Ramayah, K. L. Aravindan, N. H. Ahmad and A. I. Alzahrani, Heliyon, 2023, 9, e22476 CAS.
- H. N. Sabeh, M. H. Husin, D. M. H. Kee, A. S. Baharudin and R. Abdullah, IEEE Access, 2021, 9, 81210–81235 Search PubMed.
- Y. C. Yin, J. Ahmed, A. Y. H. Nee and O. K. Hoe, Environ. Sci. Pollut. Res., 2022, 30(3), 5881–5902 CrossRef PubMed.
- G. A. Alkawsi, N. Ali and Y. Baashar, IEEE Access, 2020, 8, 42794–42804 Search PubMed.
- A. Shuhaiber and I. Mashal, Technol. Soc., 2019, 58, 101110 CrossRef.
- L. Ferreira, T. Oliveira and C. Neves, Energy, 2023, 263, 125814 CrossRef.
- C. Neves and T. Oliveira, Appl. Energy, 2021, 298, 117165 CrossRef.
- S. Ali, H. M. U. Javed and M. Danish, Environ. Sci. Pollut. Res., 2021, 28, 36174–36192 CrossRef PubMed.
- S. K. Kar, R. Bansal and S. Harichandan, Int. J. Hydrogen Energy, 2022, 47, 19999–20015 CrossRef CAS.
- S. Harichandan, S. K. Kar, R. Bansal and S. K. Mishra, Int. J. Hydrogen Energy, 2023, 48, 4845–4859 CrossRef CAS.
- G. Shmueli, M. Sarstedt, J. F. Hair, J. H. Cheah, H. Ting, S. Vaithilingam and C. M. Ringle, Eur. J. Market., 2019, 53, 2322–2347 CrossRef.
- B. D. Liengaard, P. N. Sharma, G. T. M. Hult, M. B. Jensen, M. Sarstedt, J. F. Hair and C. M. Ringle, Decis. Sci., 2021, 52, 362–392 Search PubMed.
- W. Chin, J. H. Cheah, Y. Liu, H. Ting, X. J. Lim and T. H. Cham, Ind. Manag. Data Syst., 2020, 120, 2161–2209 Search PubMed.
- M. Sarstedt, C. M. Ringle, J. Henseler and J. F. Hair, Long. Range Plan., 2014, 47, 154–160 Search PubMed.
- C. M. Ringle, S. Wende and J.-M. Becker, SmartPLS, https://www.smartpls.com/documentation/algorithms-and-techniques/higher-order/, accessed 30 May 2023.
- J. F. Hair, J. J. Risher, M. Sarstedt and C. M. Ringle, Eur. Bus. Rev., 2019, 31, 2–24 Search PubMed.
- N. Kock and P. Hadaya, Inf. Syst. J., 2018, 28, 227–261 Search PubMed.
- K. K. K. Wong, Mark. Bull., 2013, 24, 1–32 Search PubMed.
- M. Sarstedt, J. F. Hair, C. M. Ringle, K. O. Thiele and S. P. Gudergan, J. Bus. Res., 2016, 69, 3998–4010 Search PubMed.
- J. M. Becker, K. Klein and M. Wetzels, Long. Range Plan., 2012, 45, 359–394 Search PubMed.
- S. Streukens, S. Leroi-Werelds and K. Willems, in Partial Least Squares Path Modeling: Basic Concepts, Methodological Issues and Applications, ed. H. Latan and R. Noonan, Springer, 2017, pp. 367–403 Search PubMed.
- E. Rigdon, C. M. Ringle, M. Sarstedt and S. Siegfried Gudergan, Measurement and Research Methods in International Marketing, 2011, vol. 22, pp. 169–194 Search PubMed.
- C. M. Ringle and M. Sarstedt, Ind. Manag. Data Syst., 2016, 116, 1865–1886 Search PubMed.
- N. F. Richter, S. Hauff, A. E. Kolev and S. Schubring, Data Brief, 2023, 48, 109190 CAS.
- M. Escadas, M. S. Jalali, F. Septianto and M. Farhangmehr, Business Ethics, the Environment & Responsibility, 2023, pp. 1–18 Search PubMed.
- J. Dul, J. Bus. Res., 2016, 69, 1516–1523 Search PubMed.
- S. Hauff, M. Guerci, J. Dul and H. Van Rhee, Hum. Resour. Manag. J., 2021, 31, 18–36 Search PubMed.
- B. F. Braumoeller, G. Goertz, C. Achen, N. Burns, J. Morrow, B. Pahre, D. Rousseau, B. Russett, B. Sala, A. Sartori and H. Starr, Am. J. Polym. Sci., 2000, 44, 844–858 Search PubMed.
- J. Dul, T. Hak, G. Goertz and C. Voss, Int. J. Oper. Prod. Manag., 2010, 30, 1170–1190 CrossRef.
- J. Dul, Organ. Res. Methods, 2016, 19, 10–52 CrossRef.
- J. Dul, E. van der Laan and R. Kuik, Organ. Res. Methods, 2020, 23, 385–395 CrossRef.
- J. Dul, J. Bus. Res., 2024, 177, 114618 CrossRef.
- J. Dul, Oxford Research Encyclopedia of Business and Management, DOI:10.1093/ACREFORE/9780190224851.013.235.
- J. Dul, S. Hauff and R. B. Bouncken, Rev. Manag. Sci., 2023, 17(2), 683–714 CrossRef.
- C. Linder, A. Ghosh Moulick and C. Lechner, Entrep. Theory Pract., 2023, 47, 1971–1994 CrossRef.
- J. Bokrantz and J. Dul, J. Supply Chain Manag., 2023, 59, 48–65 CrossRef.
- W. H. Knol, J. Slomp, R. L. J. Schouteten and K. Lauche, Int. J. Prod. Res., 2018, 56, 3955–3973 Search PubMed.
- E. Kazemzadeh, J. A. Fuinhas, N. Salehnia, M. Koengkan and N. Silva, Environ. Sci. Pollut. Res., 2023, 30, 97319–97338 CrossRef PubMed.
- C. S. Kopplin and S. F. Rösch, J. Retail. Consum. Serv., 2021, 63, 102692 CrossRef.
- A. Rey-Martí, A. Valencia-Toledo, N. Chaparro-Banegas, A. Mas-Tur and N. Roig-Tierno, Resour. Policy, 2023, 83, 103704 CrossRef.
- S. Ben Jabeur, Environ. Model. Assess., 2020, 25, 397–409 CrossRef.
- S. Solaimani and L. Swaak, J. Eng. Technol. Manag., 2023, 69, 101760 CrossRef.
- B. Yan, Y. Liu, B. Chen, X. Zhang and L. Wu, Public Adm., 2023, 101, 71–89 Search PubMed.
- M. Karwowski, J. Dul, J. Gralewski, E. Jauk, D. M. Jankowska, A. Gajda, M. H. Chruszczewski and M. Benedek, Intelligence, 2016, 57, 105–117 CrossRef.
- F. Magno and F. Cassia, J. Retail. Consum. Serv., 2024, 79, 103820 CrossRef.
- F. Arbabi, S. M. Khansari, A. Salamzadeh, A. Gholampour, P. Ebrahimi and M. Fekete-Farkas, J. Risk Financ. Manag., 2022, 15, 440 CrossRef.
- A. Sukhov, L. E. Olsson and M. Friman, Transp. Res. A Policy Pract., 2022, 158, 239–250 CrossRef.
- D. Ngoc Su, D. Quy Nguyen-Phuoc, P. Thi Kim Tran, T. Van Nguyen, T. Trong Luu and H. G. Pham, Travel Behav. Soc., 2023, 33, 100633 CrossRef.
- Y. Chen, D. Wang, W. Zhu, Y. Hou, D. Liu, C. Ma, T. Li and Y. Yuan, Int. J. Environ. Res. Public Health, 2023, 20, 1170 CrossRef CAS PubMed.
- Y. Zhou, S. Kumar and F. Furuoka, Humanit. Soc. Sci. Commun., 2024, 11, 1–15 CrossRef.
- M. P. Low and T. Ramayah, Smart Health, 2023, 27, 100370 CrossRef.
- J. Ahmad, A. Al Mamun, M. N. H. Reza, Z. K. M. Makhbul and K. A. M. Ali, Environ. Sci. Pollut. Res., 2023, 30, 87938–87957 CrossRef PubMed.
- F. Arbabi, S. M. Khansari, A. Salamzadeh, A. Gholampour, P. Ebrahimi and M. Fekete-Farkas, J. Risk Financ. Manag., 2022, 15, 440 CrossRef.
- H. Liu, Y. Wang, G. He, R. Ma and S. Fu, J. Cleaner Prod., 2023, 421, 138449 CrossRef.
- N. F. Richter and S. Hauff, J. World Bus., 2022, 57, 101310 CrossRef.
- A. Yadav, M. Parida, P. Choudhary and B. Kumar, J. Environ. Manage., 2024, 355, 120515 CrossRef PubMed.
- N. F. Richter, S. Schubring, S. Hauff, C. M. Ringle and M. Sarstedt, Ind. Manag. Data Syst., 2020, 120, 2243–2267 Search PubMed.
- R. Agarwal, A. Bhadauria, S. Swami and R. Rajwnashi, J. Cleaner Prod., 2023, 410, 137109 Search PubMed.
- R. O. Bamidele, A. Ozturen, M. Haktanir and O. A. Ogunmokun, Sustainability, 2023, 15, 2475 Search PubMed.
- N. M. A. Huijts, C. J. H. Midden and A. L. Meijnders, Energy Policy, 2007, 35, 2780–2789 Search PubMed.
- N. C. Bronfman, R. B. Jiménez, P. C. Arévalo and L. A. Cifuentes, Energy Policy, 2012, 46, 246–252 Search PubMed.
- J. Dwyer and D. Bidwell, Energy Res Soc Sci., 2019, 47, 166–176 Search PubMed.
- N. J. van Eck and L. Waltman, Scientometrics, 2010, 84, 523–538 CrossRef PubMed.
- R. C. Mayer, J. H. Davis and F. D. Schoorman, Acad. Manag. Rev., 1995, 20, 709–734 CrossRef.
- D. H. McKnight, V. Choudhury and C. Kacmar, Inf. Syst. Res., 1995, 13, 334–359 CrossRef.
- P. A. Hancock, D. R. Billings, K. E. Schaefer, J. Y. C. Chen, E. J. De Visser and R. Parasuraman, Hum. Factors, 2011, 53, 517–527 CrossRef PubMed.
- B. L. Connelly, T. R. Crook, J. G. Combs, D. J. Ketchen and H. Aguinis, J. Manag., 2015, 44, 919–945 Search PubMed.
- M. F. Mubarak and M. Petraite, Technol. Forecast. Soc. Change, 2020, 161, 120332 CrossRef.
- L. J. Frewer, J. C. Howard, D. Hedderley and R. Shepherd, Risk Anal., 1999, 16, 473–486 CrossRef PubMed.
- D. B. Resnik, Sci. Eng. Ethics, 2011, 17, 399 CrossRef PubMed.
- A. Ecker, F. Nüssel and J. Tosun, npj Clim. Action, 2024, 3(1), 1–10 Search PubMed.
- R. Caferra, A. Colasante, I. D'Adamo, A. Morone and P. Morone, Sci. Rep., 2023, 13, 1–9 Search PubMed.
- L. Frewer, Ambio, 1999, 28, 569–574 Search PubMed.
- N. Gupta, A. R. H. Fischer and L. J. Frewer, Public Underst. Sci., 2012, 21, 782–795 Search PubMed.
- A. A. Anderson, D. Brossard and E. A. Corley, Int. J. Public Opin. Res., 2011, 24, 225–237 Search PubMed.
- Z. Master and D. B. Resnik, Sci. Eng. Ethics, 2013, 19, 321–335 Search PubMed.
- C. C. A. Smits, J. van Leeuwen and J. P. M. van Tatenhove, Resour. Policy, 2017, 53, 109–116 Search PubMed.
- C. C. A. Smits, J. C. S. Justinussen and R. G. Bertelsen, Energy Res Soc Sci., 2016, 16, 122–131 Search PubMed.
- B. Verrier, C. Smith, M. Yahyaei, M. Ziemski, G. Forbes, K. Witt and M. Azadi, Energy Res Soc Sci., 2022, 83, 102343 Search PubMed.
- L. Mercer-Mapstone, W. Rifkin, W. Louis and K. Moffat, Resour. Policy, 2017, 53, 347–355 Search PubMed.
- K. Moffat and A. Zhang, Resour. Policy, 2014, 39, 61–70 Search PubMed.
- A. Walton and R. McCrea, Appl. Energy, 2020, 279, 115750 Search PubMed.
- J. R. Parkins, T. Beckley, L. Comeau, R. C. Stedman, C. L. Rollins and A. Kessler, Soc. Nat. Resour., 2017, 30, 934–948 CrossRef.
- D. N. yin Mah, D. M. wai Cheung, V. W. Y. Lam, A. Siu, Y. Sone and K. yan Li, Environ. Innov. Soc. Transit., 2021, 39, 249–269 CrossRef.
- A. N. Haque, C. Lemanski and J. de Groot, Energy Res Soc Sci., 2021, 74, 101954 CrossRef.
- S. Kitt, J. Axsen, Z. Long and E. Rhodes, Ecol. Econ., 2021, 183, 106958 CrossRef.
- B. Lin and H. Jia, Econ. Anal. Policy, 2023, 80, 1337–1348 CrossRef.
- J. Lee and D. M. Reiner, Energy, 2023, 284, 128704 CrossRef.
- K. Gupta, H. Jenkins-Smith, J. Ripberger, C. Silva, A. Fox and W. Livingston, Fusion Sci. Technol., 2025, 81(1), 1–17 CrossRef.
- M. Lange, A. M. O'Hagan, R. R. N. Devoy, M. Le Tissier and V. Cummins, Energy Policy, 2018, 113, 623–632 Search PubMed.
- M. Lange and V. Cummins, Renewable Sustainable Energy Rev., 2021, 152, 111740 Search PubMed.
- X. Luo, M. Zhang and X. Liu, Energy Rep., 2023, 9, 522–538 Search PubMed.
- B. Volland, Ecol. Econ., 2017, 132, 14–30 Search PubMed.
- J. Li, J. Li and J. Zhang, Technol. Soc., 2024, 76, 102455 Search PubMed.
- J. Żywiołek, J. Rosak-Szyrocka, M. A. Khan and A. Sharif, Energies, 2022, 15, 1566 Search PubMed.
- Y. Cao, C. Yi, G. Wan, H. Hu, Q. Li and S. Wang, Transp. Res. E: Logist. Transp. Rev., 2022, 163, 102731 Search PubMed.
- L. Yu, D. Zhao, Z. Xue and Y. Gao, Technol. Soc., 2020, 62, 101323 Search PubMed.
- M. Han, R. Liu, H. Ma, K. Zhong, J. Wang and Y. Xu, Agriculture, 2022, 12, 1368 Search PubMed.
- Z. Ren, Z. Fu and K. Zhong, Front. Psychol., 2022, 13, 1001442 Search PubMed.
- H. Liu, R. Ma, G. He, A. Lamrabet and S. Fu, J. Retail. Consum. Serv., 2023, 74, 103387 CrossRef.
- L. Li, S. Dingyi, S. Fengluan, T. Xiujun and H. Noor, Heliyon, 2024, 10, e27137 CrossRef PubMed.
- M. Eriksson, M. Safeeq, L. Padilla, T. Pathak, T. O'Geen, B. Egoh, J. Lugg and R. Bales, J. Environ. Manage., 2023, 345, 118605 CrossRef PubMed.
- D. Ma, P. Ma and J. Hu, Sustainability, 2024, 16, 1535 CrossRef.
- P. Żuk and P. Żuk, Environ. Dev. Sustain., 2024, 7, 18499–18534 Search PubMed.
- Y. Luo, X. Chen, F. Fang, X. Zhang and N. Guo, Environ. Sci. Pollut. Res., 2021, 28, 7901–7917 CrossRef PubMed.
- C. L. Donnison, K. Trdlicova, A. Mohr and G. Taylor, Energy Res Soc Sci., 2023, 102, 103153 Search PubMed.
- C. B. Cooper, Bioscience, 2011, 61, 231–237 Search PubMed.
- J. Weitzman and M. Bailey, Aquaculture, 2019, 507, 172–182 Search PubMed.
- J. Weitzman, R. Filgueira and J. Grant, Mar. Policy, 2022, 143, 105175 Search PubMed.
- S. Yun and J. Lee, Technol. Forecast. Soc. Change, 2015, 95, 170–181 Search PubMed.
- S. P. Astuti, R. Day and S. B. Emery, Energy Res Soc Sci., 2019, 58, 101248 Search PubMed.
- M. Sonnberger and M. Ruddat, Technol. Soc., 2017, 51, 56–65 Search PubMed.
- C. Merk and G. Pönitzsch, Risk Anal., 2017, 37, 2289–2304 Search PubMed.
- J. Macht, J. Klink-Lehmann and M. Hartmann, Technol. Soc., 2023, 74, 102318 Search PubMed.
- V. H. M. Visschers and M. Siegrist, J. Environ. Psychol., 2014, 40, 117–130 Search PubMed.
- Y. S. Choi, E. O. Han and S. K. Lee, Energy Strat. Rev., 2021, 35, 100654 Search PubMed.
- E. K. Smith and A. Mayer, Glob. Environ. Change, 2018, 49, 140–153 Search PubMed.
- A. Jordan, I. Lorenzoni, J. Tosun, J. E. i Saus, L. Geese, J. Kenny, E. L. Saad, B. Moore and S. G. Schaub, Clim. Action, 2022, 1, 1–12 Search PubMed.
- A. L. Schönauer and S. Glanz, Int. J. Hydrogen Energy, 2022, 47, 12251–12263 Search PubMed.
- P. Emmerich, A. G. Hülemeier, D. Jendryczko, M. J. Baumann, M. Weil and D. Baur, Energy Policy, 2020, 142, 111516 CrossRef.
- D. Baur, P. Emmerich, M. J. Baumann and M. Weil, J. Sustain. Energy, 2022, 12, 1–16 CrossRef.
- J. Buchner, K. Menrad and T. Decker, Renewable Energy, 2025, 241, 122366 CrossRef CAS.
- N. M. A. Huijts, E. J. E. Molin and B. van Wee, J. Environ. Psychol., 2014, 38, 153–166 Search PubMed.
- C. Smith, C. Bucke and D. van der Horst, Int. J. Hydrogen Energy, 2023, 48, 8370–8385 CAS.
- P. Ashworth, K. Witt, M. Ferguson and S. Sehic, Developing Community Trust in Hydrogen, The University of Queensland, School of Chemical Engineering, 2019 Search PubMed.
- J. A. Gordon, N. Balta-Ozkan and S. A. Nabavi, Energy Res Soc Sci., 2024, 108, 103401 Search PubMed.
- D. Uniyal and R. Nayak, Soc. Netw. Anal. Min., 2024, 14, 1–21 Search PubMed.
- Abu Dhabi Sustainability Week, Building Trust to Accelerate the Development of the Green Hydrogen Economy: Roundtable - COP28 Search PubMed.
- V. H. M. Visschers, C. Keller and M. Siegrist, Energy Policy, 2011, 39, 3621–3629 Search PubMed.
- Y. Guo and T. Ren, Energy Policy, 2017, 100, 113–125 Search PubMed.
- Q. Xiao, H. Liu and M. W. Feldman, PLoS One, 2017, 12, e0187941 Search PubMed.
- L. Yang, X. Zhang and K. J. McAlinden, Energy, 2016, 96, 69–79 Search PubMed.
- B. Xu, S. Ahmad, V. Charles and J. Xuan, J. Cleaner Prod., 2022, 374, 133990 Search PubMed.
- V. L. Ross, K. S. Fielding and W. R. Louis, J. Environ. Manage., 2014, 137, 61–68 Search PubMed.
- C. J. H. Midden and N. M. A. Huijts, Risk Anal., 2009, 29, 743–751 Search PubMed.
- M. Siegrist, G. Cvetkovich and C. Roth, Risk Anal., 2000, 20, 353–362 Search PubMed.
- E. Park and J. Y. Ohm, Energy Policy, 2014, 65, 198–211 Search PubMed.
- F. N. H. Montijn-Dorgelo and C. J. H. Midden, J. Risk Res., 2008, 11, 659–671 CrossRef.
- B. W. Terwel, F. Harinck, N. Ellemers and D. D. L. Daamen, Risk Anal., 2009, 29, 1129–1140 CrossRef PubMed.
- L. Amin, H. Hashim, Z. Mahadi, M. Ibrahim and K. Ismail, Biotechnol. Biofuels, 2017, 10, 1–17 CrossRef PubMed.
- M. F. Chen, Y. P. Lin and T. J. Cheng, Technovation, 2013, 33, 88–96 CrossRef.
- S. L'Orange Seigo, S. Dohle and M. Siegrist, Renewable Sustainable Energy Rev., 2014, 38, 848–863 CrossRef.
- J. I. M. De Groot, L. Steg and W. Poortinga, Risk Anal., 2013, 33, 307–317 CrossRef PubMed.
- S. Laforet and X. Li, Int. J. Bank Mark., 2005, 23, 362–380 Search PubMed.
- Z. Gong, Z. Han, X. Li, C. Yu and J. D. Reinhardt, Front. Public Health, 2019, 7, 286 Search PubMed.
- P. Dubey and K. K. Sahu, J. Res. Innov. Teach. Learn., 2021, 14, 310–328 CrossRef.
- E. Schulte, F. Scheller, D. Sloot and T. Bruckner, Energy Res Soc Sci., 2022, 84, 102339 CrossRef.
- E. Heiskanen, M. Hodson, R. M. Mourik, R. P. J. M. Raven, C. F. J. Feenstra, A. Alcantud, B. Brohmann, A. Daniels, M. Di Fiore, B. Farkas and U. Fritsche, Factors Influencing the Societal Acceptance of New Energy Technologies: Meta-Analysis of Recent European Projects, Work Package 2 of the CREATE ACCEPTANCE Project, FP6-2004-Energy-3, SUSTDEV-1.2.8, 2008 Search PubMed.
- M. C. Claudy, C. Michelsen and A. O'Driscoll, Energy Policy, 2011, 39, 1459–1469 CrossRef.
- K. Arning, J. Offermann-van Heek, A. Sternberg, A. Bardow and M. Ziefle, Environ. Innov. Soc. Transit., 2020, 35, 292–308 CrossRef.
- Cadent Gas, Hydrogen Heating Village Trail Stage 2: Submission Application, 2023 Search PubMed.
- Y. Joshi and Z. Rahman, Sustain. Prod. Consum., 2017, 10, 110–120 CrossRef.
- B. K. Sovacool, P. Newell, S. Carley and J. Fanzo, Nat. Hum. Behav., 2022, 6, 326–337 CrossRef PubMed.
- J. Van Alstine and C. Bastin, Establishing the UK Hydrogen Corridor: Socio-Economic, Environmental, and Regulatory Issues, University of Leeds, 2019 Search PubMed.
- M. Scott and G. Powells, Energy Res Soc Sci., 2020, 61, 101346 CrossRef.
- H. L. Bentsen, J. K. Skiple, T. Gregersen, E. Derempouka and T. Skjold, Energy Res Soc Sci., 2023, 97, 102985 CrossRef.
- L. Correia, O. Schwabe and N. Almeida, Speed of Innovation Diffusion in Green Hydrogen Technologies, in Lecture Notes in Mechanical Engineering, Springer International Publishing, Cham, 2022, pp. 101–111 Search PubMed.
- F. D. Davis, MIS Q., 1989, 13, 319–340 CrossRef.
- M. C. Lee, Electron. Commer. Res. Appl., 2009, 8, 130–141 CrossRef.
- Y. Wang and W. Qualls, Int. J. Hosp. Manag., 2007, 26, 560–573 Search PubMed.
- F. Afonso, M. Sohst, C. M. A. Diogo, S. S. Rodrigues, A. Ferreira, I. Ribeiro, R. Marques, F. F. C. Rego, A. Sohouli, J. Portugal-Pereira, H. Policarpo, B. Soares, B. Ferreira, E. C. Fernandes, F. Lau and A. Suleman, Prog. Aerosp. Sci., 2023, 137, 100878 Search PubMed.
- F. Scheller, K. Morrissey, K. Neuhoff and D. Keles, Energy Res Soc Sci., 2024, 108, 103388 Search PubMed.
- T. Coltman, T. M. Devinney, D. F. Midgley and S. Venaik, J. Bus. Res., 2008, 61, 1250–1262 Search PubMed.
- S. Wang, J. Wang, S. Lin and J. Li, Energy, 2020, 198, 117290 Search PubMed.
- M. Sarstedt, J. F. Hair, C. Nitzl, C. M. Ringle and M. C. Howard, Int. J. Mark. Res., 2020, 62, 288–299 Search PubMed.
- J. F. Hair, M. Sarstedt, L. Hopkins and V. G. Kuppelwieser, Eur. Bus. Rev., 2014, 26, 106–121 Search PubMed.
- E. J. Wolf, K. M. Harrington, S. L. Clark and M. W. Miller, Educ. Psychol. Meas., 2013, 73, 913–934 Search PubMed.
- F. Faul, E. Erdfelder, A. G. Lang and A. Buchner, Behav. Res. Methods, 2007, 39, 175–191 Search PubMed.
- E. Erdfelder, F. FAul, A. Buchner and A. G. Lang, Behav. Res. Methods, 2009, 41, 1149–1160 Search PubMed.
- G. Gorrell, N. Ford, A. Madden, P. Holdridge and B. Eaglestone, J. Doc., 2011, 67, 507–524 Search PubMed.
- N. Kock, Int. J. e-Collaboration, 2015, 11, 1–10 Search PubMed.
- N. Kock and G. S. Lynn, J. Assoc. Inf. Syst., 2012, 13, 546–580 Search PubMed.
- J. F. Hair Jr, G. T. M. Hult, C. M. Ringle, M. Sarstedt, N. P. Danks and S. Ray, A Primer on Partial Least Squares Structural Equation Modeling (PLS-SEM), SAGE, Thousand Oaks, California, 2nd edn, 2017 Search PubMed.
- M. K. Cain, Z. Zhang and K. H. Yuan, Behav. Res. Methods, 2017, 49, 1716–1735 Search PubMed.
- J. F. Hair Jr, M. C. Howard and C. Nitzl, J. Bus. Res., 2020, 109, 101–110 Search PubMed.
- M. Sarstedt, J. F. Hair, J. H. Cheah, J. M. Becker and C. M. Ringle, Australas. Mark. J., 2019, 27, 197–211 CrossRef.
- A. E. Legate, J. F. Hair Jr, J. L. Chretien and J. J. Risher, Hum. Resour. Dev. Q., 2023, 34, 91–109 CrossRef.
- J. Hulland, Strateg. Manag. J., 1999, 20(2), 195–204 CrossRef.
- R. R. Bagozzi and Y. Yi, J. Acad. Mark. Sci., 1988, 16, 74–94 CrossRef.
- J. Henseler, C. M. Ringle and M. Sarstedt, J. Acad. Mark. Sci., 2015, 43, 115–135 CrossRef.
- C. Fornell, in A Second Generation of Multivariate Analysis, ed. C. Fornell, Praeger, New York, 1982, pp. 1–21 Search PubMed.
- C. Nitzl, J. L. Roldan and G. Cepeda, Ind. Manag. Data Syst., 2016, 116, 1849–1864 CrossRef.
- G. C. Carrión, C. Nitzl and J. L. Roldán, in Partial Least Squares Path Modeling: Basic Concepts, Methodological Issues and Applications, ed. H. Latan and R. Noonan, Springer, Heidelberg, 2017, pp. 173–195 Search PubMed.
- J. M. Becker, A. Rai and E. Rigdon, in Proceedings of the 34th International Conference on Information Systems, 2013, pp. 1–19 Search PubMed.
- J. Henseler, C. M. Ringle and R. R. Sinkovics, Adv. Int. Market., 2009, 20, 277–319 Search PubMed.
- J. Benitez, J. Henseler, A. Castillo and F. Schuberth, Inf. Manag., 2020, 57, 103168 CrossRef.
- P. K. Ozili, The acceptable R-square in empirical modelling for social science research, in Social research methodology and publishing results: a guide to non-native English speakers, IGI Global, 2023, pp. 134–143 Search PubMed.
- G. Shmueli, S. Ray, J. M. Velasquez Estrada and S. B. Chatla, J. Bus. Res., 2016, 69, 4552–4564 CrossRef.
- M. Stone, J. Roy. Stat. Soc. B, 1974, 36, 111–147 CrossRef.
- S. Geisser, Biometrika, 1974, 61, 101 CrossRef.
- P. N. Sharma, B. D. D. Liengaard, J. F. Hair, M. Sarstedt and C. M. Ringle, Eur. J. Market., 2022, 67, 1662–1677 Search PubMed.
- N. Huan, T. Yamamoto, H. Sato, D. Tzioutzios, H. Yin and R. Sala, Appl. Energy, 2024, 364, 123141 CAS.
- Office for National Statistics, Trust in Government, UK: 2022, 2022 Search PubMed.
- M. Holder, Government under fire over claims UK has ‘gone backwards’ on energy security, https://www.businessgreen.com/news/4191203/government-claims-uk-gone-backwards-energy-security, accessed 11 May 2024.
- F. Jackson, The UK is failing on net zero and energy security, https://www.forbes.com/sites/feliciajackson/2024/03/14/the-uk-is-failing-on-net-zero-and-energy-security/, accessed 11 May 2024.
- J. Gabbatiss and S. Hayes, Analysis: Record opposition to climate action by UK's right-leaning newspapers in 2023, https://www.carbonbrief.org/analysis-record-opposition-to-climate-action-by-uks-right-leaning-newspapers-in-2023/, accessed 11 May 2024.
- R. Parkes, ‘Extremely concerned’: Future of UK hydrogen heating trials hangs in the balance as opposition grows in Redcar, https://www.hydrogeninsight.com/policy/extremely-concerned-future-of-uk-hydrogen-heating-trials-hangs-in-the-balance-as-opposition-grows-in-redcar/2-1-1486630, accessed 26 August 2023.
- R. Parkes, ‘Manipulation, misinformation and deceit’: Hydrogen heating trial dropped by government after fierce public opposition, https://www.hydrogeninsight.com/policy/manipulation-misinformation-and-deceit-hydrogen-heating-trial-dropped-by-government-after-fierce-public-opposition/2-1-1484109, accessed 11 August 2023.
- R. Parkes, ‘We didn't sign up to be lab rats’: Rebellion brewing against ‘futile’ hydrogen heating project, https://www.hydrogeninsight.com/industrial/we-didn-t-sign-up-to-be-lab-rats-rebellion-brewing-against-futile-hydrogen-heating-project/2-1-1344280, accessed 20 June 2023.
- Edelman Trust Institute, Edelman Trust Barometer 2021: Country Report – Trust in the UK, 2021 Search PubMed.
- Edelman Trust Institute, Edelman Trust Barometer 2022: Country Report – Trust in the UK, 2022, https://www.edelman.co.uk/2022-edelman-uk-trust-barometer Search PubMed.
- Edelman Trust Institute, 2023 Edelman Trust Barometer: UK Supplement Report, 2023 Search PubMed.
- M. D. T. de Jong, R. Pieterse and S. R. Jansma, Energy Res Soc Sci., 2024, 111, 103484 CrossRef.
- P. Upham, P. Bögel, E. Dütschke, U. Burghard, C. Oltra, R. Sala, M. Lores and J. Brinkmann, Energy Res Soc Sci., 2020, 70, 101722 Search PubMed.
- N. Huan, T. Yamamoto, H. Sato, D. Tzioutzios, R. Sala, L. Goncalves, W. Kosman and K. Stolecka-Antczak, Chem. Eng. Trans., 2023, 105, 139–144 Search PubMed.
- Edelman Trust Institute, 2023 Edelman Trust Barometer: Navigating a Polarized World, 2023 Search PubMed.
- A. Lowenstein, Revealed: how top PR firm uses ‘trust barometer’ to promote world’s autocrats, Guardian, 2023, https://www.theguardian.com/us-news/2023/nov/24/edelman-pr-trust-barometer-uae-saudi-arabia Search PubMed.
- M. Cho, Y. Lee, Y. Kim and M. C. Lee, Energies, 2024, 17, 4325 CAS.
- P. de Laat, Overview of hydrogen projects in the Netherlands, 2020 Search PubMed.
- E. Molin, Transp. Res. Rec., 2005, 1941, 115–121 Search PubMed.
- J. L. Zachariah-Wolff and K. Hemmes, Bull. Sci. Technol. Soc., 2006, 26, 339–345 CrossRef.
- N. M. A. Huijts and B. van Wee, Int. J. Hydrogen Energy, 2015, 40, 10367–10381 CrossRef CAS.
- N. M. A. Huijts, G. de Vries and E. J. E. Molin, Sustainability, 2019, 11(8), 2220 CrossRef.
- L. Collins, World first: Dutch ‘city’ votes to switch its heating from natural gas to green hydrogen, https://www.hydrogeninsight.com/innovation/world-first-dutch-city-votes-to-switch-its-heating-from-natural-gas-to-green-hydrogen/2-1-1479452, accessed 25 April, 2024.
- Hydrogen Central, Netherlands – Entire village of Stad Aan ‘T Haringvliet will be off gas in seven years and will switch to hydrogen for heating homes and buildings, https://hydrogen-central.com/netherlands-entire-village-stad-aan-t-haringvliet-gas-seven-years-and-will-switch-hydrogen-for-heating-homes-and-buildings/, accessed 25 April, 2024.
- J. A. Gordon, N. Balta-Ozkan and S. A. Nabavi, Appl. Energy, 2022, 324, 119715 Search PubMed.
- M. Ricci, P. Bellaby and R. Flynn, Int. J. Hydrogen Energy, 2008, 33, 5868–5880 CrossRef CAS.
- Edelman Trust Institute, 2024 Edelman Trust Barometer Global Report, 2024 Search PubMed.
- Edelman Trust Institute, Edelman Trust Barometer 2021 Global Report, 2021 Search PubMed.
- Edelman Trust Institute, Edelman Trust Barometer 2020 Global Report, 2020 Search PubMed.
- Edelman Trust Institute, Edelman Trust Barometer 2022 Global Report, 2022 Search PubMed.
- J. J. Häußermann, M. J. Maier, T. C. Kirsch, S. Kaiser and M. Schraudner, J. Sustain. Energy, 2023, 13, 1–19 CrossRef.
- Hydrogen Scotland, SGN H100 Fife construction complete, https://www.hydrogenscotland.com/sgn-h100-fife-construction-complete/, accessed 18 December, 2024.
- Registered Gas Engineer, Fife hydrogen network is complete and will start in 2025, https://registeredgasengineer.co.uk/fife-hydrogen-network-is-complete-and-will-start-in-2025/, accessed 18 December, 2024.
- M. Shipton, Residents plan demo against controversial hydrogen plant, https://nation.cymru/news/residents-plan-demo-against-controversial-hydrogen-plant/, accessed 18 December, 2024.
- L. Smith, New date set for decision on plans for controversial hydrogen plant, https://www.walesonline.co.uk/news/wales-news/new-date-set-decision-plans-30043211, accessed 18 December, 2024.
- T. Li and H. H. Fung, J. Gerontol., 2013, 68, 347–355 Search PubMed.
- M. Ricci, P. Bellaby and R. Flynn, Energy Policy, 2010, 38, 2633–2640 Search PubMed.
- D. Bloomfield, K. Collins, C. Fry and R. Munton, Environ. Plann. C Gov. Policy, 2001, 19, 501–513 Search PubMed.
- K. M. Sønderskov and P. T. Dinesen, Political Behav., 2016, 38, 179–202 Search PubMed.
- R. Windemer, Energy Policy, 2023, 173, 113363 Search PubMed.
- J. A. Gordon, N. Balta-Ozkan and S. A. Nabavi, Int. J. Hydrogen Energy, 2024, 60, 1170–1191 CrossRef CAS.
- M. Jary, With the new Energy Act, the UK smart meter rollout is at a technological crunch point, https://www.smart-energy.com/industry-sectors/smart-meters/with-the-new-energy-act-the-uk-smart-meter-rollout-is-at-a-technological-crunch-point/, accessed 13 May 2024.
- G. Gosnell and D. McCoy, J. Environ. Econ. Manag., 2023, 118, 102756 CrossRef.
- Department for Energy Security and Net Zero, Energy Security Bill factsheet: Smart metering, https://www.gov.uk/government/publications/energy-security-bill-factsheets/energy-security-bill-factsheet-smart-metering, accessed 13 May 2024.
- Department for Business, Energy & Industrial Strategy, Energy Security Bill Policy Statement: Smart Metering, 2022 Search PubMed.
- B. K. Sovacool, P. Kivimaa, S. Hielscher and K. Jenkins, Energy Policy, 2017, 109, 767–781 CrossRef.
- F. W. Geels, S. Sareen, A. Hook and B. K. Sovacool, Res. Policy, 2021, 50, 104272 CrossRef.
- D. J. Morgan, C. A. Maddock and C. B. A. Musselwhite, Energy Res Soc Sci., 2024, 111, 103462 CrossRef.
- B. W. Terwel, F. Harinck, N. Ellemers and D. D. L. Daamen, J. Exp. Psychol. Appl., 2010, 16, 173–186 Search PubMed.
- D. P. Mclaren, Energy Environ., 2012, 23(2–3), 345–365 CrossRef.
- N. M. A. Huijts, N. Contzen and S. Roeser, Energy Policy, 2022, 165, 112963 CrossRef.
- F. Swennenhuis, V. de Gooyert and H. de Coninck, Energy Res Soc Sci., 2022, 88, 102598 CrossRef.
- T. Mueller and M. Brooks, Energy Res Soc Sci., 2020, 63, 101406 Search PubMed.
- A. Jacksohn, P. Grösche, K. Rehdanz and C. Schröder, Energy Econ., 2019, 81, 216–226 Search PubMed.
- J. B. Ang, P. G. Fredriksson and S. Sharma, Resour. Energy Econ., 2020, 61, 101180 Search PubMed.
- H. Elmustapha, T. Hoppe and H. Bressers, J. Cleaner Prod., 2018, 172, 347–357 Search PubMed.
- L. Korcaj, U. J. J. Hahnel and H. Spada, Renewable Energy, 2015, 75, 407–415 Search PubMed.
- HM Government, British Energy Security Strategy: Secure, Clean and Affordable British Energy for the Long Term, 2022 Search PubMed.
- S. Hoedl, J. Fusion Energy, 2023, 42, 1–3 Search PubMed.
- M. S. Reed, Biol. Conserv., 2008, 141, 2417–2431 Search PubMed.
- F. Hanusch and M. Schad, GAIA, 2021, 30(2), 82–86 Search PubMed.
- S. Damman, E. Sandberg, E. Rosenberg, P. Pisciella and I. Graabak, Energy Res Soc Sci., 2021, 78, 102116 Search PubMed.
- A. Trattner, M. Klell and F. Radner, Int. J. Hydrogen Energy, 2022, 47, 2059–2079 CAS.
- J. D. Hunt, A. Nascimento, N. Nascimento, L. W. Vieira and O. J. Romero, Renewable Sustainable Energy Rev., 2022, 160, 112291 CAS.
- J. Yap and B. McLellan, Int. J. Hydrogen Energy, 2024, 66, 371–386 CAS.
- A. Cherp, V. Vinichenko, J. Jewell, E. Brutschin and B. Sovacool, Energy Res Soc Sci., 2018, 37, 175–190 Search PubMed.
- A. Darmani, N. Arvidsson, A. Hidalgo and J. Albors, Renewable Sustainable Energy Rev., 2014, 38, 834–847 Search PubMed.
- A. Cherp, V. Vinichenko, J. Tosun, J. A. Gordon and J. Jewell, Nat. Energy, 2021, 6, 742–754 Search PubMed.
- L. M. Hassan, E. Shiu and D. Shaw, J. Bus. Ethics, 2016, 136, 219–236 CrossRef.
- V. Pitardi and H. R. Marriott, Psychol. Mark., 2021, 38, 626–642 CrossRef.
- M. A. Hai, M. M. E. Moula and U. Seppälä, Int. J. Sustain. Built Environ., 2017, 6, 317–329 CrossRef.
- SGN, SGN wins Ofgem funding to launch pioneering H100 Fife hydrogen project, https://www.sgn.co.uk/news/h100-fife-ofgem-approved-world-first-hydrogen-heating-network, accessed 10 May 2021.
- Fife Council, SGN celebrates key milestones for world-first hydrogen project with Fife Council, Fife Council, https://www.fife.gov.uk/news/2023/sgn-celebrates-key-milestones-for-world-first-hydrogen-project-with-fife-council, accessed 27 October 2023.
- Government-funded hydrogen heating pilot in German homes deemed ‘complete success’, Hydrogen Insight, https://www.hydrogeninsight.com/innovation/government-funded-hydrogen-heating-pilot-in-german-homes-deemed-complete-success/2-1-1645584, accessed 18 May 2024.
- US utility begins blending hydrogen into natural-gas supply for 1,800 customers in Utah, despite health concerns, Hydrogen Insight, https://www.hydrogeninsight.com/innovation/us-utility-begins-blending-hydrogen-into-natural-gas-supply-for-1-800-customers-in-utah-despite-health-concerns/2-1-1430992, accessed 18 May 2024.
- World first, Dutch ‘city’ votes to switch its heating from natural gas to green hydrogen, Hydrogen Insight, https://www.hydrogeninsight.com/innovation/world-first-dutch-city-votes-to-switch-its-heating-from-natural-gas-to-green-hydrogen/2-1-1479452, accessed 18 May 2024.
- F. Kurtaliqi, C. Lancelot Miltgen, G. Viglia and G. Pantin-Sohier, J. Bus. Res., 2024, 172, 114464 CrossRef.
- N. M. A. Huijts, Energy Res Soc Sci., 2018, 44, 138–145 Search PubMed.
- G. Xu, S. Wang and D. Zhao, Environ. Sci. Pollut. Res., 2021, 28, 20362–20374 Search PubMed.
- V. Rai and A. L. Beck, Environ. Res. Lett., 2015, 10, 07411 Search PubMed.
- K. S. Wolske, P. C. Stern and T. Dietz, Energy Res Soc Sci., 2017, 25, 134–151 Search PubMed.
- M. C. Claudy, M. Peterson and A. O'Driscoll, J. Macromarketing, 2013, 33, 273–287 Search PubMed.
- P. Bögel, C. Oltra, R. Sala, M. Lores, P. Upham, E. Dütschke, U. Schneider and P. Wiemann, J. Cleaner Prod., 2018, 188, 125–135 Search PubMed.
- B. K. Sovacool, L. F. Cabeza, A. L. Pisello, A. Fronzetti Colladon, H. M. Larijani, B. Dawoud and M. Martiskainen, Renewable Sustainable Energy Rev., 2021, 139, 110703 Search PubMed.
- M. Lei, W. Cai, W. Liu and C. Wang, Energy, 2022, 253, 124079 Search PubMed.
- B. Lennon, N. P. Dunphy and E. Sanvicente, Energy Sustain Soc., 2019, 9, 1–18 Search PubMed.
- B. K. Sovacool, J. Axsen and S. Sorrell, Energy Res Soc Sci., 2018, 45, 12–42 Search PubMed.
- R. Vezzoni, Environ. Innov. Soc. Transit., 2024, 50, 100817 Search PubMed.
- P. J. Newell, F. W. Geels and B. K. Sovacool, Environ. Res. Lett., 2022, 17, 041006 Search PubMed.
- L. Baker and J. Phillips, Environ. Plan. C Politics Space, 2018, 37, 177–196 Search PubMed.
- A. A. Aibinu and A. M. Al-Lawati, Autom. Constr., 2010, 19, 714–724 Search PubMed.
Footnotes |
| † Electronic supplementary information (ESI) available. See DOI: https://doi.org/10.1039/d4se01615g |
| ‡ Install at least 40 GW of renewable hydrogen electrolysers by 2030 and achieve production of up to 10 million tonnes of renewable hydrogen.23 |
| § 213 citations up to April 4th 2024. |
| ¶ 16 studies conducted before 2020 (including three studies for the period 2003–2012) account for 704 citations from a total of 2294 citations. |
| || Energy Research & Social Science: 4 times; Energy Policy: 3 times; Sustainability Switzerland: 3 times; Technology in Society: 3 times; Renewable and Sustainable Energy Reviews: 2 times; Technological Forecasting and Social Change: 2 times. |
| ** The study found that public trust predicts attitudes towards renewable energy systems (β = 0.291, p < 0.001) and subjective norms (β = 0.274, p < 0.001).235 |
| †† i.e. above 7.00 on an 11-point Likert scale. |
| ‡‡ The results reported in this analysis are reverse coded for consistency. |
| §§ This specific metric was not assessed in the 2018 survey. |
| ¶¶ i.e. the electronic issuing and receipt of any bid documentation in electronic format as part of the procurement process.407 |
| |||| The Scopus literature review showed that public trust is more commonly referred to than social trust in the literature, which further motivated the use of the former as the umbrella term and the latter as one of its derivatives. |
| *** i.e. four measures of social trust (i.e. trust in GDNOs, financial institutions, Ofgem, and the media), in addition to trust in renewable energy producers. |
| ††† A holdout-sample-based procedure that generates case-level predictions on an item or a construct level to reap the benefits of predictive model assessment in PLS-SEM.313 |
| ‡‡‡ The CVPAT performs “a pairwise comparison between theoretically derived competing models,” and then selects “the model with the highest predictive power based on a prespecified statistical significance level”.137 |
| §§§ Whereas maximising public trust may prove unfeasible. |
| ¶¶¶ In the context of willingness to invest in a sustainable heating system. |
| |||||| Notably, among the hydrogen frontrunners, Australia also ranked in the distrust category in 2023 (48 points) but reached the neutral category in 2024 (52 points). |
| **** Objective knowledge → (+) trust in hydrogen technology (TH); subjective knowledge → TH; TH → (+) positive feelings towards neighbouring HFSs; TH → negative feelings towards neighbouring HFSs. |
| †††† The MEG was marginally over-represented, while the BLG was under-represented (−3.5%) for annual income above £41500. |
| This journal is © The Royal Society of Chemistry 2025 |