Fracture and fatigue characteristics of monodomain and polydomain liquid crystal elastomers
Minyu
Hu
a,
Liqian
Wang
a,
Zhuxuan
Wei
a,
Rui
Xiao
 *a and
Jin
Qian
 *ab
*ab
aState Key Laboratory of Fluid Power and Mechatronic Systems, Zhejiang University, Hangzhou 310027, China. E-mail: rxiao@zju.edu.cn; jqian@zju.edu.cn
bDepartment of Engineering Mechanics, Zhejiang University, Hangzhou 310027, China
First published on 25th November 2024
Abstract
Liquid crystal elastomers (LCEs), a class of elastomers combining liquid crystals with a polymer network, have garnered significant interest for applications in the field of soft robotics. However, the fracture and fatigue characteristics of LCEs remain poorly understood. This study presents a comprehensive investigation into the fracture and fatigue characteristics of LCEs, focusing on polydomain and monodomain variants subjected to different loading directions. The fracture energy (also called toughness) and fatigue threshold of polydomain and monodomain LCEs were quantitatively measured and compared with selected elastomers. Our experimental results demonstrate that polydomain LCEs exhibit superior fracture energy and fatigue threshold compared to monodomain LCEs. Within the monodomain category, LCEs subjected to parallel loading exhibit larger fracture energy than those under vertical loading, while their fatigue thresholds remain comparable. These findings enhance our understanding of the deformation and failure characteristics of LCEs, which are crucial for their applications in various fields.
Introduction
Liquid crystal elastomers (LCEs) are a unique class of soft actuating materials, which are constituted by a combination of liquid crystals and polymer networks. The distinctive properties of LCEs, such as soft elasticity, stimuli sensitivity, and anisotropy, are primarily attributed to the orientation order of liquid crystal mesogens and inherent mechanical characteristics of polymer networks.1–3 The feature that sets LCEs apart from other soft materials is their ability to undergo reversible actuation when stimulated by an external stimulus such as light or heat, which also enables LCEs to exhibit significant actuation strain and work density.4,5 This is primarily evidenced by the temperature-dependent behavior of the liquid crystal mesogens within LCEs. As the temperature changes, these mesogens can transit between the isotropic phase and the liquid crystal phase.6The majority of ongoing research in the field of LCEs has been focused on interactions between LCEs and external fields, including thermal, electric, optical, mechanical, and all of these combined.7,8 Studies have investigated the fabrication and integration of LCEs with other materials to create multi-functional composites.9,10 LCEs can also be fabricated into intricate structures utilizing various manufacturing techniques, including surface alignment technology and 3D printing technology.11 Furthermore, these materials can be reprocessed and programmed, enhancing their versatility.12–15 These unique mechanical properties and promising advancements endow LCEs with potential for applications including artificial muscles,16,17 soft robots,7,8 wearable devices,18 and biomimetic devices.19 In applications in varying temperature environments, LCEs are often subjected to cyclic loading. For example, liquid crystal elastomers can be used to adjust the upper limit of temperature protection through pre-stretching, or combined with liquid metals to form reusable load-bearing structures.20,21 Moreover, there have been several efforts to develop artificial muscle-like LCEs.22 It is therefore imperative to understand the fracture and fatigue characteristics of LCEs.
Since the inception of LCEs, many studies have been conducted to explore their mechanical properties with different microstructures.20,23 LCEs are categorized into monodomains, with a uniform alignment of liquid crystal mesogens, and polydomains, with liquid crystal mesogens aligned coherently within each domain, but differing in orientation between domains. A comparative study has been carried out to understand the significant differences in mechanical properties between monodomain LCE and polydomain LCE.24 The soft elasticity, attributed to the mesogen rotation induced by stretching, has also been theoretically modeled and empirically validated.25
Fatigue behaviors of both polydomain and monodomain LCEs have not been well investigated. For elastomers, fatigue is a phenomenon mainly investigated through two distinct types of tests, employing uncut and precut samples, respectively.26–28 In the case of an uncut sample subjected to cyclic loading, any irreversible alteration in its mechanical properties, such as the elastic modulus, is classified as fatigue damage. Conversely, when a precut sample is exposed to cyclic loading, the progressive extension of the crack is referred to as fatigue fracture. Fatigue has been thoroughly investigated across common load-bearing materials, including metals, ceramics, plastics, elastomers, and composites.29–32 Despite the broad range of applications of LCEs, there lacks in-depth research into their mechanical properties, particularly the disparity in fracture energy and fatigue threshold between monodomain and polydomain LCEs, which are critical for their application.
This paper investigates the fracture and fatigue characteristics of polydomain LCEs and monodomain LCEs under different loading directions and loading rates. The remaining part of the paper first introduces the experimental setup, including material synthesis and mechanical characterization methods. The followed section presents all the experimental findings. The conclusion part summarizes the main finding of the current work.
Experimental section
Materials
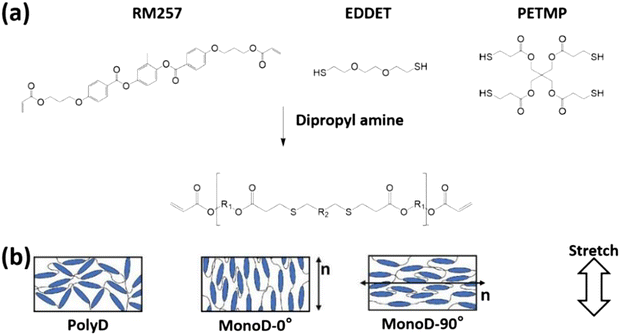
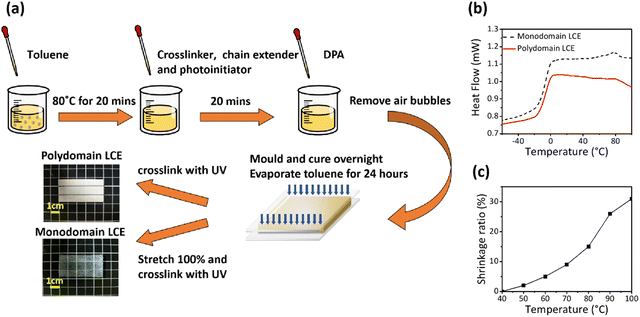
Polydomain main-chain LCE samples were synthesized via a thiol-acrylate Michael addition reaction. Two thiol monomers, pentaerythritol tetrakis (3-mercaptopropionate) (PETMP), dipropyl amine (DPA), photoinitiator (2-hydroxyethoxy)-2-methylpropiophenone (HHMP) and 2,2′-(ethylenedioxy)diethanethiol (EDDET), were purchased from Sigma Aldrich (St Louis, MO, USA) and used in their as-received condition. The diacrylate mesogen, 1,4-bis-[4-(3-acryloyloxypropyloxy)benzoyloxy]-2-methylbenzene (RM257), was purchased from Wilshire Technologies (Princeton, NJ, USA) and also used in its as-received condition with no purification, as shown in Fig. 1(a).As shown in Fig. 2(a), LCEs are synthesized by using a two-stage reaction process, following the procedures described in previous literature.19 The process started with the dissolution of the liquid crystal monomer RM257 (10 g, 16.99 mmol) in toluene at a temperature of 85 °C. Subsequently, EDDET (2.4 g, 13.17 mmol), PETMP (0.48 g, 0.98 mmol), DPA (0.028 g, 0.28 mmol, diluted 1![[thin space (1/6-em)]](https://www.rsc.org/images/entities/char_2009.gif) :
:![[thin space (1/6-em)]](https://www.rsc.org/images/entities/char_2009.gif) 50 in toluene), and HHMP (0.06 g, 0.27 mmol) were added to this mixture. The mixture was then poured into a glass mold and allowed to rest for 12 hours at room temperature, facilitating the conclusion of the first stage of the crosslinking reaction. Following this stage, the loosely crosslinked LCE film was placed into an oven set at 85 °C for a duration of 24 hours for the solvent to evaporate.
50 in toluene), and HHMP (0.06 g, 0.27 mmol) were added to this mixture. The mixture was then poured into a glass mold and allowed to rest for 12 hours at room temperature, facilitating the conclusion of the first stage of the crosslinking reaction. Following this stage, the loosely crosslinked LCE film was placed into an oven set at 85 °C for a duration of 24 hours for the solvent to evaporate.
To synthesize polydomain LCEs, the loosely crosslinked LCE film was exposed to an ultraviolet (UV) lamp (365 nm, 100 W) for a duration of 120 minutes. This process facilitates the completion of the second stage of the crosslinking reaction involving the excess acrylate groups (4%) from RM257, resulting in final polydomain samples.
To synthesize monodomain LCEs, the loosely crosslinked LCE film was subjected to uniaxial stretching to achieve a stretching ratio of λ = 2. It was then placed under an UV lamp (365 nm, 100 W) for 120 minutes to complete the second stage of the crosslinking reaction as well. During all mechanical tests, the monodomain LCE samples were aligned so that the liquid crystal mesogens (monodomain) were parallel or perpendicular to the direction of the applied tensile load.
For the sake of clarity, the polydomain LCE is referred to as “PolyD LCE” in the following. The monodomain LCE, when its liquid crystal mesogens are parallel to the loading direction, is referred to as “MonoD-0° LCE”. The monodomain LCE, when its mesogens are perpendicular to the loading direction, is referred to as “MonoD-90° LCE”, as demonstrated in Fig. 1(b).
Following the previous work,33,34 differential scanning calorimetry (DSC) was also performed using a TA Instrument Q200. The pre-test samples of polydomain LCE and monodomain LCE (10 mg) were loaded into a standard aluminum DSC pan. The samples were heated to 110 °C at 10 °C min−1, held isothermally for 3 min, and cooled slowly to −60 °C at a rate of 5 °C min−1. The TNI of each LCE sample was found between 75 °C and 80 °C, where a minor transition of heat flow occurs as shown in Fig. 2(b). Fig. 2(c) shows the shrinkage ratio of monodomain LCE samples in a free-standing state, which indicates that the monodomain LCEs exhibit favorable actuation strain at TNI (∼15% at 80 °C).
Measurement of LCE fracture energy
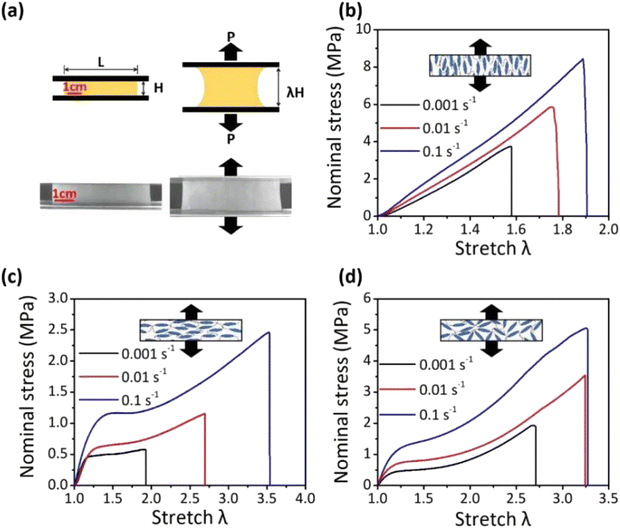
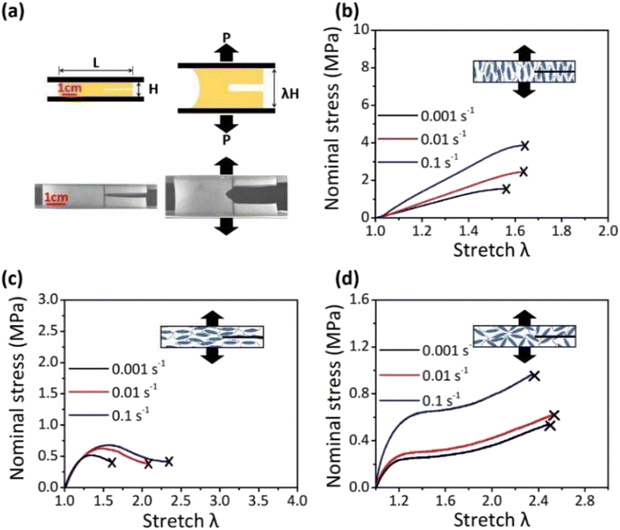
The fracture energy of LCEs, also referred to as toughness or fracture toughness in previous studies,6,35 was measured using the pure shear test method. This method involved adhering two rectangular LCEs thin films (∼10 mm × 50 mm) onto an acrylic board, as shown in Fig. 3(a) and 4(a). The length L was maintained at five times of the original height H to avoid edge effects. Initial cracks (length = 2H, ∼20 mm) were generated in the precut samples using a sharp blade.Using a commercial tensile tester (Instron 3343), each precut sample was then subjected to a monotonically increasing tensile load until fracture, at which point the critical stretch was recorded. Then, the same quasi-static stretching experiment was applied to the corresponding LCE sample with no-cut. The process continued until failure, with the critical stretch at the point of sample rupture being noted.
By leveraging the relationship between stress and stretch, the fracture work, denoted as Wf, can be calculated using the following formula:
| Wf = W(λrup-nc), | (1) |
Following the pioneering work by Rivlin and Thomas in 1953,35 the fracture energy, denoted as Γ, is computed using the following equation:
| Γ = W(λrup-pc) × H | (2) |
Fatigue performance of LCEs under tensile strain
To delve into the fatigue characteristics of LCEs, we conducted cyclic loading experiments on no-cut samples for PolyD, MonoD-0° and MonoD-90° LCEs (sample dimension: ∼10 mm × 50 mm). Cyclic loading of a triangular waveform was imposed on samples up to a strain of 50%, and the loading rate was maintained at 0.1 s−1.These fatigue experiments were carried out under fixed room temperature conditions for all types of samples. The process continued until the specimens experienced failure. Throughout the course of the experiment, we meticulously recorded the variations in peak stress as a function of the number of cycles. These data provided valuable insights into the fatigue behavior of LCEs under cyclic loading conditions.
Fatigue threshold of LCEs
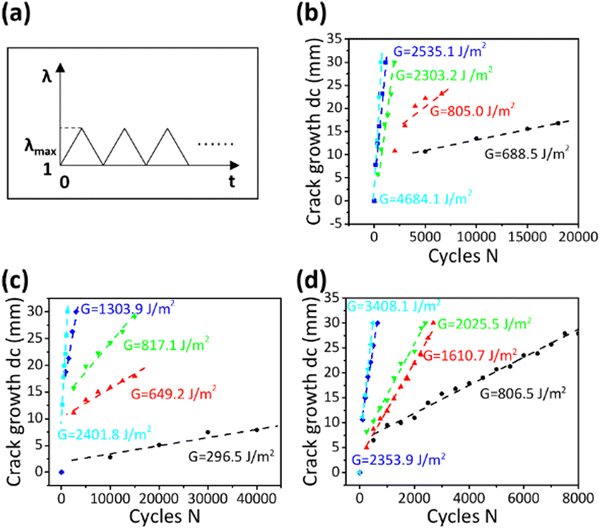
To comprehensively investigate fatigue characteristics of LCEs, the fatigue thresholds for PolyD LCE, MonoD-0° LCE, and MonoD-90° LCE were measured. These cyclic experiments were conducted at a rate of 0.1 s−1 on both monodomain LCE and polydomain LCE precut samples (∼10 mm × 50 mm).To determine the fatigue threshold, experiments were performed by repeatedly loading–unloading of the LCE samples up to a fixed stretch value λmax, until the samples fractured completely. The loading–unloading profile was a triangular waveform. For monodomain LCE, loading was imposed in parallel with or perpendicular to the direction of mesogen orientation. During experiments, the crack length extension Δc was then plotted vs the cycle number (n) and the slope (dc/dn) was calculated.
The same cyclic loading–unloading experiments were repeated using no-cut samples to record the stress–stretch curve of the last cycle, where the energy release rate G could be calculated as follows:
| G = W(λmax) × H, | (3) |
Consider the crack growth per cycle dc/dn as a function of the energy release G, by which the fatigue threshold Γ0 can be determined by extrapolating the relation of dc/dn versus G. Therefore, Γ0 can be regarded as the critical value of G, below which the propagation of cracks is negligible.
Results and discussion
Variation of LCE fracture characteristics with different tensile rates
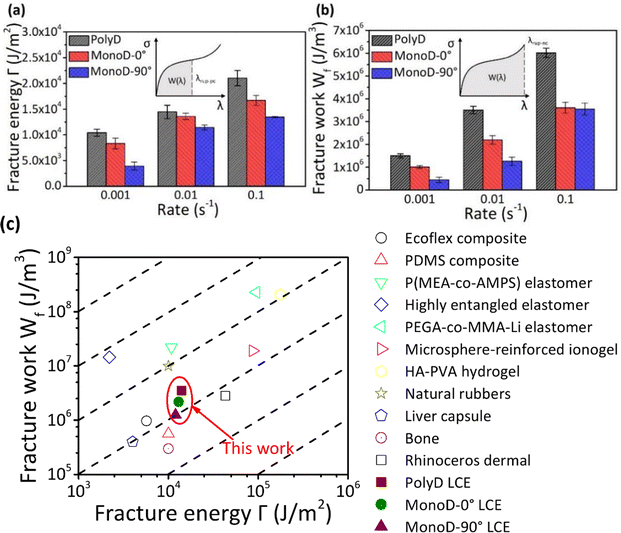
Fig. 3(b)–(d) and 4(b)–(d) show the stress–stretch curves for both polydomain and monodomain LCEs under a pure shear test. These results allow for the calculation of the fracture energy of the LCEs under investigation. At the loading rates of 0.1 s−1, 0.01 s−1 and 0.001 s−1, the corresponding fracture energy values are 22![[thin space (1/6-em)]](https://www.rsc.org/images/entities/char_2009.gif) 543 J m−2, 15
543 J m−2, 15![[thin space (1/6-em)]](https://www.rsc.org/images/entities/char_2009.gif) 769 J m−2 and 11
769 J m−2 and 11![[thin space (1/6-em)]](https://www.rsc.org/images/entities/char_2009.gif) 124 J m−2 for PolyD LCE, 17
124 J m−2 for PolyD LCE, 17![[thin space (1/6-em)]](https://www.rsc.org/images/entities/char_2009.gif) 625 J m−2, 14
625 J m−2, 14![[thin space (1/6-em)]](https://www.rsc.org/images/entities/char_2009.gif) 162 J m−2 and 9305 J m−2 for MonoD-0° LCE, and 13
162 J m−2 and 9305 J m−2 for MonoD-0° LCE, and 13![[thin space (1/6-em)]](https://www.rsc.org/images/entities/char_2009.gif) 432 J m−2, 10
432 J m−2, 10![[thin space (1/6-em)]](https://www.rsc.org/images/entities/char_2009.gif) 897 J m−2 and 3104 J m−2 for MonoD-90° LCE, as shown in Fig. 5(a). The fracture work of the LCEs follows a similar trend, as summarized in Fig. 5(b). It can be seen that the fracture energy and the fracture work of LCEs increase with the tensile rate due to viscoelasticity.36,37 The fracture energy of polydomain LCEs is notably higher than that of monodomain LCEs.
897 J m−2 and 3104 J m−2 for MonoD-90° LCE, as shown in Fig. 5(a). The fracture work of the LCEs follows a similar trend, as summarized in Fig. 5(b). It can be seen that the fracture energy and the fracture work of LCEs increase with the tensile rate due to viscoelasticity.36,37 The fracture energy of polydomain LCEs is notably higher than that of monodomain LCEs.
During the experiment, it was observed that the initially opaque polydomain LCE became transparent when subjected to excessive stretching. As discussed by Clarke et al.,6 the transition from an opaque to a transparent state is attributed to the shift from a polydomain to a monodomain, a process triggered by the realignment of polymer chains and mesogens. This transition at the micro-structure level is caused by the mesogen rotation, leading to additional energy dissipation and an increase in both the fracture energy and fracture work.24
When a monodomain LCE is subjected to loads in 0° and 90° directions, the fracture energy and fracture work of MonoD-0° LCE are higher than those of MonoD-90° LCE. This observation aligns closely with the model prediction by Rivlin and Thomas:24 for a crack propagation to occur through the LCE samples, the process needs to break all the polymer chains across the fracture plane, and MonoD-0° LCE contains a larger number of chains in the fracture plane compared to MonoD-90° LCE.
In a previous work, Chen and coworkers38 plotted reported data for selected materials in a diagram using fracture work Wf as a function of fracture energy Γ. During quasi-static stretching, the stretchability of these materials exhibits insensitivity to small cracks but becomes sensitive radically when the cracks become sufficiently large. During the fracture process of soft materials, the size of the fracture process zone is also comparable to the fracto-cohesive length of the material. Based on fracture work Wf and fracture energy Γ, the fracto-cohesive length Lf of LCEs can be determined according to ref. 39–41:
 | (4) |
As indicated in Fig. 5(c), the dashed lines denote the constant values of the fracto-cohesive length Lf for the LCEs under investigation, compared with selected elastomers. These Lf values of LCEs are all within the range between 1 mm and 1 cm of the same order of magnitude, similar to the properties of natural rubber, which are lower than those of soft tissues by ∼1 cm.28,42–49
It is noteworthy that the fracto-cohesive length Lf of polydomain LCEs is not equivalent to that of monodomain LCEs. For monodomain LCEs subjected to stretching in different directions, the Lf of MonoD-0° LCE is also distinct from that of MonoD-90° LCE. If a large stretching ratio is set to prepare monodomain LCEs, this disparity will become even more pronounced due to the difference of fracture energy and fracture work.24 This characteristic distinguishes LCEs from many other elastomers in the literature.28,42–48
Microscopically, the variation in the Lf values of LCEs may be associated with the damage caused by imposed stretching in the preparation process of monodomain LCEs, or different alignments of mesogens within LCEs leading to the difference in the number of polymer chains fractured by cracks as they pass through diverse planes of LCE materials. It can be inferred that the fracto-cohesive length Lf is not solely dependent on the material composition, but also significantly influenced by the internal microstructure of LCEs.
Fatigue characteristics of LCEs
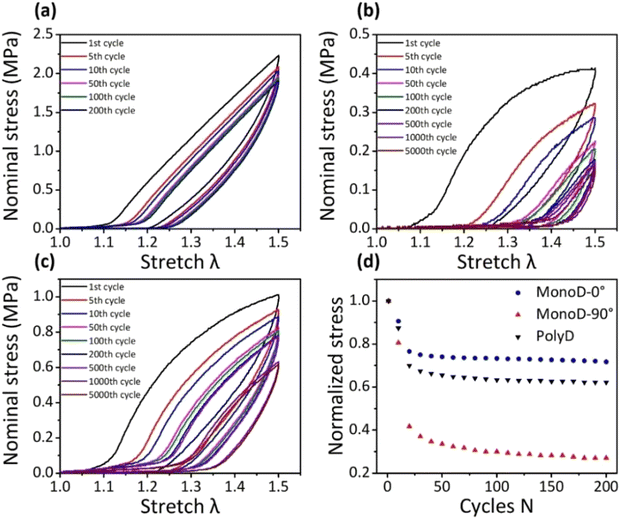
Fig. 6 presents a comparison of variations in the peak stress for PolyD LCE, MonoD-0° LCE, and MonoD-90° LCE under loading–unloading cycles (fixed maximum stretch: λmax = 1.5). Notably, MonoD-0° LCE failed after enduring 200 loading cycles. In contrast, both PolyD LCE and MonoD-90° LCE demonstrated remarkable resilience, with the peak stress stabilizing after 1000 cycles.To understand the stress evolutions of PolyD LCE, MonoD-0° LCE and MonoD-90° in fatigue tests, Fig. 6(d) normalizes the peak stress values for 200 consecutive cycles via the peak stress of the first cycle.
Prior to any noticeable damage to the LCE samples, the peak stress level of the MonoD-0° LCE consistently remained above 70% of the original peak stress, demonstrating its capacity to sustain multiple loading cycles. In contrast, the peak stress level in PolyD LCE and MonoD-90° LCE rapidly decreased within the first 50 cycles. Under identical strain conditions, the no-cut MonoD-0° LCE sample exhibits a significantly lower tolerance to cyclic loading, compared to the PolyD LCE and MonoD-90° LCE samples.
From a microscopic viewpoint, the liquid crystal mesogens of MonoD-0° LCE are all in a configuration along the loading direction. During the loading–unloading cycles of MonoD-0° LCE samples, the imposed loading directly acts on the polymer chains, leading to damage accumulation and ultimate failure. In contrast, both PolyD LCE and MonoD-90° LCE possess a plateau region, as denoted in Fig. 6(b) and (c), where the liquid crystal mesogens can rotate under loading cycles. This microscopic mechanism of mesogen rotation results in more energy dissipation and better fatigue resistance, thereby rendering the polymer chains of LCE samples less susceptible to failure under cyclic loading. This process of mesogen rotation in MonoD-90° LCE, induced by stretching, is accompanied by a softening of material in the stretching direction, leading to a decreased stress for given magnitude of strain. Therefore, MonoD-90° LCE with more extended plateau region than PolyD LCE exhibits better properties for multiple cycles, which can still endure 1500 cycles (fixed maximum stretch: λmax = 2.5) without ultimate failure at the loading rate of 0.1 s−1, in contrast to the fact that the PolyD LCE sample fails within 50 cycles.
Fatigue threshold of LCEs
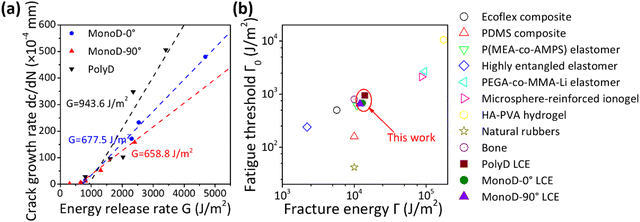
According to our fatigue experiments (Fig. 7), the fatigue threshold values of PolyD LCE, MonoD-0° LCE and MonoD-90° LCE are 943.6 J m−2, 677.5 J m−2 and 658.8 J m−2, respectively, as shown in Fig. 8(a) for the strain rate of 0.1 s−1, much lower than their fracture energy.The fatigue threshold of polydomain LCEs is higher than that of monodomain LCEs. It is observed that the different loading directions have no significant effect on the fatigue threshold of monodomain LCE. An external stretch was applied in synthesis of monodomain LCEs for uniform alignment of mesogens, as we described in Fig. 2, which could damage the polymer network of monodomain LCEs; polydomain LCEs did not experience this process.
Compared with the selected elastomers in Fig. 8(b), the fatigue thresholds of LCEs are distributed within the range of these elastomers, and are similar to the fatigue fracture characteristics of P(MEA-co-AMPS) elastomers.28,42–46 The fatigue threshold and fracture energy of LCEs are comparable to those of biological tissues like skin. It is worth noting that the fracture energy of natural rubber is similar to that of LCEs, while the fatigue threshold of natural rubber (42 J m−2) is much lower than those of LCEs under investigation.
Combining these quantitative results with previous study, the fatigue threshold of LCEs is greatly affected by ambient temperature. Annapooranan and coworkers showed a temperature effect in which the fatigue threshold of LCEs rapidly decreases to 41.95 J m−2 when the temperature increases to 90 °C.34 Furthermore, as the loading rate increases, the fatigue threshold of LCEs will also show a significant increase due to the viscoelasticity effect. For the application scenarios of LCEs with varying temperature and loading rate, it is therefore imperative to determine their fatigue thresholds as functions of these involved factors.
Conclusions
The present study aims to explore the distinct fracture and fatigue characteristics exhibited by polydomain LCEs and monodomain LCEs under varying stretching directions. The experimental results reveal that the fracture energy and fatigue threshold of polydomain LCEs is larger than those of monodomain LCEs. For monodomain LCEs stretched in parallel with or perpendicular to the mesogen orientation, the fracture energy of MonoD-0° LCE exceeds that of MonoD-90° LCE, while the fatigue thresholds of the two scenarios remain at about the same level.The fracto-cohesive length Lf of the LCEs under investigation is quantified to fall into the range between 1 mm and 1 cm. Because of the distinct microstructures of monodomain and polydomain LCEs, the Lf range of LCEs is intrinsically linked to the damage caused by stretching in the preparation process, and the arrangement of liquid crystal mesogens, as well as the distributed number of polymer chains fractured by crack planes under different loading conditions.
The present work can enhance our understanding of behaviors of load-bearing LCEs and also provide critical information for the use of LCEs in robotic and actuator applications.
Data availability
Original data are available from the corresponding author upon reasonable request.Conflicts of interest
There are no conflicts to declare.Acknowledgements
This work was supported by the National Natural Science Foundation of China (Grant Numbers: 12125205, 12321002, 12132014 and 12072316) and the Key Research and Development Program of Zhejiang Province (2021C01183).References
- N. J. Dawson, M. G. Kuzyk, J. Neal, P. Luchette and P. Palffy-Muhoray, J. Opt. Soc. Am. B, 2011, 28, 2134 CrossRef CAS
.
- D. Corbett and M. Warner, Liq. Cryst., 2009, 36, 1263–1280 CrossRef CAS
.
- M. Warner and X. J. Wang, Macromolecules, 1991, 24, 4932–4941 CrossRef CAS
.
- T. J. White and D. J. Broer, Nat. Mater., 2015, 14, 1087–1098 CrossRef CAS
.
- H. Jiang, C. Li and X. Huang, Nanoscale, 2013, 5, 5225 RSC
.
- S. M. Clarke, E. Nishikawa, H. Finkelmann and E. M. Terentjev, Macromol. Chem. Phys., 1997, 198, 3485–3498 CrossRef CAS
.
- Z. Wang, K. Li, Q. He and S. Cai, Adv. Mater., 2019, 31, 1806849 CrossRef
.
- Q. He, Z. Wang, Y. Wang, A. Minori, M. T. Tolley and S. Cai, Sci. Adv., 2019, 5, eaax5746 CrossRef CAS
.
- Y. Hou, W. Hu, M. Wang and H. Yang, Chin. J. Liq. Cryst. Disp., 2022, 37, 241–249 CAS
.
- J. Zhang, D. Sun, B. Zhang, Q. Sun, Y. Zhang, S. Liu, Y. Wang, C. Liu, J. Chen, J. Chen, Y. Song and X. Liu, Mater. Horiz., 2022, 9, 1045–1056 RSC
.
- Z. Wang, Z. Wang, Y. Zheng, Q. He, Y. Wang and S. Cai, Sci. Adv., 2020, 6, eabc0034 CrossRef CAS PubMed
.
- M. O. Saed, C. P. Ambulo, H. Kim, R. De, V. Raval, K. Searles, D. A. Siddiqui, J. M. O. Cue, M. C. Stefan, M. R. Shankar and T. H. Ware, Adv. Funct. Mater., 2019, 29, 1806412 CrossRef
.
- Z. Wang, H. Tian, Q. He and S. Cai, ACS Appl. Mater. Interfaces, 2017, 9, 33119–33128 CrossRef CAS
.
- Z. Wang and S. Cai, J. Mater. Chem. B, 2020, 8, 6610–6623 RSC
.
- Z. Pei, Y. Yang, Q. Chen, E. M. Terentjev, Y. Wei and Y. Ji, Nat. Mater., 2014, 13, 36–41 CrossRef CAS
.
- Q. He, Z. Wang, Z. Song and S. Cai, Adv. Mater. Technol., 2019, 19, 1800244 CrossRef
.
- C. Majidi, Adv. Mater. Technol., 2019, 4, 1800477 CrossRef
.
- S. W. Ula, N. A. Traugutt, R. H. Volpe, R. R. Patel, K. Yu and C. M. Yakacki, Liq. Cryst. Rev., 2018, 6, 78–107 CrossRef CAS
.
- M. Fallah-Darrehchi and P. Zahedi, ACS Omega, 2023, 8, 46878–46891 CrossRef CAS
.
- R. Annapooranan and S. Cai, Eng. Fract. Mech., 2022, 269, 108584 CrossRef
.
- H.-F. Lu, Z.-Z. Nie, H. K. Bisoyi, M. Wang, S. Huang, X.-M. Chen, Z.-Y. Liu and H. Yang, Sci. China Mater., 2022, 65, 1679–1686 CrossRef CAS
.
- D. L. Thomsen, P. Keller, J. Naciri, R. Pink, H. Jeon, D. Shenoy and B. R. Ratna, Macromolecules, 2001, 34, 5868–5875 CrossRef CAS
.
- R. A. Gharde, S. A. Mani, S. Lal, S. Khosla and S. K. Tripathi, Mater. Sci. Appl., 2015, 06, 527–532 CAS
.
- W. Fan, Z. Wang and S. Cai, Int. J. Appl. Mech., 2016, 08, 1640001 CrossRef
.
- M. Warner, J. Mech. Phys. Solids, 1999, 47, 1355–1377 CrossRef
.
- J. Tang, J. Li, J. J. Vlassak and Z. Suo, Extreme Mech. Lett., 2017, 10, 24–31 CrossRef
.
- S. Lin, X. Liu, J. Liu, H. Yuk, H.-C. Loh, G. A. Parada, C. Settens, J. Song, A. Masic, G. H. McKinley and X. Zhao, Sci. Adv., 2019, 5, eabc0034 Search PubMed
.
- R. Bai, J. Yang and Z. Suo, Eur. J. Mech. A, 2019, 74, 337–370 CrossRef
.
- W. V. Mars and A. Fatemi, Rubber Chem. Technol., 2004, 77, 391–412 CrossRef CAS
.
- J. Yu, P. K. Liaw and M. Huang, JOM, 1999, 51, 15–18 CrossRef CAS
.
- W. Zhang, J. Hu, J. Tang, Z. Wang, J. Wang, T. Lu and Z. Suo, ACS Macro Lett., 2019, 8, 17–23 CrossRef CAS PubMed
.
- W. Zhang, X. Liu, J. Wang, J. Tang, J. Hu, T. Lu and Z. Suo, Eng. Fract. Mech., 2018, 187, 74–93 CrossRef
.
- C. M. Yakacki, M. Saed, D. P. Nair, T. Gong, S. M. Reed and C. N. Bowman, RSC Adv., 2015, 5, 18997–19001 RSC
.
- R. Annapooranan, Y. Wang and S. Cai, ACS Appl. Mater. Interfaces, 2022, 14, 2006–2014 CrossRef CAS PubMed
.
- R. S. Rivlin and A. G. Thomas, J. Polym. Sci., 1953, 10, 291–318 CrossRef CAS
.
- Z. Wang, A. El Hajj Chehade, S. Govindjee and T. D. Nguyen, J. Mech. Phys. Solids, 2022, 163, 104829 CrossRef CAS
.
- A. Azoug, V. Vasconcellos, J. Dooling, M. Saed, C. M. Yakacki and T. D. Nguyen, Polymer, 2016, 98, 165–171 CrossRef CAS
.
- C. Chen, Z. Wang and Z. Suo, Extreme Mech. Lett., 2017, 10, 50–57 CrossRef
.
- R. Long, C.-Y. Hui, J. P. Gong and E. Bouchbinder, Ann. Rev., 2021, 12, 71–94 Search PubMed
.
- Y. Zhou, J. Hu, P. Zhao, W. Zhang, Z. Suo and T. Lu, J. Mech. Phys. Solids, 2021, 153, 104483 CrossRef CAS
.
- S. Y. Zheng, H. C. Yu, C. Yang, W. Hong, F. Zhu, J. Qian, Z. L. Wu and Q. Zheng, Mater. Today Phys., 2020, 13, 100202 CrossRef
.
- Y. Zheng, R. Kiyama, T. Matsuda, K. Cui, X. Li, W. Cui, Y. Guo, T. Nakajima, T. Kurokawa and J. P. Gong, Chem. Mater., 2021, 33, 3321–3334 CrossRef
.
- J. Kang, D. Son, G. N. Wang, Y. Liu, J. Lopez, Y. Kim, J. Y. Oh, T. Katsumata, J. Mun, Y. Lee, L. Jin, J. B. H. Tok and Z. Bao, Adv. Mater., 2018, 30, 1706846 CrossRef PubMed
.
- J. Kim, G. Zhang, M. Shi and Z. Suo, Science, 2021, 374, 212–216 CrossRef CAS PubMed
.
- M. Li, L. Chen, Y. Li, X. Dai, Z. Jin, Y. Zhang, W. Feng, L.-T. Yan, Y. Cao and C. Wang, Nat. Commun., 2022, 13, 2279 CrossRef CAS
.
- W. Li, L. Li, S. Zheng, Z. Liu, X. Zou, Z. Sun, J. Guo and F. Yan, Adv. Mater., 2022, 34, 2203049 CrossRef CAS
.
- L. Zeng, F. Liu, Q. Yu, C. Jin, J. Yang, Z. Suo and J. Tang, Sci. Adv., 2023, 9, ade7375 CrossRef PubMed
.
- R. E. Shadwick, A. P. Russell and R. F. Lauff, Philos. Trans. R. Soc., B, 1992, 337, 419–428 CrossRef CAS
.
- K. Bircher, M. Zündel, M. Pensalfini, A. E. Ehret and E. Mazza, Nat. Commun., 2019, 10, 792 CrossRef CAS PubMed
.
| This journal is © The Royal Society of Chemistry 2025 |

