
 Open Access Article
 This Open Access Article is licensed under a
 Creative Commons Attribution 3.0 Unported Licence
Liquid slide electrification: advances and open questions
Aaron D.
Ratschow
 a,
Hans-Jürgen
Butt
*b,
Steffen
Hardt
a and
Stefan A. L.
Weber
c
a,
Hans-Jürgen
Butt
*b,
Steffen
Hardt
a and
Stefan A. L.
Weber
c
aInstitute for Nano- and Microfluidics, TU Darmstadt, Peter-Grünberg-Str. 10, 64289 Darmstadt, Germany
bMax Planck Institute for Polymer Research, Ackermannweg 10, 55128 Mainz, Germany. E-mail: butt@mpip-mainz.mpg.de
cInstitute for Photovoltaics, University of Stuttgart, Pfaffenwaldring 47, 70569 Stuttgart, Germany
First published on 30th January 2025
Abstract
This review is about drops of a liquid with high dielectric permittivity that slide over a solid surface with high electrical resistivity. A typical situation is a water drop sliding down a tilted hydrophobic plate. It has been realized recently that such drops spontaneously acquire a charge. The opposite charge is deposited behind the drop as a surface charge. Generated electric potentials in the drops can easily reach 1 kV and more. This phenomenon has been termed slide or contact electrification. It is the soft matter analog to triboelectrification, which occurs in solid friction. Slide electrification turned out to be ubiquitous in everyday life and technical applications. It will change our common knowledge of dynamic wetting. Studying slide electrification is complex because the outcome of a wetting experiment depends on the history. For this reason, a series of drops, rather than single drops, are analyzed to gain quantitative understanding. Here, we review the fundamental understanding of slide electrification and its limits. We describe consequences, e.g. on drop motion and advancing and receding contact angles and we address open questions.
Water drops sliding over insulating, hydrophobic surfaces spontaneously acquire an electric charge.1–3 As a result, the solid surfaces become oppositely charged.4 Usually, the surface acquires a negative surface charge and the drop becomes positively charged. Similarly, when withdrawing an insulator from a water pool, the solid object is charged, leaving an opposite charge in the water pool.5–8 This charge separation at receding contact lines is called slide, dewetting or contact electrification.1,3 It is the wet analog to triboelectricity between solids.9,10 Electric charging has been observed in micropipetting,11,12 spraying,13,14 and bouncing of drops.15,16 Recent studies suggest that the electric potentials of sliding drops are substantial and can reach a few kV.17–19
The phenomenon has been studied for a number of reasons. On the fundamental side, spontaneous charge separation influences the motion of drops20 and causes contact-angle hysteresis.18 In extreme cases, drops stop moving down tilted plates. With respect to applications, slide electrification has been used to harvest electrical energy.21–25 In contrast to conventional generators, slide electrification-based generators do not require moving parts and can be miniaturized for uses in cases like self-powered sensors.26,27 The total amount of available energy gain is, however, limited and the efficiency is still low.28,29 Slide electrification can also be used to manipulate drop motion; water drops on superhydrophobic surfaces are dragged towards their countercharges.18 They could even be made to climb against gravity by imprinting charge gradients onto superhydrophobic surfaces by previous drops.30
Here, we provide an overview of the physics behind slide electrification in sessile, moving droplets. We discuss experimental conditions that influence the polarity and magnitude of charge separation as well as the consequences of slide electrification. The aim is to enable estimations of how relevant spontaneous charging is with respect to a specific effect. We point out open questions in the field of slide electrification.
1 Charge separation
Charges are separated when a liquid dewets a surface at a moving three-phase contact line. The common model to explain slide electrification starts with the electric double layer, which usually forms spontaneously. The surface charge density at the solid–liquid interface, σSL, caused, e.g., by spontaneous adsorption of ions, is compensated by countercharges in a more loosely bound or diffuse layer of countercharges. Together they are called the electric double layer. Current theories describing slide electrification3,19,31 and experimental evidence32 suggest that the receding three-phase contact line partially strips off these countercharges, leaving behind a certain amount of uncompensated surface charge.1,4 An alternative suggestion is that the deposited charges are primarily electrons.33,34To move towards a quantitative understanding of slide electrification, it is instructive to distinguish two effects: first, the formation of the electric double layer, its magnitude and polarity at the solid–liquid interface and a possible change near the three-phase contact line. Second, the charge separation at the rear contact line between the wetted and the de-wetted surface.
1.1 The electric double layer
Most solid surfaces in contact with water are electrically charged. Charging is due to the dissociation of surface groups, specific adsorption of ions from the liquid or, on longer timescales, partial dissolution of the surface. The surface charge electrostatically attracts counterions from the liquid into a diffuse layer close to the surface. The characteristic thickness of the diffuse layer is called the Debye length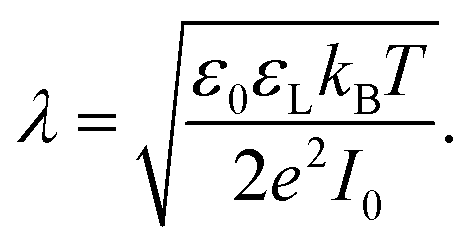 | (1) |
Here, ε0 is the vacuum permittivity, εL is the liquid's dielectric constant, kB is the Boltzmann constant, T is the absolute temperature, and e is the elementary charge. The Debye length λ describes the characteristic thickness of the diffuse layer over an extended flat plate. High salt concentrations, measured using the ionic strength 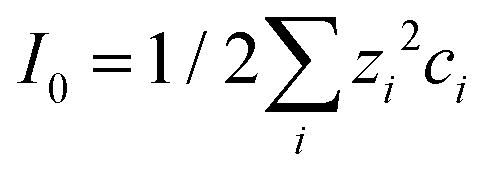 , decrease the Debye length. Here, the sum is over all ionic species, ci is the bulk concentration of species i with valence zi.
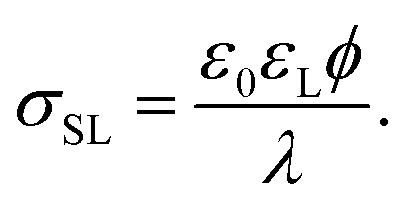
The surface charge at the solid surface within the electric double layer is generally given by Grahame's equation. For low surface potentials ϕ we can use its linearized form,35
 | (2) |
Near the three-phase contact line, the effective thickness of the diffuse layer λeff can deviate from the Debye length of the bulk liquid.
1.2 Charge separation at the moving contact line
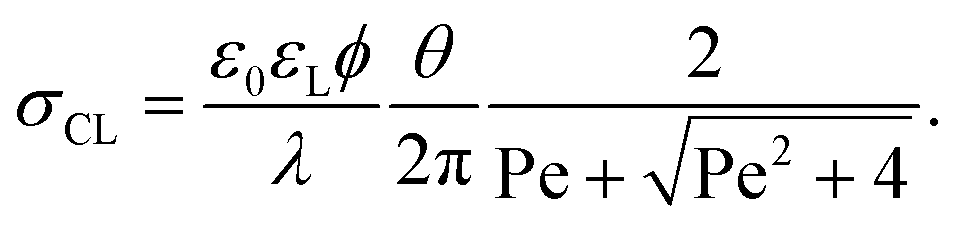
The mechanism of how charges are separated at the receding contact line is still debated. The most commonly accepted hypothesis is the following: when a surface is dewetted, some of the chemically or physically bound surface charges from the electric double layer remain on the surface, while the countercharge from the diffuse layer remains in the liquid (Fig. 1a). Near the receding contact line, the layer of diffuse charge is warped by the gas–liquid interface.36 This deformation can be viewed as a change in the effective screening length. Only for a receding contact angle of θ = 90°, the screening length is identical to that far away from the contact line. For θ < 90° it is increased because the counterions are forced away from the solid–liquid interface, Fig. 1b. For θ > 90° the screening length is smaller than in the bulk. The effect is purely electrostatic and even present for non-moving contact lines. An additional effect is expected for sliding drops. Sliding of the liquid along the surface induces a recirculation flow that points upward near the receding contact line. Advective transport can drive counterions away from the solid surface and increase the effective screening length, Fig. 1c. The strength of the advective transport is measured using the Péclet number, defined as Pe = Uλ/D, where U is the receding contact line velocity and D is the ion diffusivity (assumed to be identical for all species). Contact angle and flow effects modify the effective screening length at the receding contact line to31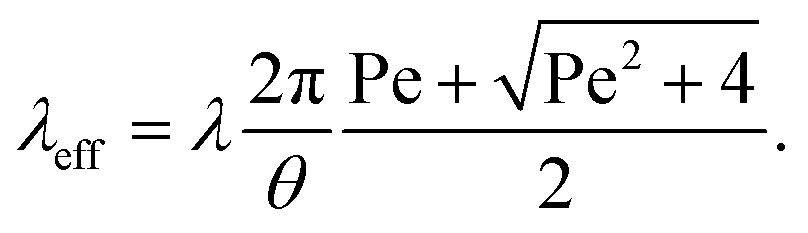 | (3) |
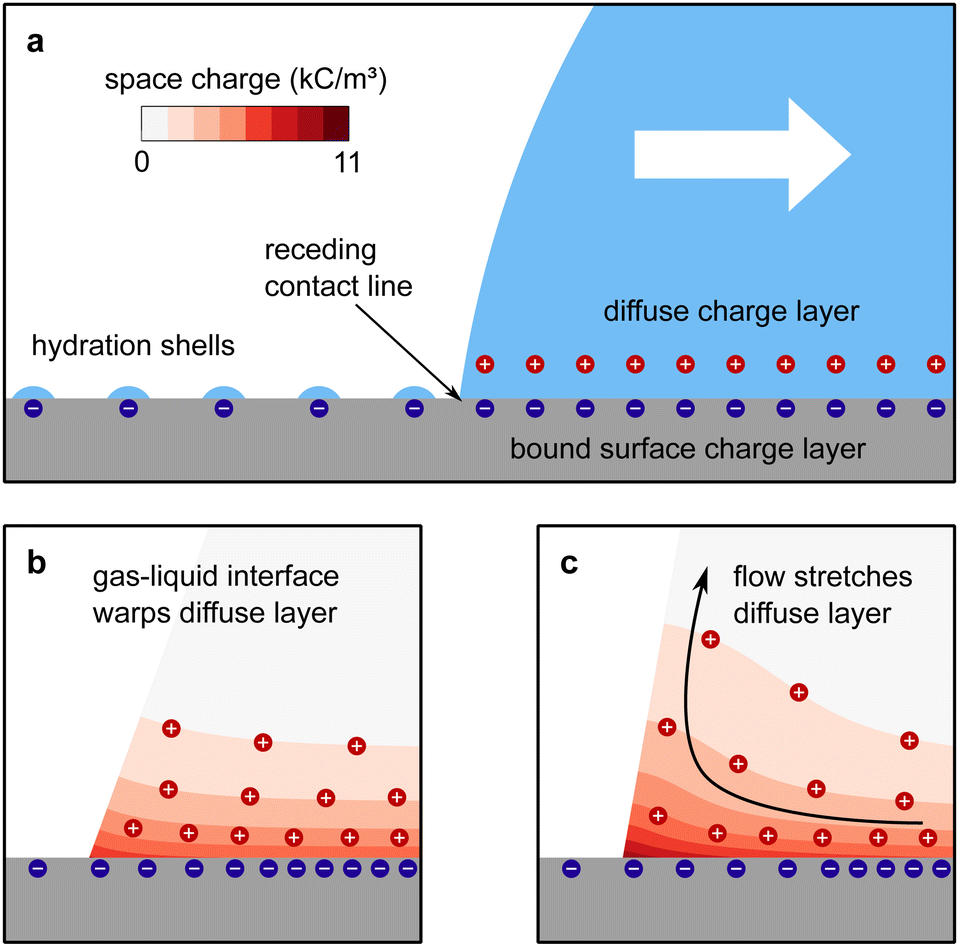 | ||
| Fig. 1 Charge separation process. (a) A part of the bound surface charges from the electric double layer remains on the dewetted surface, possibly with hydration shells. (b) For contact angles <90°, the gas–liquid interface warps the diffuse layer and increases the effective screening length. (c) At high velocities, Pe > 1, the upward flow expands the diffuse layer, increases the effective screening length and decreases the surface charge density near the contact line. Data reproduced from ref. 31. | ||
Here, θ should be inserted in rad. It refers to the instantaneous dynamic receding contact angle on a smooth substrate. Rough substrates are discussed in Section 4.1.2. For high Péclet numbers Pe ≫ 1, λeff increases proportionally to Pe. For a given surface potential ϕ, the surface charge in the electric double layer at the contact line just before dewetting is31
 | (4) |
The contact angle and flow effects decrease the surface charge in the liquid directly at the contact line. An unsolved key question is: how much of the surface charge σCL is transferred from the solid–liquid interface to the solid surface right behind the contact line? Experimental observations suggest that during the dewetting, the surface charge that leaves the drop, σout, is reduced by a factor σout/σCL ≈ 0.5.31
Charges are separated although the final state is energetically unfavorable. The electrostatic self-energy of an ion of radius a (typically a ≈ 0.12 nm) at the interface between two dielectric media with dielectric constants εS and εL is Ui = e2/[4πε0(εS + εL)a]. With the dielectric constants εS = 5 for the solid and εL = 80 for water, self-charging requires an energy of 5kBT. If water is replaced by air with permittivity εG = 1, the corresponding energy is 78kBT. Thermal energy is sufficient for charge separation in water but not in air.
To explain why a significant number of surface charges are transferred from the wet to the dry region, even though the above estimate suggests that this is energetically unfavorable, we assume that the surface charges that stay on the dewetted surface retain hydration shells.3,8,31 Near the contact line, humidity is still close to saturation. For this reason, an adsorbed water layer will remain on the surface. These high energies suggest that charge separation at the receding contact line is a non-equilibrium process.
According to the idea that the surface charge σout is a leftover from the electric double layer, it is reasonable to describe the overall charge separation process with a fraction α of the charges at the solid–liquid interface, which remains on the surface:
| σout = ασSL. | (5) |
The effective charge transfer coefficient α (0 ≤ α ≤ 1) summarizes the effects of the contact angle, Péclet number and effects on the atomistic scale, such as hydration shells.
2 Charge accumulation in moving drops
2.1 Single drops
Charge separation at receding contact lines is not unique to drops. It occurs in many dynamic wetting contexts,8,11–13,40 for example when withdrawing a plate from a liquid pool. What sets drops apart is that they are electrically isolated volumes of liquid. They can accumulate a defined charge Q. How does the drop charge evolve, when a drop slides over a surface?As a drop slides on a substrate, it deposits surface charges and acquires an opposite drop charge Q that increases and eventually saturates with the slide distance. The change in Q due to charge separation along the sliding path x follows3,19
| dQ(x) = −ασSL(x)wdx. | (6) |
Here, w is the drop width and α is the effective charge transfer coefficient, as introduced in eqn (5).
As the drop charges and deposits surface charges,20 it develops a drop potential Ud. Potential and charge are linked via the drop capacitance Cd, according to Ud = Q/Cd. In many experiments, there is a metallic electrode underneath the dielectric substrate of thickness d. Neglecting rim effects (d ≪ w) and assuming λ ≪ d, the drop capacitance is
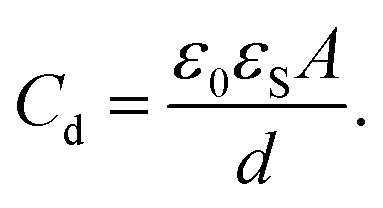 | (7) |
Here, A is the contact area of the drop and εS is the dielectric constant of the substrate.
When the drop is charged, an electric field Ud/d exists in the dielectric substrate. Grahame's equation needs to be replaced by the Gauss law at the solid–liquid interface. Assuming moderate surface potentials, ϕ < kBT/e, it reads19,31
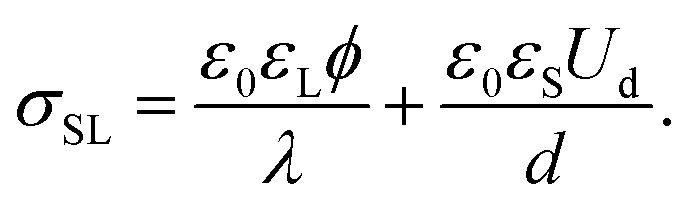 | (8) |
Experiments suggest that the surface potential ϕ does not significantly vary with the drop voltage Ud.19Eqn (6)–(8) then predict an exponential charging on a saturation sliding length scale
 | (9) |
Here, we approximated A ≈ πw2/4. Experimentally, Lsat is usually of the order of 1 cm.3,19,32
The drop charge and drop voltage saturate when dQ = 0. Following eqn (8), the saturation potential of the drop is19
 | (10) |
With typical surface potentials ϕ ≈ −40 mV and substrate thicknesses d ≈ 1 mm, drops saturate at ≈1 kV.17–19 Notably, the saturation charge, Qmax = CdUmax = Aε0εLϕ/λ only depends on the liquid and the surface potential.
Fig. 2 shows how the drop charge saturates on the length scale Lsat as the deposited surface charge decays. While the drop charge Q (Fig. 2a) and surface charge density σout (Fig. 2c) are essentially independent of the substrate thickness d, the drop potential UD increases on thicker substrates (Fig. 2b).
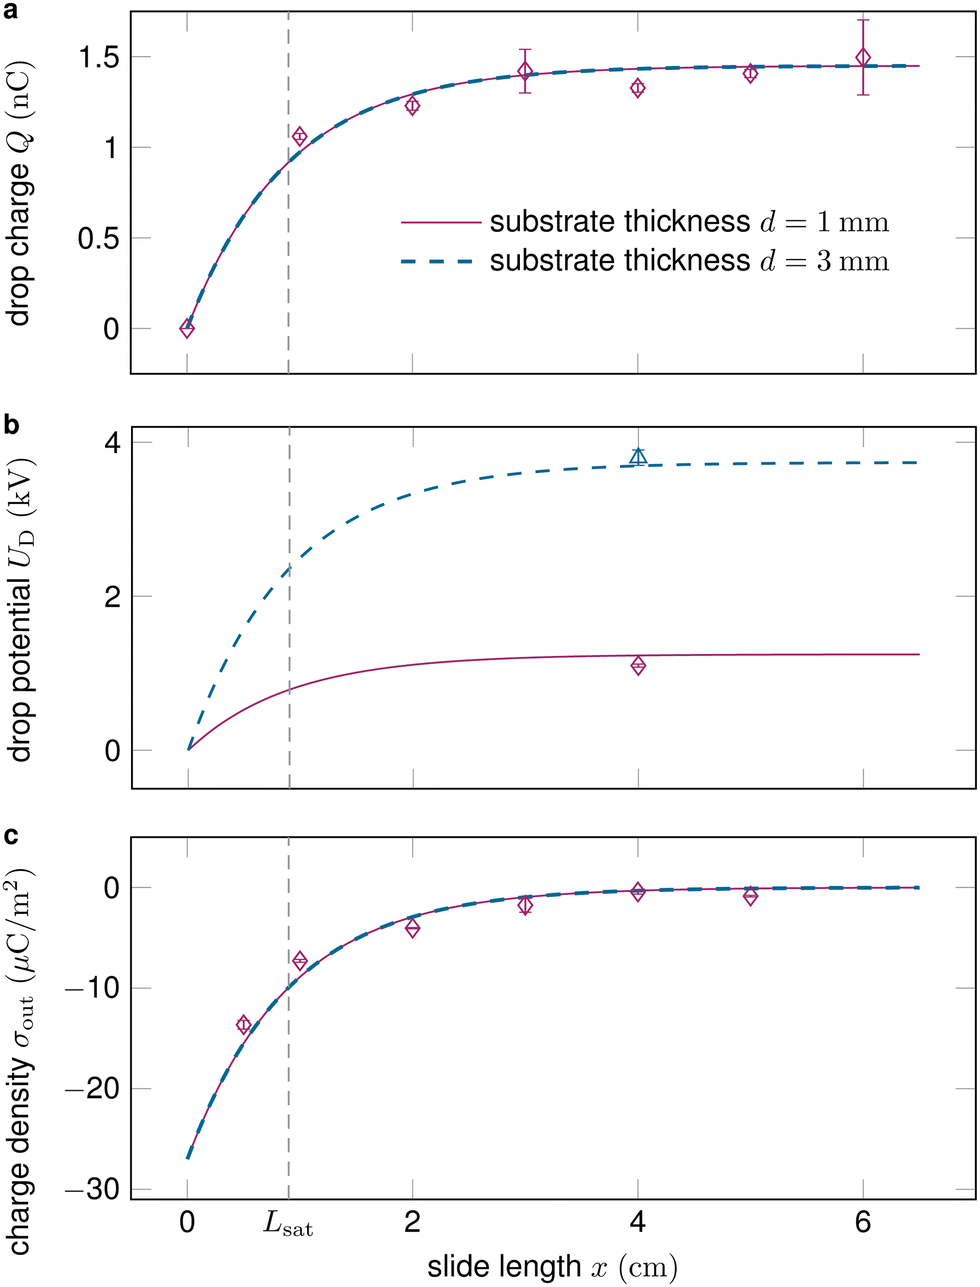 | ||
| Fig. 2 (a) The drop charge along the slide length typically saturates after a couple of centimeters and is essentially independent of the substrate thickness. (b) Drops sliding on thicker substrates obtain substantially higher voltages, see eqn (10). (c) The surface charge density after the drop σout decreases along the slide path and vanishes at saturation. Data reproduced from ref. 19, 41. | ||
2.2 Charge neutralization
How long do surface charges remain on a surface? Above, we assumed that the substrate is insulating. Real materials have a finite resistivity ρS (in Ω m or V m A−1). Consequently, a charged drop will eventually discharge, or the surface charges left behind by a drop will eventually disappear. For a substrate of constant thickness with a back electrode, the characteristic discharge time is τ = RC = ε0εSρS. It is independent of the substrate thickness, assuming a homogeneous substrate material.For many materials, the characteristic discharge time is much longer than the sliding time of a drop and sometimes even longer than typical evaporation times. Soda lime glass discharges within seconds. On quartz glass, the charges are stable over days.32 We give the resistivity and dielectric constant of typical materials in Table 1.
| Material | ε S | ρ e (Ω m) | E bt (MV m−1) |
|---|---|---|---|
| Polyethylene (PE) | 2.2–2.4 | 1013–1016 | 19–160 |
| Polyethylene terephthalate (PET) | 3.0–3.4 | 1014–1016 | 17–25 |
| Polymethylmethacrylate (PMMA) | 3.8–4.2 | 2 × 10¹³–1015 | 15–60 |
| Polypropylene (PP) | 2.2–2.4 | 1013–1015 | 30–200 |
| Polystyrene (PS) | 2.3–2.5 | 1015–1016 | 20–200 |
| Polyvinyl chloride (PVC) | 3.0–8.0 | 1012–1014 | 12–72 |
| Nylon | 3.5–5.0 | 1010–1015 | 18–30 |
| Polytetrafluoroethylene (PTFE) | 2.0–2.1 | 1016–1018 | 20–285 |
| Polycarbonate (PC) | 2.7–3.2 | 1014–1015 | 12–67 |
| Polydimethylsiloxane (PDMS) | 2.3–2.7 | 1013–1016 | 22–250 |
| Silicone oil | 2.3–2.8 | 1012–1013 | 10–15 |
| Quartz (SiO2) | 4.5 | 1014–1018 | 25–100 |
| Silicon dioxide amorphous | 3.8–3.9 | 1016–1018 | 400–670 |
| Borosilicate glass | 4.1–5.1 | 1015–1017 | 20–40 |
In addition to neutralization through the substrate, surface charges may be discharged by ions in air or a possible conductivity of the surface. Ions in air originate, e.g., from cosmic radiation or radioactive sources.42 Humid air may also contain H3O+ and OH− ions.9 Under atmospheric conditions, discharge through ions in air is generally negligible. Only at a humidity above 80%, drop charging tends to decrease,43 indicating an increase in surface- or air conductivity. Even when increasing the ion concentration with ionizing air blowers, neutralization through air requires several seconds.32
2.3 Drop sequences
In many practical applications, multiple drops successively slide down the same surface. In addition, measuring the charge of a series of drops has turned out to be a good way to characterize drop charging.3 Unless the time between drops Δt is much longer than the characteristic discharge time of the surface τ, a drop will encounter charges left by a previous drop σin. The drop absorbs these charges at its advancing contact line. Then, it deposits new surface charges σout at its receding contact line, see Section 1. During the time between drops, the surface charges partially dissipate, so that3,19σin,n = σout,n−1![[thin space (1/6-em)]](https://www.rsc.org/images/entities/char_2009.gif) exp(−Δt/τ), exp(−Δt/τ), | (11) |
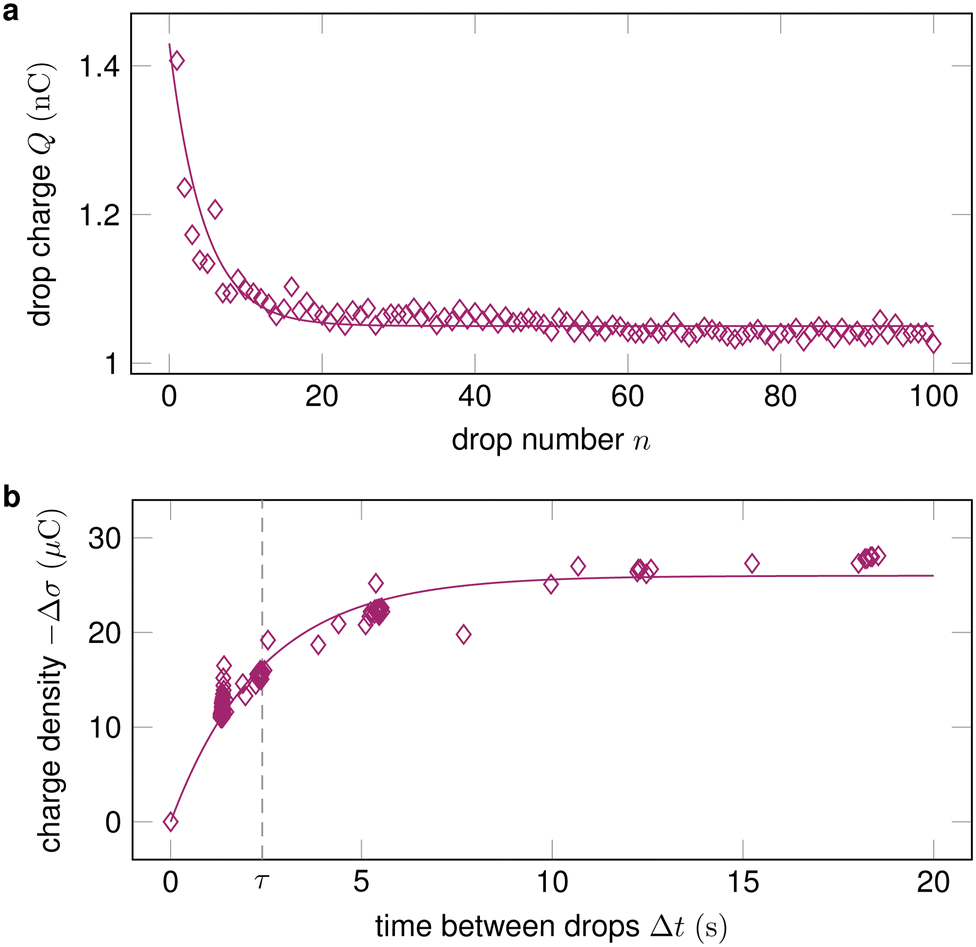 | ||
| Fig. 3 (a) The drop charge at a fixed position x along the slide path decreases and then saturates with increasing drop number. Data reproduced from ref. 19; (b) By varying the time between drops Δt and measuring the change in surface charge density Δσ, the characteristic discharge time τ can be quantified. Data reproduced from ref. 32. | ||
3 Consequences of slide electrification
Important consequences of slide electrification are retardation of drop sliding, decreasing advancing and receding contact angles and possible electric breakdown (Fig. 4a). | ||
| Fig. 4 (a) A sliding drop affected by electrostatic contact angle hysteresis, electrowetting, and electric breakdown. (b) and (c) Details of the electric fields causing Maxwell stress on the drop in the case of electrostatic contact angle hysteresis (b) and electrowetting (c). | ||
For the subsequent analysis, we consider a planar substrate of thickness d, which could be a polymer, glass, or SiO2. This substrate is naturally hydrophobic (e.g., polystyrene or polytetrafluoroethylene, PTFE) or is coated with a layer (e.g., with fluorinated silane) to adjust the contact angles. We assume that such a coating has negligible thickness. At the bottom side, the substrate is coated with a metal. The metal is grounded.
3.1 Contact angle hysteresis
Static contact angle hysteresis is the difference between the static advancing θa and receding contact angles θr of a drop, CAH = θa − θr.44,45 On a tilted surface, it determines whether a drop sticks to or rolls off a surface. The net capillary force acting on a drop is given by the Kawasaki–Furmidge equation46–49| F = wγLk(cosθr − cosθa). | (12) |
Here, γL is the liquid surface tension and k is a dimensionless geometric factor ≈1. A drop slides off a tilted surface once the gravitational force, mgsinα, exceeds the capillary force (m is the mass of drop, g the gravitational acceleration, and α is the tilt angle). Contact angle hysteresis has been investigated for decades and is traced back to various factors, including heterogeneity,50–52 roughness,53–55 surface defects,56 surface deformation,57 molecular kinetics at the contact line,58,59 and surface adaptation.60
Recently, it was revealed that the electrostatic interaction between a drop and deposited surface charges from slide electrification causes a substantial force on sliding drops.20 This mainly manifests in the deformation of the drop. It decreases the contact angle at the receding contact line, where charges are deposited. The advancing contact angle only decreases if the surface at the advancing contact line carries charge deposited by previous drops.18 Thus, slide electrification causes a fundamental contribution to contact-angle hysteresis. Microscopically, Maxwell stress near the contact line causes the deformation (Fig. 4b). Macroscopically, the effect can be attributed to an effective increase in the solid surface energy caused by the mutual repulsion of the charges on the surface. Additionally, the surface charges electrostatically interact with countercharges in the receding liquid. Thus, the energy required to dewet the surface increases compared to a case without charge separation. The change in solid surface energy at the receding side of the drop scales like18
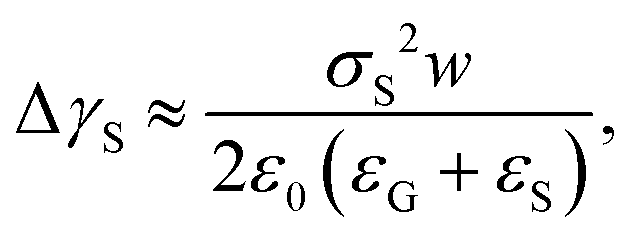 | (13) |
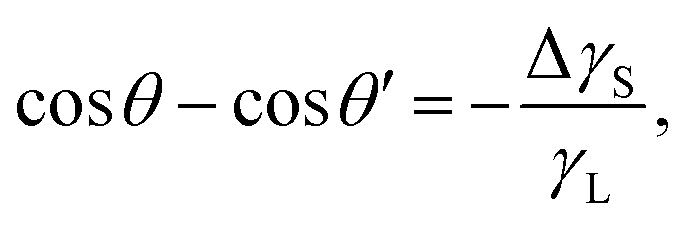 | (14) |
Long-range electrostatic interactions between the drop and the surface charge can further slow down drop motion.20
Because charges separate at receding contact lines, contact angles reduce after the first wetting–dewetting cycle61 and can only be recovered after times much longer than the surface discharge time τ, when the surface charge has been neutralized. The interaction of drops with deposited surface charges can even stop moving drops.20 Drops can spontaneously move along surface charge gradients, even against gravity.30 Consequently, subsequent sliding drops tend to align with the trajectories of previous drops.
3.2 Electrowetting
Electrowetting on dielectric (EWOD) is the modification of the wetting properties of a surface with a dielectric coating by an electric field. A drop is placed on a dielectric layer covering a flat electrode. When a voltage ΔU is applied between the drop and the electrode, the contact angle decreases. The effect is again caused by the electrostatic Maxwell stress on the liquid surface (Fig. 4c). It can be modelled as a decrease in the effective energy, or interfacial tension, of the solid–liquid interface caused by the diffuse layer charges. The decrease in surface energy is calculated as follows62 | (15) |
This assumes 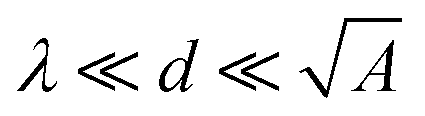 , where A is the wetted area. In the case of spontaneous charging by slide electrification, the applied potential, ΔU, has to be replaced by the drop potential, Ud. The Young–Lippmann equation gives the contact angle change,63,64
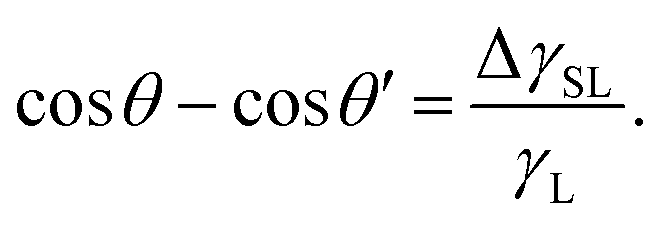 | (16) |
Again, θ and θ′ are the contact angles without and with an applied voltage.
EWOD applications typically use substrate thicknesses around 1–10 μm and voltages of ≈100 V.61 In slide electrification, substrate thicknesses are of the order of 1 mm and drops acquire kilovolt potentials. These conditions are sufficient for electrowetting and indeed, contact angle reductions in aqueous drops of the order of 10–20° have been reported.18 Electrowetting requires a potential difference between the drop and the electrode beneath the substrate. It does not occur when the liquid is grounded or connected to a large reservoir.
Contact angle reduction by electrowetting is symmetric around the whole contact line and affects receding and advancing contact angles. It increases the wetted area but otherwise has little effect on drop friction or contact angle hysteresis.
3.3 Electric breakdown
When a drop is fully charged and has reached saturation, the electric field strength in the dielectric substrate is Umax/d = −εLϕ/(εSλ) (eqn (10)). It can be quite high. For a water drop with 1 mM salt (λ = 10 nm) on quartz and assuming a surface potential ϕ = −40 mV, the field strength reaches 70 V μm−1. This value is lower than, e.g., the dielectric strength of amorphous SiO2, which is Ebt = 470–1000 V μm−1, and breakdown is unlikely. Many other substrate materials, however, may show a breakdown, see Table 1.Moreover, the maximum electric field strength increases with decreasing Debye length. In this way, increasing the salt concentration can lead to an increase of the electric field across the substrate. We can calculate the critical Debye length, λc, where breakdown will likely set in,
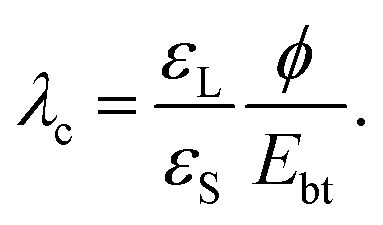 | (17) |
This assumes that the surface potential ϕ is roughly independent of the Debye length. For many materials electric breakdown and possible degradation of the sample is a realistic scenario. The higher the salt concentration, the higher the chance for electric breakdown when drops slide on the surface. Damage due to electric breakdown commonly occurs in semiconductor manufacturing during the rinsing of wafers.65–67 In nanoelectronics, the nC charges of sliding drops can further cause damage through resistive heating.
In Table 1 we report εS, ρ, and Ebt, measured for thick samples. For thin films, these values generally depend on the thickness. Zhao & Liu68 recommend to describe the dielectric strength empirically by Ebt = E1/da. Here, the exponent 0 < a ≤ 1 depends on the time scale, temperature, electric field uniformity and thickness.
3.4 Gas discharge and breakup of drops
The liquid close to the contact line can be represented as a wedge.69 For the model problem of a wedge formed by an isopotential and a charged surface, the electric field has a singularity at the sharp corner representing the contact line.70 In reality, there must exist a mechanism cutting off the singularity.18 Still, large electric field strengths are expected close to the contact line that could exceed the threshold field strength for gas discharges. Corresponding discharges near the contact line of sessile drops have been observed in high electric fields,71 and in electrowetting.72 More than 300 years ago, J. Picard and J. I. Bernoulli reported that light is emitted from moving mercury. The generated electric field is strong enough to cause glow discharge along the contact line.73 To the best of our knowledge, this has not yet been reported in sliding aqueous drops. However, the electric field configurations present in such experiments suggest that gas discharges may also occur there.Charges in a drop repel each other and can even overcome the surface tension. The drop then disintegrates and ejects smaller charged droplets. The maximum charge that a spherical drop of radius R in a vacuum can carry before becoming unstable is given by 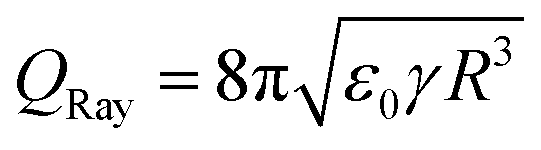 , which is known as the Rayleigh limit.74 For example, for water and drops of 2 mm radius this limiting drop charge is 1.8 nC. A similar instability can also be expected for drops on surfaces that have acquired a large charge, but is yet to be confirmed in slide electrification experiments. In electrowetting experiments, highly charged drops have been observed to disintegrate and release small drops at their contact line.61,62
4 Influence of drop and substrate properties
4.1 Substrate
The most common explanation for interfacial charges is an enrichment of hydroxyl ions at the interface.2,76 Alternative hypotheses see the origin of interfacial charge in the asymmetry of the hydrogen-bond network,77 adsorption of bicarbonate/carbonate ions78,79 or the transfer of electrons from water to the polymer substrate.80
Generally, fluorinated surfaces such as Teflon or glass coated with fluorinated silanes lead to the highest separation of charges. It is not yet clear if this is only due to their high contact angles or if the especially high electronegativity of fluorine plays an additional role. Charge separation also happens on polymers such as polyamides, polyethylene, poly(vinyl chloride), polydimethylsiloxane (PDMS, silicone), polyethylene terephthalate (PET), or poly(methyl methacrylate).8,20,22,32,81 Furthermore, thin organic layers such as monolayers of octadecyl-trichlorosilane (OTS) on glass or SiO2 are negatively charged by sliding water drops.37 Such thin layers can be penetrated by water molecules. Thus, the specific chemical composition of the substrate influences charging.82 Dissociable groups on the surface also have an influence. For example, glass coated with amine-terminated silanes leads to negatively charged drops and a positive surface charge.83
A special case occurs for superhydrophobic surfaces. When hydrophobic surfaces are sufficiently rough or even microstructured, a wetting transition from the Wenzel to the Cassie–Baxter state84 occurs. This effect decreases the solid–liquid contact area, which reduces charging due to slide electrification.86–88
On very thin substrates with a thickness d of a few nm or a few 10 nm with a conductive material underneath, charging is usually suppressed. It seems that inhomogeneities in such thin layers lead to fast discharging of drops. Furthermore, the electric field emanating from charges that are more than ≈d away from the contact line is screened by the underlying grounded metal. For substrates thicker than 10 nm, the substrate material's RC-time, τ = ε0εSρS, dictates the longevity of drop and surface charges, as discussed in Section 2.2. On substrates with low dielectric strength, see Table 1, electric breakdown can prevent charge saturation.
The substrate's dielectric constant has a big influence on slide electrification. Although εS does not influence charge separation and accumulation so much, it changes the drop potential and drop motion. The saturation potential decreases ∝ εS−1 due to an increase in drop capacitance. As a result, the electric field strength in the substrate decreases with increasing dielectric permittivity. On substrates with high dielectric permittivity, electrostatic contact angle hysteresis also decreases. The higher permittivity decreases the effective field emitted by the surface charges (Fig. 4c), and the effective increase in interfacial tension of the solid, eqn (13).
The substrate thickness influences the saturation potential (eqn (10)): Umax increases linearly with the substrate thickness, according to eqn (7). Due to the long range of electrostatic forces, conducting parts of an experimental setup which are millimeters away can also influence the drop potential and drop movement.
Substrate treatment and preparation can play a substantial role. This is particularly true for glass or SiO2 coated with monolayers. If, e.g., plasma cleaning is used in a specific step, long-term stable charge can be deposited.89 This effect is most likely caused by subsurface deposition of long-living charges during the plasma process.
4.2 Liquid
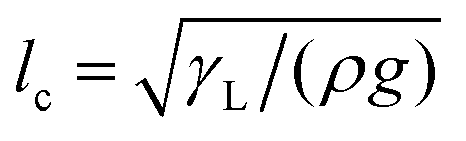 . Here, V is the drop volume, and ρ is the liquid's mass density. For V1/3 < lc, the drop takes the shape of roughly a spherical cap on a homogeneous surface. By contrast, for V1/3 ≫ lc, it appears as a liquid puddle.
Larger drops tend to experience increased electrostatic contact angle hysteresis18 and stronger electrostatic forces, hindering their motion. The increase in effective solid interfacial tension is proportional to the drop width w ∝ V1/3 according to eqn (13). This trend has also been observed experimentally.18 The corresponding additional electrostatic force increases quadratically with the drop width, as predicted by eqn (12) and (13). In contrast, the gravitational force on a sliding drop is proportional to V.
Even though smaller drops experience less contact angle hysteresis, they have an increased tendency to stick due to electrostatic effects. Their gravitational force ∝V is smaller than the electrostatic force ∝V2/3 hindering their movement. Smaller drops also saturate earlier, as the saturation sliding length, eqn (9), is proportional to w. At saturation, they carry substantially less energy than larger drops since the drop capacitance, eqn (7), is proportional to the drop contact area A ≈ πw2.
Charge separation is not restricted to liquid drops. It is also observed when plates are pulled out from a liquid pool.8,90 Electrostatic forces substantially slow down the breakup of liquid bridges on surfaces.40 They also slow down the rebound of impacting water drops on insulating surfaces.16 This suggests that this phenomenon occurs for a broad variety of liquid configurations on surfaces.
Generally, experiments with varying pH values should be performed at a constant ionic strength. This prevents additional effects due to a change in the Debye length.
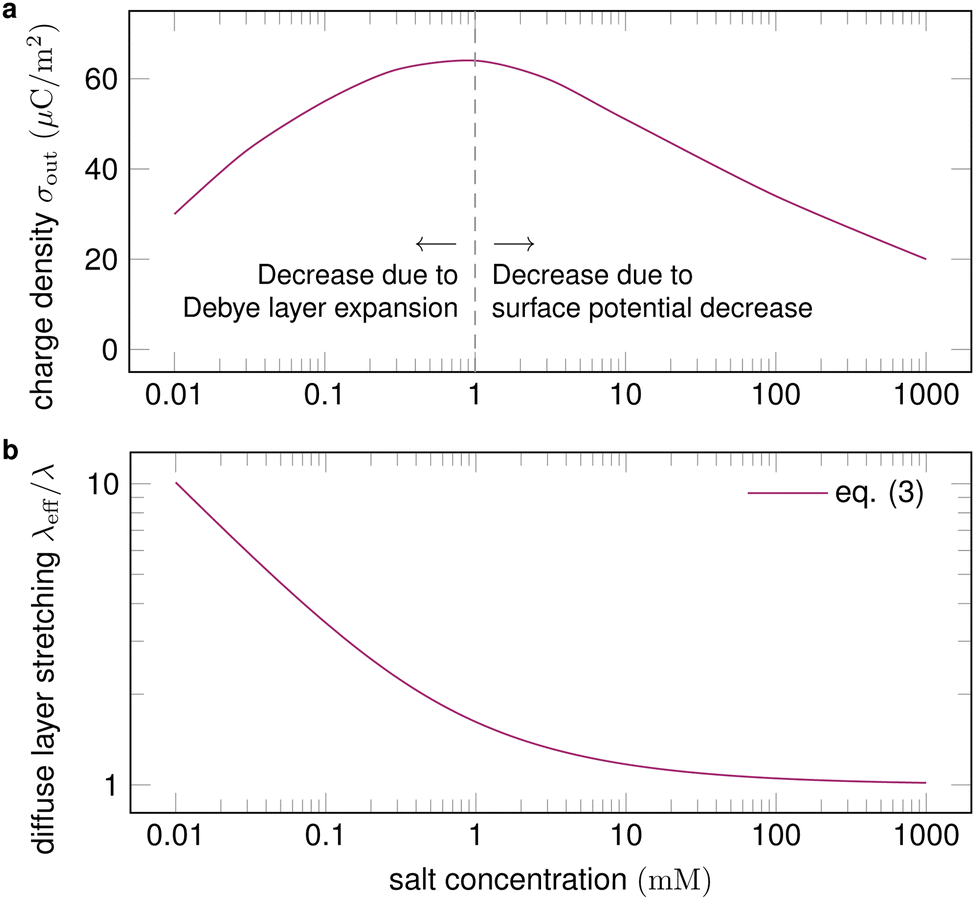 | ||
| Fig. 5 (a) Surface charge density as a function of salt concentration (exemplary values), with proposed physical mechanisms for the trends. Charge separation first increases with salt concentration and then decreases. (b) For a given velocity of the order of 10 cm s−1, the expansion of the diffuse layer is strongest for low salt concentrations and diminishes at high concentrations. Trend line calculated with eqn (3). | ||
A higher salt concentration decreases the Debye length according to λ ∝ I0−1/2, eqn (1). The Debye length determines how much the fluid flow can expand the diffuse layer (Fig. 1c). At a given flow velocity, thinner diffuse layers expand less. Thus, adding salt first decreases and then suppresses the expansion of the Debye layer, measured by the Péclet number, as illustrated in Fig. 5b. The expansion decreases charge separation. This explains the increase of charge separation up to 0.01–1 mM salt.
Variation of the salt concentration also brings along a surface potential variation,96 which makes the interpretation of corresponding experiments difficult. Indeed, the experimental data reported in ref. 99 do not show any clear trend of how charge separation depends on the salt concentration at high concentrations.
The relationship between the surface potential and the salt concentration is an open question in the field of physical chemistry. Very high salt concentrations of the order of 1 M lead to reduced charging of the solid–liquid interface.96,102 Correspondingly, little charging of drops is observed at salt concentrations above ≈0.4 M.18,43,97
The specific salt in the electrolyte influences slide electrification.18 This is most likely due to specific adsorption of ions at the solid–liquid interface. Experiments show that the influence of the specific salt is moderate at low concentrations ≈0.01 mM and increases with the salt concentration.99 Yet, no general trend can be deduced.
Often, dewetting processes get slowed down with increasing viscosity. Eqn (3) predicts that the stretching of the diffuse layer increases with Pe, which means that the surface charge near the contact line σCL decreases less at higher viscosities.
A special case exists when the counterion cloud mainly contains protons/hydronium ions. Then, the diffusive transport of counterions occurs via the Grotthuss mechanism,105,106 to which the Stokes–Einstein relation does not apply. The resulting proton transport is expected to be approximately as fast as in pure water. Here, the viscosity decreases the velocity U and thus reduces the Péclet number, which leads to higher charging. This has been observed for water–glycerol mixtures,40 where ion transport is governed by the Grotthus mechanism.107,108 The surface tension, dielectric constant, and Debye length vary by a factor <2 between pure water and pure glycerol.109–111 Only the viscosity varies over three orders of magnitude with varying glycerol contents.
4.3 Solid–liquid interface
Often, a Stern layer is found at solid surfaces in contact with water.112,113 In its simplest version, this layer consists of ions that are not completely hydrated and are adsorbed to the surface. Therefore, what remains on the surface after dewetting may not be the bare surface charge, but the surface covered with a Stern layer. In some cases, ions in the Stern layer can even overcompensate for the surface charge and inverse its sign, a phenomenon known as overcharging.114 While the exact influence is yet unknown, the exact binding mechanism and composition of the bound layer of the surface charge is expected to have a substantial influence on slide electrification.It is not yet clear at which length scale and if at all slip occurs at hydrophobic solid–liquid interfaces.116,117 Slip near the contact line would change dynamic wetting. It would also decrease the upward flow near the contact line and the stretching of the diffuse layer, see Section 1.2. These two effects would most likely influence the transfer of charge.
4.4 Ambient conditions
Humidity has little effect on charge separation and accumulation, at least in the range of up to 70%. At 80% relative humidity, charge separation tends to decrease.19,43 One reason for the weak dependence on humidity may be that a water drop creates its own humid atmosphere around it.The presence of ions in the surrounding gas phase, e.g., due to cosmic radiation,42,118 can contribute to charge neutralization. However, under atmospheric conditions, the ion concentration is too low to influence slide electrification substantially. Only when the ion concentration is artificially increased, e.g., through the use of an ionizing air blower, ions in air reduce the surface charge and lead to neutralization.32,89
5 Open questions
The overview given in the preceding sections summarizes much of our current understanding of slide electrification. Still, many open questions remain, some of which are listed in the following.5.1 Formation of interfacial charge at the hydrophob–water interface
How is the surface charge σSL formed at the interface between a solid hydrophobic surface and water? Is the enrichment of hydroxyl ions the dominating effect?5.2 Nature of charge carriers
The formation of electric double layers at solid–liquid interfaces is well-studied. Here, we presented an overview of the quantitative evidence supporting the charge transfer mechanism based on the electric double layer structure and the factors influencing it. Apart from that, it was suggested that the transfer of electrons between the solid and the liquid plays a major role.119 However, for electron transfer, a quantitative comparison between experiments and a detailed physical model is largely missing. Some steps in that direction were taken by discriminating electrons from ions via studying the decay of the deposited charge at elevated temperatures33 and by assessing the influence of the work function of different materials on charge transfer.120 Nevertheless, the following question remains: Can the contribution of electron transfer during liquid slide electrification be unambiguously quantified experimentally? Can these measurements be compared with detailed theoretical models?5.3 Atomistic processes while dewetting
We are missing a molecular picture of the transfer of charges to the solid surface at the receding contact line. How are charges deposited, despite the fact that the process is energetically unfavorable? Which atomistic processes influence the dewetting of charges? Is the deposition facilitated by a temporal formation of nanodroplets or hydration shells?5.4 Liquid mixtures
Electrokinetics of liquid mixtures remains largely unexplored. Theoretical investigations show that complex layering leads to a non-trivial electric double layer structure.121 How does slide electrification take place in mixtures of solvents? Which effects emerge near the contact line?5.5 Hydrophilic substrates
So far, slide electrification has only been observed on hydrophobic substrates, mainly due to the difficulty of moving drops on hydrophilic substrates. Theory suggests that charge separation should also occur on hydrophilic substrates, albeit reduced (Section 1.2). Can slide electrification be probed on hydrophilic substrates?5.6 Surfactants and polyelectrolytes
The influence of surfactants and dissolved polyelectrolytes remains obscure. How do surfactants influence charge separation and the formation of hydration shells? Does slide electrification lead to enhanced deposition of charged surfactants and dissolved polyelectrolytes, like DNA, on the dewetted surface?5.7 Surface degradation and chemical reactions
Can electric breakdown in the dielectric substrate or gas discharge at the contact line be probed in experiments? Do they degrade surfaces or lead to chemical reactions? If so, after how many wetting–dewetting cycles?6 Conclusions
Slide electrification is a universal and robust phenomenon in dynamic wetting. It has been demonstrated on hydrophobic dielectric substrates with various liquid electrolytes. While most works focus on drops, it has also been reported for other dewetting scenarios. Recent experimental and theoretical findings have revealed the underlying mechanisms, parametric dependencies, and consequences of slide electrification, most notably its effect on contact angle hysteresis. Despite these advances, slide electrification still cannot be predicted with high accuracy. Atomistic processes at the contact line remain obscure. Also, the influence of slide electrification on surfaces and coatings is not yet understood. Further research is required to answer these and other open questions. Overall, slide electrification fundamentally influences dynamic wetting and must be accounted for in experiments, even when it is not their main focus.Author contributions
A. D. R.: investigation, writing – original draft, writing – review & editing, and visualization H.-J. B.: conceptualization, investigation, writing – original draft, writing – review & editing, and project administration S. H.: investigation, writing – original draft, and writing – review & editing S. A. L. W.: investigation, writing – original draft, and writing – review & editing.Data availability
No primary research results, software or code have been included and no new data were generated or analysed as part of this review.Conflicts of interest
There are no conflicts to declare.Acknowledgements
The authors thank Lisa S. Bauer and Pravash Bista for helpful discussions and for providing us with the data. This work was supported by the German Research Foundation (DFG) within the Collaborative Research Centre 1194 “Interaction of Transport and Wetting Processes”, Project ID No. 265191195, subproject A02b (A. D. R. and S. H.) and subproject C07 (H.-J. B.), and the SPP 2171 “Dynamic Wetting of Flexible, Adaptive, and Switchable Surfaces” (S. A. L. W.), the Department for Process and Plant Safety of Bayer AG, Leverkusen, Germany (A. D. R.), and the European Research Council (ERC) under the European Union's Horizon 2020 Research and Innovation Program (Grant Agreement No. 883631) (H.-J. B.). Open Access funding is provided by the Max Planck Society.Notes and references
- K. Yatsuzuka, Y. Mizuno and K. Asano, J. Electrost., 1994, 32, 157–171 CrossRef.
- L. E. Helseth, J. Electrost., 2016, 81, 64–70 CrossRef CAS.
- A. Z. Stetten, D. S. Golovko, S. A. L. Weber and H.-J. Butt, Soft Matter, 2019, 15, 8667–8679 RSC.
- V. V. Yaminsky and M. B. Johnston, Langmuir, 1995, 11, 4153–4158 CrossRef CAS.
- A. Coehn and J. Franken, Ann. Phys. Chem., 1916, 353, 1005–1033 CrossRef.
- I. Langmuir, J. Am. Chem. Soc., 1938, 60, 1190–1194 CrossRef CAS.
- V. V. Yaminsky, P. M. Claesson and J. C. Eriksson, J. Colloid Interface Sci., 1993, 161, 91–100 CrossRef CAS.
- N. Knorr, S. Rosselli and G. Nelles, Langmuir, 2024, 40, 14321–14333 CrossRef CAS PubMed.
- F. Galembeck and T. A. L. Burgo, Chemical Electrostatics, Springer International Publishing, Cham, 2017 Search PubMed.
- D. J. Lacks and T. Shinbrot, Nat. Rev. Chem., 2019, 3, 465–476 CrossRef CAS.
- Z. Levin and P. V. Hobbs, Philos. Trans. R. Soc. London, Ser. A, 1971, 269, 555–585 CrossRef CAS.
- D. Choi, H. Lee, D. J. Im, I. S. Kang, G. Lim, D. S. Kim and K. H. Kang, Sci. Rep., 2013, 3, 2037 CrossRef PubMed.
- J. J. Nolan and J. Enright, Sci. Proc. R. Dublin Soc., 1922, XVII, 1–11 Search PubMed.
- F. Baumann, M. Himstedt, D. Möckel and M. Thedens, J. Loss Prev. Process Ind., 2021, 72, 104527 CrossRef.
- P. Lenard, Ann. Phys. Chem., 1892, 282, 584–636 CrossRef.
- D. Díaz, X. Li, P. Bista, X. Zhou, F. Darvish, H.-J. Butt and M. Kappl, Phys. Fluids, 2023, 35, 017111 CrossRef.
- W. Xu, Y. Jin, W. Li, Y. Song, S. Gao, B. Zhang, L. Wang, M. Cui, X. Yan and Z. Wang, Sci. Adv., 2022, 8, eade2085 CrossRef CAS PubMed.
- X. Li, A. D. Ratschow, S. Hardt and H.-J. Butt, Phys. Rev. Lett., 2023, 131, 228201 CrossRef CAS PubMed.
- P. Bista, A. D. Ratschow, H.-J. Butt and S. A. L. Weber, J. Phys. Chem. Lett., 2023, 14, 11110–11116 CrossRef CAS PubMed.
- X. Li, P. Bista, A. Z. Stetten, H. Bonart, M. T. Schür, S. Hardt, F. Bodziony, H. Marschall, A. Saal, X. Deng, R. Berger, S. A. L. Weber and H.-J. Butt, Nat. Phys., 2022, 18, 713–719 Search PubMed.
- S.-H. Kwon, J. Park, W. K. Kim, Y. Yang, E. Lee, C. J. Han, S. Y. Park, J. Lee and Y. S. Kim, Energy Environ. Sci., 2014, 7, 3279–3283 RSC.
- Y. Sun, X. Huang and S. Soh, Chem. Sci., 2015, 6, 3347–3353 RSC.
- J. Park, S. Song, Y. Yang, S.-H. Kwon, E. Sim and Y. S. Kim, J. Am. Chem. Soc., 2017, 139, 10968–10971 CrossRef CAS PubMed.
- H. Wu, N. Mendel, D. van den Ende, G. Zhou and F. Mugele, Phys. Rev. Lett., 2020, 125, 078301 CrossRef CAS PubMed.
- K. Wang and J. Li, J. Mater. Chem. A, 2021, 9, 8870–8895 RSC.
- X. Wang, J. Zhang, X. Liu, S. Lin and Z. L. Wang, J. Mater. Chem. A, 2023, 11, 5696–5702 RSC.
- D. Wang, J. Zhao, F. Zhang, P. Claesson, J. Pan and Y. Shi, Nano Energy, 2023, 112, 108479 CrossRef CAS.
- W. Xu, H. Zheng, Y. Liu, X. Zhou, C. Zhang, Y. Song, X. Deng, M. Leung, Z. Yang, R. X. Xu, Z. L. Wang, X. C. Zeng and Z. Wang, Nature, 2020, 578, 392–396 CrossRef CAS PubMed.
- L. E. Helseth, Appl. Energy, 2021, 300, 117394 CrossRef.
- Q. Sun, D. Wang, Y. Li, J. Zhang, S. Ye, J. Cui, L. Chen, Z. Wang, H.-J. Butt, D. Vollmer and X. Deng, Nat. Mater., 2019, 18, 936–941 CrossRef CAS PubMed.
- A. D. Ratschow, L. S. Bauer, P. Bista, S. A. L. Weber, H.-J. Butt and S. Hardt, Phys. Rev. Lett., 2024, 132, 224002 CrossRef CAS PubMed.
- P. Bista, A. D. Ratschow, A. Z. Stetten, H.-J. Butt and S. A. L. Weber, Soft Matter, 2024, 20, 5045–5052 RSC.
- S. Lin, L. Xu, A. Chi Wang and Z. L. Wang, Nat. Commun., 2020, 11, 399 CrossRef CAS PubMed.
- Y. Nan, J. Shao, M. Willatzen and Z. L. Wang, Research, 2022, 2022, 9861463 CrossRef CAS PubMed.
- J. N. Israelachvili, Intermolecular and Surface Forces, Academic Press is an imprint of Elsevier, Amsterdam, 3rd edn, 2012 Search PubMed.
- A. Dörr and S. Hardt, Phys. Rev. E:Stat., Nonlinear, Soft Matter Phys., 2012, 86, 022601 CrossRef PubMed.
- A. Shahzad, K. R. Wijewardhana and J.-K. Song, Appl. Phys. Lett., 2018, 113, 023901 CrossRef.
- C. Hinduja, H.-J. Butt and R. Berger, Soft Matter, 2024, 20, 3349–3358 RSC.
- B. He and A. A. Darhuber, J. Micromech. Microeng., 2019, 29, 105002 CrossRef CAS.
- A. D. Ratschow, L. S. Bauer, P. Bista, S. A. L. Weber, H.-J. Butt and S. Hardt, Phys. Rev. Lett., 2024, 132, 224002 CrossRef CAS PubMed.
- P. Bista, PhD thesis, Johannes Gutenberg-University, Mainz, 2024.
- R. G. Harrison and H. Tammet, Space Sci. Rev., 2008, 137, 107–118 CrossRef CAS.
- M. D. Sosa, M. L. Martínez Ricci, L. L. Missoni, D. H. Murgida, A. Cánneva, N. B. D'Accorso and R. M. Negri, Soft Matter, 2020, 16, 7040–7051 RSC.
- H. B. Eral, D. J. C. M. 't Mannetje and J. M. Oh, Colloid Polym. Sci., 2013, 291, 247–260 CrossRef CAS.
- H.-J. Butt, J. Liu, K. Koynov, B. Straub, C. Hinduja, I. Roismann, R. Berger, X. Li, D. Vollmer, W. Steffen and M. Kappl, Curr. Opin. Colloid Interface Sci., 2022, 59, 101574 CrossRef CAS.
- K. Kawasaki, J. Colloid Sci., 1960, 15, 402–407 CrossRef CAS.
- C. Furmidge, J. Colloid Sci., 1962, 17, 309–324 CrossRef CAS.
- Y. I. Frenkel, J. Exptl. Theoret. Phys. (USSR), 1948, 18, 659–669 CAS.
- A. Buzágh and E. Wolfram, Colloid Polym. Sci., 1958, 157, 50–53 CrossRef.
- A. Neumann and R. Good, J. Colloid Interface Sci., 1972, 38, 341–358 CrossRef CAS.
- L. W. Schwartz and S. Garoff, Langmuir, 1985, 1, 219–230 CrossRef CAS.
- M. O. Robbins and J. F. Joanny, Europhys. Lett., 1987, 3, 729–735 CrossRef CAS.
- F. E. Bartell and J. W. Shepard, J. Phys. Chem., 1953, 57, 211–215 CrossRef CAS.
- J. P. Oliver, C. Huh and S. G. Mason, Colloids Surf., 1980, 1, 79–104 CrossRef CAS.
- D. Quéré, Annu. Rev. Mater. Res., 2008, 38, 71–99 CrossRef.
- E. Raphaël and P. G. de Gennes, J. Chem. Phys., 1989, 90, 7577–7584 CrossRef.
- G. Lester, J. Colloid Sci., 1961, 16, 315–326 CrossRef CAS.
- T. D. Blake and J. M. Haynes, J. Colloid Interface Sci., 1969, 30, 421 CrossRef CAS.
- T. D. Blake and J. De Coninck, Adv. Colloid Interface Sci., 2002, 96, 21–36 CrossRef CAS PubMed.
- H.-J. Butt, R. Berger, W. Steffen, D. Vollmer and S. A. L. Weber, Langmuir, 2018, 34, 11292–11304 CrossRef CAS PubMed.
- F. Mugele, A. Klingner, J. Buehrle, D. Steinhauser and S. Herminghaus, J. Phys.: Condens. Matter, 2005, 17, S559–S576 CrossRef CAS.
- F. Mugele and J. Heikenfeld, Electrowetting: Fundamental Principles and Practical Applications, Wiley-VCH Verlag GmbH & Co, Weinheim, Germany, 2019 Search PubMed.
- J. Buehrle, S. Herminghaus and F. Mugele, Phys. Rev. Lett., 2003, 91, 086101 CrossRef PubMed.
- G. Lippmann, Ann. Chim. Phys., 1875, 5, 494–549 Search PubMed.
- K. Dhane, J. Han, J. Yan, O. Mahdavi, D. Zamani, B. Vermeire and F. Shadman, IEEE Trans. Semicond. Manuf., 2011, 24, 125–133 Search PubMed.
- T. Guo, T. H. Tsai, C. C. Chien, M. Chan, C. L. Yang and J. Y. Wu, Solid State Phenom., 2012, 187, 63–66 CAS.
- K.-I. Sano, R. Dylewicz, X. Man, D. Mui, J. Zhu and M. Kawaguchi, Solid State Phenom., 2016, 255, 277–282 Search PubMed.
- L. Zhao and C. L. Liu, Nanomaterials, 2020, 10, 2473 CrossRef CAS PubMed.
- C. Huh and L. Scriven, J. Colloid Interface Sci., 1971, 35, 85–101 CrossRef CAS.
- J. D. Jackson, Classical electrodynamics, Wiley, Hoboken, United States, 3rd edn, 1999 Search PubMed.
- J.-M. Löwe, V. Hinrichsen, I. V. Roisman and C. Tropea, Phys. Rev. E, 2020, 102, 063101 CrossRef PubMed.
- M. Vallet, M. Vallade and B. Berge, Eur. Phys. J. B, 1999, 11, 583–591 CrossRef CAS.
- R. Budakian, K. Weninger, R. A. Hiller and S. J. Putterman, Nature, 1998, 391, 266–268 CrossRef CAS.
- L. Rayleigh, London, Edinburgh Dublin Philos. Mag. J. Sci., 1882, 14, 184–186 CrossRef.
- J. Nauruzbayeva, Z. Sun, A. Gallo, M. Ibrahim, J. C. Santamarina and H. Mishra, Nat. Commun., 2020, 11, 5285 CrossRef CAS PubMed.
- M. D. Sosa, N. B. D'Accorso, M. L. Martínez Ricci and R. M. Negri, Langmuir, 2022, 38, 8817–8828 CrossRef CAS PubMed.
- E. Poli, K. H. Jong and A. Hassanali, Nat. Commun., 2020, 11, 901 CrossRef CAS PubMed.
- X. Yan, M. Delgado, J. Aubry, O. Gribelin, A. Stocco, F. Boisson-Da Cruz, J. Bernard and F. Ganachaud, J. Phys. Chem. Lett., 2018, 9, 96–103 CrossRef CAS PubMed.
- P. Vogel, N. Möller, M. N. Qaisrani, P. Bista, S. A. L. Weber, H.-J. Butt, B. Liebchen, M. Sulpizi and T. Palberg, J. Am. Chem. Soc., 2022, 144, 21080–21087 CrossRef CAS PubMed.
- J. Zhang, S. Lin, M. Zheng and Z. L. Wang, ACS Nano, 2021, 15, 14830–14837 CrossRef CAS PubMed.
- T. A. Burgo, F. Galembeck and G. H. Pollack, J. Electrost., 2016, 80, 30–33 CrossRef.
- B. Leibauer, O. Pop-Georgievski, M. D. Sosa, Y. Dong, W. Tremel, H.-J. Butt and W. Steffen, J. Am. Chem. Soc., 2024, 146, 10073–10083 CrossRef CAS PubMed.
- W. S. Y. Wong, P. Bista, X. Li, L. Veith, A. Sharifi-Aghili, S. A. L. Weber and H.-J. Butt, Langmuir, 2022, 38, 6224–6230 CrossRef CAS PubMed.
- P.-G. D. Gennes, F. Brochard-Wyart and D. Quéré, Capillarity and Wetting Phenomena, Springer New York, New York, NY, 2004 Search PubMed.
- E. Schäffer and P.-z Wong, Phys. Rev. Lett., 1998, 80, 3069–3072 CrossRef.
- J.-W. Lee and W. Hwang, Nano Energy, 2018, 52, 315–322 CrossRef CAS.
- L. E. Helseth, Langmuir, 2019, 35, 8268–8275 CAS.
- D. Díaz, D. Garcia-Gonzalez, P. Bista, S. A. L. Weber, H.-J. Butt, A. Stetten and M. Kappl, Soft Matter, 2022, 18, 1628–1635 RSC.
- F. Darvish, S. Shumaly, X. Li, Y. Dong, D. Diaz, M. Khani, D. Vollmer and H.-J. Butt, Sci. Rep., 2024, 14, 10640 CrossRef CAS PubMed.
- L. E. Helseth, Langmuir, 2024, 40, 4340–4349 CrossRef CAS PubMed.
- D. C. Prieve, B. A. Yezer, A. S. Khair, P. J. Sides and J. W. Schneider, Adv. Colloid Interface Sci., 2017, 244, 21–35 CrossRef CAS PubMed.
- A. Barišić, J. Lützenkirchen, N. Bebić, Q. Li, K. Hanna, A. Shchukarev and T. Begović, Colloids Interfaces, 2021, 5, 6 CrossRef.
- T. Preočanin, A. Selmani, P. Lindqvist-Reis, F. Heberling, N. Kallay and J. Lützenkirchen, Colloids Surf., A, 2012, 412, 120–128 CrossRef.
- P. Weidenhammer and H.-J. Jacobasch, J. Colloid Interface Sci., 1996, 180, 232–236 CrossRef CAS.
- R. Zimmermann, U. Freudenberg, R. Schweiß, D. Küttner and C. Werner, Curr. Opin. Colloid Interface Sci., 2010, 15, 196–202 CrossRef CAS.
- B. J. Kirby and E. F. Hasselbrink, Electrophoresis, 2004, 25, 203–213 CrossRef CAS PubMed.
- J. Nie, Z. Ren, L. Xu, S. Lin, F. Zhan, X. Chen and Z. L. Wang, Adv. Mater., 2020, 32, e1905696 CrossRef PubMed.
- V. Artemov, L. Frank, R. Doronin, P. Stärk, A. Schlaich, A. Andreev, T. Leisner, A. Radenovic and A. Kiselev, J. Phys. Chem. Lett., 2023, 14, 4796–4802 CrossRef CAS PubMed.
- S. Sbeih, A. Lüleci, S. Weber and W. Steffen, Soft Matter, 2024, 20, 558–565 RSC.
- N. Sghaier, M. Prat and S. Ben Nasrallah, Chem. Eng. J., 2006, 122, 47–53 CrossRef CAS.
- R. Zimmermann, S. Dukhin and C. Werner, J. Phys. Chem. B, 2001, 105, 8544–8549 CrossRef CAS.
- B. J. Kirby and E. F. Hasselbrink, Electrophoresis, 2004, 25, 187–202 CrossRef CAS PubMed.
- A. Einstein, Ann. Phys. Chem., 1905, 322, 549–560 CrossRef.
- W. Sutherland, London, Edinburgh Dublin Philos. Mag. J. Sci., 1905, 9, 781–785 CrossRef CAS.
- C. J. T. de Grotthuss, Ann. Chim., 1806, 58, 54–73 Search PubMed.
- G. A. Voth, Acc. Chem. Res., 2006, 39, 143–150 CrossRef CAS PubMed.
- N. Agmon, Chem. Phys. Lett., 1995, 244, 456–462 CrossRef CAS.
- W. Zhuang and C. Dellago, J. Phys. Chem. B, 2004, 108, 19647–19656 CrossRef CAS.
- P. W. Atkins and J. de Paula, Atkins’ Physical Chemistry, Oxford University, Oxford, 8th edn, 2006 Search PubMed.
- G. Akerlof, J. Am. Chem. Soc., 1932, 54, 4125–4139 CrossRef CAS.
- K. Takamura, H. Fischer and N. R. Morrow, J. Pet. Sci. Eng., 2012, 98–99, 50–60 CrossRef CAS.
- O. Stern, Z. Elektrochem. Angew. Phys. Chem., 1924, 30, 508–516 CrossRef CAS.
- G. Gonella, E. H. G. Backus, Y. Nagata, D. J. Bonthuis, P. Loche, A. Schlaich, R. R. Netz, A. Kühnle, I. T. McCrum, M. T. M. Koper, M. Wolf, B. Winter, G. Meijer, R. K. Campen and M. Bonn, Nat. Rev. Chem., 2021, 5, 466–485 CrossRef CAS PubMed.
- W. M. de Vos and S. Lindhoud, Adv. Colloid Interface Sci., 2019, 274, 102040 CrossRef CAS PubMed.
- L. Bocquet and E. Charlaix, Chem. Soc. Rev., 2010, 39, 1073–1095 RSC.
- D. Schaeffel, S. Yordanov, M. Schmelzeisen, T. Yamamoto, M. Kappl, R. Schmitz, B. Dünweg, H.-J. Butt and K. Koynov, Phys. Rev. E: Stat., Nonlinear, Soft Matter Phys., 2013, 87, 051001 CrossRef PubMed.
- C. Cottin-Bizonne, B. Cross, A. Steinberger and E. Charlaix, Phys. Rev. Lett., 2005, 94, 056102 CrossRef CAS PubMed.
- A. Hirsikko, T. Nieminen, S. Gagné, K. Lehtipalo, H. E. Manninen, M. Ehn, U. Hõrrak, V.-M. Kerminen, L. Laakso, P. H. McMurry, A. Mirme, S. Mirme, T. Petäjä, H. Tammet, V. Vakkari, M. Vana and M. Kulmala, Atmos. Chem. Phys., 2011, 11, 767–798 CrossRef CAS.
- F. Zhan, A. C. Wang, L. Xu, S. Lin, J. Shao, X. Chen and Z. L. Wang, ACS Nano, 2020, 14(12), 17565–17573 CrossRef CAS PubMed.
- Y. Jin, S. Yang, M. Sun, S. Gao, Y. Cheng, C. Wu, Z. Xu, Y. Guo, W. Xu, X. Gao, S. Wang, B. Huang and Z. Wang, Nat. Commun., 2024, 15, 4762 CrossRef CAS PubMed.
- S. Yabunaka and A. Onuki, Phys. Rev. Lett., 2017, 119, 118001 CrossRef PubMed.
| This journal is © The Royal Society of Chemistry 2025 |