
 Open Access Article
 This Open Access Article is licensed under a
 Creative Commons Attribution 3.0 Unported Licence
Analysis of the internal motions of thermoresponsive polymers and single chain nanoparticles†
Michael J. A.
Hore

Department of Macromolecular Science and Engineering, Case Western Reserve University, 10900 Euclid Ave., Cleveland, OH 44122, USA. E-mail: hore@case.edu; Tel: +1 (216) 368-0793
First published on 6th January 2025
Abstract
Data-driven techniques, such as proper orthogonal decomposition (POD) and uniform manifold approximation & projection (UMAP), are powerful methods for understanding polymer behavior in complex systems that extend beyond ideal conditions. They are based on the principle that low-dimensional behaviors are often embedded within the structure and dynamics of complex systems. Here, the internal motions of a thermoresponsive, LCST polymer are investigated for two cases: (1) the coil-to-globule transition that occurs as the system is heated above its critical temperature and (2) intramolecularly crosslinked, single chain nanoparticles (SCNPs) both above and below the critical temperature (TC). Our results demonstrate that POD can successfully extract the key features of the dynamics for both polymer globules and SCNPs. In the globular state, our results show that the relaxation modes are distorted relative to the coil state and relaxation times decrease upon chain collapse. After randomly crosslinking a globule to produce a SCNP, we observe a further distortion of the relaxation modes that depends strongly upon the particular set of monomers that are crosslinked. Yet, different sets of crosslinked monomers produce similar relaxation times for the SCNP. We observe that for SCNPs below the critical temperature, the relaxation times decrease with increasing crosslink density while above the critical temperature, they increase as crosslink density increases. Finally, using UMAP we categorize the local structure of SCNPs and examine the influence of the local structure on SCNP relaxation dynamics.
1 Introduction
Thermoresponsive polymers have attracted considerable attention in the soft matter community, in large part because of their ability to add functionality to soft materials1–3 – especially for biomedical applications.4–6 A commonly exploited behavior is the so-called “coil-to-globule” transition7–9 that occurs for many lower critical solution temperature (LCST) polymers. Polymers that undergo a coil-to-globule transition collapse above their critical temperature (TC) due to increasingly unfavorable interactions with their environment as temperature increases. Poly(N-isopropylacrylamide) (PNIPAM) is a widely studied polymer10 that exhibits a critical temperature in water near TC ≈ 32 °C, although the exact value of TC depends on factors that can include the polymer's concentration, terminal group chemistry, architecture, and others.11–14 Additionally, the presence of a second solvent such as methanol or ethanol can lead to more complex behaviors like co-nonsolvency – a phenomenon in which mixtures of compatible solvents for a polymer result in poor solvation, and which can be utilized to further tune the response of the polymer to its environment.15,16 Although PNIPAM is widely studied, several alternative thermoresponsive polymers have also received an increasing amount of attention due to their highly tunable critical temperatures, such as with poly[oligo(ethylene glycol) methyl ether methacrylate] (POEGMA),17,18 or because of a lack of thermal hysteresis, such as for poly(N-cyclopropylacrylamide) (PNCPAM).19,20The coil-to-globule transition for PNIPAM has been extensively studied with experimental measurements, computer simulations, and theory.8,21,22 For instance, Wu and Wang21 observed the single chain collapse of PNIPAM by performing light scattering measurements on extremely dilute solutions of high molecular weight chains. They observed a small, monotonic decrease in both the radius of gyration (Rg) and hydrodynamic radius (Rh) as temperature increased. Across a very small temperature window, near TC, they observed the PNIPAM chains collapse significantly with a shape factor Rg/Rh that decreased from approximately 1.5 (linear chain, good solvent) to 0.56, before recovering to approximately 0.8 (solid sphere/globule). Several distinct states of the PNIPAM chains have been identified during the coil-to-globule transition based on the value of the shape factor. As temperature increases towards TC, a PNIPAM coil collapses into a crumpled coil near TC before further collapsing into a molten globule (Rg/Rh = 0.56).23 The molten globule is thought to be reminiscent of a globule, but with a rough surface that leads to a shape factor below 0.8. Finally, with increasing temperature the PNIPAM chain fully collapses into a globule.
In the collapsed state, individual chains that contain a small amount of di-functional monomers, such as N,N′-methylene bisacrylamide (MBA), can be crosslinked to form single chain nanoparticles (SCNPs),24 which have been suggested as unique materials for drug delivery, imaging, and as nanoreactors among many others.5,25,26 Neutron scattering techniques have been instrumental for studying the structure and dynamics of SCNPs.27–29 Small-angle neutron scattering (SANS) measurements by González-Burgos and coworkers examined the structure of poly(methyl methacrylate) (PMMA) SCNPs dissolved in deuterated N,N-dimethyl formamide (DMF) with approximately xc = 28% of the monomers crosslinked. Upon crosslinking, the polymers became more compact as indicated by a decrease in the radius of gyration (Rg) and increase of the fractal dimension  of the particles, where ν is the Flory exponent describing the scaling of Rg with chain length N. However, despite this reduction in the dimensions of the chains upon crosslinking, the authors noted that for many different polymer chemistries (including PNIPAM) and crosslinking densities (xc ≈ 10 to 30%), SCNPs were not globular in conformation (i.e., ν > 1/3).27,30 In a similar study, Fisher and coworkers characterized polystyrene and poly(ethyl hexyl methacrylate) SCNPs in deuterated tetrahydrofuran (THF) with SANS, and observed that even at low crosslinking densities, intramolecularly crosslinked polymers develop interfaces making them more akin to particles than polymer chains.28 In fact, González-Burgos et al. observed the appearance of interparticle structure factor peaks in their SANS measurements, indicative of the particle-like character of SCNPs. However, the transition from polymers to particles is gradual as xc increases. In contrast with measurements from Pomposo et al.,30 Fisher et al. observed a transition from a random coil conformation to a globular conformation as the crosslink density of their SCNPs increased beyond 1% – illustrating potential differences in SCNP structure depending on the synthetic approach and other factors.25,31,32
Beyond studies of the structure of thermoresponsive polymers and their associated SCNPs, a handful of studies in the literature have sought to measure their internal motions,33,34 dynamics,35–37 diffusion,38 and swelling behavior39 using a combination of theory/simulation and experimental characterizations. González-Burgos et al.27 further characterized PMMA SCNPs using neutron spin echo spectroscopy and observed that internal friction significantly influenced the dynamics of both polymer precursors and SCNPs synthesized from them, with the effects of internal friction becoming stronger with crosslinking. The strong internal friction present in SCNPs has been attributed to non-deformable structural features within the interior of the nanoparticle.27 However, despite the increasing attention being paid to understanding the dynamical behavior of SCNPs and related systems, as of today there are myriad opportunities to better understand their behaviors.
Computer simulations offer an attractive means with which to study the internal motions and relaxation dynamics of thermoresponsive polymers and the SCNPs that they may comprise. In addition, classical theories of polymer dynamics, such as those developed by Rouse and Zimm, provide a means to theoretically understand the internal motions of individual polymers chains in the context of their relaxation modes. The foundation of this approach is an equation of motion for a monomer in a polymer chain:40
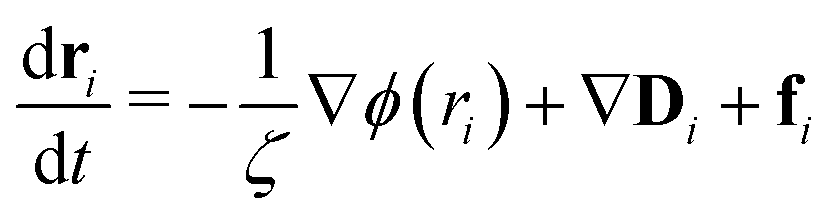 | (1) |
Motivated by the need for alternative approaches for studying more complex systems, as well as the opportunities to better understand thermoresponsive polymer/SCNP dynamics with computer simulations, we performed energy-conserving dissipative particle dynamics (eDPD) simulations of a thermoresponsive, LCST polymer under dilute solution conditions. We applied POD to analyze the relaxation dynamics and internal motions of the polymer in two cases: (i) the coil-to-globule transition as the polymer is heated above TC, and (ii) a SCNP above and below TC as a function of chain length and crosslink density, and which was created by randomly crosslinking the collapsed globule above TC. As we will demonstrate below, the modes used for traditional Rouse mode analysis of linear polymers are not applicable to the case of a polymer globule or SCNP. In addition, numerical solutions of the Rouse model in the case of SCNPs are only approximations of the true modes that are present in our simulations due to the presence of strong non-bonded interactions between monomers in the interior of the SCNP. Such numerical solutions are also highly dependent on which pairs of monomers within the SCNP are crosslinked. Our results show that the relaxation times of the polymer decrease as it collapses above TC, and follow the predictions of the Zimm model. However, distortions of the relaxation modes occur for the polymer globule signifying distinct monomer displacement patterns from a free coil below TC. Furthermore, larger distortions of the modes occur upon crosslinking the polymer to form a SCNP. Finally, we will demonstrate the interplay between local structure of the SCNP and the variation of the relaxation times of SCNPs with xc and T by categorizing the internal structure of the SCNPs with uniform manifold approximation & projection (UMAP).
2 Model and methods
2.1 Energy-conserving dissipative particle dynamics
Thermoresponsive polymer solutions were modeled with energy-conserving dissipative particle dynamics (eDPD) simulations using a GPU-accelerated, in-house code (gDPD). GPU acceleration was performed with the NVIDIA CUDA libraries, and simulations were performed on NVIDIA Tesla V100 GPUs.eDPD can be thought of as an extension to the more commonly used DPD technique, with additional parameters that can account for thermal conduction within the system and its effect on particle interactions.48,49 We chose to use eDPD instead of DPD because it has been demonstrated that eDPD correctly reproduces the correct temperature dependence of quantities such as the kinematic viscosity and particle diffusivity, whereas DPD does not.48 Because the focus of this article is on the dynamic properties of thermoresponsive polymers, it is essential to ensure that such quantities are correctly described. It has been used successfully in previous studies to simulate the collapse of LCST polymers.49,50 Finally, eDPD naturally describes processes that occur experimentally, such as the variation of interaction strengths as the system is heated from below TC to above TC – thus capturing both the effect of faster particle motions as well as increasingly unfavorable interactions as T increases.
With DPD, atoms are coarse-grained into fluid elements (DPD beads) that may represent several atoms. Each DPD bead interacts with all other neighbors within a cutoff distance rc = 1.0. This sets the fundamental length scale of the simulations. It has been estimated that rc ≈ 1 nm for typical values of the DPD parameters described below.51,52 We assume that all DPD beads have unit mass, and kept the density of DPD beads in the system fixed at ρ = 3rc−3. Interactions between particles i and j are described by a conservative (FCij), random (FRij), and dissipative force (FDij):
FCij = aijwR(rij)![[r with combining circumflex]](https://www.rsc.org/images/entities/b_char_0072_0302.gif) ij, ij, | (2) |
| FRij = σij(Δt)−1/2wR(rij)θijij, | (3) |
| FDij = −γijwD(rij)(ij·vij)ij, | (4) |
ij = rij/rij, and vij = vi = vj. In addition, θij is a uniform random number with zero mean and unit variance that is uncorrelated for different pairs of particles and at different times. wD(rij) = [wR(rij)]2 are weighting factors for the dissipative and random/conservative forces, respectively. aij is the strength of the conservative interaction between particles i and j, and becomes larger as the interaction becomes more unfavorable. Setting aij = a0 for all particles i and j, regardless of their chemical species, produces good solvent conditions in DPD simulations of polymer solutions. The coefficients σij and γij, which are related to the strength of thermal fluctuations and energy dissipation, are discussed in more detail below. The combination of the random and dissipative forces forms a thermostat for the system.
Beyond the three DPD forces, adjacent monomers within a polymer chain are connected to each other through forces derived from the finite-extensible nonlinear elastic (FENE) potential, i.e., FFi,i+1 = −∇UF(ri,i+1), where
 | (5) |
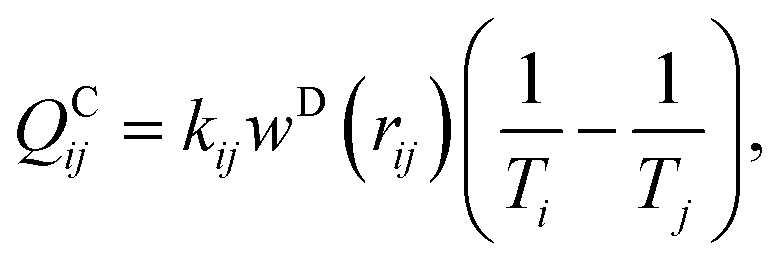
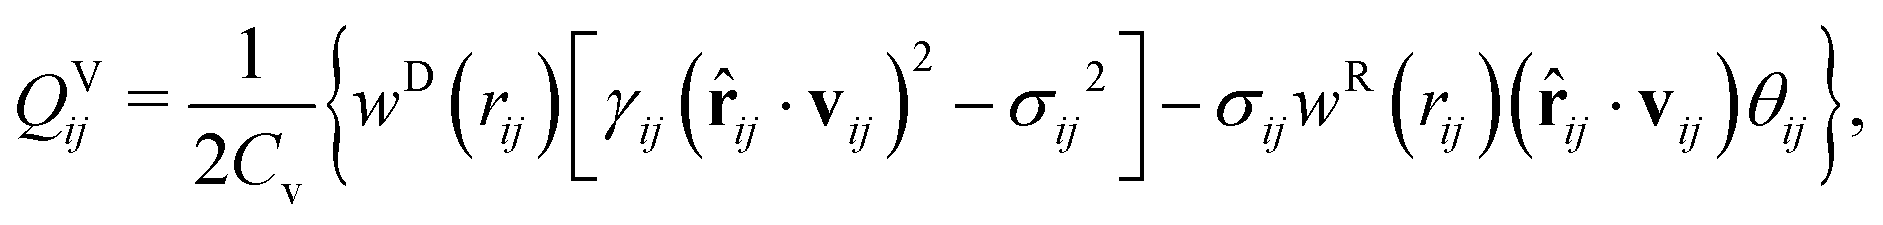
To correctly model a thermoresponsive system, in which the system may be heated or cooled while developing corresponding changes in the interaction strengths between the components, it is most convenient to augment the traditional DPD approach to explicitly consider energy flow in the system. Under this approach, each DPD bead i is assigned a temperature Ti, which is governed by an equation of motion:48,49
 | (6) |
 | (7) |
 | (8) |
| QRij = υijwR(rij)(Δt)−1/2ζij, | (9) |
Simulations of single, thermoresponsive polymers with degrees of polymerization N were performed in systems with periodic boundary conditions and sizes of Lx = Ly = Lz = 32rc, which is at least 4× larger than the radius of gyration of the largest polymer (N = 200). We focused on single chain simulations to eliminate any potential confounding effects caused by aggregation of the polymers above their LCST. The polymers were first generated at a random position in the system, and equilibrated for 50![[thin space (1/6-em)]](https://www.rsc.org/images/entities/char_2009.gif) 000 time steps at which point the radius of gyration Rg saturated at a constant value, and the average system temperature saturated at
000 time steps at which point the radius of gyration Rg saturated at a constant value, and the average system temperature saturated at 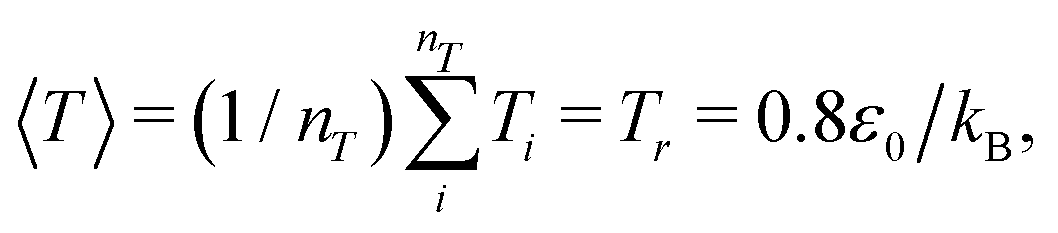 where nT is the total number of DPD beads in the system. After equilibration, polymers were simulated for a minimum of 4 × 10⁶ time steps to acquire sufficient statistics regarding their size, conformation, and relaxation dynamics. To mitigate any potential for statistical deviations to influence the results, two independent runs were made for each system. We observed only slight differences between the two runs, as described in more detail below.
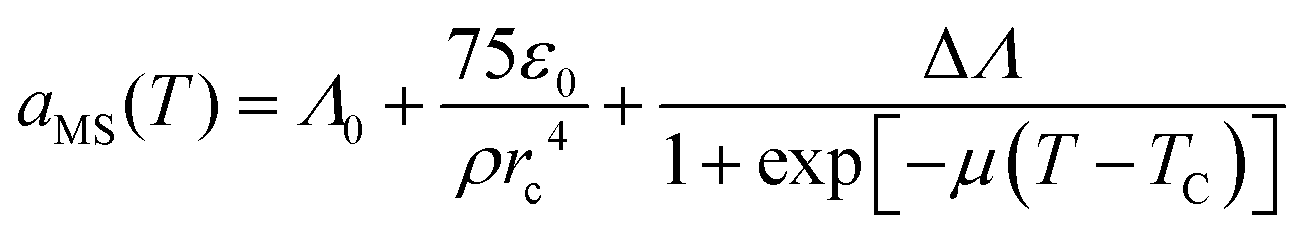
To simulate the coil-to-globule transition, we took the approach of Karniadakis et al.48,49 and modeled the interaction strength between a monomer bead and solvent bead, aMS, according to:
 | (10) |
2.2 Proper orthogonal decomposition
The relaxation modes and relaxation times of the polymers were computed by proper orthogonal decomposition (POD), also referred to as principal component analysis (PCA) depending on the context.58 In this approach, snapshots of the monomer coordinates are stored every Δs = 500 time steps, separately for each value of Tr, during the course of the simulation, and post-processed to determine the distance between each monomer and the center of mass of the molecule as a function of time,![[r with combining tilde]](https://www.rsc.org/images/entities/b_char_0072_0303.gif) i(t). Three covariance matrices Mq are constructed for each component q = x, y and z of ij:
i(t). Three covariance matrices Mq are constructed for each component q = x, y and z of ij: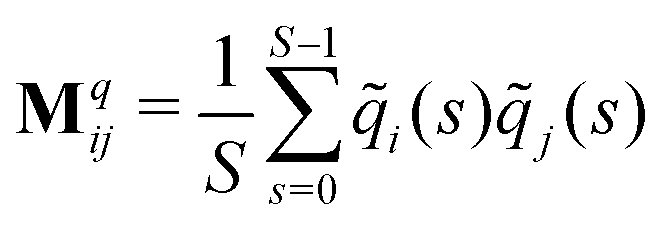 | (11) |
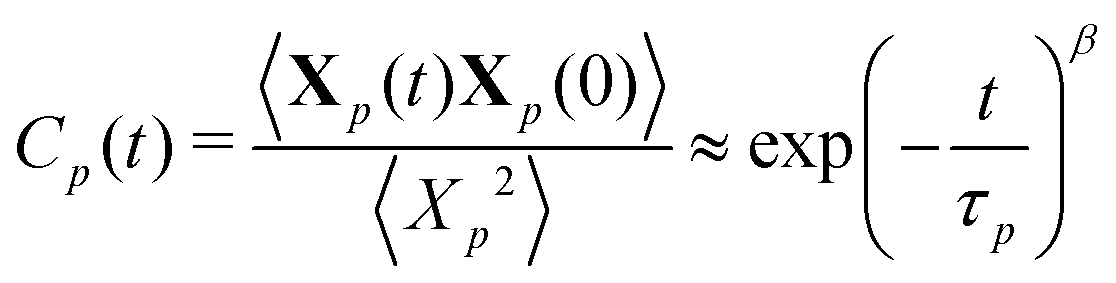
To extract relaxation times of the polymer, normal coordinates Xp(t) for each mode p are computed by projecting the coordinates of each monomer on to the basis describing the motions of that mode, i.e., Xp(t) = ψp(n) × [x(t)y(t)z(t)]. The temporal autocorrelation of the normal coordinates Cp(t) is fit to a stretched exponential function:
 | (12) |
3 Results and discussion
3.1 The coil-to-globule transition
We first modeled the collapse of a single, thermoresponsive chain as the temperature of the external reservoir was increased from Tr = 0.8ε0/kB to Tr = 1.4ε0/kB for chain lengths N = 20, 50, 100, and 200. As Tr increased, a net heat flux developed that added energy to the system such that 〈T〉 ≈ Tr. At the same time, eqn (10) produced an increase of the polymer–solvent (PS) interaction parameter from aMS = 15ε0/rc (Tr = 0.8ε0/kB) to aMS = 35ε0/rc (Tr = 1.4ε0/kB), relative to solvent–solvent (SS)/monomer–monomer (MM) interaction strength of aSS = aMM = 25ε0/rc. As the temperature was increased above TC, the polymer coils collapsed into globules within 5–10τ0.The average radius of gyration of the polymer across 4 × 10⁶ time steps (40000τ0), and averaged between two independent simulations, is plotted in Fig. 1 for T < TC (Tr = 0.8ε0/kB, black) and T > TC (Tr = 1.4ε0/kB, red). Representative snapshots of the polymer conformation are shown in the figure for a chain of N = 100 monomers. The two independent simulations yielded almost identical values for Rg, as indicated by vanishing size of the error bars at each data point. The dashed lines in the figure denote the scaling exponent of Rg, i.e. Rg ∼ Nν, where ν = 0.63 for T < TC and ν = 0.30 for T > TC – indicating that the expected scaling relationships between Rg and N for a coil (ν ≈ 3/5) and a globule (ν ≈ 1/3) are essentially reproduced by the eDPD simulations.
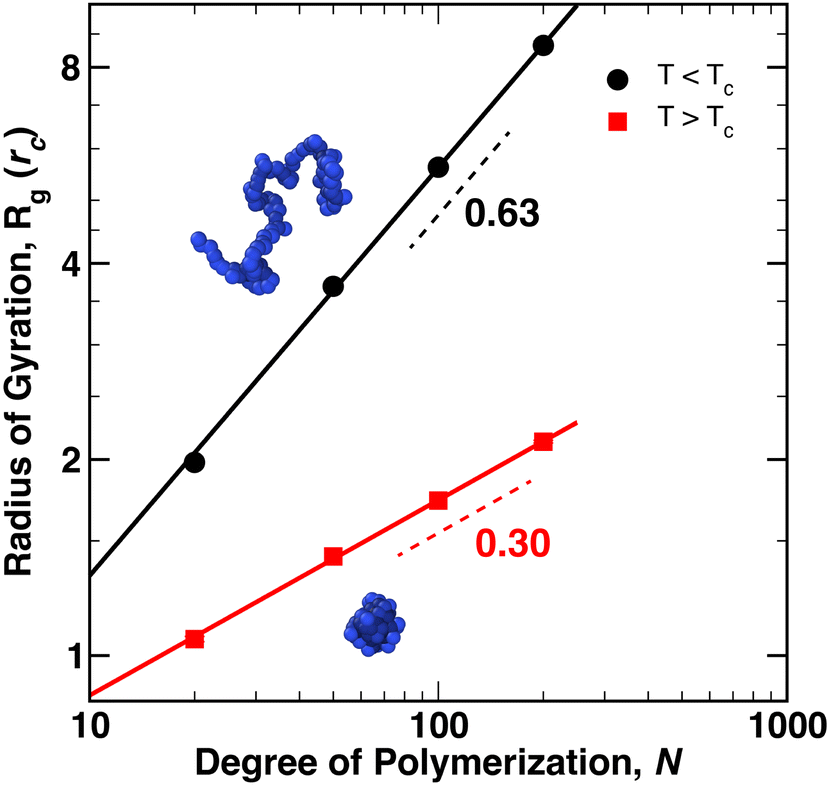 | ||
| Fig. 1 Average radius of gyration, Rg, plotted as a function of degree of polymerization, N. Circles correspond to coil conformations below TC while squares correspond to globular conformations above TC. The rendered polymers depict representative coil (top) and globule (bottom) conformations for N = 100. Error bars, corresponding to one standard deviation in the value of Rg are smaller than the size of the points. | ||
We next focused on analyzing the relaxation dynamics of the coil and globule conformations of the polymer using POD. Shown in Fig. 2 are the first three relaxation modes ψp(n), determined from POD, at temperatures (A) above and (B) below the critical temperature for a chain of N = 200 monomers. The modes for other chain lengths (not shown) were similar. In this figure, the modes extracted by POD in the x-, y-, and z-directions were averaged into a single mode. Shown as dashed lines in the figure are the Rouse modes calculated from the numerical solution of eqn (1) for a harmonic potential with ∇Di = 0. The POD modes represent fundamental monomer displacement patterns that underlie the monomer motions in the eDPD simulations. In particular, p = 1 (black) describes the relaxation of the chain ends relative to each other (i.e., motions about the central monomer of the chain). As p increases, the modes describe the motions/relaxations of increasingly smaller regions in the interior of the chain.59,60
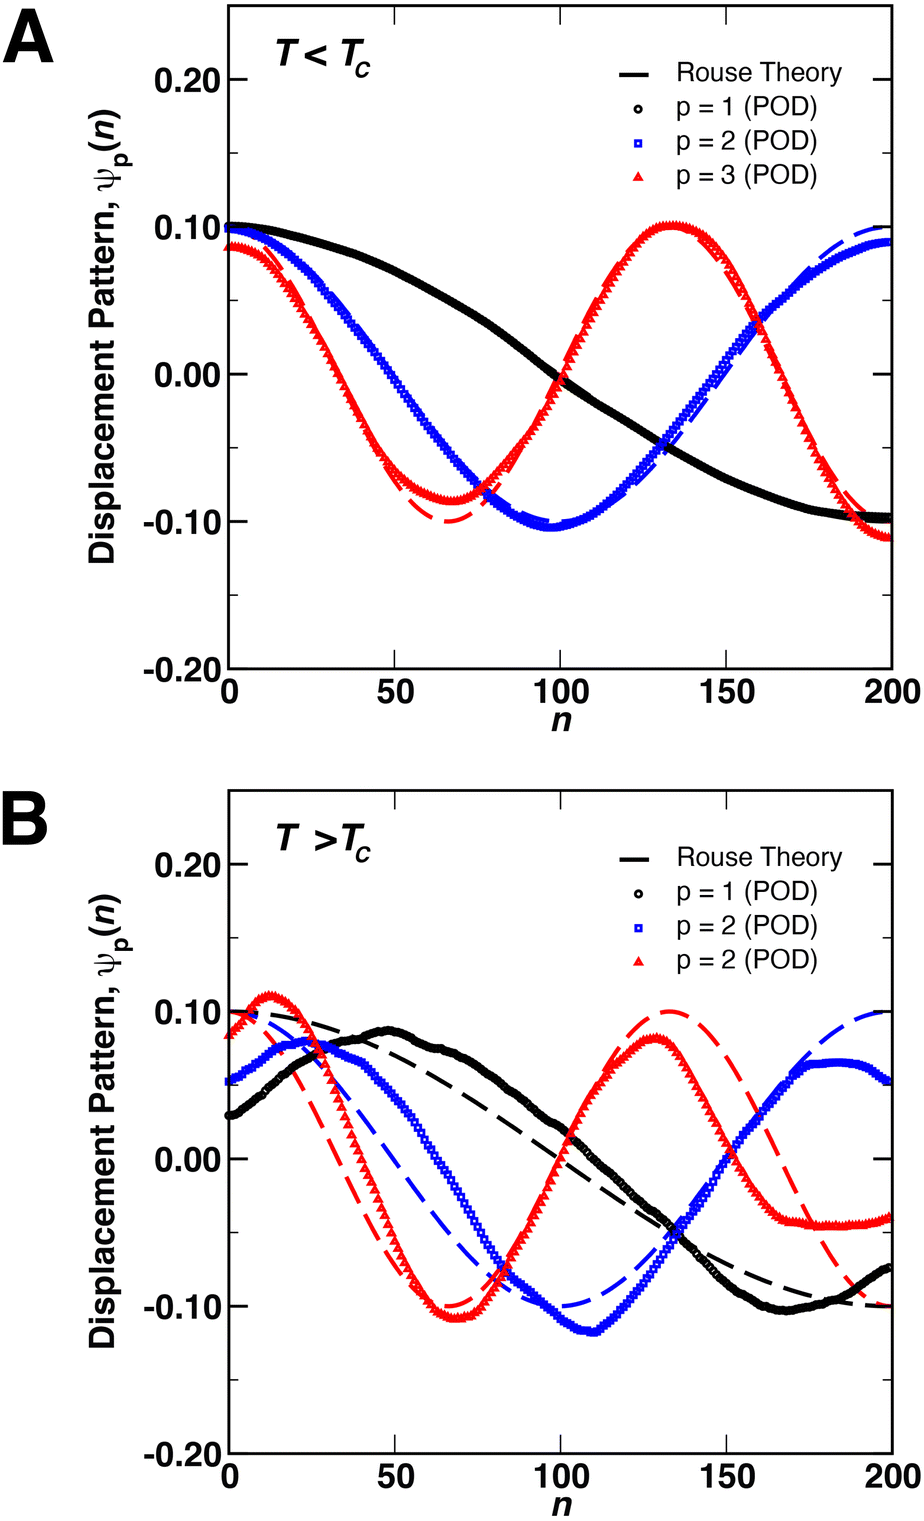 | ||
| Fig. 2 Displacement patterns (i.e., eigenfunctions) of the first three relaxation modes of a single, free polymer chain (N = 200) determined from proper orthogonal decomposition (POD, points) compared to the analytical result from the Rouse Model (dashed lines) for (A) T < TC and (B) T > TC. | ||
As demonstrated in Fig. 2(A), there is good quantitative agreement between the Rouse modes and the POD modes for coils below the critical temperature, without the need for any adjustable parameters. However, the modes in Fig. 2(B) display small distortions above the critical temperature, implying that the motions of the monomers in the globular state are distinct from those of a random coil. These distortions likely arise in a couple of ways due to the local environment inside the globule. First, as compared to the Rouse model, the potential ϕ(ri) experienced by monomers in the globule consists of both the bonded and non-bonded interactions, arising from the FENE and conservative DPD potential, respectively. For the largest chain length simulated (N = 200), Rg ≈ 2rc, implying that a large number of monomer pairs exist within a cutoff distance rc, producing non-negligible contributions to the dynamics (e.g., in eqn (1)). Second, the collapse of the coil into a globular state may introduce physical restrictions on the motions of the monomers such that underlying monomer displacement patterns differ from those of a free coil below TC. In particular, above TC, the three modes show a common behavior of displacements moving towards the interior of the chain, as indicated by the movement of the maxima of ψp(n) away from the chain ends (i.e., n = 1 and n = 200). Similar restrictions on internal motions of polymer globules were observed experimentally by Dai et al.33,34 using laser light scattering.
In Fig. 3 the fraction of variance in the monomer motions captured by each mode, i.e., 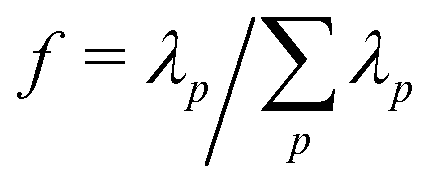 where λp is the singular value of mode p, is plotted for the first 6 modes below (black) and above (red) TC. While the first 4 modes capture the majority of the polymer dynamics below TC, we observe many more modes are required above TC to fully describe the motions of monomers in the globular state. For instance, while the lowest p = 1 mode captures more than 70% of the dynamics below TC, the lowest mode only captures approximately 20% of the dynamics above TC – necessitating a larger number of modes to fully describe the dynamics. Nevertheless, the relaxation times at both temperatures can still be extracted from fitting Cp(t) to eqn (12) with β = 1 (solid lines, Fig. 4). Shown in the inset of Fig. 4 is the scaling of the relaxation time of mode p = 1 (τ1) as a function of chain length. According to the Zimm description of dilute polymer dynamics in the presence of hydrodynamic interactions, τ1 ∼ N3ν. The scaling exponents extracted from the eDPD simulations are shown as dashed lines in the figure. While the simulations slightly under-predict this value for T < TC (i.e., 3ν = 1.6 rather than 1.8), for T > TC the result exactly matches the Zimm prediction (3ν = 0.9 for ν = 0.3). Although solvent is not expected within the interior of the globule, hydrodynamic effects at the globule's surface may lead to similar dynamics as a coil in dilute solution. Thus, although the motions of the monomers are slightly distorted from the ideal Rouse modes, the relaxation times are in accord with the classical description.
 | ||
| Fig. 3 Fraction of the variance in the monomer motions captured by modes p = 1 to 6 for a single polymer (N = 200) in the coil state (T < TC, black) and globule state (T > TC, red). | ||
 | ||
| Fig. 4 Normal mode temporal autocorrelation function Cp(t) plotted for the lowest mode p = 1 as a function of time above TC. Red curves are fits to eqn (12) with β = 1 for (left to right) N = 20, 50, 100, and 200. The inset presents the scaling of the longest relaxation time τ1 with degree of polymerization N. The dashed curves correspond to the scaling exponent for T < TC (black) and T > TC (red). | ||
3.2 Single chain nanoparticles (SCNPs)
After determining the behavior of a thermoresponsive coil both above and below its critical temperature, we focused on understanding single chain nanoparticles (SCNPs) that were produced by randomly crosslinking xc% monomers within a globule at T > TC. This process is demonstrated in Fig. 5 where a globule is randomly crosslinked by connecting random pairs of monomers in close proximity using the FENE potential with identical parameters to those described above in Section 2. SCNPs were then simulated at Tr = 1.4ε0/kB and Tr = 0.8ε0/kB. As will be discussed in more detail below, the random crosslinking procedure resulted in modes ψp(n) that differed between different particles/independent simulations.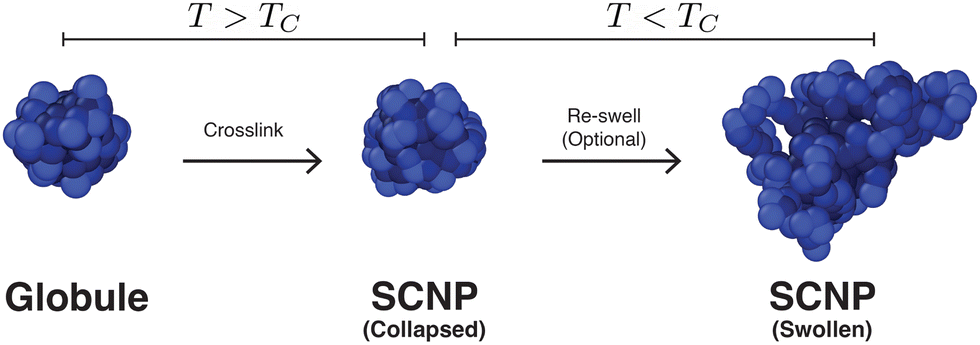 | ||
| Fig. 5 Simulation snapshots depicting the process of forming a single-chain nanoparticle (SCNP) from a collapsed globule (N = 200) at T > TC by crosslinking xc = 10% random, non-adjacent monomers, followed by an optional re-swelling of the particle at T < TC. | ||
Representative displacement patterns of the first mode, ψ1(n) are shown in Fig. 6 for a SCNP with N = 100 and a crosslink density of xc = 15% (red line), compared to ψ1(n) for a free chain/globule (black line) and a numerical solution of eqn (1) (blue dashed line) for an identical set of crosslinks. Crosslink points are superimposed on ψ1(n) as filled symbols. Note that different pairs of crosslinked monomers will produce different values for ψp(n), but nearly identical values of Cp(t), as shown in Fig. S1 and S2 in the ESI.† The difference between the numerical solution and the POD modes demonstrates the effect that local interactions, for example from the conservative force, have on the monomer motions. For instance, although the numerical Rouse mode is very similar to the POD mode in terms of the locations of maxima and minima of the function, the amplitudes of local regions of the modes can differ between the two approaches. At the top of Fig. 6 are representative snapshots of the SCNP along different planes with crosslinked monomers rendered in red and non-crosslinked monomers as translucent beads. Upon crosslinking, the relaxation modes become more distorted than those for a non-crosslinked globule. In addition, we observe that regions of ψ1(n) with many adjacent crosslinks (e.g., near n = 30 and n = 50 in the figure) show less variation than those regions between crosslink points, implying these regions may be relatively spatially static compared to regions of the polymer farther along the contour (e.g., near n = 80). This can be visualized with the snapshots in Fig. 6 where we observe regions of crosslinked monomers in close proximity to one another, and is reminiscent of the immobile domains/clusters proposed by González-Burgos et al.27 on the basis of their neutron spin echo measurements. Although ψp(n) varies with the specific monomers that are crosslinked within a SCNP, independent simulations found that both C1(t) and τ1 were very similar between different sets of crosslinked monomers. However, certain sets of crosslinked monomers resulted in autocorrelation functions that did not fully decay to zero at intermediate times, the origin of which will be discussed in more detail below.
 | ||
| Fig. 6 Monomer displacement patterns for a SCNP (N = 100, xc = 15%) above TC. The snapshots show the SCNP along several different orientations, with crosslinked monomers shaded in red and non-crosslinked monomers as translucent beads. The plot compares ψ1(n) for a globule (xc = 0%, black) to ψ1(n) computed for a SCNP (xc = 15%, red) using POD. The result of numerically solving the Rouse model for an ideal SCNP with identical crosslinks is shown in blue. Crosslink locations are superimposed on ψ1(n) as discrete points. | ||
The normal coordinate autocorrelation function Cp(t) is plotted in Fig. 7(A) at temperatures above (red squares) and below (black circles) the critical temperature for a fixed chain length of N = 200 and varied crosslink density xc. As indicated by the directions of the arrows, curves from left to right correspond to increasing xc for T > TC, while for T < TC, Cp(t) shifts to the left as xc increases. However, in all cases Cp(t) is well-described by eqn (12) with β = 1 regardless of temperature or crosslink density. The variation of Cp(t) with xc implies that relaxation times increase in the crosslinked globular state as xc increases, whereas they decrease in the crosslinked coil state as xc increases. The relaxation times determined by eqn (12) are plotted in Fig. 7(B), where we also observe that τ1 appears to decrease as xc increases below the critical temperature, while τ1 appears to increase and saturate at a constant value as xc increases. For the lowest crosslink density of xc = 2.5%, the relaxation times at the two temperatures differ by an order of magnitude and differ by approximately 500τ0 for xc = 20%. Although we did not simulate SCNPs for xc > 20%, we expect that the two branches in Fig. 7B should converge as xc → 100%.
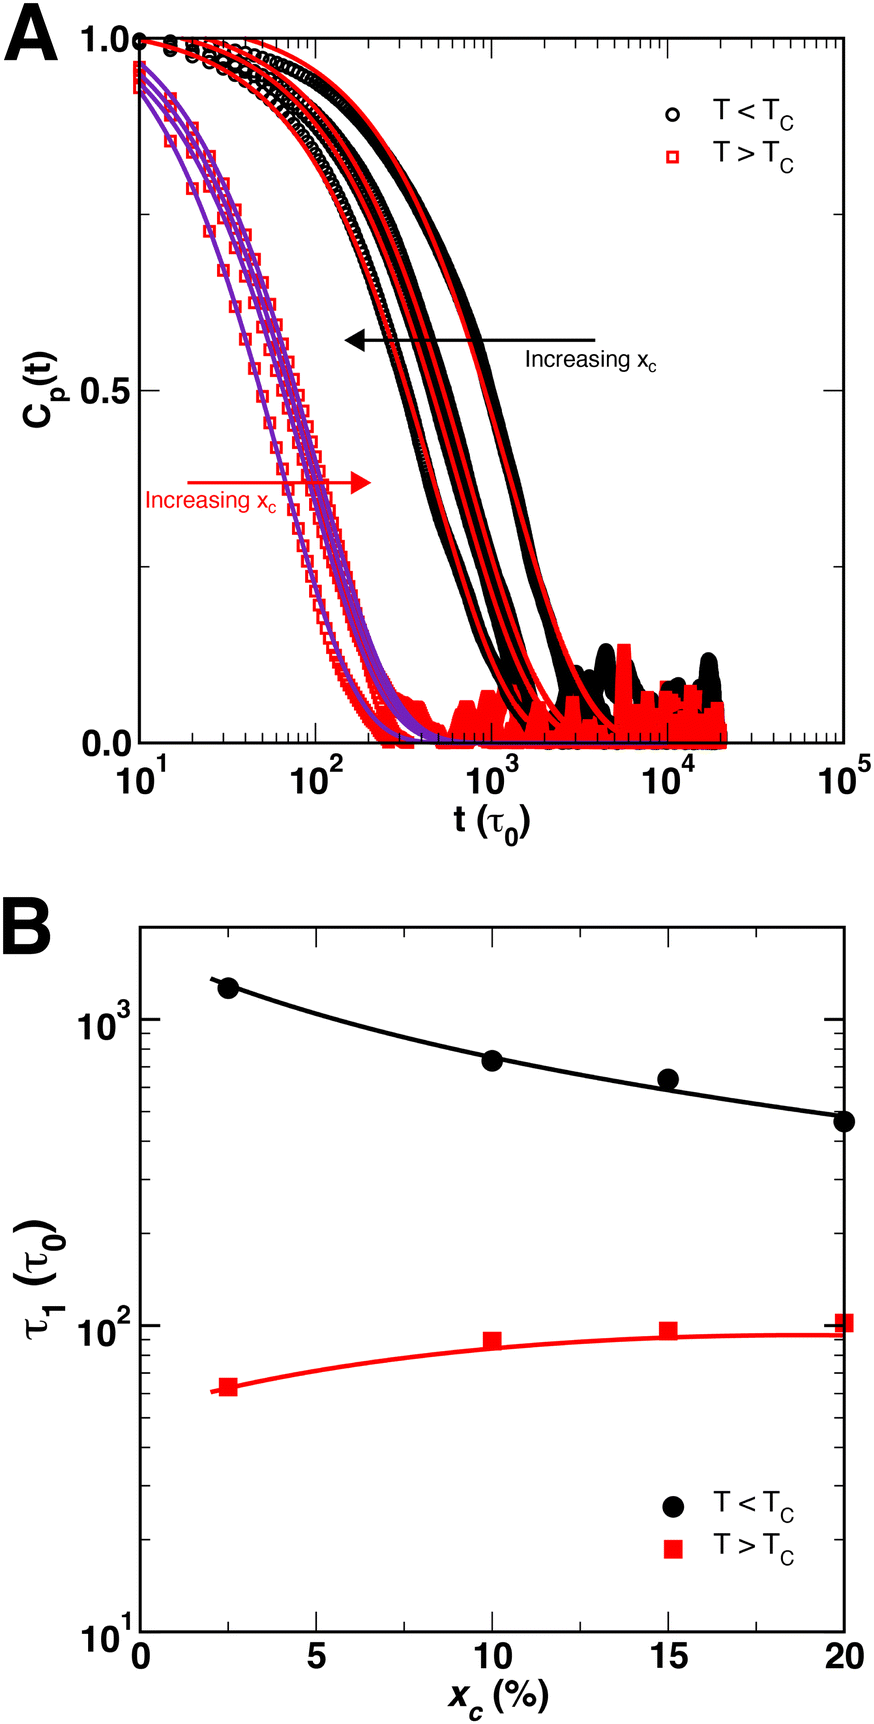 | ||
| Fig. 7 (A) Temporal autocorrelation function Cp(t) (p = 1) for SCNPs (N = 200) as a function of xc for T < TC (black circles) and T > TC (red squares). The lines are fits to eqn (12) with β = 1. The arrows denote the variation of xc. (B) Relaxation times of the first mode, obtained from the data in (A), as a function of xc, plotted for SCNPs below TC (black circles) and above TC (red squares). The lines are guides for the reader. | ||
An explanation for the different variation in τ1 above and below the critical temperature can be formulated on the basis of the snapshots of a SCNP (N = 200, xc = 2.5%) in Fig. 8, and those shown in Fig. 5 for N = 200 and xc = 10%. First, the SCNP undergoes an additional collapse for T > TC due to the poor solvent condition as shown in Fig. 8, resulting in shorter relaxation times above the critical temperature. Second, the snapshots in Fig. 8A demonstrate how distant crosslink points along the polymer contour connect distant points together, leading to a more compact structure than if the chain was not crosslinked. As a result, as more crosslinks are added and the chain becomes increasingly compact, the relaxation times decrease by a factor of 2 to 3 as xc increases from 2.5% to 20%. In this case, both the conformation of the polymer and constraints on the monomer motions vary with xc. In contrast, for T > TC, the size of the globule and the SCNP are similar to each other (cf., Fig. 5), and increasing xc leads almost exclusively to additional constraints on monomer motions – leading to correlations in Xp(t) over longer spans of time and a small increase in τ1.
 | ||
| Fig. 8 Representative snapshots of a SCNP (N = 200, xc = 2.5%) in the (left to right) XZ-plane, XY-plane, and YZ-plane for (A) T < TC and (B) T > TC. All snapshots are at the same magnification with identical pairs of crosslinked monomers. For reference, the radius of the SCNP in (B) is approximately 2rc. Crosslinked monomers are shaded in red, while non-crosslinked monomers appear translucent. | ||
Finally, although Cp(t) decayed exponentially for all polymer coils and globules, we observed that for certain SCNPs, particular sets of crosslinked monomers showed residual amounts of correlations in Cp(t) at intermediate times. This behavior was observed almost exclusively in short chain SCNPs with N = 50, and did not appear to depend on xc. However, most systems showed full exponential decay of Cp(t). For those systems with residual correlations, the degree of correlation varied between the x-, y-, and z-directions within the SCNP, implying that the residual correlations may be related to the interior structure of the SCNP. An example of this behavior is shown in Fig. 9A for a SCNP with N = 50 and xc = 10%, where the black circles represent the average Cp(t) function, and the colored points show Cp(t) in the x-, y-, and z-directions. r0x, r0y, and r0z denote the amount of residual correlations in each of the three directions, where for full exponential decay of Cp(t), r0 = r0x = r0y = r0z = 0. Consideration of quantities such the distribution of crosslinks or the distances between pairs of crosslinked monomers along the polymer contour did not produce any meaningful connection between the SCNP structure and the behavior of Cp(t). Instead, we adopted the data-driven approach of Reinhart61,62 for constructing sequence-morphology phase maps of sequence-defined polymers to characterize the local structure of our SCNPs using the structure of triads of DPD particles {i, j, k} In this approach, uniform manifold approximation & projection (UMAP) is performed on structural histograms to embed systems in a “structure space” to quantitatively determine whether SCNPs with residual correlations in Cp(t) were structurally similar (i.e., in close proximity in structure space). Full details of implementing this approach are provided in the ESI.† The embedding of SCNP local structure in structure space Z = (Z0, Z1, Z2) using UMAP is shown in Fig. 9B in the Z1 and Z2 directions, with red crosses representing systems that show residual correlations and black circles representing systems that fully decay exponentially. This projection in Z groups SCNPs on the basis of the distance between particles j and k (djk) within the SCNP, and the sum of the bond lengths between all three monomers (i.e., lijk = dij + dik = |rj − ri| + |rk − ri|). We observe that systems with r0 > 0 formed a single group in Z that was separate from those systems with r0 = 0, further supporting the hypothesis that residual correlations in Cp(t) were the result of the local structure of the SCNP that resulted from random crosslinking. Projections of the UMAP embedding along the Z0 direction are provided in the ESI,† but did not show as clear of a grouping between the two classes of systems.
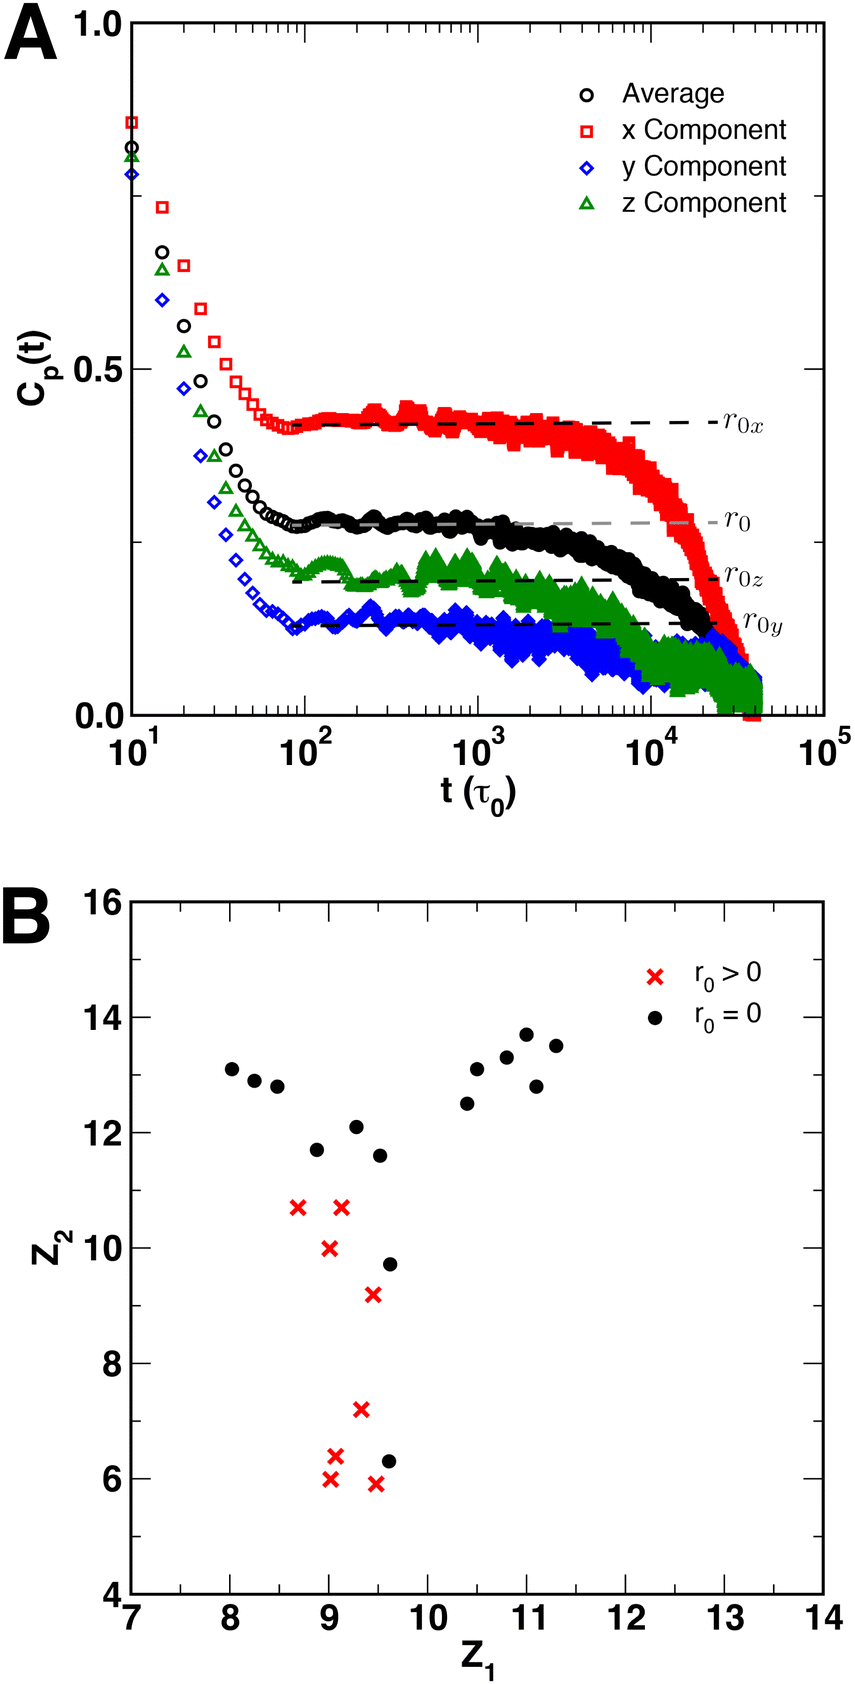 | ||
| Fig. 9 (A) Example autocorrelation function for a SCNP (N = 50, xc = 10%) that shows residual correlations r0 (dashed lines) at intermediate times (t ≈ 102 to 103τ0). The black circles are an average of the autocorrelation functions in the x- (red squares), y- (blue diamonds), and z-directions (green triangles). (B) Slice of the manifold obtained by UMAP in the Z1 and Z2 directions, showing the grouping/structural similarities between those points with residual correlations (red crosses) and those which fully decay (black circles). | ||
4 Conclusions
In summary, we have utilized two data-driven analysis techniques – proper orthogonal decomposition (POD) and uniform manifold approximation & projection (UMAP) – to study the relaxation dynamics of a thermoresponsive, LCST polymer during (i) the coil-to-globule transition and (ii) when crosslinked to form a single-chain nanoparticle (SCNP). Below the critical temperature TC, individual polymer coils display relaxation modes that exactly match those predicted by analysis of a Rouse chain (cf.eqn (1)). The relaxation times in this regime roughly scale with N as predicted by the Zimm model for dilute polymer solutions. However, above the critical temperature we observe a distortion of these modes and the relaxation modes describe processes that occur towards the interior of the polymer contour. Nevertheless, when these modes are used to compute the normal coordinates Xp(t) and their temporal autocorrelation Cp(t), we obtain relaxation times τ that exactly scale with polymer chain length as predicted by Zimm: τ1 ∼ N0.9.In contrast to the behavior of the polymers during the coil-to-globule transition, when globules are randomly crosslinked to form SCNPs, the modes present in the nanoparticle depend strongly on the set of monomers that are crosslinked. Below TC, relaxation times decrease with increasing crosslink density xc while above TC, they increase. This behavior was attributed to the interplay between the conformation of the SCNP and restriction of monomer motions by the crosslinks. In particular, while the polymer conformation and constraints on motions vary with xc below TC, only the constraints on the monomer motions vary with xc above TC. The local, internal structure of the SCNP, categorized using UMAP, strongly influenced the decay of Cp(t) for short chain SCNPs.
Looking to the future, techniques such as POD and UMAP can enable investigations of the structure and dynamics of more complex systems and polymer architectures – with an eye towards predicting the macroscopic properties of soft materials. For instance, these techniques may be directly applicable to more structured polymer architectures, such as those which possess secondary structures (e.g., folded proteins), sequence-defined polymers, and micro/nanoplastic contaminants. At the same time, experimental characterizations of the dynamics of thermoresponsive polymers, for example by neutron spectroscopy, are well-warranted to compare the experimental behaviors of thermoresponsive polymers (e.g., PNIPAM) with the behaviors predicted by eDPD simulations.
Data availability
The data supporting this article have been included as part of the ESI.†Conflicts of interest
There are no conflicts to declare.Acknowledgements
This work made use of the High Performance Computing Resource in the Core Facility for Advanced Research Computing at Case Western Reserve University. The author thanks Prof. Wesley Reinhart (Pennsylvania State University) for helpful discussions regarding the application of UMAP to interpreting local structural information.References
- J. Kim, J. A. Hanna, M. Byun, C. D. Santangelo and R. C. Hayward, Science, 2012, 335, 1201–1205 CrossRef CAS PubMed.
- A. S. Kuenstler, M. Lahikainen, H. Zhou, W. Xu, A. Priimagi and R. C. Hayward, ACS Macro Lett., 2020, 9, 1172–1177 CrossRef CAS PubMed.
- S.-J. Jeon and R. C. Hayward, Soft Matter, 2020, 16, 688–694 RSC.
- N. A. Cortez-Lemus and A. Licea-Claverie, Prog. Polym. Sci., 2016, 53, 1–51 CrossRef CAS.
- A. Bordat, T. Boissenot, J. Nicolas and N. Tsapis, Adv. Drug Delivery Rev., 2019, 138, 167–192 CrossRef CAS PubMed.
- F. Doberenz, K. Zeng, C. Willems, K. Zhang and T. Groth, J. Mater. Chem. B, 2020, 8, 607–628 RSC.
- J. Yu, Z. Wang and B. Chu, Macromolecules, 1992, 25, 1618–1620 CrossRef CAS.
- X. Wang, X. Qiu and C. Wu, Macromolecules, 1998, 31, 2972–2976 CrossRef CAS.
- D. S. Simmons and I. C. Sanchez, Macromolecules, 2008, 41, 5885–5889 CrossRef CAS.
- A. Halperin, M. Kröger and F. M. Winnik, Angew. Chem., Int. Ed., 2015, 54, 15342–15367 CrossRef CAS PubMed.
- Y. Pei, J. Chen, L. Yang, L. Shi, Q. Tao, B. Hui and J. Li, J. Biomater. Sci., Polym. Ed., 2004, 15, 585–594 CrossRef CAS PubMed.
- K. N. Plunkett, X. Zhu, J. S. Moore and D. E. Leckband, Langmuir, 2006, 22, 4259–4266 CrossRef CAS PubMed.
- Y. Zhang, S. Furyk, L. B. Sagle, Y. Cho, D. E. Bergbreiter and P. S. Cremer, J. Phys. Chem. C, 2007, 111, 8916–8924 CrossRef CAS PubMed.
- T. E. de Oliveira, D. Mukherji, K. Kremer and P. A. Netz, J. Chem. Phys., 2017, 146, 034904 CrossRef PubMed.
- H. G. Schild, M. Muthukumar and D. A. Tirrell, Macromolecules, 1991, 24, 948–952 CrossRef CAS.
- Y.-Y. Zhang, X.-M. Jia, R. Shi, S.-J. Li, H. Zhao, H.-J. Qian and Z.-Y. Lu, Macromol. Rapid Commun., 2020, 41, 1900655 CrossRef CAS PubMed.
- J.-F. Lutz and A. Hoth, Macromolecules, 2006, 39, 893–896 CrossRef CAS.
- J.-F. Lutz, Ö. Akdemir and A. Hoth, J. Am. Chem. Soc., 2006, 128, 13046–13047 CrossRef CAS PubMed.
- D. Roy, W. L. Brooks and B. S. Sumerlin, Chem. Soc. Rev., 2013, 42, 7214–7243 RSC.
- X. Lang, A. D. Patrick, B. Hammouda and M. J. Hore, Polymer, 2018, 145, 137–147 CrossRef CAS.
- C. Wu and X. Wang, Phys. Rev. Lett., 1998, 80, 4092 CrossRef CAS.
- L. Tavagnacco, E. Zaccarelli and E. Chiessi, Phys. Chem. Chem. Phys., 2018, 20, 9997–10010 RSC.
- C. Wu and S. Zhou, Phys. Rev. Lett., 1996, 77, 3053 CrossRef CAS PubMed.
- X. Qiu and C. Wu, Macromolecules, 1997, 30, 7921–7926 CrossRef CAS.
- R. Chen and E. B. Berda, ACS Macro Lett., 2020, 9, 1836–1843 CrossRef CAS PubMed.
- A. Nitti, R. Carfora, G. Assanelli, M. Notari and D. Pasini, ACS Appl. Nano Mater., 2022, 5, 13985–13997 CrossRef CAS.
- M. González-Burgos, I. Asenjo-Sanz, J. A. Pomposo, A. Radulescu, O. Ivanova, S. Pasini, A. Arbe and J. Colmenero, Macromolecules, 2020, 53, 8068–8082 CrossRef.
- J. Fischer, L. Han, T. Saito and M. Dadmun, Nanoscale Adv., 2022, 4, 5164–5177 RSC.
- B. Robles-Hernández, P. Malo de Molina, I. Asenjo-Sanz, M. Gonzalez-Burgos, S. Pasini, J. A. Pomposo, A. Arbe and J. Colmenero, Macromolecules, 2024, 57, 4706–4716 CrossRef PubMed.
- J. A. Pomposo, I. Perez-Baena, F. Lo Verso, A. J. Moreno, A. Arbe and J. Colmenero, ACS Macro Lett., 2014, 3, 767–772 CrossRef CAS.
- S. Liao, L. Wei, L. A. Abriata and F. Stellacci, Macromolecules, 2021, 54, 11459–11467 CrossRef CAS.
- T. P. Le, L. Cavalcanti, J. P. Tellam and P. Malo de Molina, Biomacromolecules, 2024, 25, 6602–6610 CrossRef CAS PubMed.
- Z. Dai and C. Wu, Macromolecules, 2010, 43, 10064–10070 CrossRef CAS.
- Z. Dai, T. Ngai and C. Wu, Soft Matter, 2011, 7, 4111–4121 RSC.
- A. Arbe, J. Rubio-Cervilla, A. Alegra, A. J. Moreno, J. A. Pomposo, B. Robles-Hernández, P. Malo de Molina, P. Fouquet, F. Juranyi and J. Colmenero, Macromolecules, 2019, 52, 6935–6942 CrossRef CAS.
- E. Verde-Sesto, A. Arbe, A. J. Moreno, D. Cangialosi, A. Alegra, J. Colmenero and J. A. Pomposo, Mater. Horiz., 2020, 7, 2292–2313 RSC.
- Y. Ruan, Q. Zou, H. Zhang, Y. Zhang, H. Zhang, W. Wu, H. Liu, J. Yan and G. Liu, Macromolecules, 2024, 57, 6583–6592 CrossRef CAS.
- B. Mei, A. J. Moreno and K. S. Schweizer, ACS Nano, 2024, 15529–15544 CrossRef CAS PubMed.
- H. Rabbel, P. Breier and J.-U. Sommer, Macromolecules, 2017, 50, 7410–7418 CrossRef CAS.
- J. T. Padding, Advanced Courses in Macroscopic Physical Chemistry (Han-Sur-Lesse Winterschool 2005), 2005, pp. 21–28 Search PubMed.
- J. T. Kalathi, S. K. Kumar, M. Rubinstein and G. S. Grest, Macromolecules, 2014, 47, 6925–6931 CrossRef CAS PubMed.
- J. T. Kalathi, S. K. Kumar, M. Rubinstein and G. S. Grest, Soft Matter, 2015, 11, 4123–4132 RSC.
- H.-P. Hsu and K. Kremer, Eur. Phys. J.: Spec. Top., 2017, 226, 693–703 Search PubMed.
- P. M. Rauscher, S. J. Rowan and J. J. de Pablo, ACS Macro Lett., 2018, 7, 938–943 CrossRef CAS PubMed.
- C. P. J. Wong and P. Choi, Macromol. Theory Simul., 2019, 28, 1800072 CrossRef.
- C. A. Miller and M. J. Hore, ACS Polym. Au, 2021, 2, 157–168 CrossRef PubMed.
- R. S. Mukkamala and M. J. Hore, Macromolecules, 2024, 57, 445–455 CrossRef CAS.
- Z. Li, Y.-H. Tang, H. Lei, B. Caswell and G. E. Karniadakis, J. Comput. Phys., 2014, 265, 113–127 CrossRef CAS.
- Z. Li, Y.-H. Tang, X. Li and G. E. Karniadakis, Chem. Commun., 2015, 51, 11038–11040 RSC.
- E. Cudjoe, S. Khani, A. E. Way, M. J. Hore, J. Maia and S. J. Rowan, ACS Cent. Sci., 2017, 3, 886–894 CrossRef CAS PubMed.
- F. Lahmar and B. Rousseau, Polymer, 2007, 48, 3584–3592 CrossRef CAS.
- J. Cheng, A. Vishnyakov and A. V. Neimark, Langmuir, 2014, 30, 12932–12940 CrossRef CAS PubMed.
- M. Langeloth, Y. Masubuchi, M. C. Böhm and F. Müller-Plathe, J. Chem. Phys., 2013, 138, 104907 CrossRef PubMed.
- A. Ramrez-Hernández, F. A. Detcheverry, B. L. Peters, V. C. Chappa, K. S. Schweizer, M. Müller and J. J. De Pablo, Macromolecules, 2013, 46, 6287–6299 CrossRef.
- J. Schneider, A. Z. Panagiotopoulos and F. Müller-Plathe, J. Phys. Chem. C, 2017, 121, 27664–27673 CrossRef CAS.
- P. Nikunen, I. Vattulainen and M. Karttunen, Phys. Rev. E: Stat., Nonlinear, Soft Matter Phys., 2007, 75, 036713 CrossRef PubMed.
- T. W. Sirk, Y. R. Slizoberg, J. K. Brennan, M. Lisal and J. W. Andzelm, J. Chem. Phys., 2012, 136, 134903 CrossRef PubMed.
- S. L. Brunton and J. N. Kutz, Data-driven science and engineering: Machine learning, dynamical systems, and control, Cambridge University Press, 2022 Search PubMed.
- M. Doi and S. F. Edwards, The Theory of Polymer Dynamics, Oxford University Press, 1988, vol. 73 Search PubMed.
- G. R. Strobl, The Physics of Polymers, Springer, 1997, vol. 2 Search PubMed.
- W. F. Reinhart, Comput. Mater. Sci., 2021, 196, 110511 CrossRef CAS.
- A. Statt, D. C. Kleeblatt and W. F. Reinhart, Soft Matter, 2021, 17, 7697–7707 RSC.
Footnote |
| † Electronic supplementary information (ESI) available: Details and results of UMAP procedure. See DOI: https://doi.org/10.1039/d4sm01308e |
| This journal is © The Royal Society of Chemistry 2025 |