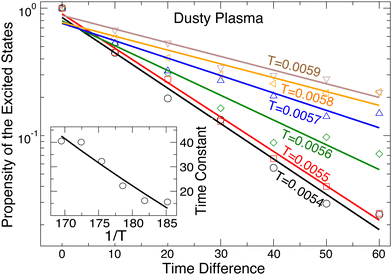
 Open Access Article
Creative Commons Attribution 3.0 Unported Licence
Collective motion and its connection to the energy landscape in 2D soft crystals†
Md. Rakib
Hassan
 *a,
Sam R.
Aronow
a,
Jack F.
Douglas
 b and
Francis W.
Starr
 *a
*a
aPhysics Department, Wesleyan University, Middletown, CT 06459, USA. E-mail: mhassan01@wesleyan.edu; fstarr@wesleyan.edu
bMaterials Science and Engineering Division, National Institute of Standards and Technology, Gaithersburg, MD 20899, USA
First published on 16th January 2025
Abstract
We examine the collective motion in computational models of a two-dimensional dusty plasma crystal and a charged colloidal suspension as they approach their respective melting transitions. To unambiguously identify rearrangement events in the crystal, we map the trajectory of configurations from an equilibrium molecular dynamics simulation to the corresponding sequence of configurations of local potential energy minima (“inherent structures”). This inherent structure (IS) trajectory eliminates the ambiguity that arises from localized vibrational motion. We find that the evolution of the IS trajectory in the crystal can be split into comparatively longer-lived ground states and shorter-lived discrete excited states. These discrete excited energy levels are a consequence of discrete numbers of defect clusters in the crystal. We find that the collective rearrangement occurs through different mechanisms: (i) small closed-loop motion in the ground states without the facilitation of defects, and (ii) much larger and complex open-ended particle motions in excited states that are facilitated by clusters of defects. In both cases, clusters of displacing particles can be separated into much smaller groups of replacing particles with a loop-like structure. In contrast to glass-forming liquids, the mass of the rearranging groups grows on heating towards the melting temperature rather than cooling. We find that crystal melting in these systems can be anticipated by the merging of the average time the crystal spends in the ground state with the average time in the excited states.
1 Introduction
Understanding the collective dynamics of particle rearrangements in both amorphous and crystalline materials, including supercooled liquids, gels, and colloidal systems, has been an active research topic for many years.1–9 It is observed that the constituent atoms, molecules, or colloids with the greatest displacements over a specified time window are spatially correlated, often in the form of particle exchange motions termed “strings” because of their polymeric structure.10,11 However, the continuum range of collective particle displacements on a hierarchy of timescales often makes it challenging to unambiguously identify specific groups of collectively rearranging particles. This difficulty has led to various criteria for identifying clusters of cooperatively rearranging particles.7,10,12–15 Typically, a fraction of particles with the greatest displacement over a specific time window are examined, where the displacement results from the accumulation of multiple small displacements that are difficult to uniquely identify. Nonetheless, a consistent picture has emerged regarding how the average size of the rearrangements varies with temperature or density/packing fraction. To improve the understanding and quantification of this collective motion and its implications, it is valuable to examine a system where rearrangement events can be unambiguously identified in both space and time.To this end, we investigate model crystalline materials in two dimensions as minimal systems exhibiting collective particle exchange motion; we consider two variations that represent either a dusty plasma crystal (DPC) or a charged colloidal crystal16–20 which exhibits similar dynamic features. These crystals offer several simplifying features that make them ideal model systems: crystals have well-defined lattice positions that provide an underlying template for stable locations and two-dimensional materials allow for convenient visualization and quantification of dynamic heterogeneity in both space and time. We can further simplify the identification of rearranging groups by mapping the snapshots of a trajectory of particles onto the so-called “inherent structure” (IS) trajectory through energy minimization of each snapshot.21 The combination of these factors allows us to directly relate the collective motion to discrete states in the potential energy landscape (PEL).
The spatial and temporal heterogeneity in particle displacements of quasi-2D DPC and colloidal crystals have been widely examined,6,22–24 and it is known that string-like collective particle exchange motion is prevalent.23,25,26 Large-scale particle rearrangements have also been observed in 3D.24,27–29 van der Meer et al.30,31 identified two mechanisms of collective motion in 2D colloids: (i) closed-loops of particles and (ii) open-ended string-like particle rearrangement facilitated by pairs of high- and low-density defects, also termed vacancy (low-density) and interstitial (high density) defects. Qi et al.32 simulated the dynamics of melting in a 2D dusty plasma crystal (DPC) and found that, by mapping the real trajectory to the IS trajectory, defects can be labeled as either stable (if they persist in the IS) or unstable (if they do not persist in IS). In other words, defects in the actual trajectory may be associated either with local vibrational motions or with genuine particle rearrangement events involving irreversible particle displacements, and thus it is important to distinguish these distinct types of motions and associated defects.
Our findings both reaffirm and extend these prior observations. We show that closed-loop replacement motions of dust particles can occur without facilitation by stable defects, but these motions contribute minimally to the overall rearrangement within the crystal; these loops span a very short time duration and occur independently of each other. Much larger string-like particle rearrangement events can be identified by longer-lived energy excitations away from the ground state and are apparently facilitated by stable defect clusters. These excitation events provide the dominant contribution to displacements within the crystal. In particular, our results show that motion facilitated by only a single pair of vacancy-interstitial defect clusters (as described by van der Meer et al.30,31) occurs only in the first excited state. Far from melting, this is the dominant mechanism for motion, but the picture becomes increasingly complex approaching the melting transition where higher energy levels become important. We show that the number of stable defect clusters grows linearly with the energy level and that the motion cannot be described solely by the creation of pairs of vacancy-interstitial defect clusters. The defects in higher energy excited states can take a variety of structures, including dipoles and trimers with differing stability. The size of both small loops and large string-like rearrangement events grows approaching the melting transition. We also find that the temperature T dependence of the mean time in the ground state between excitations, a measure of the temporal heterogeneity, directly tracks the T dependence of traditional measures of the heterogeneity time scale. In contrast, the mean time in excited states has opposite T dependence, and the time scales for ground and excited states coincide near the melting transition. Our findings offer an avenue to better understand how earlier measures of dynamic heterogeneity relate to directly observed collective displacements within our model crystalline material. At the same time, we recognize that the origin of the collective motion in the crystalline context is not necessarily the same as in amorphous glass-forming materials, but it is our expectation that insights from one system are instructive for the other.
2 Model and simulation details
We simulate 2D crystal systems using intermolecular pair potentials that mimic the properties of (i) a dusty plasma crystal33–35 and (ii) a colloidal crystal.31 To carry out our simulations, we use the LAMMPS (large-scale atomic/molecular massively parallel simulator) simulation package.36 We first describe the model and simulations for the dusty plasma, followed by the colloidal system.In the DPC case, repulsive interactions among the dust grains dominate due to an excess of electrons that accumulate on the dust grain surface, which are attenuated by positive ions in the plasma. We will refer to these grains as particles to avoid potential confusion with ordered grains in semi-crystalline materials. Despite the complexity of the dusty plasma, the interactions among the particles can often be reasonably described by a simple Yukawa potential37–40
 | (1) |
![[thin space (1/6-em)]](https://www.rsc.org/images/entities/char_2009.gif) 700e (where e is electron charge) and κ = 2.38 mm−1. The crystal state is defined by a triangular lattice with area number density of dust particles, nd = 3.5 × 10⁶ m−2 and a 2D Wigner–Seitz radius of
700e (where e is electron charge) and κ = 2.38 mm−1. The crystal state is defined by a triangular lattice with area number density of dust particles, nd = 3.5 × 10⁶ m−2 and a 2D Wigner–Seitz radius of  mm, which corresponds to a lattice spacing of
  . The dust particle mass m = 5.2 ± 0.5 × 10⁻¹³ kg. We emphasize that this form of pair potential approximates dusty plasmas in three dimensions and that our choice of potential is made to apply to quasi-two dimensional dusty plasma materials.
For our simulations, we use N = 3286 particles in a nearly square box with dimensions 30.99 × 30.59 mm, and we invoke periodic boundary conditions in both directions. We carry out our simulations using the natural units of the DPC; specifically, we measure the length in units of the Wigner–Seitz radius a, mass in units of the dust particle mass m, and energy in units of U0 = Q2/4πε0a, which then defines time in units of  , where ωpd = 89 s−1 is the inverse dust plasma frequency. Temperature is measured in units of U0/kB, where kB is Boltzmann's constant and temperature is controlled using the Nosé–Hoover method. Our simulations cover a temperature range of 0.0052 ≤ T ≤ 0.0065. We use a time step dt = 0.107, and all systems are at fixed density nd = 1/π. To provide sufficient statistics, at each temperature, we simulate 40 independent samples for 50 million time steps.
As in the experiments, melting is driven by temperature, and the dusty plasma remains crystalline for T ≲ 0.0059 in our reduced units. In simulations, it has been shown that the crystal transitions to an intermediate hexatic phase before becoming fluid; this is a subject of some controversy, particularly in the experimental system. Our intent is to focus on the dynamics in the crystal state, and not to debate the precise nature of the melting transition.
For the charged colloidal crystal case, the colloid charge interactions are attenuated by the embedding solution so that a Yukawa potential again captures most of the essential interactions. Unlike the dusty plasma, the colloidal core interactions cannot be neglected, and hence the potential can be described by,30,41,42
 | (2) |
 . We use reduced units where mass is in units of the mass of a colloidal particle and length is in units of particle diameter. Like the DPC, we use N = 3286 colloidal particles and the box size varies from 145.098 × 146.997 (ϕ = 0.121) to 138.92 × 140.74 (ϕ = 0.132). To emulate the solvent forces in a colloidal suspension we use Brownian dynamics where the LAMMPS damping parameter time scale tdamp = 1.0 and the timestep dt = 0.005; we need a smaller time step than the plasma system due to the core interactions. We also considered Nosé–Hoover dynamics and found that our qualitative findings were not affected by the choice of the integration method. To provide sufficient statistics, at each packing fraction, we simulate 20 independent samples for 65 million time steps.
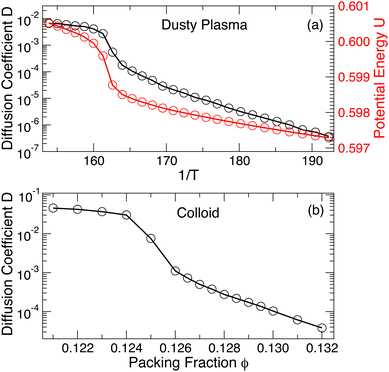
Now that we have defined both systems, we next examine the change in potential energy and diffusion coefficient (with temperature for the dusty plasma and with packing fraction for the colloidal system) to gain an initial understanding of the dynamics in different phases. Fig. 1(a) shows that the approximate location of melting in the DPC is evident from the increase in potential energy or the diffusion coefficient D (determined from the mean-squared displacement (MSD) 〈r2(t)〉, see Fig. S1, ESI†). Previously, van der Meer et al.31 reported that the colloidal system is crystalline for ϕ > 0.128, which is consistent with our simulation results. Because melting is driven by changing ϕ, which in turn alters the interparticle spacing, the potential energy is a very strong function of ϕ; consequently, the potential energy provides a less apparent indication of melting. Thus, Fig. 1(b) only shows the diffusion coefficient, which increases due to melting. Like the DPC, the fluidization appears to occur via an intermediate hexatic phase, which has been discussed in van der Meer et al.31 We consider other more precise metrics to identify melting in the final discussion section of the manuscript.
Even in the crystalline state, it can be difficult to distinguish large local vibrations from hopping among crystal locations. To better separate these types of motion, we map the real trajectory R(t) of particles to the “inherent structure trajectory”'.21 The term inherent structure (IS) refers to the configuration at the nearest potential energy minimum to a given instantaneous configuration,43,44 and in practice the IS is found by energy minimization. In LAMMPS, we minimize energy using the conjugate gradient method. The IS trajectory RI(t) results from energy minimization of the configurations of the original trajectory R(t), yielding two parallel time series as illustrated in Fig. 2. In the IS trajectory, the system evolves from one IS to another, eliminating local vibrations. Deep in the crystal state, the IS trajectory primarily stays in the defect-free ground state with short-lived excitations due to defects; the duration of excited states increases as melting is approached, as will be discussed in detail.
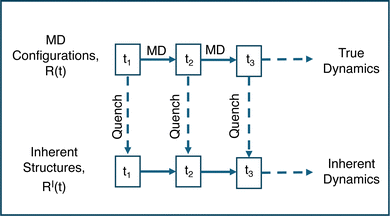 | ||
| Fig. 2 Schematic representation to explain how the inherent structure trajectory RI(t) is generated from the real trajectory R(t), adapted from Schrøder et al.21 All dynamics occur in R(t), which are mapped to RI(t) via energy minimization at each time tn. | ||
3 Results and discussion
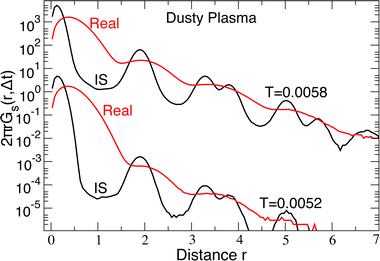
To explore the nature of collective motion in these crystals, we first need an unambiguous way to identify those particles that have moved from their lattice positions. To do so, we calculate the probability density of particle displacements 2πrGs(r, Δt) where Gs(r, Δt) is the self-part of the van Hove correlation function. In Fig. 3, we plot Gs(r, Δt) of the DPC for both the real R(t) and IS RI(t) trajectories at the lowest temperature (T = 0.0052) and a higher temperature (T = 0.0058) near the melting transition at Δt = 1750; the precise value of Δt does not matter, provided it is large enough that one can distinguish distinct peaks of 2πrGs(r, Δt). For the real particle trajectory, the distinction between the first and second peaks in the displacement distribution is difficult to identify due to lattice vibrations. In contrast, the displacement distribution in the IS trajectory shows a broad minimum from 0.7 ≲ r ≲ 1.3 where the probability is reduced by several orders of magnitude, providing a clear distinction between a particle that is localized near its starting lattice position and one that has moved to a new lattice location. The broad minimum means that we can select a displacement cutoff to distinguish localized versus displaced particles anywhere in the range 0.7 ≲ r ≲ 1.3 without qualitatively altering our findings; we choose the lower bound rcut = 0.7 to capture as many displaced particles as possible. A similar analysis for the colloidal systems shows that a cutoff of 1.5 clearly distinguishes displacing particles from local vibrations.Having established a simple criterion to distinguish localized from displaced particles, we simply visualize the particles in the DPC that displace from their initial lattice location as a prototypical example of collective motion observed in a much broader class of materials. In previous studies, displaced particles were identified by comparing two configurations separated by a characteristic time scale for motion; Fig. 4(a) shows an example of the displaced particles using such an approach. Unfortunately, this representation loses information about when the displacements actually occur over the time interval. Because our crystals are in 2D, it is comparatively easy to show the full space-time evolution of particle displacements, as shown in Fig. 4(b), where the horizontal axis represents time. It is apparent from the image that, in the present case, the particle displacements occur primarily in two temporally distinct periods. In this sense, it is apparent that there is heterogeneity in both the spatial distribution of particle motions and the times during which motion occurs. Fig. 4(c) shows the corresponding time series for the inherent structure energy EIS(t), demonstrating that periods of large-scale motion correspond directly to an increase in EIS from the ground state. The same feature occurs for the colloidal system.
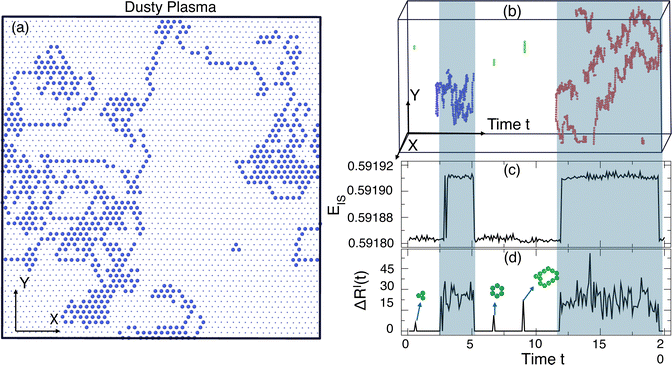 | ||
| Fig. 4 (a) All the displaced particles in 2D within a slice of the time window of Δt = 20, (b) space-time visualization of the displaced particles in 3D over the same time interval where the time axis runs horizontal and allows one to see both where and when displacements occur. (c) The time evolution of the IS energy EIS(t) and (d) the configuration-to-configuration displacements ΔRI(t). The highlighted blue regions show that excited energy states correspond to extensive particle displacements, illustrated by the example clusters of red and blue particles. In addition, there are much smaller and short-lived closed-loop rearrangements that can occur in the ground state, illustrated by the green particles. Panels (a) and (b) were generated using OVITO.45 | ||
We can relate the displacing groups more directly to the energy state by evaluating the time series for the displacement between consecutive configurations
 | (3) |
Using our approach to identify transient particle motion, we next seek to quantify the average size and structure of groups of rearranging particles in the DPC. Since the size and structure of displacing particle groups in the ground and excited states are qualitatively different, we analyze the motions in the ground and excited states separately. First, for each excitation from the ground state (a rearrangement event), we evaluate the number of particles that have displaced at any time during the event. If a particle moves multiple times during the event, it makes multiple contributions to the overall number of displacing particles in that event. This also means that a particle may displace from and return to the same location; in practice, such returning particles are infrequent, comprising less than 3% of all displacing particles. Typically, a rearrangement event is dominated by a single large cluster. These large clusters can be decomposed into sub-groups of particles that have replaced each other. Such clusters of geometrically exchanging particles are commonly referred to as strings10 because of the quasi-linear topology of the particle exchange clusters. Two particles belong to the same string if one particle is replaced by another within a spatial tolerance of δ ≤ 0.5 (much less than the separation between neighboring particles); in addition, the displacements must occur within Δt < 1700 (less than the time for diffusion to emerge from the MSD). We tested that the spatial thresholds for replacement have a minimal quantitative effect on our findings for 0.50 < δ < 1.60. As qualitatively indicated above, this definition confirms that displacement events in the ground state only occur in closed loops of replacing particles. Hence, all groups of displacing particles, whether in the ground or excited states, can be sorted into distinct strings.
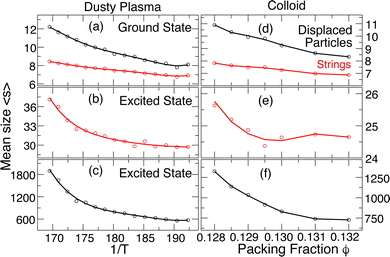
Using these definitions for the sizes of displacing particle events and the constituent string subgroups, Fig. 5(a) shows that the average size of strings 〈s〉 in the ground state grows only weakly with heating, and the behavior of the total number of displacing particles is similar; the number of displacing particles is slightly larger than the string size since, occasionally, a displacing particle group in the ground state can be decomposed into multiple strings. The average size is modest, only exceeding 10 near melting. In the excited states, the properties of the rearranging groups are quite different from those of the ground-state rearrangements. First, since the number of displacing particles in an excited state rearrangement event can be split into many strings, the average string size 〈s〉 (Fig. 5(b)) in the excited state is smaller by an order of magnitude than the number of displacing particles (Fig. 5(c)); the string size in the excited state is larger than the string size in the ground state by a factor of ≈4. In addition, the T dependence of the size of displaced particles and strings is quite different. The average string size 〈s〉 grows only modestly on heating (≈20%), similar to the scale of growth of the strings in the ground state. In contrast, the number of displacing particles grows by nearly a factor of 3, which requires that the number of strings, rather than their size, increases rapidly as we approach the melting transition. While there are collective rearrangements in both the ground and excited states, the collective rearrangements in the excited state are by far the dominant contribution to the MSD and hence the diffusion coefficient. We include the same data for the colloidal crystal in Fig. 5(d–f), and the conclusions that we made for the DPC are generally the same for this case. The growth of the size of rearranging regions on heating contrasts with the temperature dependence of the size of collective motion in the alpha-relaxation time scale of glass-forming fluids (which grow on cooling); that said, smaller collective motion at the vibrational time scale (“stringlets”) that grow on heating have been previously observed.46
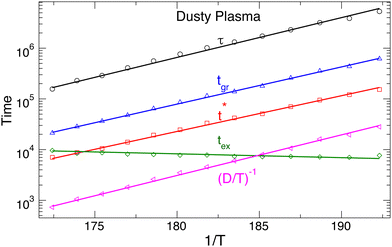
Having established the growing size of rearranging particle clusters as we approach melting, we next seek to quantify the average duration of the ground and excited states and how these time scales relate to other common measures of relaxation and the time scale for dynamic heterogeneity. We first evaluate the average time the system spends in the ground states tgr and in the excited states tex. As might be expected, Fig. 6 shows that, on heating toward the melting transition, tgr decreases while tex increases (opposite T dependence), consistent with the growing importance of excited states for melting. The distribution of tgr values is approximately exponential, indicating that transitions from the ground to excited states are governed by a Poisson process. It is instructive to compare the ground state time tgr to other characteristic relaxation times, including the “diffusive time scale” (D/T)−1 (obtained from 〈r2(t)〉), the relaxation time τ of the self-intermediate scattering function Fs(q0,t) (where q0 is the wavenumber of the first peak of the structure factor), and the characteristic timescale t* of the non-Gaussian parameter α2(t), a commonly used measure of the timescale for dynamic heterogeneity. The data for 〈r2(t)〉, Fs(q0,t), and α2(t) are all provided in the ESI.† These characteristic times are also plotted in Fig. 6, from which it is apparent that these times have a very similar Arrhenius temperature dependence to tgr. That said, there are small differences in the T dependence of these characteristic times, although it is not readily apparent from Fig. 6. By parametrically plotting each of these time scales as a function of the ground-state time tgr (see Fig. S4, ESI†), we find that t* scales linearly with tgr. Thus, the heterogeneous distribution of ground-state times leads to tgr proportional to t*, consistent with the expectation that t* should capture the temporal nature of heterogeneity of molecular displacements. In contrast, τ and (D/T)−1 have slightly different T dependence from that of tgr. We observe a power-law relation (D/T)−1∼tgr1.08, and a similar result for τ. The difference of the exponent from 1 is small, so the deviation from linearity is modest, indicating a rather strong coupling among all these dynamic time scales. Previous studies8,9,47 found that the diffusive timescale (D/T)−1 and relaxation time τ varies proportionally with temperature in the crystal state (so that there is a linear parametric relation between them), and the same holds here. These qualitative observations are also true for the colloidal crystal.
A natural question is whether excitations from the ground state are driven by specific structural features or if they occur more stochastically. This has been explored in glass-forming systems, where Harrowell and colleagues developed the “isoconfigurational ensemble” approach to test the correlation between transient mobile regions in a liquid and the underlying fluid structure.48 Here, we apply a similar approach to examine the temporal correlation for the transitions from the ground state to excited states. To do so, we consider configurations where a transition to the excited state has just occurred. We then chose configurations that preceded this transition by a chosen time interval. For each such configuration, we generate an ensemble of different sets of Gaussian-distributed velocities with the same temperature, hence the term isoconfigurational ensemble. We allow each member of the ensemble to evolve and track the fraction of simulations that transition to an excited state within a generous Δt = 1000. By doing this for many different intervals preceding the original excited state, we can see how rapidly the structural correlation to reach the excited state diminishes. As shown in Fig. 7, the fraction of transitioning ensemble members decreases exponentially as we increase the time preceding the original transition. As the temperature increases toward melting, the correlation time increases due to the overall higher probability of making transitions to the excited states. That said, at all T the correlation timescale is on the order of 101, shorter by several orders of magnitude than any other timescale discussed earlier. Thus, we can conclude that transitions at all T are dominated by stochastic rather than structural considerations, which is also consistent with the Poisson process indicated by the distribution of ground state times.
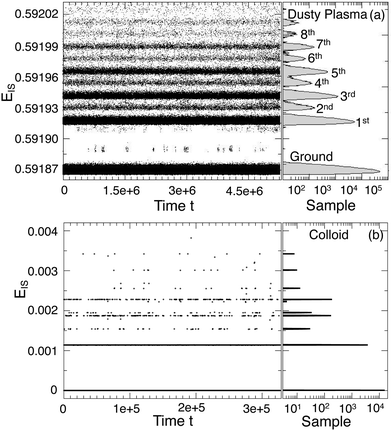
Up to this point, we have only distinguished between the ground and excited states. Examination of the excited states shows that they are separated into well-defined discrete energy bands, rather than a simple continuum of excitations. Fig. 8(a) shows a scatter plot of all EIS values from different T and runs in a single collected time series, from which distinct energy bands clearly emerge for both the dusty plasma and colloidal systems. The right panel of Fig. 8(a) shows the histogram of EIS values exhibiting distinct peaks for each energy band; note that the histogram is plotted on a logarithmic scale, emphasizing the separation between the bands. In Fig. 8(b), we include the same data for the colloidal crystal at different packing fractions. Because the potential energy changes strongly with the packing fraction, we normalize  to align the energy of each state across the packing fractions. It is apparent that the energy bands are more sharply defined in the colloidal system than in the dusty plasma. We attribute this difference to the difference in the softness of the potentials; the DPC potential is extremely soft, since there are no core interactions, which allows for greater spread in the ground state energies, whereas the core interactions of the colloidal system make the ground state very sharply defined. The discretization of the (purely classical) crystal energies is likely a general phenomenon, as first suggested by Stillinger and Weber.49 Nieves and Sinno50 also observed energy quantization associated with defect formation in 3D crystalline materials but did not consider the relation to cooperative motion.
It is natural to expect that the quantization of EIS has a structural origin. Indeed, it has already been established that structural defects play a vital role in the emergence of collective rearrangements,8,31,51,52 and these defects must affect the system energy. In the ground state, there are no defects and each particle has six neighbors. In excited states, defects are characterized by particles with either additional or missing neighbors, most commonly leading to a particle having 5 or 7 neighbors (sometimes referred to as a Stone–Wales defect).53,54 We identify these defected particles by a Voronoi analysis. In the IS trajectory, these defects do not form in isolation but rather emerge as clusters of defects. One might naturally expect the formation of 5–7 defect pairs but defect clusters are typically more complex.
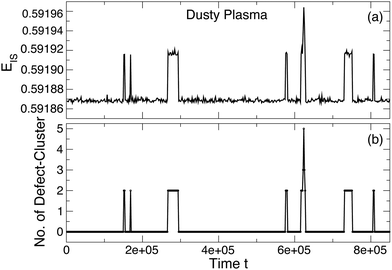
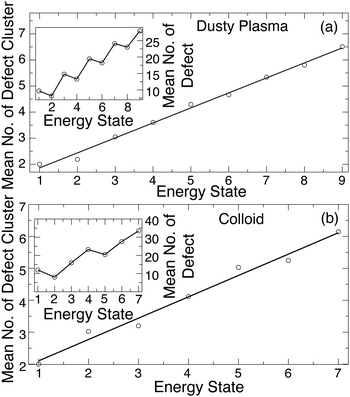
To show the connection between defects and the excited energy states, Fig. 9 shows an example time series for EIS in parallel to the number of defect clusters (rather than simply the number of defects). These data suggest that the first excited state consists of only a pair of defect clusters and that higher energy excited states result from increasing numbers of defect clusters and their interaction. We quantify this trend by plotting the average number of defect clusters as a function of the energy state index in Fig. 10(a) for the DPC and Fig. 10(b) for the colloidal crystal. These data show an approximately linear relationship between the number of defect clusters and the energy state. These data also show that while the first excited state emerges from the creation of a pair of defect clusters, additional defect clusters are not necessarily generated in pairs.
It is not obvious that the number of defect clusters, as opposed to the overall number of defects, is the relevant parameter determining the energy state. Indeed, our initial attempts focused on simply the number of defects, which does not show a simple relation to the energy level. The number of defect clusters, rather than the number of defects, determines the energy state because defect clusters come predominantly in specific sizes.
Generally, defect clusters can be categorized by the change in local density. Most commonly, defect clusters come in pairs with one cluster having decreased density (also termed a “vacancy”) and the other having increased density (“interstitial”). Both Zhang et al.8 and van der Meer et al. showed that collective motion in the excited state (a reflection of what we observe in the IS trajectory) can occur via the creation, migration, and annihilation of these defects. The structure of these defects is variable in the instantaneous configurations.31 The structure of clusters in the minimized configurations is far simpler to understand. For the colloidal system, nearly all defect clusters are size 6 (three 5–7 defect pairs), where vacancies feature a 6-membered ring with a hole in the middle, and interstitials have an extra (non-defect) particle at the center of the ring. For the DPC where the lack of core interactions makes the potential comparatively soft, the situation is somewhat more complex. In this case, most defects are created in pairs of clusters of size 6 and 4 (two 5–7 defect pairs); in this case, clusters of size 6 are predominantly interstitials (85%), while clusters of size 4 are predominantly vacancy clusters (60%). We note that vacancy clusters in the DPC do not exhibit an explicit hole, but are simply locally less dense. In addition, the DPC also features a non-trivial fraction of clusters of size 3 (one 5–8–5 defect string) and dipoles of a single 5–7 defect pair, which we quantify in the ESI.†
Since experiments cannot readily use energy minimization to distinguish stable and unstable defects, it is helpful to note that defect structure distinguishes most unstable defects in the instantaneous configurations. Specifically, nearly all the unstable defects in the instantaneous configurations have the form of two 5–7 defect pairs (clusters of four defected particles total) which have a nearly square shape (see ESI† for an illustration). For the colloid case where all stable defects are clusters of size six, one can immediately identify these unstable 4-clusters in the instantaneous configuration. For the dusty plasma, there are a number of such 4-clusters that are stable, so one cannot eliminate all unstable clusters just based on the structure in this case. It would be valuable to examine this criterion with experimental data.
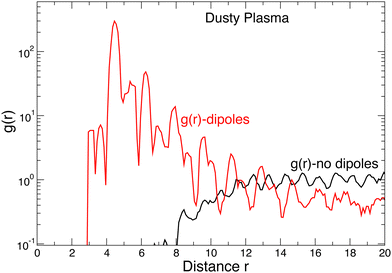
The simple picture of defects consisting of a single interstitial–vacancy pair of clusters does not hold at higher energy levels. Beyond the first excited state, dipole clusters in particular become important. This is apparent from the fact that near melting, where higher excited states are common, the fraction of defects in the form of chains of dipoles becomes substantial; this is perhaps not surprising since the chaining of dipoles is the natural mode of self-assembly in dipolar fluids.55,56 Such geometrically polymeric dynamic structures or “strings” have often been observed in dusty plasmas and other near two-dimensional particulate crystalline materials57 but do not seem to be predicted by conventional models of melting of two-dimensional crystals. These dipole clusters do not contribute to the collective rearrangements via “walking” through the crystal in the way that the larger 4- or 6-member clusters do. Instead, dipoles usually occur in nearby (but distinct) pairs of dipoles that quickly annihilate each other. The correlation between dipoles can be seen in Fig. 11, which shows the pair correlation function g(r) between the center-of-mass of dipole clusters, as well as g(r) for all other clusters: for dipoles, g(r) is very strongly peaked at r ≈ 4.5. In contrast, g(r) for all other clusters is nearly featureless, showing that non-dipole defect clusters behave as a nearly ideal gas within the crystal; for r ≲ 8, g(r) vanishes because defect clusters can annihilate when they are close.
4 Discussion and conclusions
We have examined the spatio-temporal features of dynamic heterogeneity in soft 2D crystals which allowed us to directly connect the dynamic heterogeneity to the states sampled in the potential energy landscape. The mapping of the equilibrium trajectory to the IS trajectory of locally stable states greatly facilitates the analysis, as it eliminates trivial defects from the equilibrium crystal leaving only “stable” defect clusters that go hand-in-hand with particle rearrangements. This analysis also reveals the existence of discrete energy levels of the defects, a phenomenon first suggested in the energy landscape analysis of crystals by Stllinger and Weber.49 It is perhaps surprising that particle rearrangements can occur even in the ground state of the crystal; these rearrangements necessarily take the form of closed loops so that no defects (which would increase the energy) are created in the process. (Technically, there must be some very short-lived defect in the structure as the rapid hop occurs, but capturing such an effect would require very frequent sampling of configurations). Open-ended particle rearrangements occur in the excited states of the crystals where defects accompany the motion. In a chicken-versus-egg discussion, one cannot meaningfully assign causation: in the IS trajectory, defects and (open-ended) rearrangements occur together and are inexorably linked. Similar large-scale particle rearrangements have been observed in experiments and connected to changes in the relaxation and modulus in both colloidal crystals28 and glass-forming materials.29Overall, the defect energies somewhat resemble a quantum anharmonic oscillator where the regular spacing of energies occurs at low energies, gradually giving rise to a nearly continuous density of energies as the melting limit is approached. The observation of quantized energies of excited energy states has been reported before in simulations of ordered nanoparticles58 and folded proteins59 so energy quantization in these classical dynamical systems seems to be a common phenomenon at low temperatures where the material approaches a non-ergodic integrable dynamics60–62 state at which relaxation times become formally infinite. A similar phenomenon may also be possible in glass-forming liquids at sufficiently low temperatures.63
Obviously, these particle rearrangements must ultimately lead to the melting of the crystal when the number of particles in these dynamic structures becomes sufficiently large. In this sense, the balance between the defect-free ground state and the excited states where motion occurs must have a connection to melting. Fig. 6 already showed that the average time in the ground tgr and excited tex states have opposite T dependence as we approach the melting transition. By extending these data to higher T, Fig. 12(a) shows that tgr and tex cross T ≈ 0.00595, coinciding with the melting of the crystal. To more carefully assess this possibility, we evaluate the translational order parameter
 | (4) |
| χT = N(〈|ψT|2〉 − 〈|ψT|〉2). | (5) |
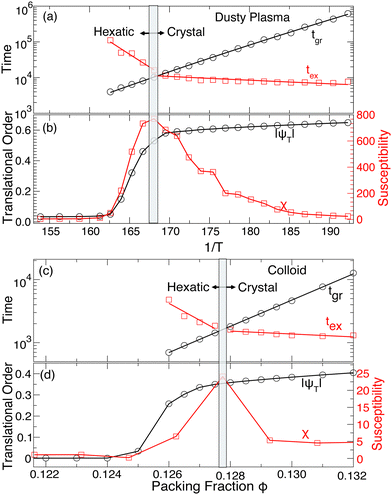 | ||
| Fig. 12 (a) The T-dependence ((c) the ϕ -dependence) of the average lifetime spent in the ground state (tgr) and excited state (tex). tex crosses tgr at the crystal-to-hexatic phase transition in the dusty plasma (the colloid system). (b) The location of the crystal-to-hexatic transition is identified by the drop in the magnitude of the translational order parameter |ψT| and the corresponding peak in the translational susceptibility χT at T ≈ 0.00595 for dusty plasma. (d) The same thing was found for the colloid system at ϕ ≈ 0.128. The susceptibility data was adopted from the work of Meer et al.31 | ||
Data availability
Data used in this study will be made available upon request to the corresponding author.Conflicts of interest
There are no conflicts of interest to declare.Acknowledgements
We thank D. Leporini for helpful discussion of this work. We acknowledge funding support from NIST award 70NANB24H025.Notes and references
- H. Sillescu, J. Non-Cryst. Solids, 1999, 243, 81–108 CrossRef CAS.
- M. D. Ediger, Annu. Rev. Phys. Chem., 2000, 51, 99–128 CrossRef CAS PubMed.
- R. Zangi and S. A. Rice, Phys. Rev. Lett., 2004, 92, 035502 Search PubMed.
- A. Widmer-Cooper and P. Harrowell, J. Phys.: Condens. Matter, 2005, 17, S4025 CrossRef CAS.
- C. J. Dibble, M. Kogan and M. J. Solomon, Phys. Rev. E: Stat., Nonlinear, Soft Matter Phys., 2008, 77, 050401 Search PubMed.
- J. Kim, C. Kim and B. J. Sung, Phys. Rev. Lett., 2013, 110, 047801 CrossRef.
- F. W. Starr, J. F. Douglas and S. Sastry, J. Chem. Phys., 2013, 138, 12A541 CrossRef PubMed.
- H. Zhang, M. Khalkhali, Q. Liu and J. F. Douglas, J. Chem. Phys., 2013, 138, 12A538 CrossRef.
- H. Zhang, X. Wang, H.-B. Yu and J. F. Douglas, J. Chem. Phys., 2021, 154, 084505 CrossRef CAS.
- C. Donati, J. F. Douglas, W. Kob, S. J. Plimpton, P. H. Poole and S. C. Glotzer, Phys. Rev. Lett., 1998, 80, 2338 CrossRef CAS.
- B. A. Pazmiño Betancourt, J. F. Douglas and F. W. Starr, J. Chem. Phys., 2014, 140, 204509 CrossRef PubMed.
- W. Kob, C. Donati, S. J. Plimpton, P. H. Poole and S. C. Glotzer, Phys. Rev. Lett., 1997, 79, 2827 CrossRef CAS.
- Y. Gebremichael, T. B. Schrøder, F. W. Starr and S. C. Glotzer, Phys. Rev. E: Stat., Nonlinear, Soft Matter Phys., 2001, 64, 051503 CrossRef CAS PubMed.
- H. Zhang, D. J. Srolovitz, J. F. Douglas and J. A. Warren, Proc. Natl. Acad. Sci. U. S. A., 2009, 106, 7735–7740 CrossRef CAS PubMed.
- C. R. Berardi, K. Barros, J. F. Douglas and W. Losert, Phys. Rev. E: Stat., Nonlinear, Soft Matter Phys., 2010, 81, 041301 CrossRef.
- C.-L. Chan, W.-Y. Woon and I. Lin, Phys. Rev. Lett., 2004, 93, 220602 CrossRef PubMed.
- R. Xie and X.-Y. Liu, J. Am. Chem. Soc., 2009, 131, 4976–4982 CrossRef CAS PubMed.
- K. Chen, M. L. Manning, P. J. Yunker, W. G. Ellenbroek, Z. Zhang, A. J. Liu and A. G. Yodh, Phys. Rev. Lett., 2011, 107, 108301 CrossRef.
- X. Cao, H. Zhang and Y. Han, Nat. Commun., 2017, 8, 362 CrossRef.
- M. Mondal, C. K. Mishra, R. Banerjee, S. Narasimhan, A. Sood and R. Ganapathy, Sci. Adv., 2020, 6, eaay8418 CrossRef CAS.
- T. B. Schrøder, S. Sastry, J. C. Dyre and S. C. Glotzer, J. Chem. Phys., 2000, 112, 9834–9840 CrossRef.
- B. Cui, B. Lin and S. A. Rice, J. Chem. Phys., 2001, 114, 9142–9155 CrossRef CAS.
- C.-L. Chan, C.-W. Io and L. I, Contrib. Plasma Phys., 2009, 49, 215–234 CrossRef CAS.
- K. V. Edmond, C. R. Nugent and E. R. Weeks, Phys. Rev. E: Stat., Nonlinear, Soft Matter Phys., 2012, 85, 041401 CrossRef.
- H. M. Thomas and G. E. Morfill, Nature, 1996, 379, 806–809 CrossRef CAS.
- C. Yang, C.-W. Io and L. I, Phys. Rev. Lett., 2012, 109, 225003 CrossRef.
- E. R. Weeks, J. C. Crocker, A. C. Levitt, A. Schofield and D. A. Weitz, Science, 2000, 287, 627–631 CrossRef CAS PubMed.
- J. Sprakel, A. Zaccone, F. Spaepen, P. Schall and D. A. Weitz, Phys. Rev. Lett., 2017, 118, 088003 CrossRef.
- R. Higler, J. Krausser, J. van der Gucht, A. Zaccone and J. Sprakel, Soft Matter, 2018, 14, 780–788 RSC.
- B. Van Der Meer, W. Qi, R. G. Fokkink, J. Van Der Gucht, M. Dijkstra and J. Sprakel, Proc. Natl. Acad. Sci. U. S. A., 2014, 111, 15356–15361 CrossRef CAS.
- B. van der Meer, W. Qi, J. Sprakel, L. Filion and M. Dijkstra, Soft Matter, 2015, 11, 9385–9392 RSC.
- W.-K. Qi, Z. Wang, Y. Han and Y. Chen, J. Chem. Phys., 2010, 133, 234508 CrossRef.
- U. Konopka, G. Morfill and L. Ratke, Phys. Rev. Lett., 2000, 84, 891 CrossRef CAS PubMed.
- Z. Haralson and J. Goree, Phys. Rev. Lett., 2017, 118, 195001 CrossRef.
- V. Zhuravlyov, J. Goree, J. F. Douglas, P. Elvati and A. Violi, Phys. Rev. E, 2022, 106, 055212 CrossRef CAS.
- A. P. Thompson, H. M. Aktulga, R. Berger, D. S. Bolintineanu, W. M. Brown, P. S. Crozier, P. J. Int Veld, A. Kohlmeyer, S. G. Moore, T. D. Nguyen, R. Shan, M. J. Stevens, J. Tranchida, C. Trott and S. J. Plimpton, Comput. Phys. Commun., 2022, 271, 108171 CrossRef CAS.
- H. Totsuji, T. Kishimoto and C. Totsuji, Phys. Rev. Lett., 1997, 78, 3113 CrossRef CAS.
- S. Hamaguchi, R. Farouki and D. Dubin, Phys. Rev. E: Stat. Phys., Plasmas, Fluids, Relat. Interdiscip. Top., 1997, 56, 4671 CrossRef CAS.
- Y. Feng, J. Goree and B. Liu, Phys. Rev. E: Stat., Nonlinear, Soft Matter Phys., 2010, 82, 036403 CrossRef PubMed.
- V. Zhuravlyov, J. Goree, P. Elvati and A. Violi, Phys. Rev. E, 2023, 108, 035211 Search PubMed.
- I. Rios de Anda, A. Statt, F. Turci and C. P. Royall, Contrib. Plasma Phys., 2015, 55, 172–179 CrossRef CAS.
- N. P. Kryuchkov, F. Smallenburg, A. V. Ivlev, S. O. Yurchenko and H. Löwen, J. Chem. Phys., 2019, 150, 104903 CrossRef.
- F. H. Stillinger and T. A. Weber, Phys. Rev. A: At., Mol., Opt. Phys., 1983, 28, 2408 CrossRef CAS.
- F. H. Stillinger, Science, 1995, 267, 1935–1939 CrossRef CAS PubMed.
- A. Stukowski, Modell. Simul. Mater. Sci. Eng., 2010, 18, 015012 CrossRef.
- B. A. Pazmiño Betancourt, F. W. Starr and J. F. Douglas, J. Chem. Phys., 2018, 148, 104508 CrossRef PubMed.
- H. Zhang, Y. Yang and J. F. Douglas, J. Chem. Phys., 2015, 142, 084704 Search PubMed.
- A. Widmer-Cooper and P. Harrowell, J. Chem. Phys., 2007, 126, 154503 CrossRef PubMed.
- F. H. Stillinger and T. A. Weber, J. Chem. Phys., 1984, 81, 5095–5103 CrossRef CAS.
- A. M. Nieves and T. Sinno, J. Chem. Phys., 2011, 135, 074504 Search PubMed.
- A. Maciołek and S. Dietrich, Rev. Mod. Phys., 2018, 90, 045001 Search PubMed.
- C. Reichhardt and C. Reichhardt, Phys. Rev. B, 2023, 108, 155131 CrossRef CAS.
- F. A. Lavergne, A. Curran, D. G. Aarts and R. P. Dullens, Proc. Natl. Acad. Sci. U. S. A., 2018, 115, 6922–6927 Search PubMed.
- D. Chen, Y. Zheng, L. Liu, G. Zhang, M. Chen, Y. Jiao and H. Zhuang, Proc. Natl. Acad. Sci. U. S. A., 2021, 118, e2016862118 CrossRef CAS PubMed.
- J. Stambaugh, K. Van Workum, J. F. Douglas and W. Losert, Phys. Rev. E: Stat., Nonlinear, Soft Matter Phys., 2005, 72, 031301 CrossRef.
- K. Van Workum and J. F. Douglas, Phys. Rev. E: Stat., Nonlinear, Soft Matter Phys., 2005, 71, 031502 CrossRef PubMed.
- R. Quinn and J. Goree, Phys. Rev. E: Stat., Nonlinear, Soft Matter Phys., 2001, 64, 051404 CrossRef CAS PubMed.
- D. J. Wales and T. V. Bogdan, J. Phys. Chem. B, 2006, 110, 20765–20776 CrossRef CAS PubMed.
- N. Nakagawa and M. Peyrard, Proc. Natl. Acad. Sci. U. S. A., 2006, 103, 5279–5284 CrossRef CAS.
- L. Galgani and G. Benettin, Lett. Nuovo Cimento Soc. Ital. Fis., 1982, 35, 93–96 CrossRef.
- A. Carati and L. Galgani, Phys. Rev. E: Stat. Phys., Plasmas, Fluids, Relat. Interdiscip. Top., 2000, 61, 4791 CrossRef CAS.
- A. Carati, L. Galgani and A. Giorgilli, Chaos, 2005, 15, 015105 CrossRef CAS.
- X. Xu, J. F. Douglas and W.-S. Xu, Macromolecules, 2022, 55, 8699–8722 CrossRef CAS.
Footnote |
| † Electronic supplementary information (ESI) available. See DOI: https://doi.org/10.1039/d4sm01405g |
| This journal is © The Royal Society of Chemistry 2025 |

