
 Open Access Article
 This Open Access Article is licensed under a Creative Commons Attribution-Non Commercial 3.0 Unported Licence
Run-and-tumble dynamics of active giant vesicles†
Vivien
Willems
 a,
Alexandre
Baron
ab,
Daniel
Fernandez-Matoz
c,
Gianna
Wolfisberg
d,
Jean-Christophe
Baret
ab,
Eric
Dufresne
e and
Laura
Alvarez
*a
a,
Alexandre
Baron
ab,
Daniel
Fernandez-Matoz
c,
Gianna
Wolfisberg
d,
Jean-Christophe
Baret
ab,
Eric
Dufresne
e and
Laura
Alvarez
*a
aUniv. Bordeaux, CNRS, CRPP, UMR 5031, F-33600 Pessac, France. E-mail: laura.alvarex-frances@u-bordeaux.fr
bInstitut Universitaire de France, 1 rue Descartes, 75231 Paris Cedex 05, France
cDepartment of Theoretical Physics, Complutense University of Madrid, Madrid, 28040, Spain
dLaboratory for Soft Living Materials, Department of Materials, ETH Zurich, Zurich, Switzerland
eDepartment of Materials Science and Engineering, Cornell University, Ithaca, NY 14853, USA
First published on 21st May 2025
Abstract
Cell-inspired architectures offer a promising path toward self-regulating and functional artificial microswimmers. Here, we fabricate Janus lipid vesicles with reconfigurable motion enabled by membrane fluidity. Depending on temperature and their membrane composition giant unilamellar vesicles (GUVs) can undergo spontaneous phase separation, forming Janus-like structures at room temperature. We demonstrate that due to their Janus architecture, they self-propel under external electric fields as their colloidal analogues. Interestingly, their fluid membrane coupled to the electric field induces transitions between laterally phase separated and disordered reconfigured states, characterized by 2D domain analysis. These transitions drive distinct run-and-tumble dynamics, with runs linked to phase-separated Janus states of the GUV and tumbles to transient disorder of the lipid domains, leading to an instantaneous halt of their activity due to loss of the Janus asymmetry. We identify a faster reorientation timescale decoupled from thermal effects provoked by the tumble events. This cell-inspired system offers a novel strategy for developing motile artificial cells and programmable microswimmers.
1 Introduction
Cells, even in their simplest forms, exhibit adaptive motion and task execution, capabilities underpinned by their complex and hierarchized architecture. Replicating such intricate behavior at the microscale offers a pathway to uncover the fundamental physical and material ingredients required for biological complexity, while also inspiring the design of next-generation micromotors.1 Active colloids present a suitable minimal model to reproduce the motility of their biological counterparts at the microscale,1–3 with great potential for the realization of bioinspired microdevices.4 These artificial microswimmers are designed to capture the dynamical features of their biological counterparts such as adaptive motion via external5–8 or internal9–11 feedback mechanics incorporating responsive materials, or to perform simple tasks.12–14 The realization of tactic dynamics following the biomotility strategies, such as run and tumble of bacteria, provides a key feature to design self-guided microdevices.15 Dynamical reconfiguration of artificial microswimmers is achieved using flexible colloidal assemblies that transition from asymmetric to symmetric geometries.16–18 Yet, such realization relies on the random diffusion of the flexible colloidal bonds, leading to slow directional changes due to Brownian diffusion,19,20 in contrast with the abrupt turning events seen in bacterial run-and-tumble. As an alternative, external actuation renders an efficient strategy to impart virtual run and tumble dynamics, as studied with Quincke rollers,6 leading to exciting collective behaviour at higher densities. Nevertheless, the use of hard building blocks limits the architecture design and narrows their further programmability, in stark contrast to the sophistication of cellular compartments. The realization of hierarchical and compartmentalized designs holds the key to realising cell-mimetic microdevices.21A promising alternative is using soft compartments such as giant unilamellar vesicles (GUVs)22–24 as biological scaffolds. Thanks to their physical–chemical properties, GUVs serve as shape-shifting and semipermeable containers, able to interact with the environment, exchange information, and reconfigure in the presence of obstacles.22 These cell-like architectures have gained increasing interest in the active matter community as an alternative architecture to construct active cell replicas. Initial numerical models proposed active giant vesicles driven by internal active colloids as motors.25–27 While several experimental systems tried to unveil the correlation between membrane deformation and activity of encapsulated active colloids;28–31 only recently motion transfer to the whole membrane encapsulating bacteria32 or magnetic particles33 has been achieved. The search for the efficient directed motion of GUVs led to adopting standard propulsion mechanisms found in hard active colloids, such as light-34 and chemically-driven Janus GUVs,27,35–37 or protein-mediated GUV transport.38 Despite the recent progress made on self-propelling giant vesicles, designing adaptive and functional motility reminiscent of biological microswimmers requires careful design and understanding of the role of lipid membrane properties.
In this context, we introduce an experimental approach to fabricate active cell-mimetic compartments using phase-separated Janus lipid vesicles with reconfigurable motion. Their rich dynamics under external actuation are determined by the intrinsic membrane fluidity properties, geometry and interaction with their environment leading to run-and-tumble-like events.
2 Results and discussion
2.1 Behavior of Janus GUVs under AC electric fields
In this work, we fabricate active and self-reconfigurable phase-separated giant unilamellar vesicles (GUVs), here referred to as Janus GUVs, to explore their behaviour and dynamics under AC electric fields. The Janus GUVs were produced using electroformation39,40 as described in detail in the Methods section (ESI,† Appendix, Fig. S1 and S2). Briefly, we hydrate in a solution of 25 mM of sucrose at 60 °C a previously dried layer of a ternary lipid mixture: 1,2-dioleoyl-sn-glycerol-3-phosphocholine (DOPC), 1,2-dipalmitoyl-sn-glycerol-3-phosphocholine (DPPC), and cholesterol (Chol), leading to laterally asymmetric phase separated Janus particle-like GUVs (Fig. 1(a) and (b)). At the chosen composition, DOPC, DPPC and cholesterol generally exhibit spontaneous phase separation below 30 °C, forming DOPC-rich liquid disordered (Ld) and DPPC-rich liquid-ordered (Lo) phases.41 In our experiments, upon cooling down to 25 °C, the vesicles exhibit phase separation due to the immiscibility of these two phospholipids. The resulting phase-separated Janus GUVs also contain a small amount of two charged fluorescently labeled phospholipids (see Methods): 18:1 Liss Rhod PE (RhPE, red), and 14:0 NBD PE (NBDPE, green). NBDPE dissolves in both phases, while RhPE partitions only into the DOPC-rich phase (Ld), as shown in Fig. 1(c)–(e). The final Janus GUVs exhibit a broad range of sizes and asymmetries (see ESI,† Fig. S2). In this work, we focus on sizes of R = 3–7 μm and phase separation asymmetry Ld/Lo ≈ 1, where the ratio Ld/Lo denotes the ratio of red to green pixels on the circumference of the GUV in its equatorial plane. We characterize their passive single dynamics, with an average diffusion coefficient DT = 0.047 ± 0.038 μm2 s−1, consistent with the predicted theoretical value for a hard particle of the same size (ESI,† Appendix, Fig. S3).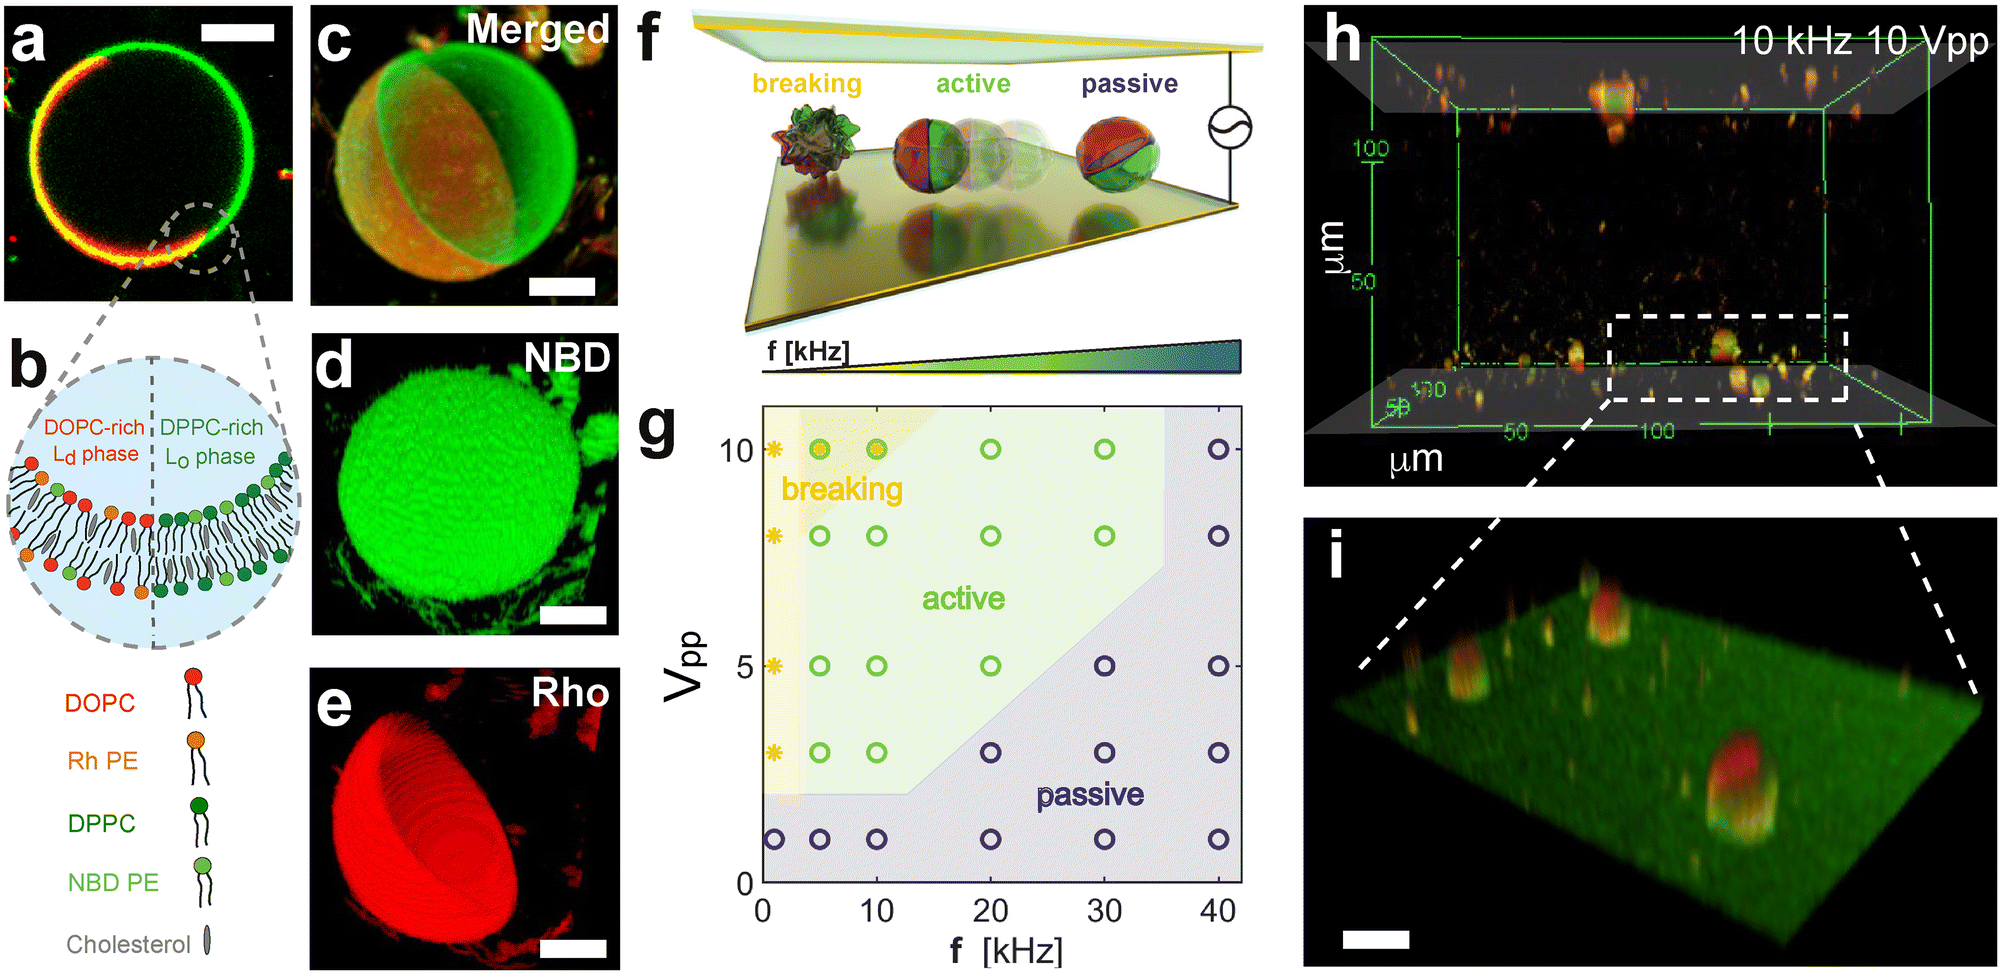 | ||
Fig. 1 Fabrication and characterization of Janus phase-separated GUVs. (a) Fluorescence picture of a phase-separated – Janus – GUV at 25 °C, and (b) corresponding scheme of the composition of each phase of the Janus GUV with a liquid-ordered (Lo) DPPC-rich domain containing NBDPE (green) and a liquid-disordered (Ld) DOPC-rich domain with both NBDPE and RhPE (red). Confocal images of a Janus GUV showing (c) the merged channels, (d) NBD-PE partitioned in both Lo and Ld phases, (e) and rhodamine-PE rich Ld phase images. Scale bars depict 10 μm. (f) Scheme of the experimental cell composed of two conductive parallel electrodes applying a perpendicular AC electric field, with the corresponding behavior of the Janus GUVs at varying frequencies for passive (blue, PBP), active motion (green, ABP), and bursting (yellow, B). (g) Phase diagram of the Janus GUVs at varying peak-to-peak voltages Vpp (corresponding to 8333–83![[thin space (1/6-em)]](https://www.rsc.org/images/entities/char_2009.gif) 333 V m−1) and frequencies f of the electric field applied. (h) Confocal image of the phase-separated GUVs moving along the electrodes at 10 kHz and 10 Vpp. The shaded area indicates the position of the electrode. The x, y and z axes are in μm. (i) Zoom-in on the bottom electrode on three phase separated GUVs. The scale bar depicts 20 μm. 333 V m−1) and frequencies f of the electric field applied. (h) Confocal image of the phase-separated GUVs moving along the electrodes at 10 kHz and 10 Vpp. The shaded area indicates the position of the electrode. The x, y and z axes are in μm. (i) Zoom-in on the bottom electrode on three phase separated GUVs. The scale bar depicts 20 μm. | ||
We first study the overall behaviour of the Janus GUVs under AC electric fields inspired by the extensive work done on their hard-colloidal analogues. To do this, we placed a droplet of diluted phase-separated Janus GUVs in MilliQ water with 25 mM sucrose (no added salt) in an experimental cell with transparent ITO-coated electrodes separated by a 120 μm spacer and connected to a function generator (Fig. 1(f)). We actuated the Janus vesicles probing conditions from 1 to 10 Vpp (8333–83333 V m−1) and decreasing the frequency from 40 to 1 kHz, while imaging them via optical fluorescence microscopy through the bottom electrode (see Methods). When applying the AC field, the GUVs, otherwise neutrally buoyant due to the density match among the inner and outer solutions, are attracted to the electrodes as the particle interacts with its image dipole (Fig. 1(h), (i) and ESI,† Appendix Fig. S4). Under this cell geometry, we constructed a phase diagram of their behavior over the various field conditions mentioned above (Fig. 1(g)). Interestingly, at intermediate frequencies above 5 kHz and below 20 kHz, we observed active motion at amplitudes between 3–10 Vpp (ESI,† Movie S3). The frequency range where we observed active motion of Janus GUVs in 2D close to the electrode, is coherent with the description of electrohydrodynamics (EHD), where flows usually arise when kDions/H ≪ f ≪ κ2Dions, where H is half the distance between both electrodes, and κ and Dions are the inverse of the Debye length (approx. 300 nm for this specific system), and the diffusion coefficient of the ions in solution, respectively (details of calculation in ESI,† Appendix). This motion in 2D close to the electrode is also observed in asymmetric dielectric colloidal particles and assemblies with contrast in dielectric surface properties, in particular, particle conductivity σp.10,42 As we will show later in more detail, in our experiments each lipid domain acts as a dielectric interface with different σp and zeta potential ζ due to the difference in composition, causing unbalanced EHD flows around each side of the Janus GUV, leading to net propulsion of the GUV. In this regime of active motion, electrodeformation of the GUVs from the initial GUV shape is negligible, less than 5%, considering intrinsic measuring errors from the confocal images (ESI,† Appendix, Fig. S5). The presence of a self-propulsion regime under these conditions is particularly interesting to understand the dynamics of Janus GUVs and their behavior as active compartments.
At higher frequencies, f > 30 kHz, the GUVs exhibit mostly passive Brownian motion. The characteristic time for the formation of an induced screening cloud around a spherical object of radius R is the charging time  .43,44 Thus, in our system, for an applied frequency of 40 kHz, (tf = 25 μs), in a solution of MilliQ and 25 mM sucrose (no salt) with a medium conductivity of σm = 1.5 × 10⁻⁵ S m−1, and a particle radius average of R = 5 μm, tc = 700 μs, the period of the AC field is faster than the screening cloud charging times scales being tf ≪ τc. This difference in time scales is a consequence of the finite mobility of ions; and as the applied frequency increases, the ions have less time to move in response to the field, canceling the EHD flows, and thus the motion of the particles. In contrast, at lower frequencies (1–5 kHz), vesicles burst at field strengths larger than 3 Vpp. This phenomenon is produced by the accumulation of charges at both sides of the membrane, causing high transmembrane potential and inducing effective electric tension leading to membrane breakage (ESI,† Movie S2).45 The bursting of vesicles described in literature often occurs under short DC-field pulses (200 μs),46 equivalent and consistent to a period of an AC field with a 5 kHz frequency, where we start to observe bursting events.
2.2 Active motion of Janus vesicles
We now focus on the active motion of the Janus GUVs and rationalize the propulsion mechanism of the vesicles. We analyze the spherical Janus vesicles with radius R = 3–7 μm where both phases can be well-identified, discriminating smaller particles or aggregates. Based on the dynamical state diagram, we performed experiments at 10 kHz in the regime of active motion at varying voltages. In Fig. 2(a), we depict the typical trajectories of an active Janus vesicle with increasing voltage (Vpp) at a fixed frequency of 10 kHz, with particles with asymmetry Ld/Lo ≈ 1. The Janus GUVs exhibit active motion swimming consistently with the red hemisphere in front (Fig. 2(b) and (c)) and in 2D close to the bottom electrode. The mean velocity v (projected on the imaging plane) is calculated from the average of the instantaneous velocities, the displacements of a vesicle in discrete time intervals Δt divided by Δt (with Δt = 0.4 s), for each trajectory at each condition, exhibits a quadratic dependence with the electric field E as v ∝ E2 (Fig. 2(d)). Moreover, the velocity decreases with increasing frequency as v ∝ f−1 (Fig. 2(e)), as a result of the slower double-layer polarization at the particle surface with polarization time tc, as previously explained.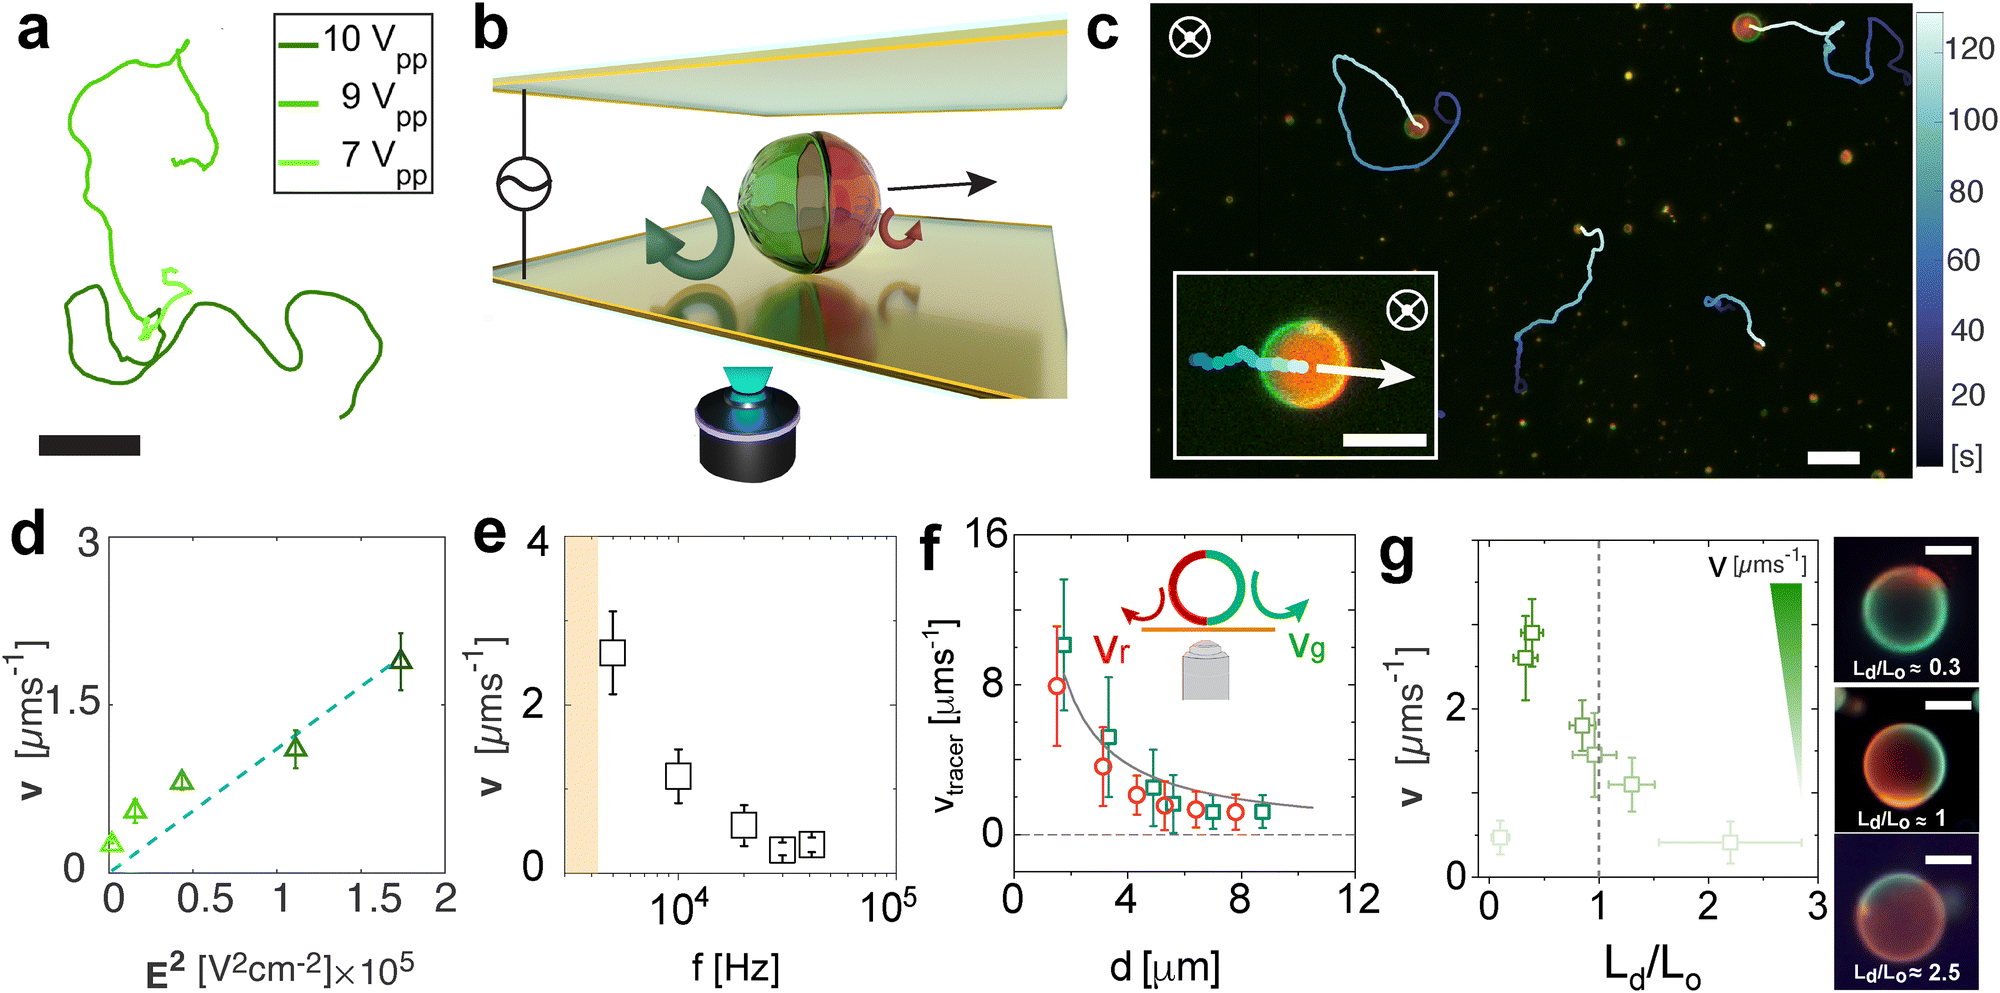 | ||
| Fig. 2 Dynamical characterization of Janus GUVs under AC fields. (a) Typical trajectories of active GUVs at increasing voltage peak-to-peak of 7, 9 and 10 Vpp corresponding to 58300, 75000 and 83333 V m−1 at 10 kHz. The scale bar depicts 30 μm. (b) Scheme of the Janus GUVs in the experimental cell swimming close to the electrode in 2D and exhibiting the EHD flows at each hemisphere (red and green arrows). The sample is observed from the bottom electrode and the black arrow depicts the direction of the motion. (c) Fluorescence image depicting typical active Janus particles and trajectories at 5 kHz and 9 Vpp. The inset is a zoom-in of an active Janus GUV. The white arrow indicates the direction of motion, perpendicular to the applied field. The scale bars indicate 10 μm. (d) Janus GUV velocity v as a function of the square of the applied field at 10 kHz. Open symbols represent experimental data. The error bars indicate the standard deviation of more than 30 particles. The dashed line is a linear fitting. (e) Velocity of the Janus GUVs v as a function of the applied frequency at 9 Vpp. The error bars indicate the standard deviation with a 95% confidence interval. (f) Measured velocity of the tracers vtracer for the Lo (green) and Ld (red) phases as a function of the distance d between the tracers and the GUV. The solid line represents a decay of 1/d. The error bars are the standard deviation over more than 50 tracers. The inset indicates the direction and magnitude of the flows at the surface of each lipid phase. (g) Velocity of the particles as a function of the lipid phase ratio Ld/Lo. The color code indicates the velocity increase (from light to dark green) and the dashed line indicates the 50:50 ratio Ld/Lo lipid domains Janus GUV. On the right the corresponding fluorescence images and schematics depict the EHD flow around each lipid phase from a top view. The scale bars depict 5 μm. | ||
We experimentally characterized the presence of the fluid flows around each lipid phase on the surface of the vesicles by using small tracer particles of ≈1 μm diameter at 10 kHz and 9 Vpp (ESI,† Appendix Fig. S6 and Movie S4 with two examples of flows around GUVs). We track the EHD flows for several GUVs, keeping a low concentration of tracer particles to avoid accumulations below the membrane. We track the tracers that move from the top of the vesicle to the bottom and away from it, and the flows’ magnitude decreases with the distance d between the tracer and the GUV, called repulsive or extensile flows (Fig. 2(f)), making this a pusher type microswimmer. Based on these observations, we rationalize the swimming behavior driven by electrohydrodynamic (EHD) flows as the main propulsion mechanism. Geometrically or compositionally asymmetric hard colloids exhibit active motion via electrohydrodynamic effects under AC electric fields in the kHz range between parallel electrodes42 when they are close to the electrode. The oscillating electric field E applied in the vertical direction induces an excess amount of surface charges at the substrate–fluid interface. The tangential component of the nonuniform electric field around a particle acts on the induced charges producing recirculating EHD flows around the particle. For charged Janus particles or assemblies with asymmetry in their surface dielectric properties – in particular, particle conductivity σp – these flows are unbalanced at each side, causing net motion of the particles in the plane parallel to the electrode.
In our phase-separated GUVs, the green phase containing DPPC + NBDPE exhibits EHD flows with a slightly greater magnitude than the red phase containing DOPC + NBDPE + RhPE (the tracers swim slightly faster and move further away), which is consistent with the direction of the motion observed. We measure ζLd = −33 mV ± 5, and ζLo = −45 mV ± 7, measured by ζ-sizer for reference GUVs formed by each one of the main lipids (see more details in Methods). The increase in surface charge magnitude leads to an increase of the zeta potential, thus increasing the local magnitude of particle conductivity as σp,Ld = 1.8 × 10⁻⁵ S m−1, σp,Ld = 2.8 × 10⁻⁵ S m−1 (ref. 47) (details of calculation in ESI,† Appendix). Thus, the dominant flow around the green Lo phase is consistent with the different ζ, and thus σp compared to the red Ld phase as shown in previous studies for charged colloidal particles near an electrode.48 This difference arises from the presence of negatively charged fluorescent lipids in the two phases in different amounts. NBDPE dye dissolves in both membrane domains, while RhPE only partitions into the Ld phase (Fig. 1(d) and (e)), leading to a higher negatively charged surface in the Ld domains due to the presence of both charged dyes.
We support this experimental observation with the theoretical estimation of EHD flows around each hemisphere based on their surface charge properties (ESI,† Appendix, Fig. S7) as previously investigated in our works in charged thermo-responsive active colloids with varying surface properties near an interface.10,49 The EHD flow velocity is evaluated as a function of the distance from the particle and the frequency, with good agreement with the experimental data (see ESI,† Appendix for calculation details). In this context, a measure of the relative importance of surface conductivity is given by the dimensionless Dukhin number, Du, relating the media conductivity (σm) and surface conductance (Ks), as  , where R is the radius of the particle (here approximated as 5 μm). Using the values obtained for the surface conductance of both hemispheres (see supplementary text for details of the calculations, ESI†) of the Janus GUVS, we obtained Du ≈ 10, consistent with surface conductance effects.
Finally, we show that the Janus GUV velocity has also a dependence on the phase separation asymmetry for vesicles of the same size, as shown in Fig. 2(g). In particular, we found that Janus vesicles with a higher percentage of Lo (green) phase Ld/Lo < 1 have higher velocities, with intermediate velocities at Ld/Lo = 1, and velocities – displacements – reaching thermal noise when the red side is dominant Ld/Lo > 1 or the asymmetry disappears when only one of the lipid phases is present.
We perform a series of control experiments with non-phase separated vesicles (i.e., only one type of phospholipid and cholesterol) which do not exhibit active motion due to the lack of asymmetry on the vesicle membrane (ESI,† Appendix, Fig. S8 and S9). We also perform control experiments adding salt to the system (10−6 M), causing a very mild decrease of the active regime due to screening of surface charges and thus a decrease of the EHD flows magnitude with respect to the solutions without salt used in our experiments.47 Finally, we increase the amount of charged dye, which leads to the bursting of the vesicles at higher frequencies due to the increased membrane charge. In all of the cases mentioned above, the motility of the Janus GUVs was cancelled or considerably reduced.
2.3 Run and tumble dynamics: transient domain disorder and phase separated states
Inspecting the motion of the vesicles more closely, we find unexpected dynamical behavior that we relate to the intrinsically reconfigurable phase-separated hemispheres of the GUV. Interestingly, the fluid nature of the bilipid membrane allows for the periodic disruption of both distinct lipid phases under the effect of the AC electric field, leading to transient dynamics states that we call in this work run (fully phase separated Janus GUVs) and tumble (domain reconfiguration) events, due to their similarity to the characteristic navigation strategy performed by bacteria50 (Fig. 3 and Movie S5, ESI†). In particular, both phases can undergo transient reorganization. This inherent property is in contrast with the discrete geometry exhibited by hard Janus particles and other colloidal assemblies, where the fixed material boundaries impede any geometrical, and thus, dynamical reconfiguration. While in the absence of the electric field, both phases are stable and phase separated, the AC electric field coupled with the interaction with the close electrode strongly affects the phase separation, generating punctual lipid domain reconfiguration events.46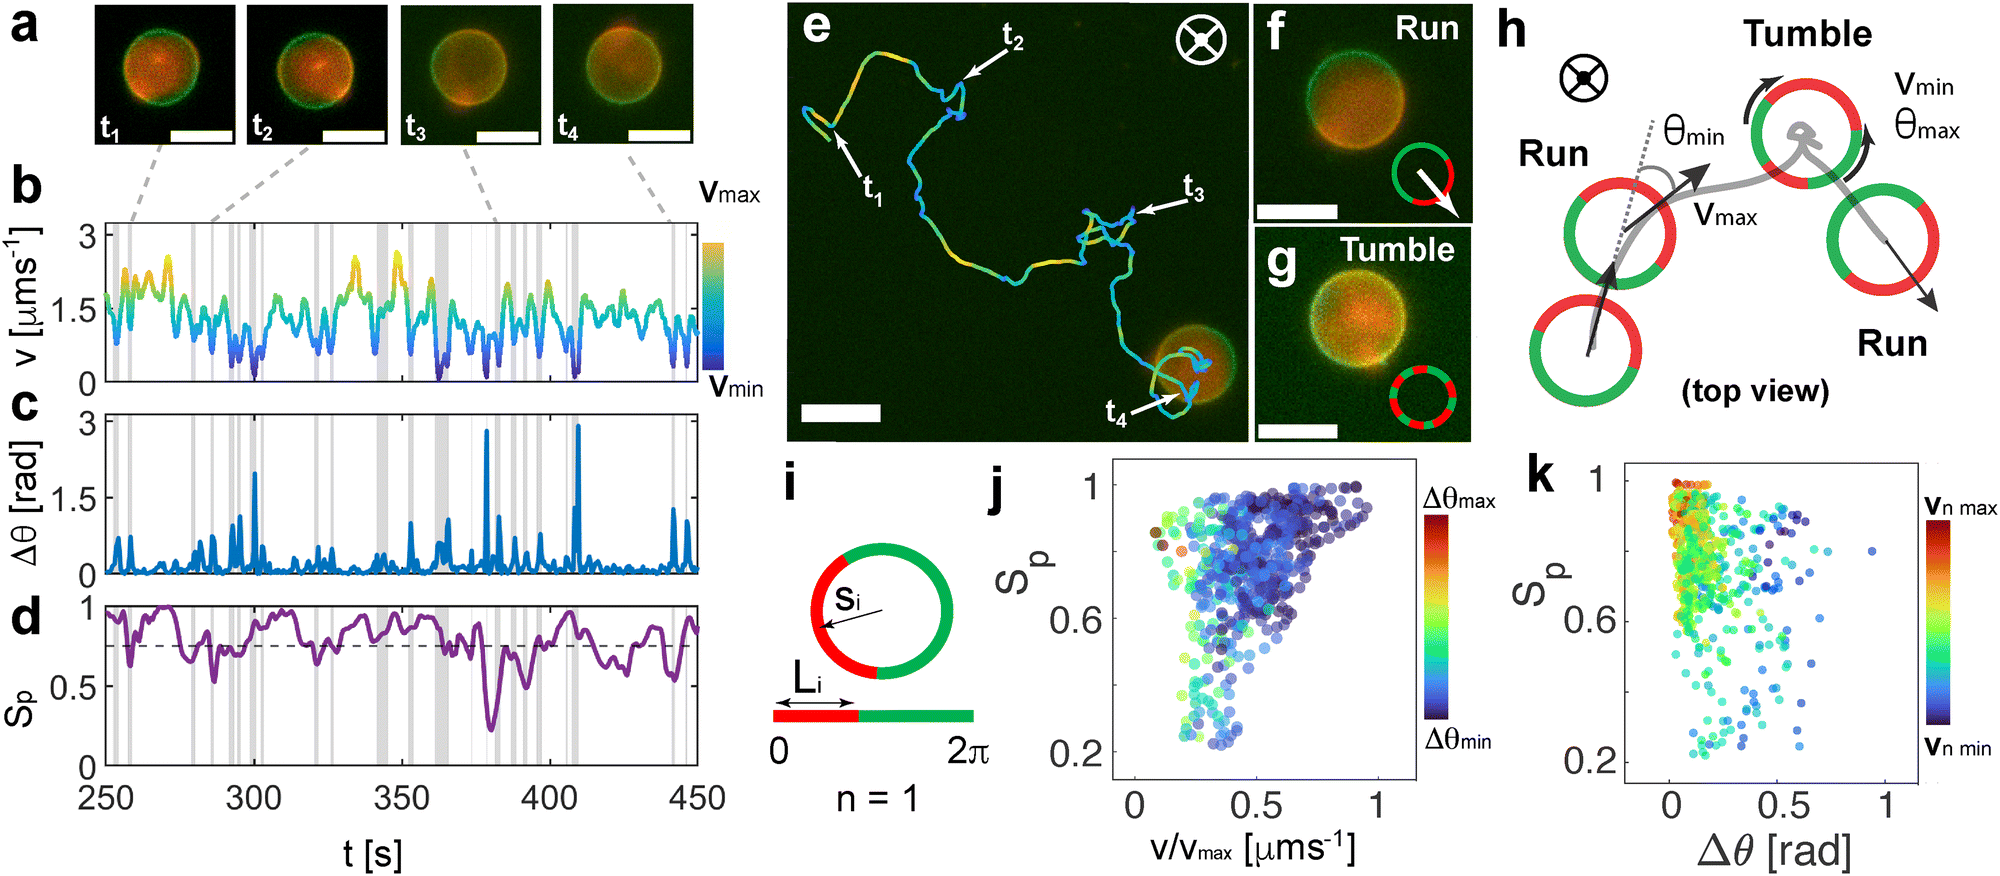 | ||
| Fig. 3 Run and tumble-like motion of Janus GUVs (a) fluorescence pictures of example tumble events (ti) due to membrane domain mixture, and loss of asymmetry. Scale bars represent 15 μm. Evolution as a function of time of the (b) instantaneous velocity v as the displacements between two frames with dt = 0.4 s, (c) change in orientation Δθ between two frames with dt = 0.4 s, and (d) order parameters Sp for the GUV in panel a. The dashed line in (d) represents the threshold below which the system is measured as disordered Sp < 0.75. The vertical grey areas indicate the tumble events detected by overlapping a local minimum in v, a maximum in Δθ, and minima in Sp. (e) Snapshot of a fluorescent microscopy video of an Active Janus GUV, overlaid with its trajectory at 10 kHz and 9 Vpp. The tumble events are indicated as ti. The colour code indicates the velocity evolution. Screenshots of (f) run and (g) tumble events of a Janus GUV. The inset depicts a schematic representation of the phase re-arrangement. Scale bars are 15 μm. (h) Corresponding schemes of the run (Janus GUV) and tumble events (disordered domains) (i) scheme of a 2D projection of a fully phase-separated GUV (left) and the parameters identified for calculating the order parameters Sp being si the orientation of the vector and Li the length of the domain segment. Dependence of (j) Sp with normalized velocity for the full particle in (e) of 320 s. The colour code indicates the associated Δθ, and (k) the Sp order parameters as a function of the variation of the direction of the particle Δθ. The color coding depicts the normalized velocity of the particle. | ||
We characterize the presence of run and tumble events at 10 kHz and 9 Vpp, with optimized tumble identification algorithms commonly used for the quantification of bacterial dynamics.15 For each trajectory, we monitored the evolution of the instantaneous velocity v, and the orientation variation of Δθ as a function of time as shown in Fig. 3(a)–(c). We locate local velocity minima and flag a potential tumble if the velocity decreases by more than 70% relative to the value at the corresponding local minimum with respect to neighbor points. We also evaluate the angular displacement, Δθ, and compare it to a threshold obtained from the distribution of angular displacements. We confirm a tumbling event only when both conditions are met at the same time point (see ESI,† Appendix for more details). This drop in velocity is related to the disruption occurring between the two distinct lipid domains in the vesicle membrane, which leads to asymmetry loss and therefore loss of directed motion. Meanwhile, there is an increase in the jittering of the particle in place during the tumbling events.
To have a better insight into the membrane phase domain structure during these processes, we quantify an order parameter Sp (Fig. 3(d)) that measures the spatial distribution of red-labeled regions along the vesicle's perimeter at the equator of the spherical vesicle. We integrate both the angular position si and the length of each segment Li for the red domains, serving effectively as an order parameter for the alignment of labeled regions (Fig. 3(i)). This is done by detecting red pixels on the perimeter of the 2D projection from the fluorescence images (ESI,† Appendix). Each segment's spatial distribution is translated into a vector in the 2D plane. The direction of this vector is aligned with the segment's angular position, and its magnitude is determined by the segment's length Li. Formally:
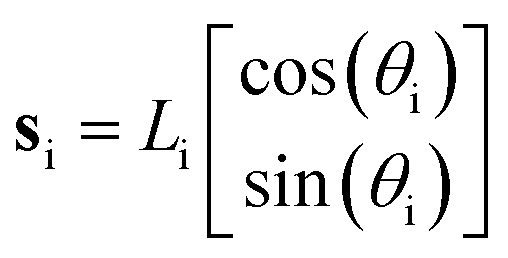 | (1) |
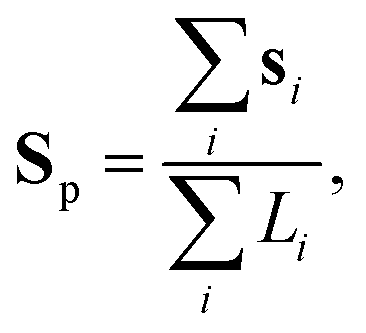 | (2) |
Looking at the typical velocities of runs and tumbles after the classification of each event (Fig. 4(a) and (b)), we find that the runs are distinctly faster as shown in the velocity distributions in Fig. 4(c). We observe run and tumble duration times (ttum and trun, respectively) distributions following a Poisson exponential decay of tumble-time ttum and run-time trun given by the exponential fit as ψrun ∝ 1/![[t with combining macron]](https://www.rsc.org/images/entities/i_char_0074_0304.gif) rune−trun/run and ψtum ∝ 1/tume−ttum/tum respectively, where tum = 9.49 s is the mean run-time and run = 1.92 s is the mean tumble-time as shown in Fig. 4(d), as expected for run and tumble motion6 with both times being randomly distributed in the trajectory, reminiscent of bacterial swimming patterns.51
rune−trun/run and ψtum ∝ 1/tume−ttum/tum respectively, where tum = 9.49 s is the mean run-time and run = 1.92 s is the mean tumble-time as shown in Fig. 4(d), as expected for run and tumble motion6 with both times being randomly distributed in the trajectory, reminiscent of bacterial swimming patterns.51
 | ||
| Fig. 4 Trajectory analysis and classification of run and tumble. (a) Example trajectories at 10 kHz, 9 Vpp with blue representing runs and orange representing the detected tumbles in the trajectories. (b) Zoom in on the trajectory representing the velocity as a function of time where a tumble can be distinguished as a drop in v. The color code indicates the particle velocity. (c) Histogram of the mean velocities of the runs (orange) and tumbles (blue) after analysis of 30 trajectories. (d) Distributions ψ of tumble-time ttum and run-time trun drawn from exponential fits as ψrun ∝ 1/rune−trun/run and ψtum ∝ 1/tume−ttum/tum respectively, where trun and tum are the mean run-time and mean tumble-time, respectively. | ||
2.4 Tumbling reorientation time and anomalous dynamics
We compare the experimental trajectories with simulations using Active Brownian particle (ABP) and Run and Tumble particle (RTP) simulations (ESI,† Appendix) for particles with the same characteristic as the Janus GUVs (v, diameter, and rotational diffusion DR associated to the particle size) as shown in Fig. 5(a)–(c). With this information, we perform statistical analysis for both spatial G(|x|,t) and orientational G(|Δθ|,t) displacements at short time scales (dt = 0.4 s), where G is the probability distribution function. For the experimental data, we observe a non-Gaussian behavior with a transition from a first exponential phase at small |x| and |Δθ|, followed by an exponential tail at longer displacements. Both exponential phases are fitted with the expression G ∝ 1/ex where x represents the data plotted on the x-axis. The exponential tails in G are characteristic of dynamical heterogeneity such as in glassy phases or bacterial dynamics,52 where faster and slower events coexist. This is the case for our system in constant transition between runs and tumbles, where Δθtum ≫ Δθrun, and vtum ≪ vrun. Interestingly, we recover also exponential behavior at short displacements, as opposed to the expected Gaussianity, hinting at heterogeneous dynamics at short times, dominated by the large spatial and angular fluctuations when both phases of the GUV are not fully separated when overcoming a tumble. There is also a distinct deviation from the ABP model behavior, where for G(x,t) we expect a broader and flatter distribution with a double peak in the ballistic regime,53 and for G(Δθ,t) a single Laplace distribution, where .54 We have a rather good agreement for the G(θ,t) with the RTP model, and qualitatively similar behavior for G(x,t). In the latter, the simulation exhibits the distinct centered peak defined by the tumble events, with two prominent shoulders related to the ballistic regime of the tumbles. However, experimentally, these shoulders are less pronounced, mostly due to the smooth transitions from run and tumble in the experiments, which are different from the sharp change from each state in the model. Overall, the presence of the run and tumble events arising from the constant fluctuations of both phases of the GUVs lead to a fluctuating swimming force, reflected in the velocity variations and the difference from the RTP model.
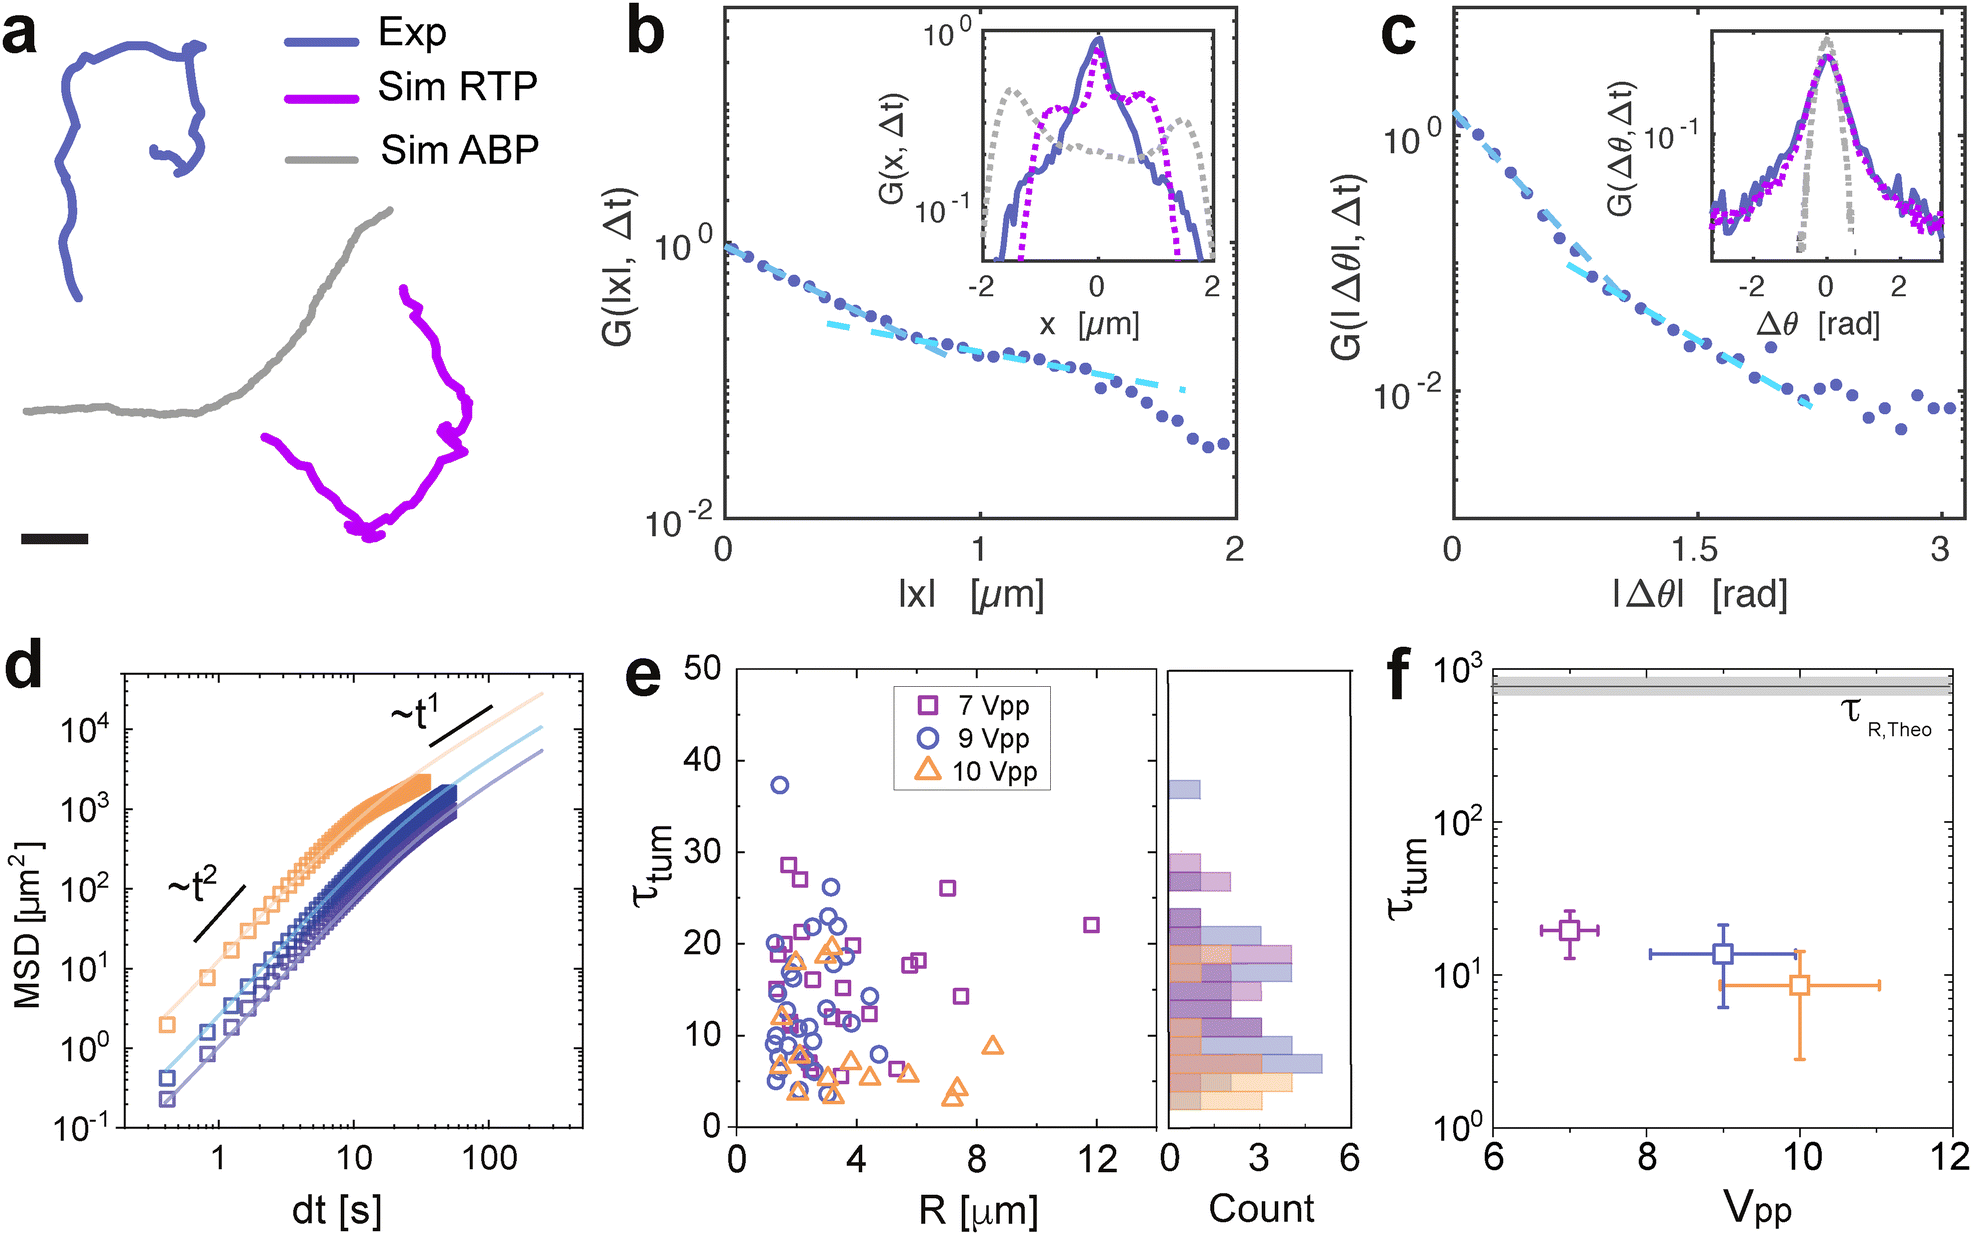 | ||
Fig. 5 Statistical analysis and field dependent reorientation. (a) Example trajectories of an experimental trajectory (blue) at 10 kHz and 9 Vpp with ttum = 11 ± 4 s (determined by fitting the time at which the slope of the double logarithmic MSD plot of the trajectory changes), and simulated trajectories with ABP model (grey) of a particle with analogous properties with R = 3 mm, overall v = 1.2 μm s−1 and τR,Theo = 165 s, and RTP model (magenta). The scale bar depicts 20 μm. The probability distribution function of (b) the displacements x and (c) the orientation Δθ. The blue solid line represents the experimental data for 30 particles of around 500 frames at 10 kHz and 9 Vpp and the light blue dashed lines represent the exponential fit of G ∝ 1/ex at small and large displacements or angles respectively, where x represents the data plotted on the x-axis. The grey dashed line in the inset represents the simulated ABP data and the magenta dashed line represents the simulated RTP data. (d) Mean square displacements of particles at increasing voltage conditions and fixed frequency (10 kHz). The open symbols represent the ensemble average for each condition, and the solid lines represent the fitting for long times. (e) Reorientation time τtum obtained from the individual mean-square displacements, as a function of GUV radius R. The right plot indicates the histogram of the data points. (f) Decreasing reorientation time τtum with increasing velocity (thus, field applied) for the particles in (e). The error bar is calculated from the standard deviation with a 95% confidence interval. The open symbols represent the experimental data. The solid line and the shaded rectangle represent the theoretical prediction, τR = DR−1 using Einstein–Stokes  . . | ||
Furthermore, we measure the mean square displacement (MSD) with trajectories of at least t = 150 s for increasing voltage conditions and fixed frequency at 10 kHz (Fig. 5(d)). We extract reorientation times by fitting the expression of the MSD at long times for ABP (see ESI†), obtained from the relaxation from ballistic to diffusive in the MSD.55 While the expected thermal reorientation time τR for a spherical particle of 10 μm diameter is ≈103 s, where τR = DR−1 = ς/kT, (ς being the drag coefficient), we find a drastic difference, where τR ≈ 100τtum. Notably, the extracted τtum from the MSD does not exhibit an effect of the size (Fig. 5(e)), which differs from the Einstein–Stokes equation DR = kBT/ς. In this system, both the velocity v and τtum are controlled by the applied voltage, with τtum reflecting the randomization of the active trajectory via these field-induced symmetry-breaking events. Thus, τtum is decoupled from τR, consequence of faster, AC field-driven membrane reconfiguration, where the vesicle transiently loses its Janus asymmetry (and therefore its activity) leading to an instantaneous stop, before recovering Janus asymmetry and resuming propulsion in a random direction.
This is coherent with the RTPs, where they only differ in their rotational relaxation, as RTPs undergo discrete tumbling events of short duration that randomize their swimming direction. This effect is not observed for their hard colloidal analogues with fixed geometries without external steering, as it is directly related to the lipid domain reconfiguration and loss of Janus architecture that is only possible for fluid membranes. In addition, τtum depends on the activity decreasing as v increases (Fig. 5(f)), hinting at a strong correlation between the tumbling events and the applied field. The data deviation is given by the population spread of phase separation ratio Ld/Lo of the phase-separated vesicles of same size, which has an important influence on their instantaneous average velocities, with faster vesicles when the Ld/Lo < 1 as previously mentioned. Interestingly, the constant but random transition from running and tumbling events of the GUVs might arise from the interaction of the membrane with the rough topography of the bottom electrode. Topographic roughness arises from ITO deposition which generates point defects perturbing punctually the electric field leading to the perturbation of the phase separation. Alternatively, the presence of the EHD flows at the surface of the particles, could be a potential source for the lipid domain reconfiguration events, also depending on the field strength as previously shown by Dimova et al. for passive GUVs in co-planar electrodes.56 While this remains an open question, it hints at exciting opportunities towards surface patterning for the navigation design of the active GUVs based on their run-and-tumble events driven by membrane reconfiguration.
Finally, we demonstrate with preliminary tests that cargo encapsulation, uptake, and further on-demand release would be possible by utilizing the response of the active GUVs to the applied AC electric field (Fig. S11 and Movies S6, S7, ESI†). Under an AC-field (10 kHz, 10 Vpp), larger vesicles (R = 6 ± 3.6 μm) carrying smaller vesicles (R < 2 μm) exhibit active motion without impairment from the cargo. Controlled release is achieved by applying lower frequencies (1–5 kHz), bursting the bilipid membrane to release the cargo. Janus and active GUVs also demonstrate spontaneous cargo uptake. For instance, an active Janus GUV can capture and transport a 2 μm polystyrene particle via EHD flows and particle-membrane interactions.57 The cargo can later be released by applying a low-frequency field (1 kHz, 5 Vpp). These findings highlight the potential of active GUVs for simple tasks and interactions with biological systems.
3 Conclusion
In our study, we unveil the intricate dynamics of phase-separated Janus giant unilamellar vesicles (GUVs) under AC electric fields, rendering the precursor for compartmentalized artificial microswimmers with inherent reconfigurable dynamics. Our observations reveal transitions between run-and-tumble states attributed to interplay between the fluidity of the bilipid membrane and the electric field, giving rise to an enhanced reorientation timescale due to the tumbling events. The system developed here operates as a Markovian telegraph process, with transitions between two states (runs and tumbles).15 The temperature-driven phase separation of the lipid hemisphere unlocks an unprecedented tool for the future design of reconfigurable and internally guided dynamics under predesigned temperature gradients. Nevertheless, a higher degree of control over the size and composition of these active Janus GUVs and their surroundings is needed to investigate these questions. The use of active GUVs provides a great platform for the development of cargo uptake, transport, and release, taking advantage of the versatility of the lipid membrane in combination with its active motion. Future developments of this strategy are closely connected to progress in advanced artificial cells, featuring motion via chemical signalling as explored in membraneless compartments,58,59 navigation strategies in complex environments,60 or collective behavior with soft potentials.61,62In conclusion, our work presents a step forward in the fields of active matter and artificial cells with the experimental realization of phase-separation-dependent dynamics in Janus GUVs. These cell-mimetic compartments, exhibiting run-and-tumble motions, open new avenues in the design of tactic dynamics, shedding light on the role of domain structures and motility states. These discoveries lay a fundamental framework for the future development of active giant vesicles.
4 Materials and methods
4.1 Materials
1,2-Dioleoyl-sn-glycerol-3-phosphocholine (DOPC), 1,2-dipalmitoyl-sn-glycerol-3 phosphocholine (DPPC), 1,2-dioleoyl-sn-glycerol-3-phosphoethanolamine-N-(lissamine rhodamine B sulfonyl) (RhPE) and 1,2-dipalmitoyl-sn-glycerol-3-phosphoethanolamine-N (7-nitro-2-1,3 benzoxadiazol) (NBDPE) were bought from Avanti Polar Lipids (USA). Cholesterol (highly purified) was purchased from EMD Millipore Corp. (USA). Chloroform (ReagentPlus, 99.8%), sucrose (BioUltra, 99.5%, contains 0.5 to 1% ethanol as a stabilizer) and poly(sodium 4-styrene sulfonate) (P-S-sulfonate) (average MW ≈ 70000, powder) and spacers Grace Bio-Labs SecureSeal imaging spacer (8 wells, 9 mm diameter, 0.12 mm thickness) were purchased from Sigma-Aldrich. Copper tape (double-sided, 12 mm × 16.5 mm × 2 mm) was purchased from Distrelec. ITO-slides from Corning were used for electroformation (50 × 75 × 1.1 mm, Rs = 4–10 Ω) and AC-field experiments (25 mm × 25 mm × 0.7 mm, Rs = 9–15 Ω and 25 mm × 25 mm × 1.1 mm, Rs = 4–8 Ω). MilliQ water was used and filtered with 0.2 μm CA-membrane filters (ClearLine).
4.2 Phase-separated Janus vesicle formation
Lipids were dissolved in chloroform to a final concentration of 1 mM in a 35:35:30 DOPC/DPPC/cholesterol molar ratio, supplemented with 0.1% RhPE and 1% NBDPE. The lipid solution was drop-cast onto an ITO-coated glass slide to form a thin film inside the wells of a PDMS spacer, then sealed with a second ITO-coated slide and clamped together. The assembled chamber was placed in a vacuum desiccator for at least 1 hour (up to overnight) to remove residual chloroform. The wells were subsequently filled with a 25 mM sucrose solution in filtered MilliQ water. The electrodes were connected to a function generator (Keysight 33500B Waveform Generator Trueform), and the chamber was heated to 60 °C on a hot plate while applying an AC electric field, following protocols adapted from previous studies on GUV formation.40 The resulting GUV suspension was collected and stored in Eppendorf tubes at room temperature (25 °C), protected from light, and used within one week. Samples were typically imaged one day after electroformation to allow sufficient time for domain coalescence and formation of Janus-like GUVs.41 For zeta (ζ)-sizer measurements, non-phase-separated GUVs were prepared using the same electroformation protocol, with lipid compositions mimicking each of the individual coexisting phases. Based on previous measurements,41 the liquid-disordered (Ld) phase contains approximately one-third of the total cholesterol, while the liquid-ordered (Lo) phase contains the remaining two-thirds. Accordingly, Ld-like vesicles were formed using a 90:10 DOPC/cholesterol molar ratio with 1% NBDPE and 0.2% RhPE, and Lo-like vesicles were prepared with an 80:20 DPPC/cholesterol ratio and 1% NBDPE. Control samples without fluorescent dyes were also prepared with 90:10 DOPC/chol and 80:20 DPPC/chol, respectively.
4.3 Sample and AC electrics field
To build the experimental cell, we first clean the ITO-coated glass slides (0.7 mm thickness) by sonicating them for 5 min in ethanol, then 5 min in pure MilliQ water, and finally drying them with compressed air. Then, we placed a spacer (120 μm) on the conductive side of one of the ITO slides and filled it with 10 mg ml−1 P-S-sulfonate (PSS), and left it for 10 min. Then the remaining PSS was removed and the excess was rinsed 5 times with MilliQ water. A volume of the dispersion of the phase-separated GUVs in pure MilliQ water (7.4 μl) containing the GUVs was placed into the spacer and covered with an unfunctionalized ITO slide. Electrodes were attached to the cell with copper tape and connected to a function generator (Keysight 33500B Waveform Generator Trueform) to apply a sinusoidal AC-field ranging between 1–10 Vpp and 1–10 kHz. In order to obtain enough statistics for the study and prove their reproductivity, we have performed these experiments over different samples (over more than 100 Janus GUVs of sizes 3–7 μm and Lo/Ld ≈ 1). The samples are left to rest for 1 day for the phase separation and thus the full Janus asymmetry to recover.4.4 Microscope observation and tracking
We characterized the GUV behavior under different voltage conditions using an inverted optical microscope (Olympus IX71) equipped with a 40× objective and a CoolLED pE excitation system to observe fluorophore-labeled vesicles. Samples were imaged between 1 and 7 days after fabrication and remained stable for up to one month. Initial trajectories were recorded with a Canon EOS 77D camera using exposure times of 30 s, sufficient to reveal the presence of active motion. For quantitative analysis of activity and phase separation under controlled field conditions, we used a confocal microscope (Zeiss LSM 980 Airyscan) in fluorescence mode, with a Zeiss Axiocam 705 mono camera. Prior to recording, an AC field of 40 kHz and 1 Vpp was applied and gradually increased to 10 Vpp to ensure equilibration and attraction of GUVs to the substrate. The frequency was then reduced to 10 kHz, and videos were recorded at 2–3.5 fps for 1000 to 1200 frames using 475 nm and 555 nm LED excitation sources, with exposure times of 50–100 ms per channel. For passive Brownian motion measurements, videos were recorded at 10 fps with 50 ms exposure in each channel. To quantify the population of phase-separated GUVs, imaging was performed on non-conductive # 1 glass slides using 488 nm and 561 nm lasers. A z-step of 0.62 μm was used for confocal stacks. Due to refractive index mismatch, a correction factor k = nwater/nair was applied for accurate 3D reconstruction. Particle dynamics were analyzed using pre-optimized tracking routines in MATLAB and Fiji (ImageJ).Author contributions
Conceptualization: L. A.; formal analysis: L. A., D. F. M., V. W.; funding acquisition: L. A.; methodology: L. A., E. D., G. W., V. W.; project administration: L. A.; resources: L. A., A. B., J. C. B., V. W.; software: A. B., L. A., D. F. M.; supervision: L. A., E. D.; visualization: L. A., V. W.; writing original draft: L. A., A. B., D. M. F., V. W.; writing review and editing: L. A., A. B., J. C. B., V. W.Conflicts of interest
There are no conflicts to declare.Acknowledgements
V. W. and L. A. are thankful to Prof. M. Angelova, and Prof. H. Kellay for fruitful discussions. L. A. and V. W. acknowledge IdEx Bordeaux (France) for financial support. J.-C. Baret acknowledges the support of the ‘Fondation Simone et Cino Del Duca’. L. Alvarez, A. B., and J. C. B. acknowledge the Univ. Bordeaux (RRI Frontiers of Life). L. A. and V. W. thank Dr N. Martin and Dr E. Ducrot for access to confocal microscopy, and Dr J. P. Chapel for help with zeta (ζ)-sizer measurements. D. M. F. thanks the Comunidad de Madrid and the Complutense University of Madrid (Spain) through the Atraccion de Talento program 2022-T1/TIC-24007.Notes and references
- S. J. Ebbens, Curr. Opin. Colloid Interface Sci., 2016, 21, 14–23 CrossRef CAS
.
- E. M. Purcell, Am. J. Phys., 1977, 45, 3–11 CrossRef
- C. W. Shields and O. D. Velev, Chem, 2017, 3, 539–559 CAS
- G. Gompper, R. G. Winkler, T. Speck, A. Solon, C. Nardini, F. Peruani, H. Löwen, R. Golestanian, U. B. Kaupp, L. Alvarez, T. Kiørboe, E. Lauga, W. C. K. Poon, A. DeSimone, S. Muiños-Landin, A. Fischer, N. A. Söker, F. Cichos, R. Kapral, P. Gaspard, M. Ripoll, F. Sagues, A. Doostmohammadi, J. M. Yeomans, I. S. Aranson, C. Bechinger, H. Stark, C. K. Hemelrijk, F. J. Nedelec, T. Sarkar, T. Aryaksama, M. Lacroix, G. Duclos, V. Yashunsky, P. Silberzan, M. Arroyo and S. Kale, J. Phys.: Condens. Matter, 2020, 32, 193001 CrossRef CAS PubMed
- S. Colabrese, K. Gustavsson, A. Celani and L. Biferale, Phys. Rev. Lett., 2017, 118, 158004 CrossRef PubMed
- H. Karani, G. E. Pradillo and P. M. Vlahovska, Phys. Rev. Lett., 2019, 123, 208002 CrossRef CAS PubMed
- A. R. Sprenger, M. A. Fernandez-Rodriguez, L. Alvarez, L. Isa, R. Wittkowski and H. Löwen, Langmuir, 2020, 36, 7066–7073 CrossRef CAS PubMed
- M. A. Fernandez-Rodriguez, F. Grillo, L. Alvarez, M. Rathlef, I. Buttinoni, G. Volpe and L. Isa, Nat. Commun., 2020, 11, 4223 CrossRef CAS PubMed
- A. M. Brooks, S. Sabrina and K. J. M. Bishop, Proc. Natl. Acad. Sci. U. S. A., 2018, 115, E1090–E1099 CAS
- L. Alvarez, M. A. Fernandez-Rodriguez, A. Alegria, S. Arrese-Igor, K. Zhao, M. Kröger and L. Isa, Nat. Commun., 2021, 12, 4762 CrossRef CAS PubMed
- S. van Kesteren, X. Shen, M. Aldeghi and L. Isa, Adv. Mater., 2023, 35, 2207101 CrossRef CAS PubMed
- M. Medina-Sánchez, L. Schwarz, A. K. Meyer, F. Hebenstreit and O. G. Schmidt, Nano Lett., 2015, 16, 555–561 CrossRef PubMed
- A. F. Demirörs, M. T. Akan, E. Poloni and A. R. Studart, Soft Matter, 2018, 14, 4741–4749 RSC
- A. Aubret, Q. Martinet and J. Palacci, Nat. Commun., 2021, 12, 6398 CrossRef CAS PubMed
- M. Seyrich, Z. Alirezaeizanjani, C. Beta and H. Stark, New J. Phys., 2018, 20, 103033 CrossRef
- Z. Wang, Z. Wang, J. Li, S. T. H. Cheung, C. Tian, S.-H. Kim, G.-R. Yi, E. Ducrot and Y. Wang, J. Am. Chem. Soc., 2019, 141, 14853–14863 CrossRef CAS PubMed
- Z. Wang, Z. Wang, J. Li, T. Changhao and Y. Wang, Nat. Commun., 2020, 11, 2670 CrossRef CAS PubMed
- S. Ketzetzi, L. Caprini, V. Willems, L. Alvarez, H. Löwen and L. Isa, arXiv, 2024, preprint, arXiv:2501.00672 DOI:10.48550/arXiv.2501.00672.
- R. W. Verweij, J. Melio, I. Chakraborty and D. J. Kraft, Phys. Rev. E, 2023, 107, 034602 CrossRef CAS PubMed
- S. Song, A. F. Mason, R. A. J. Post, M. D. Corato, R. Mestre, N. A. Yewdall, S. Cao, R. W. van der Hofstad, S. Sanchez, L. K. E. A. Abdelmohsen and J. C. M. van Hest, Nat. Commun., 2021, 12, 6897 CrossRef CAS PubMed
- J. F. Boudet, J. Lintuvuori, C. Lacouture, T. Barois, A. Deblais, K. Xie, S. Cassagnere, B. Tregon, D. B. Brückner, J. C. Baret and H. Kellay, Sci. Robot., 2021, 6, eabd0272 CrossRef PubMed
- P. Walde, K. Cosentino, H. Engel and P. Stano, ChemBioChem, 2010, 11, 848–865 CrossRef CAS PubMed
- E. Rideau, F. R. Wurm and K. Landfester, Adv. Biosyst., 2019, 3, 1800324 CrossRef PubMed
- C. Xu, N. Martin, M. Li and S. Mann, Nature, 2022, 609, 1029–1037 CrossRef CAS PubMed
- M. Paoluzzi, R. D. Leonardo, M. C. Marchetti and L. Angelani, Sci. Rep., 2016, 6, 34146 CrossRef CAS PubMed
- C. Abaurrea-Velasco, T. Auth and G. Gompper, New J. Phys., 2019, 21, 123024 CrossRef
- Z. Peng, T. Zhou and J. F. Brady, J. Fluid Mech., 2022, 942, 942 Search PubMed
- H. R. Vutukuri, M. Lisicki, E. Lauga and J. Vermant, Nat. Commun., 2020, 11, 2628 CrossRef CAS PubMed
- V. Sharma, E. Azar, A. P. Schroder, C. M. Marques and A. Stocco, Soft Matter, 2021, 17, 4275–4281 RSC
- M. Park, K. Lee and S. Granick, Soft Matter, 2022, 18, 6419–6425 RSC
- S. Song, A. Llopis-Lorente, A. F. Mason, L. K. Abdelmohsen and J. C. V. Hest, J. Am. Chem. Soc., 2022, 144, 13831–13838 CrossRef CAS PubMed
- L. L. Nagard, A. T. Brown, A. Dawson, V. A. Martinez, W. C. K. Poon and M. Staykova, Proc. Natl. Acad. Sci. U. S. A., 2022, 119, e2206096119 CrossRef PubMed
- A. Mateos-Maroto, A. Guerrero-Martínez, R. G. Rubio, F. Ortega and F. Martínez-Pedrero, ACS Appl. Mater. Interfaces, 2018, 10, 29367–29377 CrossRef CAS PubMed
- S. M. Bartelt, J. Steinkühler, R. Dimova and S. V. Wegner, Nano Lett., 2018, 18, 7268–7274 CrossRef CAS PubMed
- A. Joseph, C. Contini, D. Cecchin, S. Nyberg, L. Ruiz-Perez, J. Gaitzsch, G. Fullstone, X. Tian, J. Azizi, J. Preston, G. Volpe and G. Battaglia, Sci. Adv., 2017, 3, e1700362 CrossRef PubMed
- A. Somasundar, S. Ghosh, F. Mohajerani, L. N. Massenburg, T. Yang, P. S. Cremer, D. Velegol and A. Sen, Nat. Nanotechnol., 2019, 14, 1129–1134 CrossRef CAS PubMed
- J. Cui, H. Jin and W. Zhan, Langmuir, 2022, 37, 11688–11694 Search PubMed
- M. Fu, T. Burkart, I. Maryshev, H. G. Franquelim, A. Merino-Salomón, M. Reverte-López, E. Frey and P. Schwille, Nat. Phys., 2023, 19, 1211–1218 Search PubMed
- M. I. Angelova and D. S. Dimitrov, Faraday Discuss. Chem. Soc., 1986, 81, 42 RSC
- H. T. Spanke, J. Agudo-Canalejo, D. Tran, R. W. Style and E. R. Dufresne, Phys. Rev. Res., 2022, 4, 023080 CrossRef CAS
- S. L. Veatch and S. L. Keller, Biophys. J., 2003, 85, 3074–3083 CrossRef CAS PubMed
- F. Ma, X. Yang, H. Zhao and N. Wu, Phys. Rev. Lett., 2015, 115, 6307 Search PubMed
- V. N. Shilov, A. V. Delgado, F. González-Caballero, J. Horno, J. J. López-García and C. Grosse, J. Colloid Interface Sci., 2000, 232, 141–148 CrossRef CAS PubMed
- T. M. Squires and M. Z. Bazant, J. Fluid Mech., 2004, 509, 217–252 CrossRef
- K. A. Riske, R. L. Knorr and R. Dimova, Soft Matter, 2009, 5, 1983–1986 RSC
- R. Dimova, N. Bezlyepkina, M. D. Jordö, R. L. Knorr, K. A. Riske, M. Staykova, P. M. Vlahovska, T. Yamamoto, P. Yang and R. Lipowsky, Soft Matter, 2009, 5, 3201–3212 RSC
- X. Yang, S. Johnson and N. Wu, Adv. Intell. Syst., 2019, 1, 1900096 CrossRef
- W. D. Ristenpart, I. A. Aksay and D. A. Saville, J. Fluid Mech., 2007, 575, 83–109 CrossRef CAS
- S. van Kesteren, L. Alvarez, S. Arrese-Igor, A. Alegria and L. Isa, Proc. Natl. Acad. Sci. U. S. A., 2023, 120, e2213481120 CrossRef CAS PubMed
- F. Thiel, L. Schimansky-Geier and I. M. Sokolov, Phys. Rev. E: Stat., Nonlinear, Soft Matter Phys., 2012, 86, 021117 CrossRef PubMed
- T. L. Min, P. J. Mears, L. M. Chubiz, C. V. Rao, I. Golding and Y. R. Chemla, Nat. Methods, 2009, 6, 831–835 CrossRef CAS PubMed
- P. Chaudhuri, L. Berthier and W. Kob, Phys. Rev. Lett., 2007, 99, 060604 CrossRef PubMed
- X. Zheng, B. ten Hagen, A. Kaiser, M. Wu, H. Cui, Z. Silber-Li and H. Löwen, Phys. Rev. E: Stat., Nonlinear, Soft Matter Phys., 2013, 88, 032304 CrossRef PubMed
- E. Lemaitre, I. M. Sokolov, R. Metzler and A. V. Chechkin, New J. Phys., 2023, 25, 013010 CrossRef
- M. Bailey, A. Sprenger, F. Grillo, H. Löwen and L. Isa, Phys. Rev. E, 2022, 106, L052602 CrossRef CAS PubMed
- M. Staykova, R. Lipowsky and R. Dimova, Soft Matter, 2008, 4, 2168–2171 RSC
- F. Fessler, A. Stocco, M. Wittmann and J. Simmchen, Soft Matter, 2024, 20, 5904 RSC
- A. Testa, M. Dindo, A. A. Rebane, B. Nasouri, R. W. Style, R. Golestanian, E. R. Dufresne and P. Laurino, Nat. Commun., 2021, 12, 6293 CrossRef CAS PubMed
- R. Wittmann, P. A. Monderkamp and H. Löwen, Phys. Rev. E, 2023, 107, 064602 CrossRef CAS PubMed
- M. Khatami, K. Wolff, O. Pohl, M. R. Ejtehadi and H. Stark, Sci. Rep., 2016, 6, 37670 CrossRef CAS PubMed
- A. Hopkins, B. Loewe, M. Chiang, D. Marenduzzo and M. C. Marchetti, Soft Matter, 2023, 19, 8172 RSC
- E. P. Ipiña, J. dAllesandro, B. Ladoux and B. A. Camley, arXiv, 2023, preprint, arXiv:2110.10260 DOI:10.48550/arXiv.2110.10260.
Footnote |
| † Electronic supplementary information (ESI) available. See DOI: https://doi.org/10.1039/d5sm00309a |
| This journal is © The Royal Society of Chemistry 2025 |