DOI:
10.1039/D5SM00335K
(Paper)
Soft Matter, 2025,
21, 5284-5295
Morphology prediction for polymer blend thin films using machine learning†
Received
31st March 2025
, Accepted 2nd June 2025
First published on 3rd June 2025
Abstract
When two immiscible polymers are spin-coated from a common solvent, they undergo phase separation, resulting in a mesoscale morphology that depends on a host of parameters. The phase-separated morphology plays a pivotal role in determining the potential applications of blend thin films. As a guide to experimentalists, a machine learning-based classification framework is proposed that can predict the morphology of PS/PMMA blend thin films. Different experimental parameters like weight fraction of PS, molecular weight of PMMA, concentration, and substrate surface energy were used as inputs based on which the morphology type, i.e., column, hole, or island, was predicted using a multi-class classification model. Several machine learning algorithms were used to develop the proposed classifier. Support vector machine (SVM) algorithm resulted in the highest accuracy of 93.75%. An explainable machine learning algorithm was also implemented to extract valuable insights from the proposed SVM model. These insights were found to be in excellent agreement with experimental observations, thus not only enhancing the reliability of the predictive model but also the understanding of phase separation in PS/PMMA blends. Based on these insights, several guidelines are recommended to further aid in the experimental design of specific morphologies. An easy-to-use web tool is also developed so that the proposed model can be accessed freely, which is expected to expedite the design of application-specific thin films.
1. Introduction
Polymer thin films and coatings with complex micro or nanoscale structures and structure-dependent properties are of substantial interest to multiple industries in areas such as nanoelectronics, optoelectronics, superhydrophobic and self-cleaning surfaces, nanobiotechnology, lab-on-a-chip devices, and so on.1–5 Particular interest has been shown in this regard towards the study of polymer composites and polymer blend thin films, which display different properties using the same component polymers and have piqued the curiosity of material scientists for a few decades.2,6–9 Spin coating of an immiscible polymer blend on a flat substrate leads to the formation of a structured film as a result of phase separation, which is the desired objective as these formed microstructures can have different applications. However, the exact morphology of a phase-separated blend film is influenced by multiple parameters such as the concentration of polymer solution, the fraction of each polymer, polymer molecular weights, type of solvent, type of substrate, spin speed and so on.10–14 Several of these parameters tend to act in antagonistic manners and influence each other, which makes the prediction of the morphologies using existing theories or models a challenging task. To the best of our knowledge, there is no single model that can be used to predict the morphology of phase-separated polymer blend thin films. Repeated cycles of experimental trial and error may be required to design coatings with a desired morphology for specific applications.
The mechanics behind bulk phase separation of polymer blends have been studied extensively and well understood, as evidenced by the works of de Gennes and others.7,15 Studies on these bulk polymer blends were conducted to understand the thermodynamics and kinetics of the formation of morphologies, based on the enthalpy and entropy of mixing of the component polymers.16 Other studies in the field focused on understanding blends based on existing thermodynamic mechanics, such as Flory Huggins’ theory and equation of state theories such as the Sanchez–Lacombe equation.17 While these works have great merits of their own, the assumptions made in these studies may not be applicable when studying the phase separation kinetics of polymer blend thin films. Preferential wetting of the component polymers by the common solvent of dissociation, as well as the substrate surface energy, are examples of factors that need to be accounted for when studying the phase separation kinetics of polymer blend thin films.7 A few groups have tried to model for blend thin films incorporating preferential component attraction to the substrate and evaporation kinetics of the solvent during thin film formation.18–21 While these models try to incorporate thin film parameters, they still contain several assumptions or are complicated to implement. For example, Wodo et al. incorporated solvent evaporation induced phase separation in their computational approach but they assumed uniform solvent evaporation and no other mass losses which will not be true in case of spin coating.18 Schaefer et al. assumed incompressibility of the system to suppress inhomogeneities in density along with uniform and steady evaporation.19 Cummings et al. successfully included evaporative flux but neglected the effects of viscosity to that of diffusion.20 Coveney et al. included lateral and vertical phase separation depending on surface-blend interaction but for a binary blend system without a solvent.21 Heriot et al. were the first group to collect empirical in situ observations during the spin coating of polymer blends to obtain mechanistic insights into morphology development. They attempted to correlate morphology with the processing conditions so that desired phase-separated structures could be fabricated, though their observations are material-specific.22 Determining correlations or patterns between the multiple experimental parameters and the final morphology empirically can have several bottlenecks as it requires appreciable dedication of time and resources, and the sensitive nature of these experiments may often lead to inconsistent results. The aforementioned challenges associated with understanding and controlling the phase separation in polymer blend thin films, coupled with their multidimensional nature, necessitates the incorporation of machine learning (ML) as a promising solution. However, the application of ML in microscale and nanoscale polymeric systems is still in its infancy.23–25 There are very few works that use experimental data to design ML models that can explore the complex interactions between important fabrication parameters, particularly in the morphology prediction of block co-polymers (BCPs) or polymer blends. Tu et al., in one of the pioneering works that applied ML in polymeric science, explored the use of neural networks (NN) in predicting the morphology of BCP films upon solvent annealing.26 Li et al. employed deep convolutional NNs to analyze structure property relations of material systems.27 Vargo et al., in a recent work, demonstrated the capability of regression models in predicting the structural properties of complicated systems such as nanoparticle containing block copolymer nanocomposites.24 While a binary polymer blend is a relatively simpler system that can be explained by existing phase diagrams and theories, spin-coated blend thin films are complicated systems with no existing theories comprehensive enough to predict the final morphology or the interplay between the various process parameters. By leveraging ML algorithms, data-driven models can be developed for morphology prediction that captures the intricate relationships between various parameters influencing phase separation, such as substrate properties, polymer characteristics, blend composition, and film thickness.
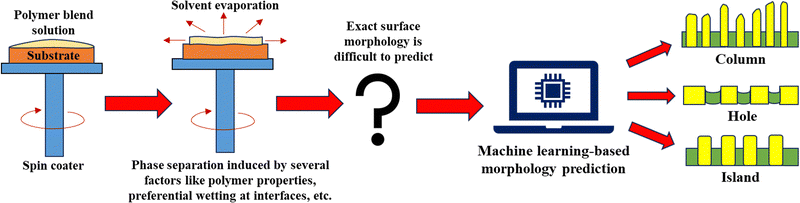
The objective of this study is to design an ML-assisted morphology classification model using an experimental dataset of blend thin films. Fig. 1 presents a schematic overview of the proposed ML-based framework, which can complement the conventional microscopy-based morphology identification of blend thin films. As evident from Fig. 1, the role of the proposed ML model will be to accurately predict the morphology and guide the experimentalists to create morphologies as required thereby reducing the need for a large number of experiments. Polystyrene (PS)/poly(methyl methacrylate) (PMMA) blends are widely studied in the literature owing to the combination of their similar mechanical and optical properties and immiscible nature, making them an excellent model system for investigating phase separation behavior in polymer blend thin films.28,29 PS/PMMA blends with a variety of phase-separated morphologies also find applications in several areas of interest, including nanolithography, antimicrobial agents, and anti-reflection coatings.30–32 Understanding the phase behavior and morphology of PS/PMMA blend thin films is essential for optimizing their performance in each of these applications. Thus, the overarching goal of this study are as follows: (1) develop a multi-class classification model that uses different experimental parameters as inputs to predict the PS/PMMA blend morphology as column, island, or hole. (2) Implement an explainable ML algorithm to unveil the impact of different factors on morphology prediction, which can further aid in the experimental design of specific PS/PMMA blend morphologies. (3) Deploy the proposed ML model in the form of an easy-to-use web tool such that it can be accessed freely by the scientific community, thereby enhancing the usability of the proposed morphology prediction model for PS/PMMA blends.
 |
| | Fig. 1 Schematic illustration of the proposed framework for morphology prediction of PS/PMMA blend thin films. | |
2. Methodology
2.1 Preparation of PS/PMMA blend thin films
Polystyrene (PS, Mw,PS = 280k, PDI = 1.04, Sigma, UK), polymethyl methacrylate (PMMA, Mw,PMMA = 350k, PDI = 1.4902, Sigma, UK) and PMMA (Mw,PMMA = 120k, PDI = 1.04, Sigma, UK) were used as purchased. The polymers (i.e., PS and PMMA) were mixed in different composition ratios of PS![[thin space (1/6-em)]](https://www.rsc.org/images/entities/char_2009.gif) :PMMA (w/w varying as 3:1, 1:1, and 1:3). The polymer was dissolved in toluene (w/v%) to make blend solutions of varying concentrations from 0.25–3% to be coated on different substrates using a spin coater (Spin NXG M1, Apex Instruments, India). The spin coating parameters, such as RPM and time, were maintained constant at 2500 RPM and 60 s, respectively. The thin films were placed in an air oven after coating for 2 h at 60 °C to remove residual solvents.
:PMMA (w/w varying as 3:1, 1:1, and 1:3). The polymer was dissolved in toluene (w/v%) to make blend solutions of varying concentrations from 0.25–3% to be coated on different substrates using a spin coater (Spin NXG M1, Apex Instruments, India). The spin coating parameters, such as RPM and time, were maintained constant at 2500 RPM and 60 s, respectively. The thin films were placed in an air oven after coating for 2 h at 60 °C to remove residual solvents.
The prepared blend solution was coated on four different types of substrates of varying surface energy: glass, silicon wafers, crosslinked PDMS films and silica sol–gel films. Glass slides and silicon wafers were cut in the dimensions of 1.5 cm × 1.5 cm, cleaned using RCA cleaning protocols and were used as substrates. Polydimethylsiloxane (PDMS, Sylgard 184, Dow Corning, USA) consisting of oligomer (part A) and cross-linking agent (part B) was mixed in the ratio of 10:1 and was diluted in n-hexane (10% w/v). The PDMS solution was spin-coated on cleaned glass substrates at 2500 RPM for 60 s. The coated films were cured in an air oven at 90 °C for 10 h to complete the cross-linking process. The cross-linked PDMS films were used as the third substrate for blends. The fourth substrate was flat sol–gel films made of silica sol, subjected to thermal annealing to generate the oxide phase in the gel films. The details of the fabrication process have been explained in the referred article.33 The surface energy of all four substrates was determined by measuring the contact angle using a goniometer (MDU-4D, Apex Instruments, India). The contact angle of three probing liquids, namely water, ethylene glycol and toluene, were measured on each substrate and the surface energy was determined using the empirical Young–Dupre eqn (1) and (2) as given below:34
| |  | (1) |
| |  | (2) |
where
γLWS,
γ+S and
γ−S are the dispersive, acid and base components of the surface energy of the solid substrate, respectively.
θE is the equilibrium contact angle (CA) of the probing liquid on the solid substrate.
γLWS,
γ+L and
γ−L are the dispersive, acid and base components of surface tension of the probing liquids, respectively. Four parameters known to influence morphology formation were varied during experiments, namely concentration of solution (
Cn), weight fraction of PS (
wPS), molecular weight of PMMA (
Mw,PMMA), and substrate surface energy (
γS). These parameters were chosen based on available materials as well as their importance in deciding the final blend morphology as reported by experimentalists.
7 The different values for these four features are listed in
Table 1.
Table 1 Experimental values of the different features
| Features |
Symbol |
Values |
Number of data points |
| Concentration (%) |
C
n
|
0.25 |
9 |
| 0.50 |
10 |
| 0.75 |
9 |
| 1 |
23 |
| 2 |
23 |
| 3 |
6 |
|
|
| Weight fraction of PS |
w
PS
|
0.25 |
26 |
| 0.33 |
1 |
| 0.5 |
27 |
| 0.75 |
25 |
| 0.80 |
1 |
|
|
| PMMA molecular weight (Da) |
M
w,PMMA
|
120000 |
44 |
| 350000 |
36 |
|
|
| Substrate surface energy (mJ m−2) |
γ
S
|
24.2 |
19 |
| 54.1 |
19 |
| 73.3 |
31 |
| 77.3 |
11 |
2.2 AFM image analysis and morphology classification
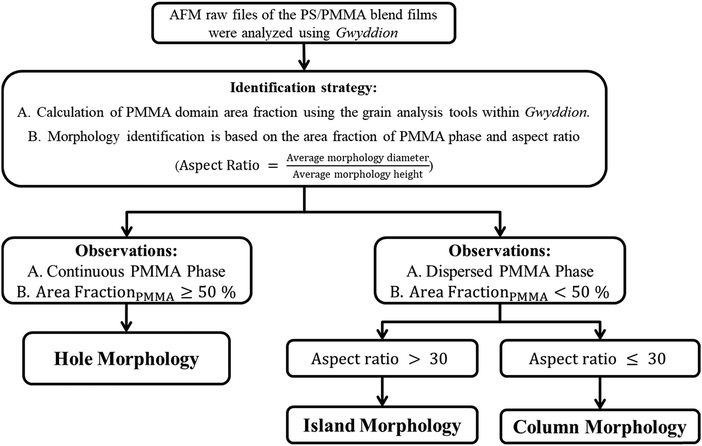
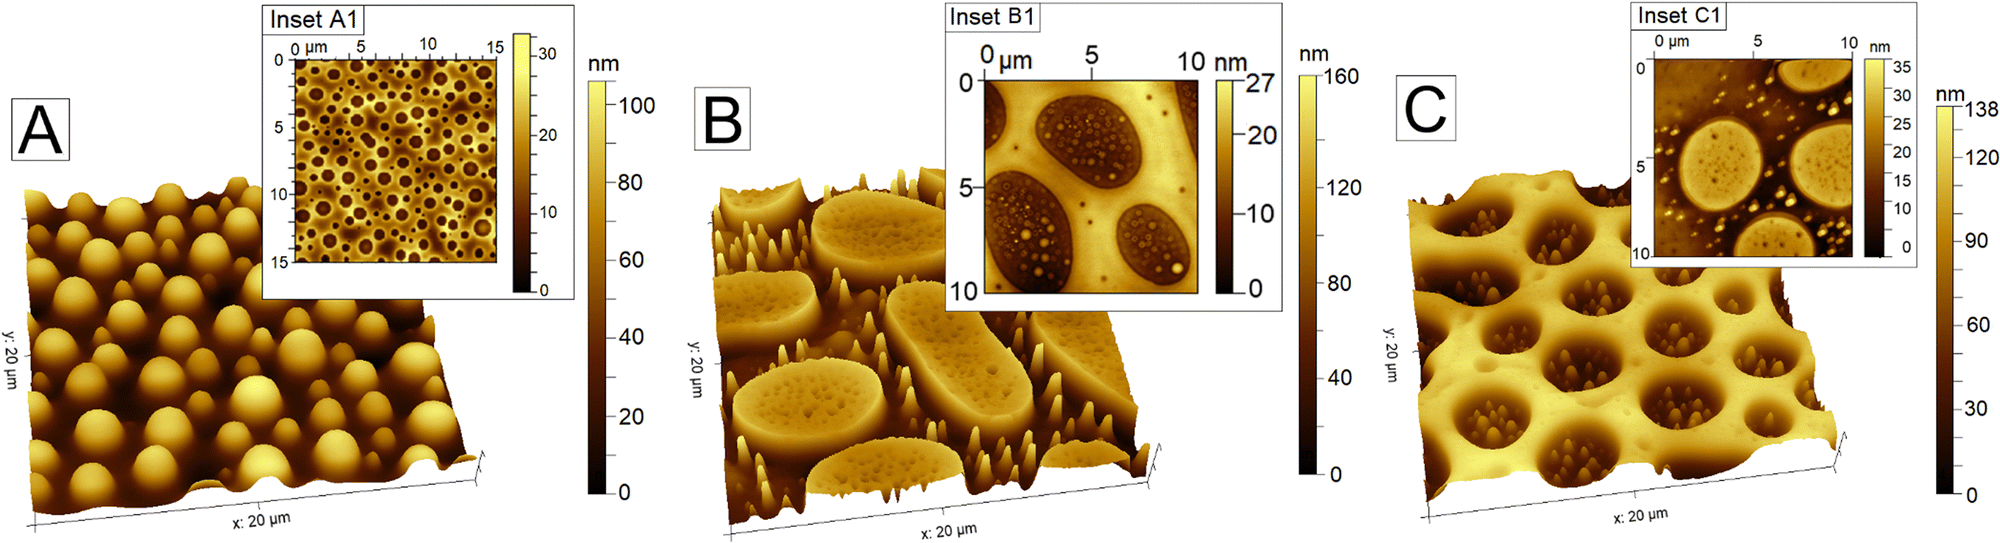
A total of 80 different PS/PMMA blend thin films were prepared experimentally by varying the four different features (Table 1). AFM (PicoScan 5100 Agilent Technologies, USA and Nanosurf CoreAFM, Switzerland) was used to image all the blend films for identification of the different formed morphologies. The AFM was operated in tapping mode (semi-contact mode) with a ∼10 nm radius silicon tip attached to a cantilever with a force constant of ∼48 N m−1 (Budget Sensor). The raw AFM images of the PS/PMMA blend films were analyzed using Gwyddion, an open-source software platform for AFM data. The PMMA-rich phase was experimentally identified through selective phase removal via UV-ozone treatment or 1-chloropentane washing. Quantitative analysis was performed using the grain analysis tools within Gwyddion to obtain PMMA area fraction, average morphology diameter, and average morphology height for each of the images. The complete dataset enumerating these parameters corresponding to all 80 images are provided in the ESI.† Based on these parameters, morphologies of the as-cast films were broadly classified into three distinct classes using the protocol as outlined in Fig. 2. In case PMMA forms a discrete phase, it can appear either as columns with rounded tops or islands with flat tops. If PMMA forms a continuous phase, the morphology is identified as holes. Fig. 3(A) represents a typical column morphology, which has vertical projections of PMMA. Fig. 3(B) shows the AFM image of an island morphology, which comprises wide columns with flat tops and some tiny scattered columns. Fig. 3(C) represents a hole morphology as the PMMA phase forms interconnected domains with depressions or cavitation on the film surface. Insets A1, B1 and C1 of Fig. 3 show the morphology of the blend films after selective etching of the PMMA phase using UV-ozone treatment (PSD Pro UV-4, Novascan, USA). UV-Ozone exposure degrades PMMA much faster than PS and can be used to selectively remove the PMMA phase and identify the blend domains.35,36 The inset AFM images confirm that the columns, islands and the interconnected domain in case of holes are, in fact, made up of PMMA polymer. Each of the 80 different blend film images were identified to be one of these three morphologies i.e., column, hole, or island.
 |
| | Fig. 2 Image analysis protocol used for classifying the experimental AFM data into different morphology types. | |
 |
| | Fig. 3 AFM images of the phase-separated morphology of as-cast PS/PMMA blend thin films (Mw: 280k/350k) spin-coated on cross-linked PDMS substrates from a 1% solution in toluene. The composition ratio varies as (A) 3:1, rounded discrete columns of PMMA in a continuous PS matrix; (B) 1:1, larger discrete PMMA islands with flat tops in a PS matrix; and (C) 1:3, continuous interconnected domain of PMMA with holes containing PS which formed the discrete phase. Insets A1, B1, and C1 show the morphology of the PS phase after selective etching of PMMA using UV-ozone treatment. | |
2.3 Classification framework
The dataset used for developing the proposed classification framework consists of 4 input features (wPS, Mw,PMMA, Cn, and γS, as given in Table 1) and the type of morphology (i.e., column, hole or island) as output corresponding to each of the 80 AFM images. These 80 AFM images consist of 41 columns, 20 holes, and 19 islands, as their respective morphologies. The objective of the ML model was to use these input features and predict the morphology. In this study, three different morphologies were identified as target outputs, thus leading to a multi-class classification problem. The classifier was developed using five different ML algorithms: logistic regression (LR), k-nearest neighbors (KNN), Gaussian Naïve Bayes (GNB), extreme gradient boosting (XGBoost), and support vector machine (SVM). LR is considered to be the simplest algorithm for developing a classifier. It uses a logistic function  where z is a linear combination of the k independent features.37 The geometrical space can be demarcated into classification zones by constructing k-dimensional planes, making this a parametrized model that can be interpreted with relative ease.38 KNN is a non-parametric classification algorithm that works on the principle of Euclidean distance or the L2 norm.39 Each sample is compared to their nearest and closely resembling neighbours and classified accordingly. The performance of a KNN classifier depends strongly on the choice of ‘k’, i.e., the nearest neighbors.40 NB is based on the Bayes’ theorem of probabilities. It is a non-iterative classifier that assumes feature independence, which in turn provides for an implicit regularization thereby reducing model variance.41 XGBoost employs an ensemble ML method of gradient boosting, which involves the creation of multiple weak learners and a reliably accurate predictive model that learns from all the weak learners. Regularization constraints are added to the gradient boosting algorithm to tackle overfitting.42 SVM model generates hyperplanes, which are boundaries that the model allocates for differentiating the classes. The SVM algorithm uses a kernel-based approach that aids in the classification of nonlinear data points by transforming linearly inseparable data into a high dimensional space such that a linear hyperplane can classify data points.43,44 The Gaussian radial basis function (RBF) kernel is usually found to be very effective for developing nonlinear SVM model with good generalization capability that prevents overfitting.45,46 The dataset was divided into training and test sets in the ratio of 80:20, i.e., 64 training points and 16 test points. Data splitting was done via a stratified sampling strategy to ensure the same ratio of different morphologies in both training and test data set. To account for randomness of splits, this process of data splitting was repeated 10 times, thereby generating 10 different splits each consisting of 64 training and 16 test data points. For each split, the 64 training data points were used to develop the classification model using a 10-fold cross validation with grid-search technique for hyperparameter tuning. The performance of the developed classifier was finally validated using the 16 test data points, which is completely independent of the training data set and unseen by the classification model during training.47,48 Besides accuracy, the following performance metrics were also evaluated to assess the performance of the multi-class classifiers using LR, KNN, GNB, XGBoost, and SVM based ML algorithms. Eqn (3)–(8) represent the different performance metrics used in this study.
| |  | (3) |
| |  | (4) |
| |  | (5) |
| |  | (6) |
| |  | (7) |
| |  | (8) |
Classification problems have four components that are used to classify the predictions made i.e., true positives (TP), true negatives (TN), false positives (FN), and false negatives (FN).48 These components are represented in the form of a confusion matrix. The confusion matrix for a three-class classification problem is a 3 × 3 matrix. TP for each class denotes the number of points in the test data set that are correctly identified. The diagonal elements of rows 1, 2 and 3 in the confusion matrix represent the TPs for class 1 (column), class 2 (hole) and class 3 (island) respectively. The FP for class 1 would be the number of test data points incorrectly identified as class 1 when the actual class is either class 2 or class 3. The FN values of class 1 would be the number of data points identified as either class 2 or class 3 when in reality the data point belonged to class 1. The TN values for class 1 are the data points correctly identified as belonging to either class 2 or class 3 and not to class 1. Similarly, this can be extended to class 2 and class 3, to generate the entire confusion matrix.
2.4 Explainable machine learning: SHAP analysis
Despite being advantageous in solving many problems, nonlinear models are observed to lack explainability.49 To address this limitation, SHAP (SHapley Additive exPlanations) analysis an explainable machine learning technique was implemented in this study. SHAP is a technique that allows for the interpretation and better understanding of the decisions made by ML models. SHAP is based on cooperative game theory, where the features of the models become the different players and the outcome predicted by the model is envisioned as the payout of the game.50 SHAP analysis elucidates the relevance and impact of each of the input features on the model's predictions.50 Once employed on the ML model, SHAP analysis generates certain weights for each of the features used to train the predictive model. A higher weight corresponds to a positive impact on the result and lower weight corresponds to a negative impact on the result.46 SHAP analysis was deployed in this study to understand the importance of the 4 different features and their impact on morphology prediction.
3. Results and discussion
3.1 Insights from experiments
Thermodynamic factors such as free energy of mixing (ΔGm), processing temperature (T) and the presence of additives or impurities play a role in deciding the morphology of bulk polymer blends. The Gibbs’ free energy of mixing for a binary polymer blend is shown in eqn (9).where ΔHm and ΔSm correspond to the enthalpy of mixing and entropy of mixing, respectively. The Flory–Huggins equation relates the free energy of mixing to the volume fraction of the component polymers, as denoted by eqn (10),| |  | (10) |
| |  | (11) |
where φ1 and φ2 represent the volume fractions, N1 and N2 are the number of molecules, k is the Boltzmann constant, χ12 is the Flory interaction parameter value, which can be calculated using eqn (11), Vm is the molar volume of the polymer, and δ1 and δ2 are the Hildebrand solubility parameters of pure component 1 and 2 respectively. The value of χ12 provides insights into the conditions for phase separation and compatibility of the component polymers.51 The physical interpretation of eqn (9) is that morphologies are formed during phase separation with the objective of reducing the system's energy for greater stability. The stability can be evaluated using a phase diagram for binary polymer mixtures which comprises of stable, metastable and unstable regions as a function of composition and temperature. While nucleation and growth dominate in the metastable region, leading to binodal phase separation (dispersed phase morphology), spinodal phase separation can happen in thermodynamically unstable blends, which results in bicontinuous phase separated morphology. PS/PMMA blends typically exhibits upper critical solution temperature (UCST) behavior as the polymer blend is immiscible at lower temperatures but becomes miscible at higher temperatures, below a critical temperature called the UCST.51χ12 decreases with increasing temperature, promoting miscibility at higher temperatures. At UCST, interaction parameter reaches a critical value, χC, which means that the system is at the threshold of miscibility. From eqn (11), it is evident that  thus upon decreasing temperature for a PS/PMMA blend system, as χ12 > χC > 0, phase separation will occur. Spin coating of blend thin films involves spinning and evaporation of solvent containing both the component polymers on a substrate, phase separation, and formation of the final morphology on the substrate. As solvent evaporation will lead to reduction in temperature, the polymers become immiscible, phase separate and the final morphology (binodal or spinodal) depends on the rate of cooling. The process of spin coating is more complicated as the final phase separated morphology is not only a function of χ12 but also Cn, X, Mw, γS, choice of solvent and solubility parameters, and effect of centrifugal forces, Coriolis forces, etc.7 For the PS/PMMA blend system being studied in this work, the different property values of the two-component polymers, the solvent toluene, and the substrates used have been tabulated in Table 2.
Table 2 Material properties9
| Material |
Hildebrand solubility parameter, δ (cal cm−3)0.5 |
Glass transition temperature (°C) |
Surface energy/surface tension, γ (mJ m−2 or mN m−1) |
| PS (280k Da) |
9.1 |
100 |
41.9 |
| PMMA (350k Da) |
9.5 |
122 |
43.5 |
| PMMA (120k Da) |
9.5 |
114 |
41.1 |
| Toluene |
8.9 |
— |
27.9 |
| Crosslinked PDMS |
— |
— |
24.2 |
| Silicon wafer |
— |
— |
54.1 |
| Glass |
— |
— |
73.3 |
| Sol–gel film |
— |
— |
77.3 |
The mechanism of blend thin film phase separation has been proposed in various experimental works based on different characterization techniques and parametric understandings.22,52–54 During spin coating, a significant amount of the polymer solution is splashed out. As the remaining solution evaporates, the solution concentration increases. Polymer–solvent combinations with minimal differences in Hildebrand parameters exhibit higher solubility and greater stability.55 Consequently, PMMA, having lower solubility in toluene, undergoes phase separation first and deposits onto the substrate. The spreading of PMMA on the substrate depends on the disparity between the γ values of PMMA and the substrate. Simultaneously, at the air–polymer interface, the polymer with the lower γ, such as PS, preferentially covers to reduce the overall surface energy and achieve stability.22 On a crosslinked PDMS substrate, neither polymer shows a preference for the substrate. However, PMMA, being unfavored at the air–polymer interface, forms tall structures occupying less area, while PS forms a low-lying continuous matrix. The morphology, whether columnar or island-like for a smaller fraction of PMMA, or hole-like for a higher fraction of PMMA (Fig. 2), is determined by the value of wPS. This analysis suggests that, for a fixed material system, wPS is the primary parameter governing the final morphology of the blend film. Nonetheless, blend thin film morphology is highly sensitive, and variations in polymer molecular weight, film thickness, or substrate surface energy can alter the morphology type, even for similar compositions. For instance, on a cross-linked PDMS substrate, a 1% 1:1 blend of PS (280k)/PMMA (350k) formed an island-type morphology (Fig. 3B), whereas a 1% 1:1 blend of PS (280k)/PMMA (120k) resulted in a columnar morphology. Thus, determining the precise influence of certain parameters on the formation of different morphologies is challenging based solely on experimentation or limited theories. In this context, predictive analysis using ML algorithms can provide valuable insights that can greatly aid in comprehending the blend morphology.
3.2 Performance of classification models
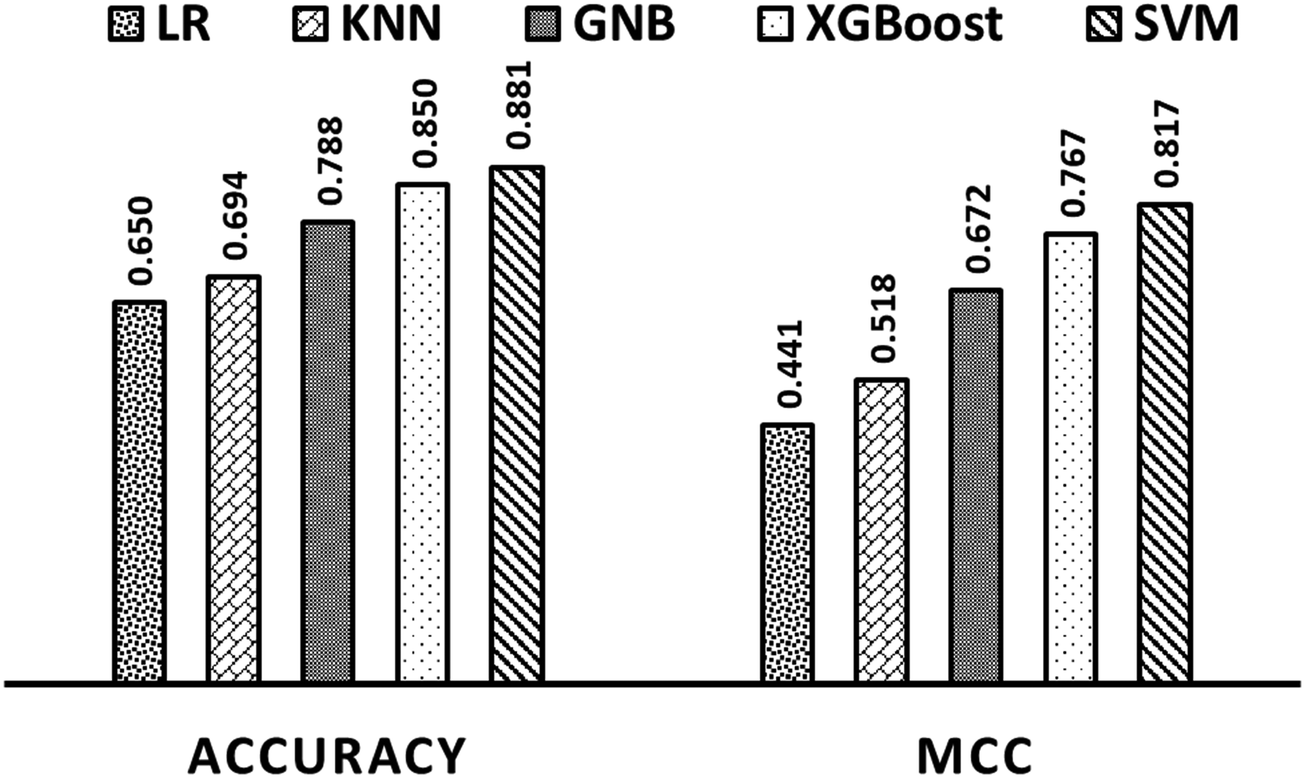
Using five different ML algorithms and ten different splits of dataset, multi-class classification models were developed. The performance of the classifier obtained for each ML algorithm were assessed using the same test datasets, which were completely unseen to the model during the training phase. Besides accuracy, MCC is also an important metric to assess the performance of a classification model. A high value of MCC implies that the classification model has achieved good results in all four aspects of the confusion matrix i.e., true positives, true negatives, false positives, and false negatives.56 The average accuracy and MCC values across ten runs for each ML algorithm is presented in Fig. 4. Based on the results obtained, SVM algorithm was found to display the highest average accuracy and MCC values compared to the other ML algorithms. Hence, SVM-based classifier was selected as the best classification model for predicting the morphology with an accuracy of 93.75% and an MCC value of 0.9056. Table 3 shows the values of different performance metrics along with confusion matrix corresponding to the best SVM classification model evaluated on the test dataset. It is evident from the results obtained that the SVM algorithm has achieved reasonable performance with respect to all metrics for each of the three classes. Thus, the proposed SVM-based multi-class classification model can be used reliably to predict the morphology for PS/PMMA blends.
 |
| | Fig. 4 Average accuracy and MCC values across 10 runs for different ML algorithms. | |
Table 3 Performance metrics and confusion matrix for the best SVM model
| Performance metric |
Value |
| Accuracy |
0.9375 |
| Precision (column, hole, island) |
1, 0.8, 1 |
| Recall (column, hole, island) |
1, 1, 0.75 |
| Specificity (column, hole, island) |
1, 0.9167, 1 |
|
F1 score (column, hole, island) |
1, 0.8889, 0.8571 |
| MCC |
0.9056 |
| Confusion matrix |
Column |
Hole |
Island |
| Column |
8 |
0 |
0 |
| Hole |
0 |
4 |
0 |
| Island |
0 |
1 |
3 |
3.3 Insights from SHAP analysis
SHAP analysis enhances the interpretability of ML models by quantitatively measuring the impact of individual features on specific predictions. Thus, SHAP analysis was implemented to extract valuable insights from the proposed multi-class SVM classification model that resulted in the highest accuracy. The SHAP summary plot as given in Fig. 5 shows that out of the four features, wPS has the highest impact on morphology prediction followed by Mw,PMMA, Cn, and γS. These findings corroborate well with the experimental observations documented in the literature pertaining to PS/PMMA blends. For instance, PS/PMMA blends exhibit an island-like morphology when wPS < 0.5. However, when wPS ≥ 0.5 the height of the morphologies increases, leading to column formation.57 Ton-That et al. also observed a variation in the type of morphology for PS/PMMA blends from holes to a columnar surface with a decrease in the value of wPS.58 Xue et al. reviewed various works on blend thin films, highlighting the complex and antagonistic influences of multiple parameters.7 For instance, at low Mw,PMMA, PMMA may preferentially segregate at the surface despite PMMA having a higher value of γ than PS, indicating that Mw,PMMA can be a more critical factor than γ.59 Additionally, research on the dependence of PS/PMMA blend morphology on film thickness and γS indicates that γS plays a significant role only when the film thickness falls below a certain threshold relative to concentration.57 Different morphologies, such as columns, islands, and holes, were observed with an increase in Mw,PMMA.11γS can also influence lateral and normal phase separation during spin coating by affecting the preferential aggregation of one polymer at the substrate, as reported by Walheim et al.13 The thermodynamic stability of a thin polymer film over a solid surface is governed by the type of substrate (γS) as substrates with low γS can lead to spontaneous film rupture and dewetting. For a polymer blend thin film, the two polymers generally exhibit different wetting tendencies during spin coating depending on γS, which can drive the blend to adopt different phase separation pathways. Low γS substrate such as crosslinked PDMS do not have a strong preferential wetting for either constituent polymer. The phase separation is mainly driven by the miscibility of PS and PMMA in toluene solvent, concentration and composition. Under these conditions, an increased tendency for hole formation is observed, likely due to the early phase separation and deposition of PMMA as interconnected thread-like structures. This is also accompanied by an increase in the average surface roughness or height. In contrast, on sol–gel derived substrates with high γS, both PMMA and PS exhibit favorable wetting behavior, resulting in island-like morphologies with reduced vertical dimensions.
 |
| | Fig. 5 SHAP summary plot in which the four features are listed on the vertical axis, and the horizontal axis represents their relative impact on morphology prediction. | |
A deeper understanding of how individual input parameters influence morphology and their effectiveness as tuning factors is essential for assessing their significance. Fig. 6(A)–(C) elucidate the impact of different input parameters on the individual morphologies i.e., column, hole, and island, respectively. Fig. 6(A) suggests that column formation is favored at higher values of wPS (i.e., lower PMMA fraction) and Cn, and lower values of Mw,PMMA. From Table 2, it is evident that lower Mw,PMMA has lower value of γ, which tends to enrich the air–polymer interface. As a consequence, γS has minimal impact on column formation for PS/PMMA blends. Fig. 6(B) shows that lower values of wPS (i.e., higher PMMA fraction) and higher values of Mw,PMMA favored the formation of holes. In addition to this, the lower surface energy differences between the substrate and PMMA promote holes as the elevation is reduced. Fig. 6(C) indicates that higher values of Mw,PMMA and γS favor the formation of islands whereas higher values of wPS (i.e., lower PMMA fraction) strongly hinders island formation. While γS has little effect on column formation, lower γS values promote hole formation, whereas higher γS values lead to island formation. This insight provides a deeper understanding of how blend thin films evolve during spin coating, and highlights the preferential wetting of the surface by PMMA.9 Based on the values of solubility parameters, PMMA, which has lower solubility in toluene, undergoes phase separation first and deposits onto the substrate. If the substrate has higher γS, it should facilitate PMMA spreading and hole formation. However, SHAP analysis indicates that increasing γS also enhances spreading of PS in toluene solution, which inhibits hole formation and instead drives PMMA to deposit as islands. This effect is particularly pronounced in blends with a higher PMMA fraction (wPS = 0.25).
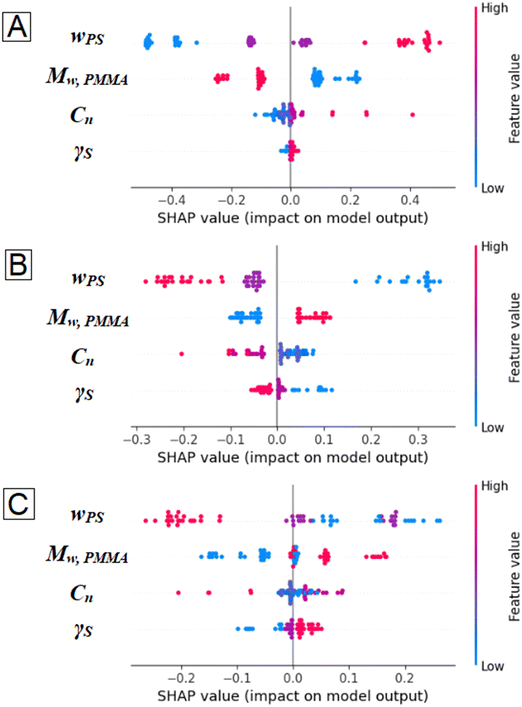 |
| | Fig. 6 SHAP summary plots for (A) column, (B) hole and (C) island. Impacts on model's predictions are on the horizontal axis, and features are on the vertical axis. High feature values are labelled in red, low values are labelled in blue and intermediate values are labelled in purple. | |
Results obtained from the SHAP analysis can be used to set the values of different features in experiments for producing desired morphologies. If the goal of an experiment is to produce a PS/PMMA blend with column morphology, it can be inferred from Fig. 6(A) that high values of wPS and Cn and low values of Mw,PMMA would result in column formation. Similarly, from Fig. 6(B) it is observed that lower values of wPS, Cn, and γS, and higher values of Mw,PMMA are required for formation of holes. It is evident from Fig. 6(C) that to obtain a PS/PMMA blend with island morphology, experiments need to be conducted with higher values of Mw,PMMA and γS, and low to intermediate values of wPS. The least impactful feature, most impactful feature, and easily tunable features for a specific morphology can also be inferred from the SHAP plots (Fig. 6). Variation in the values of the least impactful feature will have minimal effect on the outcome of the synthesis of the PS/PMMA blend with the desired morphology. For instance, it can be inferred from Fig. 6(A) that choice of substrate has a relatively less impact on the formation of columns as compared to PS fraction in the blend. At the same time, Fig. 6(B) and (C) shows that changing γS from a lower value to a higher value can change the morphology of the same polymer blend from hole to island. Table 4 enumerates all of these findings, which will aid in the design of experiments to prepare PS/PMMA blends with a desired morphology.
Table 4 Design guidelines for preparing desired morphologies
| Morphology |
Composition |
PMMA molecular weight |
Concentration |
Substrate surface energy |
| Column |
High |
Low |
Avoid low |
Minimal impact |
| Hole |
Low |
High |
Low |
Low |
| Island |
Low to moderate |
High |
Avoid high |
High |
3.4 Experimental validation
The proposed classification model was further validated by performing additional experiments. A total of 8 different PS/PMMA blend thin film experiments were carried out as per the methodology elucidated in Section 2.1. The raw AFM images obtained for each of these new experiments were analyzed as per the protocol explained in Section 2.2 to obtain the actual morphology types (column/hole/island). Readers may refer to the ESI,† for additional details pertaining to AFM image analysis. Corresponding to each experiment, the input feature values were used to predict the morphology using the proposed classification model and results were compared with the actual morphology. Input dataset pertaining to these 8 experiments and the comparative prediction analysis is given in Table 5. It is evident that the proposed model predicted the morphology for each of the newly performed experiments correctly, which further enhances the reliability of the proposed model.
Table 5 Dataset and results for experimental validation
| Experiment no. |
C
n (%) |
w
PS
|
M
w,PMMA (Da) |
γ
S (mJ m−2) |
Actual morphology |
Predicted morphology: proposed model |
| 1 |
2 |
0.5 |
120000 |
43.8 |
Column |
Column |
| 2 |
2 |
0.25 |
120000 |
43.8 |
Island |
Island |
| 3 |
0.1 |
0.25 |
350000 |
73.3 |
Hole |
Hole |
| 4 |
0.5 |
0.75 |
350000 |
24.2 |
Column |
Column |
| 5 |
3 |
0.5 |
120000 |
24.2 |
Column |
Column |
| 6 |
3 |
0.5 |
15000 |
54.1 |
Column |
Column |
| 7 |
1 |
0.2 |
350000 |
54.1 |
Hole |
Hole |
| 8 |
1 |
0.8 |
350000 |
54.1 |
Column |
Column |
3.5 Web tool development
An easy-to-use web tool was developed that can be used to predict the morphologies for PS/PMMA blends. The web tool provides a well-defined interface for users to input the values of the different features and obtain the corresponding morphology as the output based on the proposed classification model. The web tool can be accessed freely by using the following link: https://morphology-prediction-tool.onrender.com/.
4. Conclusion
A data-driven multi-class classification framework using ML algorithms was developed to accurately predict the morphology of PS/PMMA polymer blend thin films. ML models were trained using a labelled dataset with four inputs and one output. The inputs to the model are different experimental factors like wPS, Cn, Mw,PMMA, and γS, whereas the output consists of the morphology type, i.e., column, hole, or island. Five different ML algorithms, namely logistic regression, k-nearest neighbors, Gaussian Naïve Bayes, extreme gradient boosting, and support vector machine were implemented to perform a comparative analysis and obtain the best classification model that can accurately predict the morphology. Based on the results obtained, it was evident that the SVM algorithm led to the best classification model with the highest accuracy of 93.75%. The SVM-based model also resulted in a high MCC score of 0.9056, thus indicating that the model has achieved good performance with respect to all four aspects of the confusion matrix i.e., true positives, true negatives, false positives, and false negatives. To extract significant insights about the developed SVM model, an explainable ML algorithm i.e., SHAP analysis was implemented. Based on the results from SHAP analysis, it was observed that the wPS had the maximum impact on morphology prediction, which was followed by Mw,PMMA, Cn, and γS. These observations were found to be in alignment with the experimental observations reported in the literature, thus further enhancing the reliability of the proposed model. The precise morphology of a blend thin film is influenced by several factors, which makes it almost impossible to predict the morphology purely based on experimental considerations, though the functionality of a coating might be strongly dependent on it. To circumvent this critical limitation, a design guideline is formulated, which will allow researchers to attain a desired morphology for PS/PMMA blend thin films, thereby significantly reducing resource-intensive and time-consuming experiments. The paper also reports the development of an easy-to-use web tool based on the proposed model for morphology prediction, which can be accessed freely. The model proposed in this study is pertinent for morphology prediction of a specific polymer pair i.e., PS/PMMA blend. However, the methodology proposed in this study is generic in nature and can be extended in future to other polymer blend systems. Besides the four inputs, other factors like solvent vapor pressure, relative miscibility of the polymers in the solvent (Hildebrand solubility parameter), polymer–polymer interaction (Flory–Huggins interaction parameter), spin coating speed, etc. can also be incorporated as inputs within the model. Incorporating these aspects, along with sufficient data availability across various polymer blend systems, can enable the development of a generalized model. Leveraging machine learning predictions to modulate the morphology of polymer blends can significantly reduce resource consumption and support researchers working across a wide range of applications, including micro- and nano-fabrication, optical coatings, and antimicrobial surfaces. Consequently, this work is expected to accelerate the design of application-specific thin films.
Author contributions
Bishnu R: methodology, formal analysis, software, data curation, writing – original draft, writing – review & editing. Rabibrata Mukherjee: conceptualization, writing – review & editing. Nandini Bhandaru: conceptualization, supervision, writing – original draft, writing – review & editing. Arnab Dutta: conceptualization, methodology, supervision, writing – original draft, writing – review & editing.
Data availability
The data supporting this article have been included as part of the ESI.†
Conflicts of interest
The authors declare that they have no known competing financial interests or personal relationships that could have appeared to influence the work reported in this paper.
References
- S. C. Veenstra, J. Loos and J. M. Kroon, Nanoscale structure of solar cells based on pure conjugated polymer blends, Prog. Photovoltaics Res. Appl., 2007, 15(8), 727–740 Search PubMed.
- R. Rioboo, I. Demnati, M. Amin Ali, R. Sevkan and J. De Coninck, Superhydrophobicity of composite surfaces created from polymer blends, J. Colloid Interface Sci., 2020, 560, 596–605 CrossRef CAS PubMed.
- L. Milane, Z. Duan and M. Amiji, Development of EGFR-Targeted Polymer Blend Nanocarriers for Combination Paclitaxel/Lonidamine Delivery To Treat Multi-Drug Resistance in Human Breast and Ovarian Tumor Cells, Mol. Pharm., 2011, 8(1), 185–203 Search PubMed.
- H. Muhlberger, W. Hwang, A. E. Guber, V. Saile and W. Hoffmann, Polymer Lab-on-a-Chip System With Electrical Detection, IEEE Sens. J., 2008, 8(5), 572–579 Search PubMed.
- C. R. McNeill and N. C. Greenham, Conjugated-Polymer Blends for Optoelectronics, Adv. Mater., 2009, 21(38–39), 3840–3850 Search PubMed.
- H. W. Toh, D. W. Y. Toong, J. C. K. Ng, V. Ow, S. Lu and L. P. Tan,
et al., Polymer blends and polymer composites for cardiovascular implants, Eur. Polym. J., 2021, 146, 110249 CrossRef CAS.
- L. Xue, J. Zhang and Y. Han, Phase separation induced ordered patterns in thin polymer blend films, Prog. Polym. Sci., 2012, 37, 564–594 CrossRef CAS.
- D. U. Ahn, Z. Wang, I. P. Campbell, M. P. Stoykovich and Y. Ding, Morphological evolution of thin PS/PMMA films: effects of surface energy and blend composition, Polymer, 2012, 53(19), 4187–4194 CrossRef CAS.
- X. Liu, N. Bhandaru, M. Banik, X. Wang, A. M. Al-Enizi and A. Karim,
et al., Capillary Force Lithography Pattern-Directed Self-Assembly (CFL-PDSA) of Phase-Separating Polymer Blend Thin Films, ACS Omega, 2018, 3(2), 2161–2168 CrossRef CAS.
- A. Budkowski, A. Bernasik, P. Cyganik, J. Raczkowska, B. Penc and B. Bergues,
et al., Substrate-Determined Shape of Free Surface Profiles in Spin-Cast Polymer Blend Films, Macromolecules, 2003, 36(11), 4060–4067 Search PubMed.
- X. Li, Y. Han and L. An, Surface morphology control of immiscible polymer-blend thin films, Polymer, 2003, 44(26), 8155–8165 Search PubMed.
- K. Tanaka, A. Takahara and T. Kajiyama, Film Thickness Dependence of the Surface Structure of Immiscible Polystyrene/Poly(methyl methacrylate) Blends, Macromolecules, 1996, 29(9), 3232–3239, DOI:10.1021/ma951140+.
- S. Walheim, M. Böltau, J. Mlynek, G. Krausch and U. Steiner, Structure Formation via Polymer Demixing in Spin-Cast Films, Macromolecules, 1997, 30(17), 4995–5003 CrossRef CAS.
- A. Das, A. B. Dey, S. Chattopadhyay, G. De, M. K. Sanyal and R. Mukherjee, Nanoparticle Induced Morphology Modulation in Spin Coated PS/PMMA Blend Thin Films, Langmuir, 2020, 36(50), 15270–15282 CrossRef CAS PubMed.
- P. G. de Gennes, Dynamics of fluctuations and spinodal decomposition in polymer blends, J. Chem. Phys., 1980, 72(9), 4756–4763 CrossRef CAS.
-
Polymer Blends and Alloys, ed. M. J. Folkes and P. S. Hope, Springer Netherlands, Dordrecht, 1993 Search PubMed.
- T. A. Callaghan and D. R. Paul, Interaction energies for blends of poly(methyl methacrylate), polystyrene, and poly(α-methylstyrene) by the critical molecular weight method, Macromolecules, 1993, 26(10), 2439–2450 Search PubMed.
- O. Wodo and B. Ganapathysubramanian, How do evaporating thin films evolve? Unravelling phase-separation mechanisms during solvent-based fabrication of polymer blends, Appl. Phys. Lett., 2014, 105(15), 153104 CrossRef.
- C. Schaefer, J. J. Michels and P. van der Schoot, Structuring of Thin-Film Polymer Mixtures upon Solvent Evaporation, Macromolecules, 2016, 49(18), 6858–6870 Search PubMed.
- J. Cummings, J. S. Lowengrub, B. G. Sumpter, S. M. Wise and R. Kumar, Modeling solvent evaporation during thin film formation in phase separating polymer mixtures, Soft Matter, 2018, 14(10), 1833–1846 RSC.
- S. Coveney and N. Clarke, Pattern Formation in Polymer Blend Thin Films: Surface Roughening Couples to Phase Separation, Phys. Rev. Lett., 2014, 113(21), 218301 CrossRef PubMed.
- S. Y. Heriot and R. A. L. Jones, An interfacial instability in a transient wetting layer leads to lateral phase separation in thin spin-cast polymer-blend films, Nat. Mater., 2005, 4(10), 782–786 CrossRef CAS.
- Z. Liu, Y. X. Liu, Y. Yang and J. Li, Template Design for Complex Block Copolymer Patterns Using a Machine Learning Method, ACS Appl. Mater. Interfaces, 2023, 15(25), 31049–31056 CrossRef CAS PubMed.
- E. Vargo, J. C. Dahl, K. M. Evans, T. Khan, P. Alivisatos and T. Xu, Using Machine Learning to Predict and Understand Complex Self-Assembly Behaviors of a Multicomponent Nanocomposite, Adv. Mater., 2022, 34(32), 2203168 CrossRef CAS PubMed.
- K. Niendorf and B. Raeymaekers, Using supervised machine learning methods to predict microfiber alignment and electrical conductivity of polymer matrix composite materials fabricated with ultrasound directed self-assembly and stereolithography, Comput. Mater. Sci., 2022, 206, 111233 CrossRef CAS.
- K. Tu, H. Huang, S. Lee, W. Lee, Z. Sun and A. Alexander-Katz,
et al., Machine Learning Predictions of Block Copolymer Self-Assembly, Adv. Mater., 2020, 32(52), 2005713 CrossRef.
- X. Li, Y. Zhang, H. Zhao, C. Burkhart, L. C. Brinson and W. Chen, A Transfer Learning Approach for Microstructure Reconstruction and Structure-property Predictions, Sci. Rep., 2018, 8(1), 13461 CrossRef PubMed.
-
S. Walheim, M. Boltau, U. Steiner and G. Krausch, Phase separation in thin films of strongly incompatible polymer blends, Host Publication, Wiley, 1999, pp. 75–99 Search PubMed.
- M. Harris, G. Appel and H. Ade, Surface Morphology of Annealed Polystyrene and Poly(methyl methacrylate) Thin Film Blends and Bilayers, Macromolecules, 2003, 36(9), 3307–3314 CrossRef.
- N. Chaukura, W. Gwenzi, T. Bunhu, D. T. Ruziwa and I. Pumure, Potential uses and value-added products derived from waste polystyrene in developing countries: a review, Resour., Conserv. Recycl., 2016, 107, 157–165 CrossRef.
- U. Ali, K. J. B. T. A. Karim and N. A. Buang, A Review of the Properties and Applications of Poly(Methyl Methacrylate) (PMMA), Polym. Rev., 2015, 55(4), 678–705 Search PubMed.
- X. Li, Y. Han and L. An, Annealing effects on the surface morphologies of thin PS/PMMA blend films with different film thickness, Appl. Surf. Sci., 2004, 230(1–4), 115–124 CrossRef CAS.
- R. Deb Roy, D. Sil, S. Jana, N. Bhandaru, S. K. Bhadra and P. K. Biswas,
et al., Creation of Self-Organized Complex Meso Patterns in Sol–Gel Thin Films by Confined Capillary Dynamics, Ind. Eng. Chem. Res., 2012, 51(28), 9546–9553 CrossRef CAS.
- C. J. Van Oss, M. K. Chaudhury and R. J. Good, Interfacial Lifshitz-van der Waals and polar interactions in macroscopic systems, Chem. Rev., 1988, 88(6), 927–941 Search PubMed.
- N. Bhandaru, A. Karim and R. Mukherjee, Directed ordering of phase separated domains and dewetting of thin polymer blend films on a topographically patterned substrate, Soft Matter, 2017, 13(27), 4709–4719 Search PubMed.
- C. Tang, E. M. Lennon, G. H. Fredrickson, E. J. Kramer and C. J. Hawker, Evolution of Block Copolymer Lithography to Highly Ordered Square Arrays, Science, 2008, 322(5900), 429–432 CrossRef CAS.
-
D. G. Kleinbaum and M. Klein, Logistic Regression, Springer New York, New York, NY, 2010 Search PubMed.
- S. Dreiseitl and L. Ohno-Machado, Logistic regression and artificial neural network classification models: a methodology review, J. Biomed. Inform., 2002, 35(5–6), 352–359 CrossRef.
- L. Peterson, K-nearest neighbor, Scholarpedia, 2009, 4(2), 1883 CrossRef.
- Z. Zhang, Introduction to machine learning: k-nearest neighbors, Ann. Transl. Med., 2016, 4(11), 218 CrossRef PubMed.
- X. Wu, V. Kumar, J. Ross Quinlan, J. Ghosh, Q. Yang and H. Motoda,
et al., Top 10 algorithms in data mining, Knowl. Inf. Syst., 2008, 14(1), 1–37 CrossRef.
-
T. Chen and C. Guestrin, XGBoost, Proceedings of the 22nd ACM SIGKDD International Conference on Knowledge Discovery and Data Mining, ACM, New York, NY, USA, 2016, pp. 785–794 Search PubMed.
- C. Cortes and V. Vapnik, Support-vector networks, Mach. Learn., 1995, 20(3), 273–297 Search PubMed.
-
D. A. Pisner and D. M. Schnyer, Support vector machine, Machine Learning, Elsevier, 2020, pp. 101–121 Search PubMed.
-
R. Gholami and N. Fakhari, Support Vector Machine: Principles, Parameters, and Applications, Handbook of Neural Computation, Elsevier, 2017, pp. 515–535 Search PubMed.
- A. Bale, A. Dutta and D. Mitra, Combined charge and hydrophobicity-guided screening of antibacterial peptides: two-level approach to predict antibacterial activity and efficacy, Amino Acids, 2023, 55(7), 853–867 Search PubMed.
- I. Syarif, A. Prugel-Bennett and G. Wills, SVM Parameter Optimization using Grid Search and Genetic Algorithm to Improve Classification Performance, TELKOMNIKA, 2016, 14(4), 1502 CrossRef.
- H. C. Puchakayala, P. Bhatnagar, P. Nambiar, A. Dutta and D. Mitra, Design of a machine learning-aided screening framework for antibiofilm peptides, Digit. Chem. Eng., 2023, 8, 100107 Search PubMed.
-
S. Karamizadeh, S. M. Abdullah, M. Halimi, J. Shayan and M. J. Rajabi, Advantage and drawback of support vector machine functionality, 2014 International Conference on Computer, Communications, and Control Technology (I4CT), IEEE, 2014, pp. 63–65 Search PubMed.
-
S. Lundberg and S. I. Lee, A Unified Approach to Interpreting Model Predictions. 2017 May 22; Available from: https://arxiv.org/abs/1705.07874.
-
P. G. De Gennes, Scaling concepts in polymer physics, Cornell University Press, 1979 Search PubMed.
- M. Böltau, S. Walheim, J. Mlynek, G. Krausch and U. Steiner, Surface-induced structure formation of polymer blends on patterned substrates, Nature, 1998, 391(6670), 877–879 Search PubMed.
- A. Karim, T. M. Slawecki, S. K. Kumar, J. F. Douglas, S. K. Satija and C. C. Han,
et al., Phase-Separation-Induced Surface Patterns in Thin Polymer Blend Films, Macromolecules, 1998, 31(3), 857–862 CrossRef CAS.
- D. Mrđenović, D. Abbott, V. Mougel, W. Su, N. Kumar and R. Zenobi, Visualizing Surface Phase Separation in PS-PMMA Polymer Blends at the Nanoscale, ACS Appl. Mater. Interfaces, 2022, 14(21), 24938–24945 CrossRef PubMed.
- L. Cui, Y. Ding, X. Li, Z. Wang and Y. Han, Solvent and polymer concentration effects on the surface morphology evolution of immiscible polystyrene/poly(methyl methacrylate) blends, Thin Solid Films, 2006, 515(4), 2038–2048 CrossRef CAS.
-
M. Grandini, E. Bagli and G. Visani, Metrics for Multi-Class Classification: an Overview, 2020 Search PubMed.
- I. Prosycevas, S. Tamulevicius and A. Guobiene, The surface properties of PS/PMMA blends nanostructured polymeric layers, Thin Solid Films, 2004, 453–454, 304–311 CrossRef CAS.
- C. Ton-That, A. G. Shard and R. H. Bradley, Surface feature size of spin cast PS/PMMA blends, Polymer, 2002, 43(18), 4973–4977 CrossRef CAS.
- K. Tanaka, A. Takahara and T. Kajiyama, Surface Molecular Aggregation Structure and Surface Molecular Motions of High-Molecular-Weight Polystyrene/Low-Molecular-Weight Poly(methyl methacrylate) Blend Films, Macromolecules, 1998, 31(3), 863–869 CrossRef CAS.
Footnote |
| † Electronic supplementary information (ESI) available: Dataset used in this study is provided along with all AFM images and their corresponding parameters. See DOI: https://doi.org/10.1039/d5sm00335k |
|
| This journal is © The Royal Society of Chemistry 2025 |
Click here to see how this site uses Cookies. View our privacy policy here. 
 Open Access Article
 This Open Access Article is licensed under a Creative Commons Attribution-Non Commercial 3.0 Unported Licence
 *a and
Arnab
Dutta
*a and
Arnab
Dutta


 where z is a linear combination of the k independent features.37 The geometrical space can be demarcated into classification zones by constructing k-dimensional planes, making this a parametrized model that can be interpreted with relative ease.38 KNN is a non-parametric classification algorithm that works on the principle of Euclidean distance or the L2 norm.39 Each sample is compared to their nearest and closely resembling neighbours and classified accordingly. The performance of a KNN classifier depends strongly on the choice of ‘k’, i.e., the nearest neighbors.40 NB is based on the Bayes’ theorem of probabilities. It is a non-iterative classifier that assumes feature independence, which in turn provides for an implicit regularization thereby reducing model variance.41 XGBoost employs an ensemble ML method of gradient boosting, which involves the creation of multiple weak learners and a reliably accurate predictive model that learns from all the weak learners. Regularization constraints are added to the gradient boosting algorithm to tackle overfitting.42 SVM model generates hyperplanes, which are boundaries that the model allocates for differentiating the classes. The SVM algorithm uses a kernel-based approach that aids in the classification of nonlinear data points by transforming linearly inseparable data into a high dimensional space such that a linear hyperplane can classify data points.43,44 The Gaussian radial basis function (RBF) kernel is usually found to be very effective for developing nonlinear SVM model with good generalization capability that prevents overfitting.45,46 The dataset was divided into training and test sets in the ratio of 80


 thus upon decreasing temperature for a PS/PMMA blend system, as χ12 > χC > 0, phase separation will occur. Spin coating of blend thin films involves spinning and evaporation of solvent containing both the component polymers on a substrate, phase separation, and formation of the final morphology on the substrate. As solvent evaporation will lead to reduction in temperature, the polymers become immiscible, phase separate and the final morphology (binodal or spinodal) depends on the rate of cooling. The process of spin coating is more complicated as the final phase separated morphology is not only a function of χ12 but also Cn, X, Mw, γS, choice of solvent and solubility parameters, and effect of centrifugal forces, Coriolis forces, etc.7 For the PS/PMMA blend system being studied in this work, the different property values of the two-component polymers, the solvent toluene, and the substrates used have been tabulated in Table 2.