 Open Access Article
Creative Commons Attribution 3.0 Unported Licence
A medium-entropy garnet-type oxide as a solid electrolyte with enhanced air stability for Li-ion batteries†
Chun-Han
Kuo‡
ab,
Po-Yen
Huang‡
a,
Ai-Yin
Wang‡
a,
Hao-Yu
Liu
a,
Hsu-Chen
Cheng
a,
Chih-Heng
Lee
c,
Cheng-Rong
Hsing
de,
Shu-Yu
Chen
a,
Chien-Hao
Yeh
a,
Hsiang-Jung
Chen
a,
Huaican
Chen
gh,
Wen
Yin
 gh,
Jianyuan
Wu
 gh,
Chih-Wen
Pao
i,
Wang Hay
Kan
 *gh,
Hsin-Yi Tiffany
Chen
 *acf and
Han-Yi
Chen
 *ab
*ab
aDepartment of Materials Science and Engineering, National Tsing Hua University, Hsinchu 300044, Taiwan. E-mail: hanyi.chen@mx.nthu.edu.tw; hsinyi.tiffany.chen@gapp.nthu.edu.tw
bHigh Entropy Materials Center, Hsinchu 300044, Taiwan
cDepartment of Engineering and System Science, National Tsing Hua University, Hsinchu 300044, Taiwan
dDivision of Natural Science, Center for General Education, Chang Gung University, Taoyuan City 33302, Taiwan
eDepartment of Artificial Intelligence, Chang Gung University, Taoyuan City 33302, Taiwan
fCollege of Semiconductor Research, National Tsing Hua University, Hsinchu 300044, Taiwan
gSpallation Neutron Source Science Center, Dongguan 523803, PR China
hInstitute of High Energy Physics, Chinese Academy of Sciences, Beijing 100039, PR China. E-mail: jianhx@ihep.ac.cn
iNational Synchrotron Radiation Research Center, Hsinchu 300092, Taiwan
First published on 24th February 2025
Abstract
Garnet-type oxides are commonly used as the solid electrolytes for all-solid-state Li-ion batteries. However, the widely utilized Ta-doped Li7La3Zr2O12 (LLZO) readily reacts with CO2 and H2O in air, leading to a decrease in ionic conductivity. In this study, a novel medium-entropy garnet-type oxide, Li6.5La3Zr0.5Ta0.5Nb0.5Y0.5O12 (LLZTNYO), was successfully synthesized using a conventional solid-phase synthetic method. Ta, Nb, and Y were strategically substituted with Zr to significantly enhance conductivity, improve stability in air, and lower the sintering temperature. Neutron powder diffraction was used to resolve the unusual local structural properties of LLZTNYO. LLZTNYO achieved a high Li-ion conductivity of 1.87 × 10⁻⁴ S cm−1 and maintained a constant Li-ion conductivity for 30 days in an air atmosphere without decay, demonstrating excellent air stability. The density functional theory calculations suggest that the multi-doping strategy can effectively suppress hydration reactions and thus enhance the stability of the solid electrolyte against water. Furthermore, the Li//LLZTNYO//LiFePO4 solid state battery exhibited high capacity up to 167 mA h g−1 with excellent cycling retention of 95% after 200 cycles at 0.1C, positioning LLZTNYO as a practicable material for use as a solid electrolyte for Li-ion batteries.
1. Introduction
The increasing concerns regarding global warming and climate change, largely attributed to the utilization of fossil fuels, have underscored the urgent need for renewable and eco-friendly energy storage systems in our daily lives.1 By adopting green energy and storage solutions, significant reductions in CO2 emissions, a major contributor to global warming, can be achieved.2 Lithium metal exhibits an exceptionally high theoretical specific capacity of 3860 mA h g−1 and the lowest standard electrode potential of −3.04 V. Hence, lithium metal batteries are considered the next generation of energy storage devices.3 Despite the renowned advantages of lithium-ion batteries (LIBs), such as their high energy density, long cycle life, negligible self-discharge, rechargeability, and excellent capacity retention, the use of lithium metal in LIBs poses challenges.4–7 These challenges primarily stem from lithium dendrite formation during lithium deposition, which can lead to short circuits and even explosions. Conventional LIBs comprise a separator between the cathode and anode, filled with an organic liquid electrolyte containing a lithium salt. However, traditional polymer separators fail to effectively suppress Li dendrite penetration, posing safety risks. If lithium dendrites penetrate the separator, the batteries may be at risk of short-circuiting and even exploding.8 Additionally, the organic liquid electrolyte decomposes easily after charging to a high voltage when using high-voltage cathodes.9–11 Consequently, to develop storage devices with high energy density for the next generation, scientists are directing significant efforts toward the development of all-solid-state lithium-ion batteries (ASSLIBs). ASSLIBs employ solid-state high lithium-ion conductors as electrolytes, which can largely mitigate lithium dendrite formation.12 By eliminating the use of liquid electrolytes, ASSLIBs have the potential to become one of the most promising next-generation high-energy-density energy storage devices due to their high safety, wider electrochemical window, wider operating temperature range, and higher energy density. Among various ceramic electrolyte structures, the garnet-structured Li7La3Zr2O12 (LLZO) has garnered significant attention from scientists due to its stable electrochemical window, excellent thermal stability, and outstanding stability when in contact with lithium metal.13–16 Li7La3Zr2O12 (LLZO) was first prepared by Murugan et al. in 2007 using the traditional solid-state sintering method.17 Although tantalum (Ta)-doped LLZO, Li6.4La3Zr1.4Ta0.6O12, can achieve a high lithium-ion conductivity of 10−3 S cm−1, the garnet structure undergoes phase transformation when exposed to air, leading to a severe decline in ionic conductivity.18,19 Previous studies have shown that surface impedance is severely affected by the humidity and CO2 present in the air.20 In the presence of moisture (H2O), hydrogen ions can replace lithium ions in the garnet structure, resulting in the formation of lithium hydroxide (LiOH). Additionally, CO2 reacts with LiOH to produce lithium carbonate (Li2CO3), which accumulates on the surface of the garnet. This surface layer not only reduces the overall ionic conductivity of the material but also increases surface impedance.20 Several strategies have been proposed to improve air stability. For example, reducing the grain size minimizes the formation of Li2CO3 on the surface, thereby improving ionic conductivity.21 Doping with small amounts of aluminium has also been shown to increase the Gibbs free energy of hydration reactions, preventing solid-state deterioration. However, since Al3+ ions occupy Li+ sites, this substitution inhibits lithium-ion transport, ultimately lowering the ionic conductivity.18,21,22 This study employed density functional theory (DFT) calculations to investigate the reaction energy between LLZTNYO and H2O, aiming to assess water resistance. The DFT calculations examined the hydration of LLZTNYO through the substitution of Li+/H+ ions, a process demonstrated to be facile, particularly in aqueous environments.23 Our computational results indicated that the doping effect enhances the reaction energy, making the formation of LiOH more difficult and thereby reducing the further formation of Li2CO3. This implies that LLZTNYO exhibits greater water resistance. Consequently, when comparing LLZTNYO to pure LLZO, the former is more suitable for use in ambient air environments.The garnet structure mainly exists in two crystal lattices: cubic and tetragonal. The tetragonal lattice exhibits poorer ionic conductivity than the cubic lattice. Although the cubic lattice has a higher ionic conductivity, it is prone to phase transformation to a tetragonal structure at high temperatures.24,25 To stabilize the cubic phase at high temperatures, doping is primarily conducted at the lithium and zirconium positions.26,27 Common doping methods stabilize the cubic phase by forming lithium vacancies through aliovalent substitution with dopants at lithium or zirconium sites.28,29 Typical doping elements at the lithium position include gallium (Ga) and aluminium (Al). Doping with Ga and Al not only stabilizes the cubic structure but also significantly enhances the density of the material.30–32 Doping elements commonly found at the zirconium position include tantalum (Ta),33 niobium (Nb),20,34,35 yttrium (Y),34,36 tungsten (W),37,38 antimony (Sb),36,39 magnesium (Mg),40 and tellurium (Te).41 Elements with oxidation states higher than Zr4+ enhance Li vacancies via an ionic compensation mechanism, thereby stabilizing the cubic crystal structure. Conversely, elements with lower oxidation states, such as Y3+, contribute to an increase in lithium ions within the structure.25 Therefore, multi-element doping is considered an effective method for enhancing ionic conductivity and stabilizing the cubic crystal structure. Partial substitution at the Zr sites can stabilize the cubic phase of LLZO. Table S1† lists numerous modified LLZO compounds. By modifying the sintering process, non-doped LLZO can achieve a conductivity of 1.7 × 10⁻⁵ S cm−1.38 With partial doping of Ta, Nb, Te, W and Y, the ionic conductivity can be improved to up to 10−4 S cm−1.32,34,38,41 Additionally, multi-doped LLZO also demonstrates good ionic conductivity. Gai et al. achieved an impressive ionic conductivity of 8.29 × 10⁻⁴ S cm−1 by co-doping Zr with Nb and Y.20 Another multi-doped compound, Li7La3Zr0.5Nb0.5Ta0.5Hf0.5O12, demonstrates a conductivity of 4.67 × 10⁻⁴ S cm−1.42 In our previous work, the high entropy garnet-type oxide Li6.4La3Zr0.4Ta0.4Nb0.4Y0.6W0.2O12 (LLZTNYWO) showed good conductivity of 1.16 × 10⁻⁴ S cm−1 with excellent air-stability.43
In our previous work, a multi-doping strategy proved to be an effective approach for enhancing both ionic conductivity and air stability. LLZTNYWO demonstrated a high ionic conductivity of 1.16 × 10⁻⁴ S cm−1 and exhibited strong structural stability under ambient air conditions, indicating that multi-doped LLZO holds promise as a solid electrolyte in all-solid-state lithium-ion batteries (ASSLIBs).43 However, the use of W as a dopant may lead to excessive lithium-ion vacancies and a decrease in lithium-ion concentration in the cubic-phase structure. Therefore, we synthesized a new garnet material and investigated its properties. According to this definition, materials with configurational entropy exceeding 1.5R (where R is the ideal gas constant) are categorized as high-entropy materials, whereas those with configurational entropy ranging between 1R and 1.5R fall under the medium-entropy material classification.
In this study, we synthesized a medium-entropy material, Li6.5La3Zr0.5Ta0.5Nb0.5Y0.5O12 (LLZTNYO), using a solid-state reaction. Our work leverages the entropy stabilization effect by substituting Ta, Nb, and Y in the Zr site, which increases the configurational entropy (ΔSconf.) to 1.39R. The inclusion of tantalum (Ta) and niobium (Nb) stabilizes the cubic phase, while yttrium (Y) helps balance the Li ion concentration. To provide a comprehensive comparison, we also synthesized Li6.5La3Zr1.5Ta0.5O12 (LLZTO), Li6.6La3Zr1.5Nb0.5O12 (LLZNO), and Li6.5La3Zr1Ta0.5Nb0.5O12 (LLZTNO). Our investigation focused on the performance of LLZTNYO, building on a previous study by eliminating tungsten (W) from the composition. This approach not only creates more lithium-ion vacancies, enhancing ionic transport, but also mitigates grain degradation, thereby improving air stability. By exploring the properties of LLZTNYO, we aim to contribute to the development of garnet-type oxides with improved functionality for application in solid-state batteries.
2. Experimental section
2.1 Synthesis of garnet materials
We employed the traditional solid-phase sintering method to synthesize garnet-type Li7La3Zr2O12 oxides with different compositions, such as Li6.5La3Zr1.5Ta0.5O12 (LLZTO), Li6.5La3Zr1.5Nb0.5O12 (LLZNO), Li6La3Zr1Ta0.5Nb0.5O12 (LLZTNO), and Li6.5La3Zr0.5Ta0.5Nb0.5Y0.5O12 (LLZTNYO). During the synthesis process, Li2CO3 (99%, Acros Organics), La2O3 (≥99.9%, Sigma-Aldrich), ZrO2 (99.9% trace metal basis, Sigma-Aldrich), Ta2O5 (99%, Alfa Aesar), Nb2O5 (99.5% metal basis, Alfa Aesar), and Y2O3 (99.9%, Alfa Aesar) were mixed in stoichiometric ratios with ZrO2 balls in the presence of isopropanol as solvent for 24 h using a planetary ball mill system. To avoid the loss of Li vapor pressure during sintering at high temperatures, we added 40% excess Li2CO3 to the precursor. The first heat treatment process, called calcination, was carried out at 900 °C for 6 h to ensure a homogeneous phase. Subsequently, the calcined powder was ground using an agate mortar to reduce particle size. The calcined powder was then ground again using a planetary ball mill system to obtain a uniform particle size. After drying in an oven at 80 °C, the powder was sieved to avoid aggregation and pressed in a mold under a pressure of 1 ton with a diameter of 12.7 mm. The mono-doped and binary-doped LLZO pellets were heated to 1150 °C at 5 °C min−1 for 24 h in an alumina crucible with the same mother powder under the pellets. To achieve the single-phase garnet-structure material, our multi-doped LLZO underwent sintering at 1050 °C for 36 h, following the same procedure as described previously.2.2 Material characterization
X-ray diffraction (XRD) was used to determine the phases and crystallinities of the pellets. XRD was performed using a Bruker D2 Phaser X-ray diffractometer with Cu Kα radiation. XRD measurements were performed in the 2θ angle range between 10° and 80°, with an increment size of 0.02° s−1. Neutron diffraction (ND) and total scattering were performed in the Multi-Physics Instrument (MPI) at the China Spallation Neutron Source. About 3 g of sample was put into the sample holder made of a Ti–Zr null matrix alloy. The sample was measured at ambient conditions for about 3 h. The ND data was further analysed by GSAS II, while the neutron powder diffraction (PDF) data was refined by PDFGUI. The input cifs for the PDF refinements were created by SUPERCELL in which the valence states of Li, La, Y, Nb, Ta, Zr and O were assigned as 1+, 3+, 3+, 5+, 5+, 4+, and 2−. The coulombic energies were calculated internally within the program. Three hundred cifs were output for the selection of initial models for the PDF refinement which covered the first hundred lowest energy configurations, the first hundred highest energy configurations, and a hundred random energy configurations. A bond valence sum (BVS) map was calculated by 3DBVSMAPPER to understand the impact of dopants on the lithium ion percolation network.The microstructures and surface morphologies of the pellets were investigated using a field-emission scanning electron microscope (FE-SEM; Hitachi SU8010) at an acceleration voltage of 15 kV. The microstructure was further examined using spherical aberration-corrected high-resolution transmission electron microscopy (HR-TEM; JEM-ARM200FTH, JEOL) with an acceleration voltage of 200 kV. Energy-dispersive X-ray spectroscopy (EDS) of the FE-SEM and HR-TEM images was employed to determine the chemical composition. The local environment of the Zr site elements in all samples was examined by utilizing the L-edge of Ta and the K-edge of Zr, Nb, and Y at the TPS 44A1 beamline at the National Synchrotron Radiation Research Center in Taiwan, acquiring the extended X-ray absorption fine structure (EXAFS) of the powder in fluorescence mode.
2.3 Electrochemical measurements
A BioLogic potentiostat was used to measure the electrochemical properties of the pellets. Cyclic voltammetry (CV) measurements were performed to investigate the electrochemical stability of the pellets. CV was conducted in a potential range of −1 to 6 V versus Li+/Li at a scanning rate of 1 mV s−1 with lithium metal as the reference electrode. Galvanostatic cycling tests were conducted on a symmetric cell using Li metal as a blocking electrode for one hour at a current density of 0.1 mA cm−2. Electrochemical impedance spectroscopy (EIS) investigations were conducted with a BioLogic MT-Z35 potentiostat, varying the temperature between 25 and 80 °C and frequency between 10 MHz and 1 Hz, with an AC amplitude of 100 mV. For the EIS measurements, a sintered pellet was placed between stainless-steel cylinders and polished with SiC paper to 4000 grit on both sides. Ionic conductivity (σ) was calculated using the formula σ = l/(R × A), where l represents thickness, A denotes surface area, and R signifies the fitting impedance of the Nyquist plots. Lithium metal served as the anode and LiFePO4 as the cathode for electrochemical performance testing of the ASSLIBs. The 2032 coin cells were assembled in an argon glovebox with H2O and O2 levels below 0.5 ppm. After sintering, the pellets were polished on each side with SiC paper of up to 4000 grit. Following polishing, the pellets were ultrasonicated in isopropanol for 30 min before assembly. Each side of the pellet received 10 μl of a solution consisting of 4 mol% LiTFSI in succinonitrile (SN) and fluoroethylene carbonate (FEC) in a 95![[thin space (1/6-em)]](https://www.rsc.org/images/entities/char_2009.gif) :
:![[thin space (1/6-em)]](https://www.rsc.org/images/entities/char_2009.gif) 5 volume ratio as an interlayer during assembly. For liquid batteries, 1 M LiPF6 was used as the liquid electrolyte in ethylene carbonate and diethyl carbonate in a 1
5 volume ratio as an interlayer during assembly. For liquid batteries, 1 M LiPF6 was used as the liquid electrolyte in ethylene carbonate and diethyl carbonate in a 1![[thin space (1/6-em)]](https://www.rsc.org/images/entities/char_2009.gif) :
:![[thin space (1/6-em)]](https://www.rsc.org/images/entities/char_2009.gif) 1 volume ratio. A NEWARE system for battery tests (CT-4008-5 V 10 mA) was employed to evaluate the galvanostatic charge/discharge (GCD) curves within a potential range of 2–3.8 V versus Li+/Li.
1 volume ratio. A NEWARE system for battery tests (CT-4008-5 V 10 mA) was employed to evaluate the galvanostatic charge/discharge (GCD) curves within a potential range of 2–3.8 V versus Li+/Li.
2.4 Computational details
DFT calculations were conducted by the Vienna Ab initio Simulation Package (VASP). A plane-wave basis set was used to construct the electronic wavefunctions.44 Core-valence electron interaction was treated using the projector augmented wave method (PAW) and the semi-local generalized gradient approximation (GGA) of Perdew, Burke, and Ernzerhof (PBE) was implemented.45,46 The convergence criterion for the electronic minimization is the energy difference of 10−5 eV compared to the previous iteration, and for geometry optimization, the criterion is force on all atoms less than 0.02 eV Å−1. Electronic occupancies were determined using Gaussian smearing and an energy width of 0.1 eV. A cutoff energy of 600 eV was found to be sufficient for the convergence of the total energy for both LLZO and LLZTNYO. A 2 × 2 × 2 k-point grid with a gamma-centered scheme was used for LLZO and LLZTNYO. The construction method of computing the crystal structure and its details are attached in the ESI (Fig. S1–S3 and Table S2†).The hydration reactions can be represented as the following equations:47,48
| Li7La3Zr2O12 + xH2O → Li7−xHxLa3Zr2O12 + xLiOH | (1) |
| Li6.5La3Zr0.5Ta0.5Nb0.5Y0.5O12 + xH2O → Li6.5−xHxLa3Zr0.5Ta0.5Nb0.5Y0.5O12 + xLiOH | (2) |
| ΔEreaction = Eproduct − Ereactant | (3) |
3. Results and discussion
3.1 Material characterization
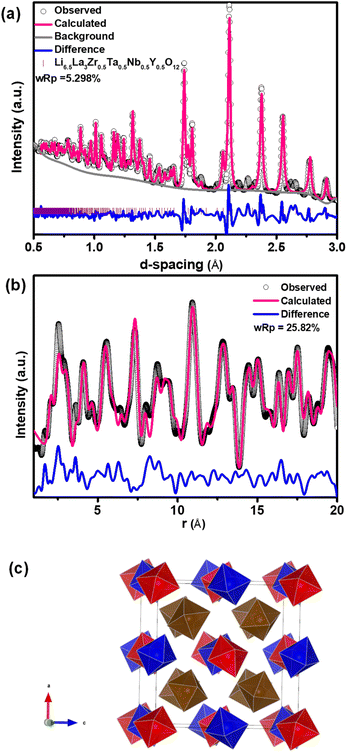
LLZTO, LLZNO, LLZTNO, and LLZTNYO were synthesized using a conventional solid-state method. Fig. S4† depicts their XRD patterns, confirming the cubic garnet structure (space group: Ia![[3 with combining macron]](https://www.rsc.org/images/entities/char_0033_0304.gif) d) for all samples. In LLZTNO, a minor peak corresponding to Al2O3 was observed, likely from contact with the alumina crucible during high-temperature sintering, as reported in the literature.49 The presence of Ta, Nb, and Y in the cubic phase was validated by pure phase XRD patterns, indicating successful dopant incorporation into the garnet structure. Fig. S5 and Table S3† show the XRD patterns and Rietveld refinement data, respectively, confirming crystallographic phase and lattice parameters. Doping with Y3+ (ionic radius: 104 pm) increased the lattice parameter in LLZTNYO compared to single- and co-doped samples with smaller ionic radii (Zr4+: 86 pm, Ta5+: 78 pm, Nb5+: 78 pm). Since the X-ray scattering length for lithium is relatively small, neutron diffraction was used to understand the lithium ions' positions and their occupancy in LLZTNYO as shown in Fig. 1a and Table S4.† The lithium ions were found to locate in the 24d and 96h in the space group of Ia
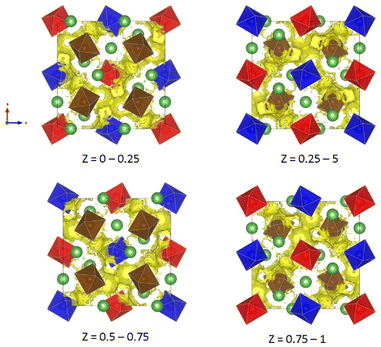
d) for all samples. In LLZTNO, a minor peak corresponding to Al2O3 was observed, likely from contact with the alumina crucible during high-temperature sintering, as reported in the literature.49 The presence of Ta, Nb, and Y in the cubic phase was validated by pure phase XRD patterns, indicating successful dopant incorporation into the garnet structure. Fig. S5 and Table S3† show the XRD patterns and Rietveld refinement data, respectively, confirming crystallographic phase and lattice parameters. Doping with Y3+ (ionic radius: 104 pm) increased the lattice parameter in LLZTNYO compared to single- and co-doped samples with smaller ionic radii (Zr4+: 86 pm, Ta5+: 78 pm, Nb5+: 78 pm). Since the X-ray scattering length for lithium is relatively small, neutron diffraction was used to understand the lithium ions' positions and their occupancy in LLZTNYO as shown in Fig. 1a and Table S4.† The lithium ions were found to locate in the 24d and 96h in the space group of Ia![[3 with combining macron]](https://www.rsc.org/images/entities/char_0033_0304.gif) d with the occupancy of 0.525 and 0.410, respectively. This indicates that the dopants have a strong impact on the lithium occupation in the structure. We noticed from the ND pattern that the background was relatively high, which is an indication of the presence of diffuse scattering in the sample. As such, neutron total scattering was used to understand how the dopants occupied the local structure. The supercell models were created by assigning the valence states of Zr, Nb, Ta, and Y as 4+, 5+, 5+, and 3+. The coulombic energies were calculated based on the point charges in the supercells. The configurations with hundreds of lowest energies were output, and they were considered as the initial models for the PDF refinement. As shown in Fig. 1b and Table S5,† the PDF fitting was in good agreement with the model, indicating that our model was consistent with the experimental observation. The model with a space group of P1 with a cell parameter of a = b = c = 13.03 Å that was used in the PDF fitting is shown in Fig. 1c. Due to the charge discrepancy in the supercell, the dopants were not homogeneously distributed in the structure. In particular, the highly charged Ta5+ and Nb5+ ions occupied exclusively the center locations of the supercell to minimize the overall energy of the system. Such unusual local structure was further evaluated by a bond valence sum (BVS) map to reveal its impact on the lithium ion diffusion behaviour (Fig. 2). Quite surprisingly, some of the lithium ion percolation networks were found to be disrupted near the Nb5+/Ta5+ centers. One main reason for that was attributed to the strong repulsive forces between the Nb5+/Ta5+ ions and Li+ ions, which will reduce the lithium ion population around the NbO6/TaO6 octahedra. Fig. 3 shows the EDS mapping of all doped LLZO samples, revealing homogeneous dopant distribution, consistent with the principle of increased disorder according to the second law of thermodynamics. SEM images (Fig. 4) reveal that LLZTO, LLZNO, and LLZTNO exhibit larger particle sizes post-sintering compared to LLZTNYO, potentially leading to increased voids around particles. These voids may contribute to reduced ionic conductivity upon exposure to air due to structural degradation and higher resistance at grain boundaries.
d with the occupancy of 0.525 and 0.410, respectively. This indicates that the dopants have a strong impact on the lithium occupation in the structure. We noticed from the ND pattern that the background was relatively high, which is an indication of the presence of diffuse scattering in the sample. As such, neutron total scattering was used to understand how the dopants occupied the local structure. The supercell models were created by assigning the valence states of Zr, Nb, Ta, and Y as 4+, 5+, 5+, and 3+. The coulombic energies were calculated based on the point charges in the supercells. The configurations with hundreds of lowest energies were output, and they were considered as the initial models for the PDF refinement. As shown in Fig. 1b and Table S5,† the PDF fitting was in good agreement with the model, indicating that our model was consistent with the experimental observation. The model with a space group of P1 with a cell parameter of a = b = c = 13.03 Å that was used in the PDF fitting is shown in Fig. 1c. Due to the charge discrepancy in the supercell, the dopants were not homogeneously distributed in the structure. In particular, the highly charged Ta5+ and Nb5+ ions occupied exclusively the center locations of the supercell to minimize the overall energy of the system. Such unusual local structure was further evaluated by a bond valence sum (BVS) map to reveal its impact on the lithium ion diffusion behaviour (Fig. 2). Quite surprisingly, some of the lithium ion percolation networks were found to be disrupted near the Nb5+/Ta5+ centers. One main reason for that was attributed to the strong repulsive forces between the Nb5+/Ta5+ ions and Li+ ions, which will reduce the lithium ion population around the NbO6/TaO6 octahedra. Fig. 3 shows the EDS mapping of all doped LLZO samples, revealing homogeneous dopant distribution, consistent with the principle of increased disorder according to the second law of thermodynamics. SEM images (Fig. 4) reveal that LLZTO, LLZNO, and LLZTNO exhibit larger particle sizes post-sintering compared to LLZTNYO, potentially leading to increased voids around particles. These voids may contribute to reduced ionic conductivity upon exposure to air due to structural degradation and higher resistance at grain boundaries.
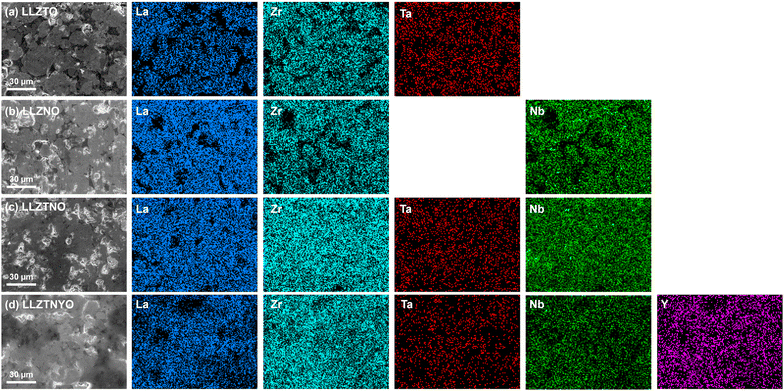 | ||
| Fig. 3 SEM images and the corresponding EDS mapping data of (a) LLZTO, (b) LLZNO, (c) LLZTNO, and (d) LLZTNYO. | ||
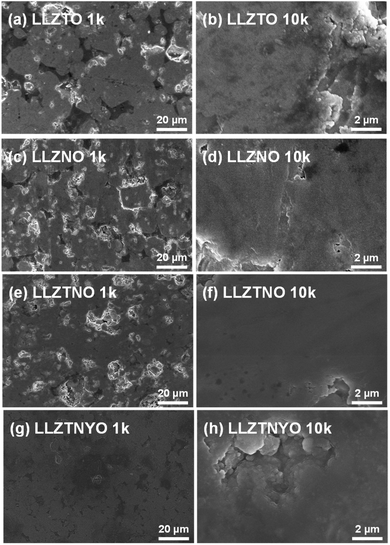 | ||
| Fig. 4 1k and 10k SEM images of (a and b) LLZTO, (c and d) LLZNO, (e and f) LLZTNO, and (g and h) LLZTNYO. | ||
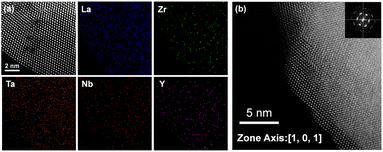
High-Resolution Transmission Electron Microscopy (HR-TEM) was employed to characterize the crystal structure of the medium-entropy LLZTNYO sample, offering detailed insights into its composition and atomic arrangement. Fig. 5a presents a high-resolution High-Angle Annular Dark-Field (HAADF) image along with corresponding EDS mapping images showing uniform distribution of La, Zr, Ta, Y, and Nb within the cubic LLZTNYO structure. This homogeneous distribution indicates successful incorporation of these elements into the garnet lattice, crucial for maintaining structural and functional integrity. Fig. 5b displays both an HAADF image and fast Fourier transform (FFT) patterns of LLZTNYO, providing clear visualization of its atomic arrangement and crystal structure symmetry. The FFT patterns corresponding to the19 zone axis provide information on the periodicity and symmetry of the crystal structure and reveal interplanar crystal spacings of 0.305 nm, consistent with the characteristic pattern of a cubic garnet-type structure (space group (Ia![[3 with combining macron]](https://www.rsc.org/images/entities/char_0033_0304.gif) d)), confirming its crystallographic phase. The HAADF image in Fig. 5b exhibits distinct contrast and brightness variations attributed to the molecular weights of dopants: Y (88.906 g mol−1), Zr (91.224 g mol−1), Nb (92.906 g mol−1), and Ta (180.95 g mol−1). Heavier Ta atoms cause more intense scattering, resulting in brighter spots, while lighter elements like Y, Zr, and Nb contribute to less intense scattering. This consistent interplanar spacing and uniform elemental distribution further validate the cubic garnet structure of LLZTNYO.
d)), confirming its crystallographic phase. The HAADF image in Fig. 5b exhibits distinct contrast and brightness variations attributed to the molecular weights of dopants: Y (88.906 g mol−1), Zr (91.224 g mol−1), Nb (92.906 g mol−1), and Ta (180.95 g mol−1). Heavier Ta atoms cause more intense scattering, resulting in brighter spots, while lighter elements like Y, Zr, and Nb contribute to less intense scattering. This consistent interplanar spacing and uniform elemental distribution further validate the cubic garnet structure of LLZTNYO.
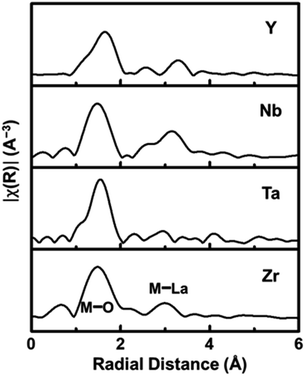
The local structure surrounding the Zr-site elements in LLZTNYO was analysed using the K-edge of Zr/Nb/Y and the L-edge of Ta in EXAFS spectroscopy, revealing important insights into the local atomic structure and behaviour of the dopants within the material. Fig. 6 presents the Fourier Transforms (FT) of the k2χ(k) data for LLZTNYO, covering a k-range from approximately 3 to 10 Å−1. These FT spectra provided crucial insights into the distances between the absorbing atoms and their neighbouring atoms, converting oscillations in the EXAFS spectrum into distinct peaks corresponding to various coordination shells around the absorbing atom. The FT results demonstrated remarkable similarities among different elements, indicating uniform local environments within the material for each element. Specifically, peaks observed in the first shell confirmed the presence of M–O bonds (where M represents Zr, Nb, Ta, or Y) at an average distance of approximately 1.5 Å from the absorbing atoms. This consistent peak position suggested relatively uniform M–O bond lengths across these elements. Despite variations in valence states and ionic radii among the absorbing elements, differences in bond lengths were evident: Ta5+–O ≈ Nb5+–O ≈ Zr4+–O ≪ Y3+–O, corresponding to their respective ionic radii: Ta5+ (78 pm) ≈ Nb5+ (78 pm) < Zr4+ (86 pm) ≪ Y3+ (104 pm). The larger ionic radius of Y3+ resulted in longer Y–O bond lengths compared to the other elements. The EXAFS analysis conclusively demonstrated that Y, Ta, and Nb dopants effectively replaced Zr in the garnet structure. Importantly, these dopants were found to be randomly distributed throughout the lattice, ensuring the overall structural integrity and symmetry of the garnet material.
3.2 Electrochemical performance
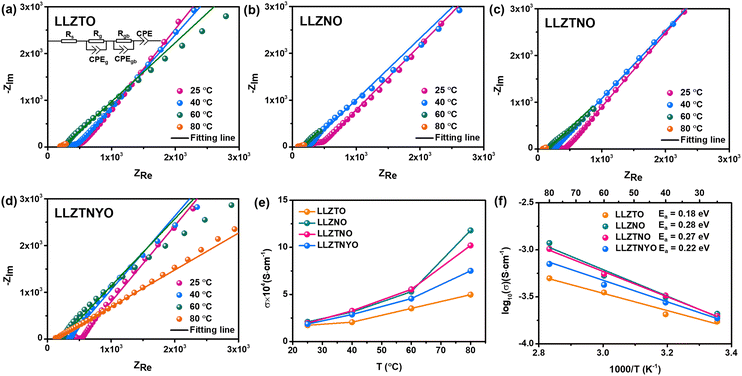
Fig. 7a–d show typical Nyquist plots for all doped LLZO samples measured in air, utilizing Pt as Li-ion blocking electrodes. The frequency range of measurements spans from 10 MHz to 1 Hz. Typically, the Nyquist plot exhibits one or two semicircles in the high to mid-frequency range, corresponding to bulk and grain boundary resistance, along with a linear tail in the low-frequency range, associated with electrode diffusion processes. The ionic conductivities obtained from EIS fitting, based on the equivalent circuit model shown in Fig. 7a (where Rs is the contact resistance, Rg is the resistance of the grain, Rgb is the resistance of the grain boundary, and CPE is the constant phase element stemming from the capacitive behavior between the electrolyte and the electrode), are compared in Fig. 7e. To ensure precise temperature control during measurements, a Buchi Oven was employed as a temperature controller, as detailed in our previous work.43 Measurement wires were positioned inside the Buchi Oven chamber, and data were collected after stabilizing the system at the target temperature for 10 min. Table S6† presents the impedance data at different temperatures calculated using the resistance law equation. Ionic conductivity values from 20–80 °C and Arrhenius plots are depicted in Fig. 7e and f, respectively. Fig. 7e displays the ion conductivity values ranging from 25 °C to 80 °C. At 25 °C, LLZNO exhibits the highest lithium-ion conductivity of 2.09 × 10⁻⁴ S cm−1, while LLZTO shows the lowest ion conductivity of 1.73 × 10⁻⁴ S cm−1. LLZO doped with both Ta and Nb shows an intermediate ionic conductivity of 1.97 × 10⁻⁴ S cm−1. The superior ionic conductivity of LLZNO can be attributed to its denser grain structure after sintering, as observed in the SEM image presented in Fig. 4, which shows fewer surface pores compared to LLZTO. Conversely, LLZTO exhibits larger intergranular pores, leading to lower ion conductivity. The measured ion conductivity of the ternary-doped garnet, LLZTNYO, at room temperature is found to be 1.87 × 10⁻⁴ S cm−1, which is comparable to that of the other doped LLZO samples. The Arrhenius plots in Fig. 7f demonstrate a linear relationship between the logarithm of ionic conductivity and the reciprocal of temperature (1/T). Notably, the size of the semicircular region in the Nyquist plot (Fig. 7a–e) diminishes with increasing temperature, indicating reduced impedance. As temperature increases, the ionic conductivity of all samples also increases, indicating thermally activated conduction. This trend reflects enhanced ionic conductivity at higher temperatures, consistent with the Arrhenius equation:where σ is the ionic conductivity at temperature T, σ0 is a pre-exponential factor, Ea is the activation energy for ion conduction, and R is the gas constant. This relationship suggests that as the temperature increases, the thermal energy available to lithium ions also rises, enabling their movement through the solid electrolyte matrix more effectively and thus improving conductivity.
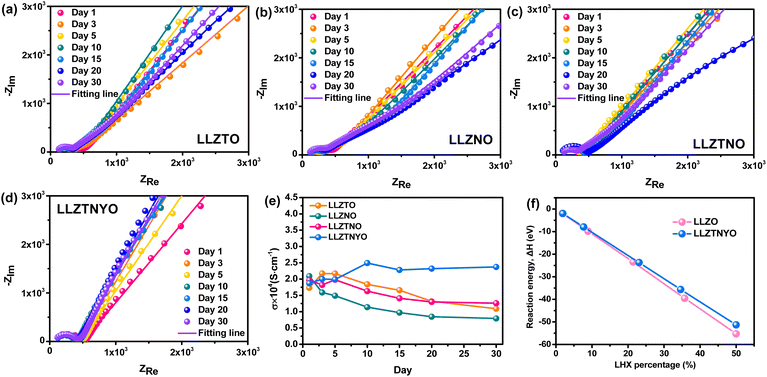
According to the literature, LLZO tends to react with H2O and CO2 in ambient air, resulting in degradation of ionic conductivity.50Fig. 8a–e show the Nyquist plots of all LLZO samples measured after exposure to air for 1, 3, 5, 10, 15, 20, and 30 days, with their corresponding ionic conductivities shown in Fig. 8e. Table S7† presents the daily impedance data. Note that LLZTO, LLZNO, and LLZTNO samples exhibited instability in ambient air over the 30 day duration due to reactions with H2O and CO2. Despite their initially high ionic conductivity, their air stability was poorer compared to LLZTNYO. After exposure, the ionic conductivities of LLZTO, LLZNO, and LLZTNO decreased. Stability tests indicated that LLZTNYO exhibited superior resistance to degradation in ionic conductivity over time compared to the other doped samples.
The multidoping strategy is highly regarded for its ability to stabilize the crystal structure owing to its high-entropy stabilization effect. Incorporating various elements into the garnet structure promotes the formation of pure cubic-phase LLZO more effectively.51 The introduction of multiple elements into the garnet structure increases entropy, enhancing disorder and thereby stabilizing the cubic phase. This study specifically focused on synthesizing LLZTNYO to investigate the stabilizing effects of multidoping. LLZTNYO exhibited sustained high ionic conductivity over 30 days without significant degradation, demonstrating excellent air stability crucial for practical applications in solid-state batteries and other electrochemical devices. These findings underscore the exceptional structural and air stability achieved through multidoping.
Given the potential for water to degrade the garnet electrolyte and cause irreversible damage to batteries, it is essential to evaluate whether LLZTNYO provides superior water resistance compared to LLZO. The reaction energies of hydration with LLZO and LLZTNYO were calculated using DFT calculations. Fig. 8f and Table S8† illustrate that the reaction energy of LLZO is lower than that of LLZTNYO, indicating that hydration with LLZO occurs more easily compared with LLZTNYO from the perspective of thermodynamics. We also note that their reaction energy differences increase with higher lithium–hydrogen exchange (LHX) percentage. For example, the reaction energy difference between LLZO and LLZTNYO grows from 0.04 to 3.97 eV in the range of ∼2% to 50% LHX. These findings suggest that LLZO exhibits greater propensity for hydration at higher LHX levels compared to LLZTNYO, indicating that the multi-doping strategy can effectively suppress hydration reactions and thus enhance the stability of the solid electrolyte against water. However, the negative reaction energy confirms that LHX still occurs spontaneously in both LLZO and LLZTNYO structures, consistent with our experimental findings (Fig. 8e). Furthermore, LLZTO-based solid electrolytes react with moisture in the air to form LiOH, which subsequently reacts with CO2 in the air to form Li2CO3. LiOH has relatively high ionic conductivity in a humid environment, whereas Li2CO3 exhibits very poor ionic conductivity. Since the reaction energy for lithium–hydrogen exchange in LLZTNYO is lower compared to that of LLZO, it reacts with moisture to form LiOH at a slower rate. As a result, the ionic conductivity of LLZTNYO slightly increases after 10 days of air exposure, as shown in Fig. 8e. In contrast, other solid electrolytes have already reacted to form Li2CO3, leading to a decline in their ionic conductivity.
CV measurements were performed to investigate the electrochemical stability of Li metal in LLZTNYO. As shown in Fig. 9a, an electrochemical window was achieved up to 6 V vs. Li/Li+ for LLZTNYO. Within the range from −1 to 0.5 V vs. Li/Li+, distinct redox peaks corresponded to the deposition and extraction of lithium metal. The CV profile indicates that LLZTNYO demonstrates robust stability against Li. Galvanostatic cycling tests were conducted at 25 °C on symmetric Li cells comprising doped LLZO pellets, as shown in Fig. 9b. These tests provided insights into the interfacial stability and performance characteristics of the materials. Each cycle exhibited an increase in overpotential during the positive half-cycle, indicative of Li dissolution from the pellets, and a subsequent decrease in overpotential during the negative half-cycle, indicating Li deposition on the pellets.52 This behaviour suggests potential interfacial contact issues, as evidenced by specific peaks observed in previous cycles. During the galvanostatic cycling test at a current density of 0.1 mA cm−2 and 25 °C over 200 h, the LLZTNYO pellet demonstrated high stability during lithium deintercalation and deposition as compared to other compositions (LLZTO, LLZNO, and LLTNO as shown in Fig. S6†). This indicates robust interfacial stability and suggests that the multi-doped LLZTNYO exhibits excellent performance in maintaining a consistent overpotential and low interfacial resistance.
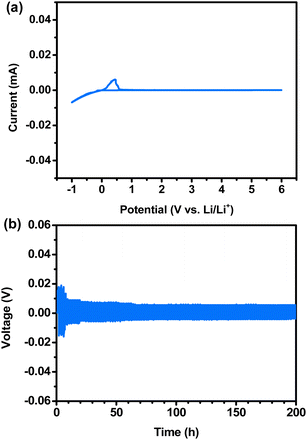 | ||
| Fig. 9 (a) Cyclic voltammetry of the Li/LLZTNYO/SS cell at 25 °C; (b) galvanostatic cycling test of LLZTNYO (lithium plating or stripping was set to 1 h). | ||
3.3 ASSLIBs with LLZTNYO solid electrolyte
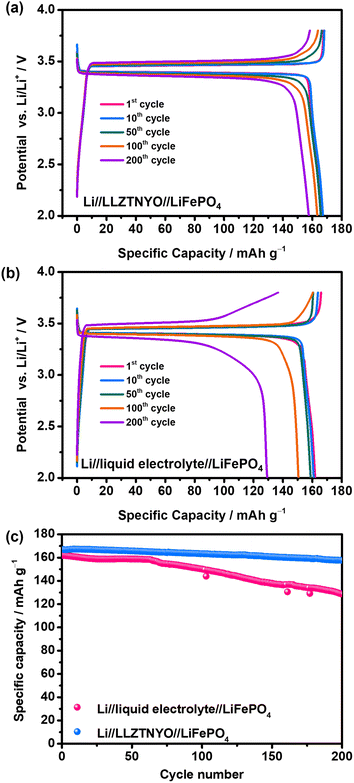
To demonstrate the practical application of LLZTNYO solid electrolyte in ASSLIBs, galvanostatic charge/discharge tests were conducted on Li//LLZTNYO//LiFePO4 full cells at 17 mA g−1 (0.1C) within the voltage range of 2–3.8 V vs. Li/Li+ to evaluate specific capacity, as depicted in Fig. 10a. The charge and discharge curves of ASSLIBs exhibited a plateau around 3.4 V, corresponding to the reaction potential of LiFePO4. In the initial discharge cycle, a specific capacity of 167 mA h g−1 was achieved, equivalent to 98.2% of the theoretical capacity of LiFePO4 (theoretical capacity = 170 mA h g−1), which is similar to that of the Li//liquid electrolyte//LiFePO4 cells (162 mA h g−1), as shown in Fig. 10b. Fig. 10c depicts the long-cycle performance comparison between the solid-state battery and a liquid cell. The ASSLIBs demonstrated superior stability during charging and discharging compared to the liquid cell, with the 200th discharge cycles of Li//LLZTNYO//LiFePO4 full cells maintaining a high capacity of 158 mA h g−1 (capacity retention of 95%), while Li//liquid electrolyte//LiFePO4 full cells only delivered a decreased capacity of 129 mA h g−1 (capacity retention of 77%). While liquid electrolytes typically exhibit higher ionic conductivity than solid electrolytes, they often result in the formation of a less stable interface (e.g., the solid electrolyte interphase) between the electrolyte and electrodes, which increases the overall resistance of the cell. In contrast, solid electrolytes generally offer better chemical stability, reducing decomposition and side reactions, and tend to form more stable solid–solid interfaces, thereby improving the cycling performance. Additionally, the mechanical strength of solid electrolytes helps suppress lithium dendrite growth, a critical factor in ensuring long-term stability. Liquid electrolytes, lacking this mechanical support, allow dendrites to grow more freely, leading to short circuits and eventual battery failure. These results underscore LLZTNYO's effectiveness as a promising solid-state electrolyte material in ASSLIBs.4. Conclusion
In this study, we successfully synthesized Li6.5La3Zr0.5Ta0.5Nb0.5Y0.5O12 (LLZTNYO), a medium-entropy garnet-type oxide, through solid-state sintering under ambient air conditions. Analysis of X-ray diffraction (XRD), neutron diffraction, total scattering and fast Fourier transform (FFT) patterns confirmed the cubic garnet structure of LLZTNYO, characterized by the space group Ia![[3 with combining macron]](https://www.rsc.org/images/entities/char_0033_0304.gif) d, and the presence of an unusual local structural arrangement for Zr4+/Nb5+/Ta5+/Y3+ dopants. The bond valence sum (BVS) map reveals that the local structure has a strong impact on the lithium-ion percolation network. Electrochemical impedance spectroscopy (EIS) results demonstrated superior ionic conductivity in LLZTNYO, reaching 1.87 × 10⁻⁴ S cm−1 at 25 °C and 7.7 × 10⁻⁴ S cm−1 at 80 °C. Furthermore, continuous monitoring showed exceptional air stability, with no significant decline in ionic conductivity over time. Quantitative evaluation through DFT calculations revealed that doped LLZO exhibited better water resistance compared to pristine LLZO. This study provides valuable insights into the design of solid-state electrolytes, highlighting preferences for hydration reactions based on variations in hydration percentage. Cyclic voltammetry and galvanostatic cycling tests further underscored LLZTNYO's excellent electrochemical stability against Li. Furthermore, the Li//LLZTNYO//LiFePO4 solid-state battery provided a high capacity of 167 mA h g−1 with superior cycling stability up to 200 cycles (retention 95%). These findings suggest that employing a multi-doping strategy leveraging the high-entropy effect can enhance the structural stability of garnet-type oxides under ambient air conditions. Fine-tuning the doping ratio of various valence elements ensured optimal lithium-ion concentration within the structure. With its favourable molar ratio and outstanding air stability, medium-entropy garnet-type LLZTNYO emerges as a promising candidate for reliable production in ambient air and holds significant potential for application in all-solid-state lithium-ion batteries (ASSLIBs).
d, and the presence of an unusual local structural arrangement for Zr4+/Nb5+/Ta5+/Y3+ dopants. The bond valence sum (BVS) map reveals that the local structure has a strong impact on the lithium-ion percolation network. Electrochemical impedance spectroscopy (EIS) results demonstrated superior ionic conductivity in LLZTNYO, reaching 1.87 × 10⁻⁴ S cm−1 at 25 °C and 7.7 × 10⁻⁴ S cm−1 at 80 °C. Furthermore, continuous monitoring showed exceptional air stability, with no significant decline in ionic conductivity over time. Quantitative evaluation through DFT calculations revealed that doped LLZO exhibited better water resistance compared to pristine LLZO. This study provides valuable insights into the design of solid-state electrolytes, highlighting preferences for hydration reactions based on variations in hydration percentage. Cyclic voltammetry and galvanostatic cycling tests further underscored LLZTNYO's excellent electrochemical stability against Li. Furthermore, the Li//LLZTNYO//LiFePO4 solid-state battery provided a high capacity of 167 mA h g−1 with superior cycling stability up to 200 cycles (retention 95%). These findings suggest that employing a multi-doping strategy leveraging the high-entropy effect can enhance the structural stability of garnet-type oxides under ambient air conditions. Fine-tuning the doping ratio of various valence elements ensured optimal lithium-ion concentration within the structure. With its favourable molar ratio and outstanding air stability, medium-entropy garnet-type LLZTNYO emerges as a promising candidate for reliable production in ambient air and holds significant potential for application in all-solid-state lithium-ion batteries (ASSLIBs).
Data availability
The data supporting this article have been included as part of the ESI.†Conflicts of interest
There are no conflicts to declare.Acknowledgements
This work was financially supported by the “High Entropy Materials Center” from The Featured Areas Research Center Program within the framework of the Higher Education Sprout Project by the Ministry of Education (MOE) and by the 2030 Cross-Generation Young Scholars Program of the National Science and Technology Council in Taiwan under grant NSTC 112-2628-E-007-014-MY4. W. H. K. was financially supported by the National Natural Science Foundation of China (11805034 and U1930102). The authors also thank the Instrumentation Center at National Tsing Hua University for help with spherical aberration-corrected field-emission TEM and XRD analysis, and National Synchrotron Radiation Research Center in Taiwan for help with EXAFS analysis (TPS 44A1).References
- E. T. Sayed, A. G. Olabi, A. H. Alami, A. Radwan, A. Mdallal, A. Rezk and M. A. Abdelkareem, Energies, 2023, 16, 1415 CrossRef CAS.
- X. Jin, Z. Ahmed, U. K. Pata, M. T. Kartal and S. Erdogan, Geosci. Front., 2023, 101646, DOI:10.1016/j.gsf.2023.101646.
- J. Liu, Z. Bao, Y. Cui, E. J. Dufek, J. B. Goodenough, P. Khalifah, Q. Li, B. Y. Liaw, P. Liu, A. Manthiram, Y. S. Meng, V. R. Subramanian, M. F. Toney, V. V. Viswanathan, M. S. Whittingham, J. Xiao, W. Xu, J. Yang, X.-Q. Yang and J.-G. Zhang, Nat. Energy, 2019, 4, 180–186 CrossRef CAS.
- M. M. Raju, F. Altayran, M. Johnson, D. Wang and Q. Zhang, Electrochem, 2021, 2, 390–414 CrossRef CAS.
- J. M. Tarascon and M. Armand, in Materials for Sustainable Energy, Macmillan Publishers Ltd, UK, 2010, pp. 171–179, DOI:10.1142/9789814317665_0024.
- B. Scrosati, J. Hassoun and Y.-K. Sun, Energy Environ. Sci., 2011, 4, 3287–3295 RSC.
- T. Kim, W. Song, D.-Y. Son, L. K. Ono and Y. Qi, J. Mater. Chem. A, 2019, 7, 2942–2964 RSC.
- K. Deng, Q. Zeng, D. Wang, Z. Liu, G. Wang, Z. Qiu, Y. Zhang, M. Xiao and Y. Meng, Energy Storage Mater., 2020, 32, 425–447 CrossRef.
- Z. Gao, H. Sun, L. Fu, F. Ye, Y. Zhang, W. Luo and Y. Huang, Adv. Mater., 2018, 30, 1705702 CrossRef PubMed.
- T. Famprikis, P. Canepa, J. A. Dawson, M. S. Islam and C. Masquelier, Nat. Mater., 2019, 18, 1278–1291 CrossRef CAS PubMed.
- Y. Ma, J. Wan, Y. Yang, Y. Ye, X. Xiao, D. T. Boyle, W. Burke, Z. Huang, H. Chen and Y. Cui, Adv. Energy Mater., 2022, 12, 2103720 CrossRef CAS.
- X. Yu, R. Chen, L. Gan, H. Li and L. Chen, Engineering, 2023, 21, 9–14 CrossRef.
- L. Xu, J. Li, W. Deng, H. Shuai, S. Li, Z. Xu, J. Li, H. Hou, H. Peng, G. Zou and X. Ji, Adv. Energy Mater., 2021, 11, 2000648 CrossRef CAS.
- W. Luo, Y. Gong, Y. Zhu, Y. Li, Y. Yao, Y. Zhang, K. Fu, G. Pastel, C.-F. Lin, Y. Mo, E. D. Wachsman and L. Hu, Adv. Mater., 2017, 29, 1606042 CrossRef PubMed.
- D. Wang, G. Zhong, O. Dolotko, Y. Li, M. J. McDonald, J. Mi, R. Fu and Y. Yang, J. Mater. Chem. A, 2014, 2, 20271–20279 RSC.
- S. Hu, Y.-F. Li, R. Yang, Z. Yang and L. Wang, Ceram. Int., 2018, 44, 6614–6618 CrossRef CAS.
- R. Murugan, V. Thangadurai and W. Weppner, Angew. Chem., Int. Ed., 2007, 46, 7778–7781 CrossRef CAS PubMed.
- Y. Li, J.-T. Han, C.-A. Wang, H. Xie and J. B. Goodenough, J. Mater. Chem., 2012, 22, 15357–15361 RSC.
- H. Huo, J. Luo, V. Thangadurai, X. Guo, C.-W. Nan and X. Sun, ACS Energy Lett., 2020, 5, 252–262 CrossRef CAS.
- J. Gai, E. Zhao, F. Ma, D. Sun, X. Ma, Y. Jin, Q. Wu and Y. Cui, J. Eur. Ceram. Soc., 2018, 38, 1673–1678 CrossRef CAS.
- L. Cheng, C. H. Wu, A. Jarry, W. Chen, Y. Ye, J. Zhu, R. Kostecki, K. Persson, J. Guo, M. Salmeron, G. Chen and M. Doeff, ACS Appl. Mater. Interfaces, 2015, 7, 17649–17655 CrossRef CAS PubMed.
- L. J. Miara, S. P. Ong, Y. Mo, W. D. Richards, Y. Park, J.-M. Lee, H. S. Lee and G. Ceder, Chem. Mater., 2013, 25, 3048–3055 CrossRef CAS.
- Z. Yow, Y. Oh, W. Gu, P. Rayavarapu and S. Adams, Solid State Ionics, 2016, 292, 122–129 CrossRef CAS.
- E. Rangasamy, J. Wolfenstine, J. Allen and J. Sakamoto, J. Power Sources, 2013, 230, 261–266 CrossRef CAS.
- T. Thompson, J. Wolfenstine, J. L. Allen, M. Johannes, A. Huq, I. N. David and J. Sakamoto, J. Mater. Chem. A, 2014, 2, 13431–13436 RSC.
- Y. Meesala, Y.-K. Liao, A. Jena, N.-H. Yang, W. K. Pang, S.-F. Hu, H. Chang, C.-E. Liu, S.-C. Liao, J.-M. Chen, X. Guo and R.-S. Liu, J. Mater. Chem. A, 2019, 7, 8589–8601 RSC.
- D. O. Shin, K. Oh, K. M. Kim, K.-Y. Park, B. Lee, Y.-G. Lee and K. Kang, Sci. Rep., 2015, 5, 18053 CrossRef CAS PubMed.
- D. O. Shin, K. Oh, K. M. Kim, K.-Y. Park, B. Lee, Y.-G. Lee and K. Kang, Sci. Rep., 2015, 5, 18053 CrossRef CAS PubMed.
- D. Rettenwander, R. Wagner, A. Reyer, M. Bonta, L. Cheng, M. M. Doeff, A. Limbeck, M. Wilkening and G. Amthauer, J. Phys. Chem. C, 2018, 122, 3780–3785 CrossRef CAS PubMed.
- Z. Hu, H. Liu, H. Ruan, R. Hu, Y. Su and L. Zhang, Ceram. Int., 2016, 42, 12156–12160 CrossRef CAS.
- X. Xiang, F. Chen, Q. Shen, L. Zhang and C. Chen, Mater. Res. Express, 2019, 6, 085546 CrossRef CAS.
- Z. Hu, H. Liu, H. Ruan, R. Hu, Y. Su and L. Zhang, Ceram. Int., 2016, 42, 12156–12160 CrossRef CAS.
- R. Inada, A. Takeda, Y. Yamazaki, S. Miyake, Y. Sakurai and V. Thangadurai, ACS Appl. Energy Mater., 2020, 3, 12517–12524 CrossRef CAS.
- X.-Z. Liu, L. Ding, Y.-Z. Liu, L.-P. Xiong, J. Chen and X.-L. Luo, Rare Met., 2020, 40, 1–6 CrossRef CAS.
- Y. Zhu, J. G. Connell, S. Tepavcevic, P. Zapol, R. Garcia-Mendez, N. J. Taylor, J. Sakamoto, B. J. Ingram, L. A. Curtiss, J. W. Freeland, D. D. Fong and N. M. Marković, Adv. Energy Mater., 2019, 9, 1803440 CrossRef.
- Z. Cao, Y. Li, J. Su, J. Zhao, Y. Li, S. Yan, Q. Liu, T. He, H. Zhang and G.-R. Li, Ionics, 2021, 27, 1861–1870 CrossRef CAS.
- X. Liu, M. Gao, Y. Liu, L. Xiong and J. Chen, Ceram. Int., 2019, 45, 13488–13495 CrossRef CAS.
- Y. Li, Z. Wang, Y. Cao, F. Du, C. Chen, Z. Cui and X. Guo, Electrochim. Acta, 2015, 180, 37–42 CrossRef CAS.
- S. Ramakumar, L. Satyanarayana, S. V. Manorama and R. Murugan, Phys. Chem. Chem. Phys., 2013, 15, 11327–11338 RSC.
- X. Yang, D. Kong, Z. Chen, Y. Sun and Y. Liu, J. Mater. Sci.: Mater. Electron., 2018, 29, 1523–1529 CrossRef CAS.
- C. Deviannapoorani, L. Dhivya, S. Ramakumar and R. Murugan, J. Power Sources, 2013, 240, 18–25 CrossRef CAS.
- Z. Fu and J. Ferguson, J. Am. Ceram. Soc., 2022, 105, 6175–6183 CrossRef CAS.
- C.-H. Kuo, A.-Y. Wang, H.-Y. Liu, S.-C. Huang, X.-R. Chen, C.-C. Chi, Y.-C. Chang, M.-Y. Lu and H.-Y. Chen, APL Mater., 2022, 10, 121104 CrossRef CAS.
- G. Kresse and J. Furthmüller, Phys. Rev. B, 1996, 54, 11169–11186 CrossRef CAS PubMed.
- G. Kresse and D. Joubert, Phys. Rev. B, 1999, 59, 1758–1775 CrossRef CAS.
- J. P. Perdew, K. Burke and M. Ernzerhof, Phys. Rev. Lett., 1997, 78, 1396 CrossRef CAS.
- R. Ye, M. Ihrig, N. Imanishi, M. Finsterbusch and E. Figgemeier, ChemSusChem, 2021, 14, 4397–4407 CrossRef CAS PubMed.
- W. Xia, B. Xu, H. Duan, X. Tang, Y. Guo, H. Kang, H. Li and H. Liu, J. Am. Ceram. Soc., 2017, 100, 2832–2839 CrossRef CAS.
- K. Liu, J.-T. Ma and C.-A. Wang, J. Power Sources, 2014, 260, 109–114 CrossRef CAS.
- W. Lu, M. Xue and C. Zhang, Energy Storage Mater., 2021, 39, 108–129 CrossRef.
- Y. Feng, L. Yang, Z. Yan, D. Zuo, Z. Zhu, L. Zeng, Y. Zhu and J. Wan, Energy Storage Mater., 2023, 63, 103053 CrossRef.
- S. A. Pervez, P. Ganjeh-Anzabi, U. Farooq, M. Trifkovic, E. P. L. Roberts and V. Thangadurai, Adv. Mater. Interfaces, 2019, 6, 1900186 CrossRef.
Footnotes |
| † Electronic supplementary information (ESI) available. See DOI: https://doi.org/10.1039/d4ta07630c |
| ‡ Chun-Han Kuo, Po-Yen Huang, and Ai-Yin Wang contributed equally. |
| This journal is © The Royal Society of Chemistry 2025 |

