
Improving the cycling stability and rate performance of an aqueous sodium-ion supercapattery via mitigating metal dissolution and boosting conductivity by anchoring FePBA on rGO†
Sheetal
Gupta
 ,
Mayank K.
Singh
,
Sarathkumar
Krishnan
,
Suporna
Bhowmik
,
Khushwant
Singh
and
Dhirendra K.
Rai
*
,
Mayank K.
Singh
,
Sarathkumar
Krishnan
,
Suporna
Bhowmik
,
Khushwant
Singh
and
Dhirendra K.
Rai
*
Sustainable Energy & Environmental Materials (SEEM) Lab, Department of Metallurgical Engineering and Materials Science (MEMS), Indian Institute of Technology Indore, Simrol, Khandwa Road, Indore 453552, India. E-mail: dkrai@iiti.ac.in; Tel: +91 731 660 3278
First published on 12th December 2024
Abstract
To fulfill the research goal of deriving high energy and high specific power in a sustainable, safe, and cost-effective manner, Prussian Blue Analogue (PBA)-based Na+ ion hybrid capacitors have drawn great interest. However, inherent poor conductivity and metal dissolution problems limit their full-scale exploration as a cathode material. This work attempts to address the above two challenges by compositing a Fe-PBA (NaxFe[Fe(CN)6]·nH2O) (FPBA) with reduced graphene oxide (rGO). The highly conductive nature of rGO boosts the overall conductivity of the FPBA/rGO composite, rendering improved rate performance. At the same time, the surface and edge functional groups (epoxy, hydroxy and carboxylate) on rGO provide firm anchorage to surface Fe ions of FPBA through coordination and thus suppress the metal dissolution, eventually leading to longer cyclability. Due to the synergistic effect of rGO and FPBA, the FPBA/rGO composite also shows significantly enhanced charge storage capacity (437 C g−1 at 1 A g−1) compared to FPBA (204 C g−1 at 1 A g−1). The detailed mechanistic and kinetic studies reveal that, besides faradaic-type charge storage, FPBA/rGO also involves a significant portion of electrical double layer charging due to the presence of rGO. The hybrid charge storage mechanism in FPBA/rGO enables the fabricated symmetric supercapacitor device (FPBA/rGO//FPBA/rGO) to exhibit high specific energy as well as specific power (maxE = 62.32 W h kg−1 @ 0.9 kW kg−1; maxP = 9.0 kW kg−1 @ 31.92 W h kg−1). Moreover, owing to suppressed metal dissolution, the symmetrical device having the FPBA/rGO composite electrodes shows excellent capacitive retention of 91% after 10![[thin space (1/6-em)]](https://www.rsc.org/images/entities/char_2009.gif) 000 cycles compared to that with the FPBA-based device (75%).
000 cycles compared to that with the FPBA-based device (75%).
1. Introduction
The world is moving towards renewable energy sources to address the challenges associated with fossil fuels, such as environmental issues and depleting stock. The dependence on renewable energy sources is limited because they are intermittent, making it challenging to meet the continuously growing energy demand. Hence, an effective way to store renewable energy to ensure uninterrupted supply is required, necessitating extensive research on electrochemical energy storage devices (ESDs), such as supercapacitors (SCs) and batteries.1,2 Storage of charge in batteries occurs due to a relatively slow faradaic process, whereas that in SCs occurs via faster electrostatic ion adsorption on the electrode. As a result, batteries can store much higher energy (high specific energy); however, the rate of energy delivery is much faster in SCs (high specific power).3 Both high power and high specific energy are required for real-world applications, which cannot be supported by either system alone. Therefore, much focus is being given to developing new materials comprising characteristics of both the battery and SCs, termed supercapattery-type materials.4–7Due to the limited natural abundance of lithium, electrochemical energy storage devices involving Li-ions will no longer be sustainable. This mandates exploring novel cathode materials based on sodium (Na) ion chemistry due to the plentiful supply of Na and its electrochemical similarities to lithium.8,9 However, the larger size of Na+ and its sluggish mobility compared to Li+ compromise the specific energy and rate performance of Na+-based energy storage devices.10–13 Various cathode materials have been proposed for Na ion-based hybrid ion SCs and batteries, including layered transition metal oxides, polyanionic compounds, and Prussian Blue Analogues (PBAs).14–16 Layered transition metal oxides exhibit good capacity but have lower cycling stability.17 Polyanionic electrode materials have high structural stability, but their poor electronic conductivity results in low specific capacity and poor rate capability.18 On the other hand, PBAs, a kind of metal–organic frameworks (MOFs) with plenty of voids, can easily accommodate larger alkali cations such as K+ and Na+ and, thus, offer less diffusion impedance.19 Apart from easy synthesizability, one of the crucial advantages of PBAs is their electrochemical and physical properties, which can be tuned easily by doping and substitutions without altering the crystal structure.20 Generally, the chemical formula of PBAs is AxM1[M2(CN)6]y·nH2O, where A is an alkali metal (e.g. Na for sodium-ion capacitors and batteries). M1 and M2 are same or different transition metals, such as Fe, Mn, Co, Cu, and Ni, linked to CN− bridging ligands. The values of x and y lie between 1–2 and 0–1, respectively. In a three-dimensional network of PBAs, M2 is bonded to the C-end of CN−, which offers a strong ligand field and forces M2 to stay in a low spin state in the M2C6 octahedron. On the other hand, M1 bonds through the N-end of CN−; thus, it experiences a relatively weak ligand field and hence occupies a high spin state in the M1N6 octahedron. Among different PBAs, Fe-based PBAs (M1 = M2 = Fe) have sought attention owing to the larger theoretical capacity and low cost of iron.21
Despite the above advantages, PBA-based cathodes suffer from severe metal ion dissolution, particularly high spin metal, upon repeated cycling, which results in the loss of active material and structural integrity, leading to decreased capacity and limited cycling life. Also, the dissolved transition metal ions have the potential to impede ion transport and disrupt the electrolyte environment. To mitigate such problems, many approaches have been undertaken, such as coating,22 doping,23 cation exchange,24 PBAs' structural and electrolyte engineering,25 and compositing.26 For example, Wang et al. reported the successful synthesis of CoHCF (HCF = hexacyanoferrate) submicroboxes featuring distinct hollow interiors via a cation exchange method by exploring the variation in solubility product constants (KSP) of PBAs.24 The resulting structure displayed a high specific capacitance of 292 F g−1 alongside exceptional performance in terms of rate capability and cycling stability. Bai et al. fabricated a flexible electrode material by incorporating a polyaniline-modified Ni–Co-PBA loaded onto a carbon sponge substrate and demonstrated improved energy storage performance.27 Liang et al. demonstrated mitigation of Mn dissolution in iron-doped Mn-based PBA through electrolyte engineering involving a mixture of high concentration of electrolyte (17.6 M NaClO4 aqueous electrolyte (water in salt condition)) and K4[Fe (CN)6].25
Besides metal dissolution causing low cycling stability, electronic conductivity is also an issue that hampers its overall electrochemical performance. To boost the conductivity, some researchers have attempted to blend the PBAs with conductive materials. Yuan et al. reported the in situ fabrication of the NiHCF@CNTs cathode by a coprecipitation method on CNTs.28 This material exhibited remarkable rate capability, achieving a capacity of 47.9 mA h g−1 at 167C and improved cycling stability with 80% capacity retention over 10000 cycles for an aqueous sodium ion battery (ASIB). Xue et al. developed a PBA (KHCF@PPy) with enhanced electronic conductivity using an in situ polymerization coating method, showing enhanced rate capability and a capacity of 72.1 mA h g−1 at a current density of 1 A g−1.22 Shen et al. synthesized high-performance MnHCF/graphene nanocomposites using a simple ball-milling approach, which delivered a charge storage capacity of 142.7 mA h g−1 at 0.1C and long cycle life with 86.0% capacity retention after 2000 cycles at 10C.29 As a conductive additive, reduced graphene oxide (rGO) has distinct advantages over other carbon materials, such as activated carbon, carbon nanotubes (CNTs)30,31 and carbon black, for energy storage applications. Its high electrical conductivity improves charge transport in composites, while its large surface area enhances electron transfer and interaction with electroactive materials. The oxygen-containing functional groups (epoxy, hydroxyl, and carboxylate) on rGO provide strong bonding for metal ions, reducing dissolution and improving structural stability.32 These groups also enable pseudocapacitance, facilitating faradaic charge storage. Additionally, rGO is more flexible and easier to process than CNTs or carbon black, allowing for better dispersion in composites. Its two-dimensional structure offers an ideal combination of high surface area, mechanical strength, and conductivity for advanced energy storage systems.33,34
As mentioned above, there are a number of reports on addressing the low conductivity and metal dissolution problems associated with PBAs using various independent approaches. However, limited efforts have been made to tackle both issues simultaneously. In this work, we have addressed the conductivity and metal dissolution problem of Na2−xFe[Fe(CN)6] (FPBA) simultaneously by anchoring it onto rGO sheets (FPBA/rGO) to boost the charge storage capacity, rate capability, and cycling stability of the material. Owing to the synergistic effect, the blending of rGO with FPBA enhances the charge storage capacity of the resulting FPBA/rGO composite compared to neat FPBA and also offers improved rate capability. Moreover, the abundant coordinative interactions between the carboxylates and oxy-functional groups of rGO with surface Fe ions of FPBA help mitigate the metal dissolution and, thus, offer enhanced cycling stability. A detailed charge storage mechanism study revealed that, owing to the presence of rGO, a considerable proportion of charge storage occurs through the surface-controlled processes, besides faradaic charge storage, which enabled us to achieve high energy as well as high specific power in the symmetrical device fabricated using FPBA/rGO electrodes.
2. Experimental section
2.1 Chemicals
Sodium citrate dihydrate (C6H5Na3O7·2H2O), ferrous sulfate heptahydrate (FeSO4·7H2O), sodium ferrocyanide decahydrate (Na4Fe(CN)6·10H2O), sodium nitrate (NaNO3), sodium sulfate (Na2SO4), graphite powder, and potassium permanganate (KMnO4) were obtained from SRL Chemicals, India. Sulfuric acid (H2SO4), hydrochloric acid (HCl), hydrogen peroxide (H2O2), and polyvinyl alcohol were purchased from LOBA Chemie, India. All chemicals used in this study were of analytical grade and used as received without further purification.2.2 Synthesis of FPBA
Na2−xFe[Fe(CN)6] was synthesized using a simple controllable coprecipitation method at 25 °C, as shown in Scheme 1. At first, solution A was prepared by mixing 1.67 g of FeSO4·7H2O and 2.81 g of sodium citrate in deionized (DI) water to obtain a 100 ml solution and stirred for 3 hours. Simultaneously, another 100 ml solution, solution B, was prepared by dissolving 2.81 g of sodium citrate and 1.96 g of Na4Fe(CN)6·10H2O in DI water. Both solutions, A and B, were protected from oxidation by purging with N2 gas. Solution A was then slowly dropped into solution B under a nitrogen atmosphere, and the resulting mixture was stirred at 800 rpm for 6 hours under the inert atmosphere. After stirring, the mixture was aged for 12 hours. Subsequently, it was centrifuged, and the resulting precipitate was washed thoroughly three times with DI water and ethanol. Finally, the precipitate was dried in a vacuum oven at 80 °C for 12 hours. This synthesis method successfully produced Na2−xFe[Fe(CN)6]·nH2O samples ready for further analysis and testing.21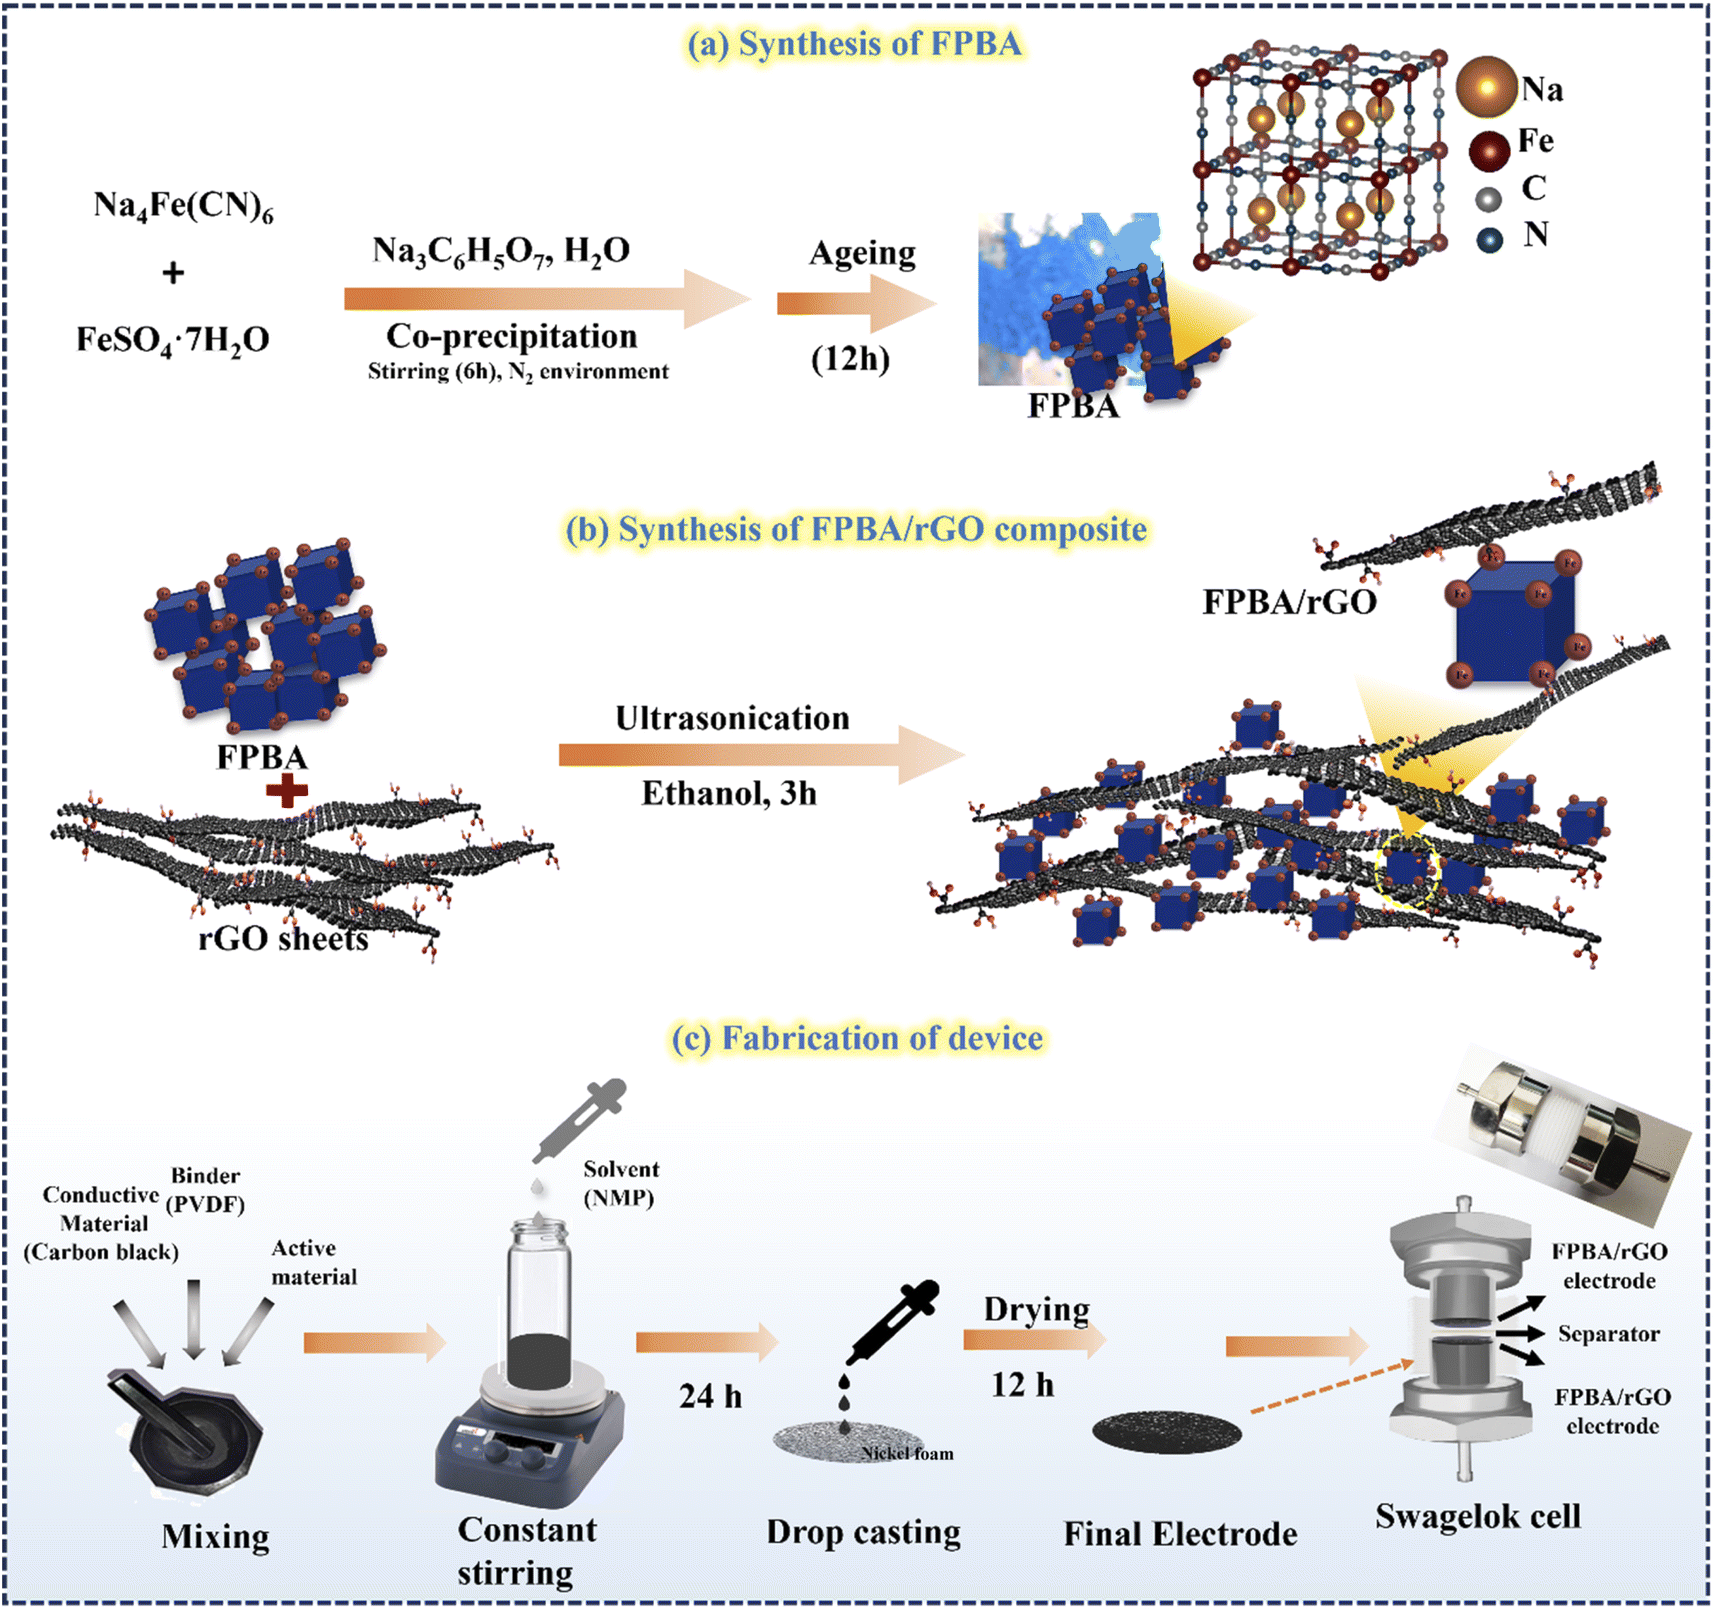 | ||
| Scheme 1 Schematic diagram for synthesis of (a) FPBA and (b) FPBA/rGO composite and (c) device fabrication. | ||
2.3 Synthesis of FPBA/rGO
Before synthesizing the composite, rGO was synthesized using the standard modified Hummers' method, detailed in the ESI (S1).†35 Different mass ratios of FPBA/rGO composite (25, 50, and 75 wt%) were synthesized by first thoroughly grinding appropriate amounts of rGO and FPBA in a mortar and pestle. Afterward, the mixture was transferred to ethanol and ultrasonicated for 90 min, followed by stirring for 3 hours (Scheme 1). The resulting suspension was centrifuged and dried in a vacuum oven for 8 hours at 60 °C to obtain the FPBA/rGO composite.2.4 Characterization
The purity of phase and crystal structure of the synthesized materials were investigated by powder X-ray diffraction (PXRD) (Empyrean, Malvern Panalytical X-ray diffractometer) with 0.026° step size and a 2θ range of 10–70° using CuKα (λ = 1.54 Å) as the source. The thermal properties of synthesized FPBA were studied by thermogravimetric analysis (TGA, PerkinElmer, STA8000) under a N2 atmosphere at a heating rate of 10 °C min−1 from 30 °C to 800 °C. The surface area and porosity of FPBA, rGO, and the FPBA/rGO composite were evaluated using nitrogen (N2) adsorption/desorption isotherms and analyzed through the Brunauer–Emmett–Teller (BET) method using a surface analyzer (Autosorb iQ3, Quantachrome). Fourier Transform Infrared (FTIR) spectra were recorded using a PerkinElmer ATR spectrometer in the 500–4000 cm−1 wavelength range. The morphologies of the materials were examined by Field Emission Scanning Electron Microscopy (FESEM, Karl Zeiss JEOL) and transmission electron microscopy (TEM, FEI Talos F200S). The chemical composition and valence states of elements were analyzed by X-ray photoelectron spectroscopy (XPS) (Shimadzu spectrometer), utilizing an Al Kα radiation source with an energy of 1486.7 eV. The optical properties were characterized using a UV-vis double-beam spectrophotometer (model: YS-674), operating in the 200–600 nm wavelength range.2.5 Electrochemical characterization
The electrochemical tests were conducted using a potentiostat (Autolab 204) in a typical three-electrode system (counter electrode: platinum wire, reference electrode: Ag/AgCl in 3 M KCl, and working electrode: FPBA or FPBA/rGO). Electrochemical experiments were conducted using a 0.5 M Na2SO4 electrolyte solution. Galvanostatic charge–discharge (GCD) and cyclic voltammetry (CV) measurements were conducted within the potential range of −0.4 to 0.6 V. Electrochemical impedance spectroscopy (EIS) measurements were conducted within an alternating current frequency range of 100 kHz to 10 mHz with an amplitude of 10 mV. The following equations were used to compute the specific capacity (C), specific energy (E), and specific power (P) resulting from the GCD plots.11,36,37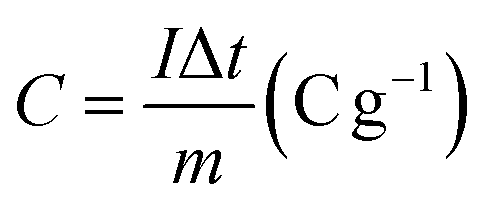 | (1) |
 | (2) |
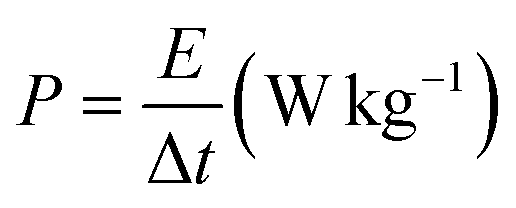 | (3) |
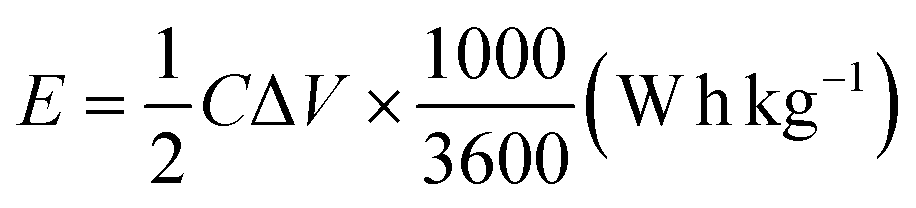
2.6 Working electrode preparation
The active electrode material (FPBA or FPBA/rGO) (1.8 mg, 80 wt%), carbon black (10 wt%, serving as a conductive additive) and polyvinylidene fluoride (10 wt%, acting as a binder) were stirred well in N-methyl pyrrolidone (NMP) to get a homogeneous slurry. The slurry was deposited onto a 1 cm2 nickel foam substrate, followed by drying in a vacuum oven at 60 °C for 12 hours. This electrode was then used for electrochemical investigations.2.7 Fabrication of the symmetrical supercapacitor device (SScD)
The SScD was fabricated using Swagelok cells with a diameter of 16 mm, which is shown in Scheme 1. The slurry was applied to circular Ni-foam and allowed to air dry in the oven for 12 h at 80 °C. Finally, the device was fabricated by stacking the two electrodes separated by a cellulose separator soaked in a polyvinyl alcohol–sodium sulfate (PVA–Na2SO4) gel polymer electrolyte.3. Results and discussion
3.1 Material characterization
Synthesis of FBPA was achieved by a cation exchange strategy through coprecipitation of ferrous sulfate (FeSO4·7H2O) and sodium hexacyanoferrate (Na4[Fe(CN)6]·10H2O) salts in the presence of sodium citrate (Na3C6H5O7) under an inert atmosphere of nitrogen. In this process, Fe2+ ions partially replace the Na+ ions of Na4[Fe(CN)6] and lead to the precipitation of Na2−xFe[Fe(CN)6]. Sodium citrate acts as a chelating agent, ensuring the slow release of Fe2+ ions and causing slow nucleation of FPBA, resulting in cubic crystals with fewer defects.21 During the reaction, the inert atmosphere plays a significant role in mitigating the oxidation of Fe2+ into Fe3+, thereby ensuring the formation of highly sodiated FPBA, which is crucial for realizing high charge storage capacity. The FPBA/rGO composites of different relative proportions (FPBA/rGO ratios: 1:3, 1:1, and 3:1 by weight) were synthesized by ultrasonication of the ethanol suspension containing respective proportions of FPBA and rGO. Ultrasonication induces the delamination of rGO sheets and allows effective interaction of rGO and FPBA, leading to the formation of a robust composite stabilized by coordinative interaction of surface Fe of FPBA and carboxylate and other oxygen-containing functional groups (hydroxy and epoxy) of rGO sheets.
Fig. 1a shows the PXRD pattern of the as-synthesized FPBA, rGO, and the composite FPBA/rGO at room temperature. For every prepared sample, distinct crystalline Braggs peaks are seen. For a comprehensive crystallographic study, PXRD data have been refined by the Rietveld refinement using FullProf software (Fig. 1b). The Rietveld refinement utilized crystallographic models obtained from the Crystallography Open Database (COD-7047886) for precise structural analysis.38 The diffraction peak profiles are refined by using the pseudo-Voigt function. Peaks are fitted well with the calculated pattern by changing the number of parameters, which include the lattice parameters, scale factor, background, atomic position, full width at half-maximum (FWHM), site occupancy, and isothermal factor. The fitted PXRD pattern shows that the prepared FPBA has a cubic phase with the Fm3m space group. Moreover, it reveals the presence of a single phase of FPBA with no impurity or secondary phase. In the cubic structure of the material, the low spin FeLS (C-coordinated) and high spin FeHS (N-coordinated) occupy the 4a (0,0,0) and 4b (1/2, 1/2, 1/2) Wyckoff positions, respectively. The C and N atoms are located at the 24e (1/4, 0, 0) and 24e (1/2, 0, 0) positions, respectively, while the Na ions are positioned at the interstitial site 8c (0.25, 0.25, 0.25). The refined parameters obtained through Rietveld analysis of the fitted PXRD data are given in Table S1.† The PXRD of rGO confirms its signature peaks at 2θ values of 24° and 44°, corresponding to (002) and (100) planes, respectively.39 In the FPBA/rGO composite, diffraction peaks corresponding to both FPBA and rGO components are observed, confirming the successful integration of these two materials. Moreover, the absence of any alteration in the peak pattern of FPBA in the composite suggests that its structural integrity is maintained during ultrasonication.
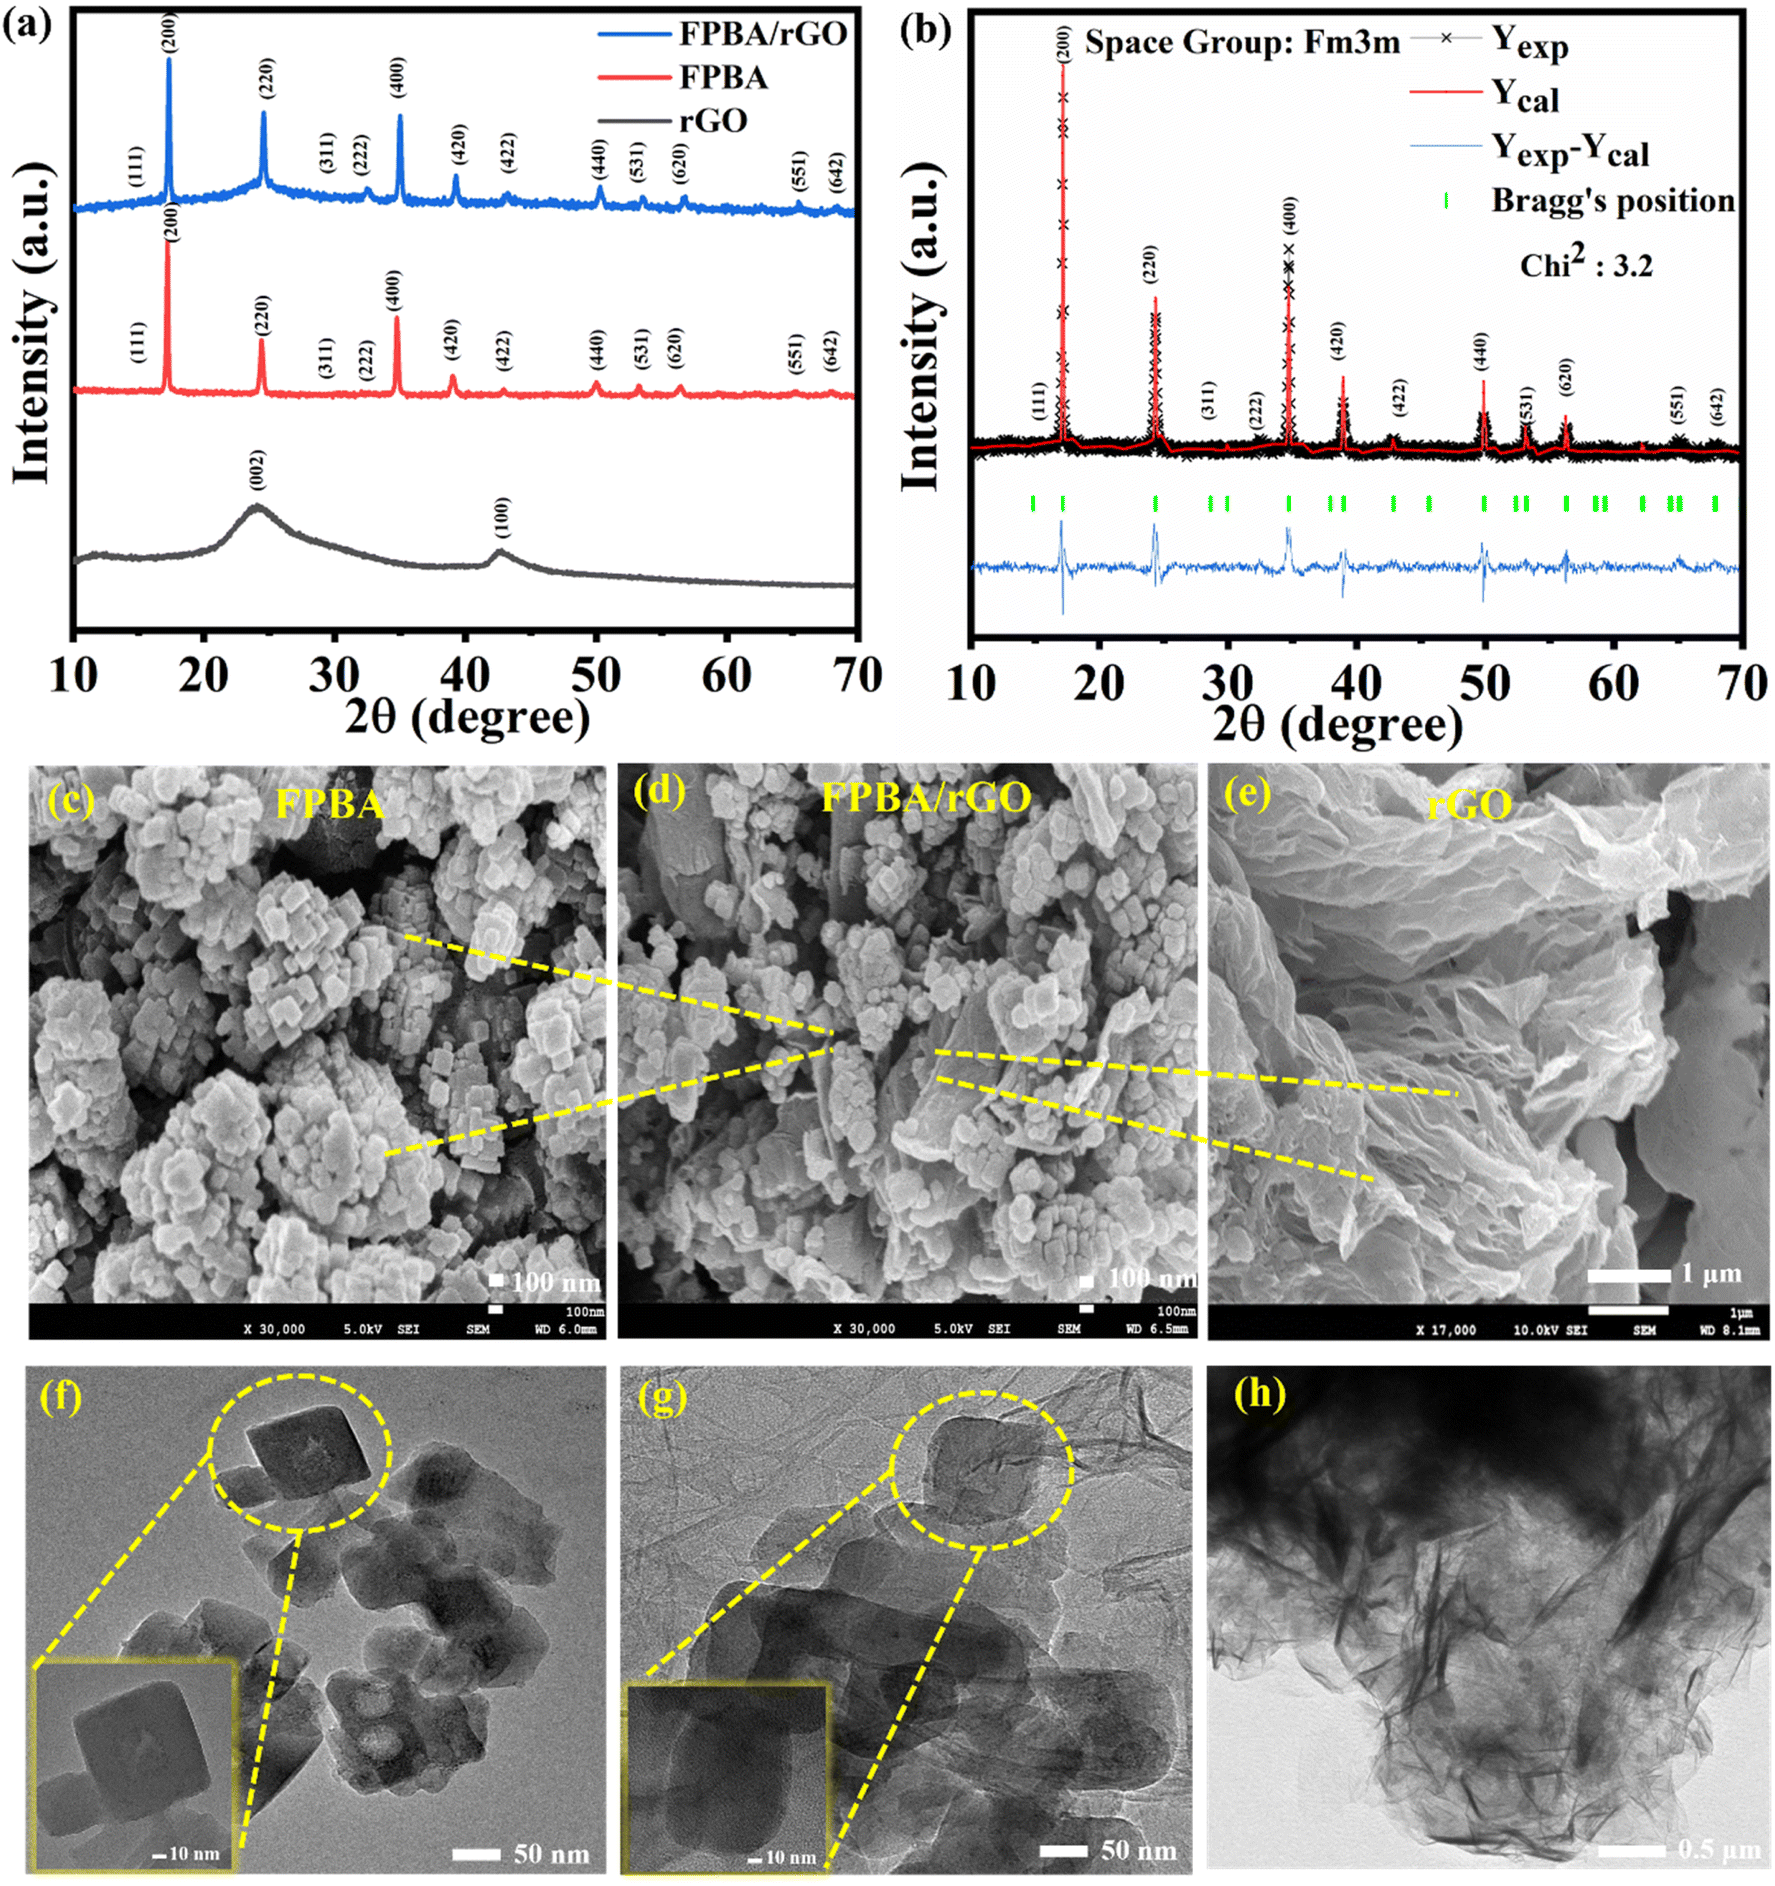 | ||
| Fig. 1 Room temperature PXRD patterns of (a) rGO, FPBA, and FPBA/rGO; (b) fitted diffraction pattern using Rietveld refinement of FPBA; FESEM images of (c) FPBA, (d) FPBA/rGO, and (e) rGO; TEM images of (f) FPBA, (g) FPBA/rGO, and (h) rGO. | ||
The thermal stabilities and weight loss profiles of FPBA, rGO, and FPBA/rGO were analyzed using TGA, which are depicted in Fig. S1.† The weight loss patterns of FPBA and FPBA/rGO show a similar three-step weight loss pattern. The first step corresponds to the removal of surface adsorbed, zeolitic, and coordinated water molecules up to 260 °C in FPBA and 270 °C in the FPBA/rGO composite before the decomposition of the PBA framework. The commencement of PBA framework disintegration at 10 °C higher temperature in the composite compared to neat FPBA suggests that the compositization reinforces the overall thermal stability. The second weight loss is related to the decomposition of the cyanide group and the subsequent transformation of double metal cyanide complexes into metal nitride.40 The final weight-loss step entails the complete decomposition of the materials into metal oxides. In the case of rGO, two weight loss steps, corresponding to (i) dehydration and decarboxylation up to 400 °C and (ii) decomposition of the carbonaceous sheet up to 680 °C, are observed.3 The percentage weight loss corresponding to different temperature ranges for all three materials is listed in Table S2.† To further explore the pore size characteristics of the materials, BET analysis was conducted, as shown in Fig. S2.† The results indicate that all materials exhibit type-IV N2 adsorption isotherms, characteristic of mesoporous structures. The specific surface areas of FPBA, rGO, and the FPBA/rGO composite were calculated to be 56.98 m2 g−1, 165.32 m2 g−1, and 99.10 m2 g−1, respectively. The composite displays a gravimetric average of the surface areas of the individual components. The high surface area of the composite, rendered by rGO, is expected to facilitate the EDLC-type charge storage, enhancing the specific power. At the same time, redox-active Fe centers of PBA are expected to boost the specific energy of the composite, making it a suitable material for deriving high energy without compromising the power.
FTIR spectra of the composite FPBA/rGO and its components are given in Fig. S3.† In FPBA and FPBA/rGO, the presence of a bridging C![[triple bond, length as m-dash]](https://www.rsc.org/images/entities/char_e002.gif) N ligand and its C-end and N-end coordination to Fe can easily be identified from the peaks at 2100 cm−1 (νC≡N), 600 cm−1 (νFe–C), and 455 cm−1 (νFe–N). Besides, stretching and bending modes of vibration for coordinated and zeolitic water molecules are also observed at 3742–3291 cm−1 (νO–H), 1609 cm−1 (δH2O–zeolitic) and 1617 cm−1 (δH2O-coordinated). For rGO, characteristic peaks corresponding to C
N ligand and its C-end and N-end coordination to Fe can easily be identified from the peaks at 2100 cm−1 (νC≡N), 600 cm−1 (νFe–C), and 455 cm−1 (νFe–N). Besides, stretching and bending modes of vibration for coordinated and zeolitic water molecules are also observed at 3742–3291 cm−1 (νO–H), 1609 cm−1 (δH2O–zeolitic) and 1617 cm−1 (δH2O-coordinated). For rGO, characteristic peaks corresponding to C![[double bond, length as m-dash]](https://www.rsc.org/images/entities/char_e001.gif) C, CO, and C–O vibrations appear at 1535, 1723, and 1078 cm−1, respectively, indicating that the rGO sheets possess numerous carboxylic and hydroxy/epoxy functional groups apart from the CC framework. In the case of FPBA/rGO composite, besides the CN and H2O peaks, a blue-shifted peak of CO is also observed at 1736 cm−1, suggesting the interaction of rGO with FPBA through coordination of rGO carboxylate groups with surface Fe2+ of FPBA.38
C, CO, and C–O vibrations appear at 1535, 1723, and 1078 cm−1, respectively, indicating that the rGO sheets possess numerous carboxylic and hydroxy/epoxy functional groups apart from the CC framework. In the case of FPBA/rGO composite, besides the CN and H2O peaks, a blue-shifted peak of CO is also observed at 1736 cm−1, suggesting the interaction of rGO with FPBA through coordination of rGO carboxylate groups with surface Fe2+ of FPBA.38
The morphology of each sample was characterized using FESEM. The FESEM (Fig. 1c) image shows that FPBA exhibits a cubic shape with an average size of 90 nm. The FESEM image of rGO (Fig. 1e) reveals the sheet-like structure of rGO. For FPBA/rGO, the dispersion of FPBA cubes on rGO sheets can be clearly seen (Fig. 1d), confirming the formation of the composite. Fig. S4† illustrates the elemental mapping and EDX spectra of FPBA and the FPBA/rGO composite. The EDX spectra of both materials show the presence of all constituent elements (Na, Fe C, N, and O) in appropriate proportion. Moreover, the elemental mapping of individual elements reveals a homogeneous presence, indicating a uniform compositization. The TEM analysis, as shown in Fig. 1f–h, provides detailed insights into the morphology of FPBA, the FPBA/rGO composite, and the rGO sheet. FPBA nanocubes exhibit a well-defined cubic structure with an average size of around 90 nm, indicating uniform particle distribution. Fig. 1g shows the FPBA/rGO composite, where FPBA nanocubes are anchored onto the rGO sheets. In Fig. 1h, rGO shows a characteristic wrinkled morphology with thin, layered sheets. These morphological features suggest that the FPBA/rGO composite could provide enhanced surface area and active sites, which are crucial for improving the electrochemical performance.
XPS analysis of the FPBA/rGO composite was performed to explore its element valence state and surface chemical composition. Fig. 2a displays a full-survey XPS spectrum of the FPBA/rGO composite, revealing the presence of Na, Fe, C, N, and O. Their core-level spectra were also subjected to HR-XPS studies and deconvoluted for further analysis. Fig. 2b depicts the binding energy of Na+ 1s electrons at 1071.1 eV.41 For Fe 2p, two sets of doublets related to Fe2+ (708.8 eV for 2p3/2 and 721.7 eV for 2p1/2) and Fe3+ (710.3 eV for 2p3/2 and 724.0 eV for 2p1/2) are observed, with Fe2+ being in the dominant proportion (Fig. 2c).42 The C 1s spectrum (Fig. 2d) reveals four peaks at 284.6, 285.3, 286.5, and 288.2 eV, corresponding to C–C/CC, CN, C–O, and CO, respectively. In the high-resolution N 1s spectrum (Fig. 2e), two peaks are observed at 397.8 and 398.6 eV, representing the nitrogen in the cyanide linker bonded to low-spin Fe2+ and Fe3+, respectively.43Fig. 2f presents the high-resolution XPS spectrum of O 1s, where two intense and one weak peak, corresponding to C–O, M–OH2, and surface adsorbed water, are observed at 532.2, 529.7, and 535.1 eV, respectively.44
 | ||
| Fig. 2 (a) XPS survey spectra of FPBA/rGO; high-resolution spectra of (b–f) Na 1s, Fe 2p, C 1s, N 1s, O 1s, respectively. | ||
3.2 Electrochemical performance
The electrochemical performances of FPBA, rGO, and FPBA/rGO electrodes were evaluated by GCD, CV, and EIS techniques. Before doing detailed studies, we optimized the potential range and the relative proportion of FPBA and rGO to get the best performance. The most optimized potential window was assessed by performing CV of the FPBA/rGO material in different potential windows in aqueous Na2SO4 electrolyte, which revealed −0.4 to 0.6 V to be the best potential window, yielding the highest capacity output without onset of water electrolysis. To determine the most favorable composition of FPBA/rGO, three composites with different relative proportions of FPBA and rGO (75:25, 50:50, and 25:75) were subjected to CV and GCD studies. CV and GCD studies of these composites revealed that, at 1 A g−1 current density, the 75:25 composite exhibited a capacity of 219 C g−1. As more rGO was added, the capacity increased and reached a maximum value of 437 C g−1 for the 50:50 composite due to the improved electrical conductivity of the composite electrode. However, further addition of rGO led to decreased capacity in the 25:75 composite with a capacity of 191 C g−1. It is due to the blocking of FPBA channels caused by excessive rGO coverage. The CV and GCD profiles of 25:75 and 75:25 ratios are given in Fig. S5 of the ESI.† Based on the superior electrochemical performance observed for the 50:50 ratio, all subsequent electrochemical studies were conducted using the FPBA/rGO composite with a 50:50 ratio of its components. The FPBA/rGO composite mentioned in the subsequent discussion refer to the 50:50 composite.
The CV curves of FPBA, rGO, and FPBA/rGO, within the −0.4 to 0.6 V potential window, at 10 mV s−1 scan rate, are depicted in Fig. 3a. The comparison of CV curves clearly indicates that the voltammogram area of the FPBA/rGO composite is the highest among the three materials, implying the highest charge storage performance exhibited by the composite compared to its constituents. This enhancement arises primarily from the synergistic interaction between the two components, which collectively enhances the overall electrochemical performance. The cyclic voltammogram of rGO resembles a typical EDLC-type charge storage, whereas those of FPBA and FBPA/rGO feature two anodic and two cathodic peaks, corresponding to high spin Fe3+/2+ (−0.005 V for FPBA and −0.009 V for FPBA/rGO) and low spin Fe3+/2+ (0.142 V for FPBA and 0.148 V for FPBA/rGO) couples. With reference to the standard hydrogen reference electrode (SHE), these values may be written as +0.204 and +0.200 V for high spin Fe3+/2+ and +0.351 and +0.357 V for low spin Fe3+/2+ of FPBA and FPBA/rGO, respectively. Compared to E0 for Fe3+/2+ given in the electrochemical series (+0.750 vs. SHE), the observed E0 values for Fe3+/2+ in FPBA and FPBA/rGO are significantly less. During the anodic sweep, representing the charging step, two Na+ ions get extracted from FPBA as a result of stepwise oxidation of two types of Fe2+ centers to the Fe3+ state, involving overall two-electron transfer. Reverse step takes place during the cathodic sweep, representing the discharging step. The symmetrical nature of the two redox peaks corroborates the good electrochemical reversibility and coulombic efficiency of the materials. In the composite, apart from these faradaic processes causing the charge storage (diffusion-controlled charge storage), considerable EDLC-type charge storage (surface controlled) also takes due to the presence of 2D rGO layers, which is desirable for boosting the specific power.45 We also studied the CV of bare Ni-foam and compared with FPBA, rGO, and FPBA/rGO, as shown in Fig. S6.† It was noticed that the area enclosed by the CV of the bare Ni-foam is insignificant compared to the three electrode materials, implying the Ni-foam does not contribute to the charge storage, and the active electrode materials are solely responsible for the overall charge storage. Fig. 3b–d illustrate the CV curves of the three materials obtained at varying scan rates (10–100 mV s−1). For all three materials, increasing the scan rate leads to increased current. For FPBA and FPBA/rGO, increasing separation in anodic and cathodic peaks is also observed due to the polarisation effect. It also causes the two distinct redox peaks for low and high spin Fe centers, observed at 10 mV s−1, to gradually merge to a single peak.
 | ||
| Fig. 3 (a) CV of rGO, FPBA, and FPBA/rGO at a scan rate of 10 mV s−1 in 0.5 M Na2SO4; (b–d) CV of rGO, FPBA, and FPBA/rGO at varying scan rates (10–100 mV s−1), respectively. | ||
The charge storage mechanisms in rGO, FPBA, and FPBA/rGO electrode materials have been studied by the power law. According to the power law, the CV peak current (i) is related to the scan rate (v) using the equation i = avb, where a and b are constants. The value of b can be calculated from the slope of lni vs. lnv. A surface-controlled charge storage is considered if the value of b is close to 1, whereas if its value is close to 0.5, it indicates a diffusion-controlled charge storage mechanism. The observed values of b calculated from the plot using the anodic peak current of rGO, FPBA, and FPBA/rGO are 0.98, 0.58, and 0.74, respectively (Fig. S7†). The values corroborate the operation of surface, diffusion, and combined surface and diffusion-controlled charge storage mechanisms in the three materials, respectively. For the electrode materials loaded on the current collector, not the whole electrode material is in direct contact with the current collector. In particular, when the material has poor electronic conductivity, a significant proportion of the loaded material does not participate in the redox process because of the high impedance for electron transfer from the electrode material to the current collector. This results in poor diffusion of electrolyte ions in the bulk of the electrode, eventually significantly impacting the electrochemical performance. For the FPBA/rGO composite, rGO ensures electrical contact of each FPBA crystallite with the current collector through its extended highly conductive 2D sheets, thus boosting the Na+ ion diffusion in the composite compared to neat FPBA. To assess this effect, we also calculated the Na+ ion diffusion coefficient in FPBA and FPBA/rGO using the Randles–Sevcik equation, as mentioned below46
| ip = 2.69 × 10⁵n2/3 CAD1/2ν1/2 | (4) |
The graphs of ipvs. ν1/2 for FPBA and FPBA/rGO are given in Fig. S8,† which were used to calculate the diffusion coefficient in their bulk. The calculated Na+ ion diffusion coefficient values for FPBA and FPBA/rGO are 6.91 × 10⁻¹² and 2.28 × 10⁻¹¹ cm2 s−1, respectively, showing that the blending of rGO significantly improves the Na+ diffusion in the composite compared to that in FPBA.47
To determine the specific capacities and rate capabilities, GCD experiments were conducted on FPBA, rGO, and FPBA/rGO electrodes at various current densities (1–50 A g−1). A comparison of GCD profiles of the three materials at 1 A g−1 is depicted in Fig. 4a, while Fig. 4b (for FPBA/rGO) and Fig. S9† (for rGO and FPBA) show the GCD profiles at different current densities (1–50 A g−1). The GCD profile of rGO shows a triangular shape, which is typical of EDLC behavior. For FPBA and FPBA/rGO, a plateau can be seen, indicating the involvement of the faradaic process during charging and discharging. The comparison of specific capacities of rGO, FPBA, and FPBA/rGO at 1 A g−1 current density is given as a bar chart in Fig. 4c, which reveals that the specific capacity of FPBA/rGO (437 C g−1) is much more than the sum of specific capacities of rGO (108 C g−1 or specific capacitance 108 F g−1 as the voltage window is 1.0 V) and FPBA (204 C g−1). It is important to note that the theoretical capacity of FPBA is 614 C g−1, but neat FPBA achieves only 34% of this value at 1 A g−1. In contrast, the FPBA/rGO composite, which contains only half the amount of FPBA, can reach approximately 71% of the theoretical capacity. Furthermore, it is essential to understand that the charge storage in the FPBA/rGO composite is not solely due to faradaic processes; a significant portion of the charge storage is also attributed to the electric double layer capacitance (EDLC). Thus, it should not be misunderstood that the charge storage from faradaic processes in FPBA/rGO exceeds its theoretical capacity. The exorbitantly improved specific capacity in the composite compared to its constituents can be rationalized by the synergistic effect of rGO and FPBA. While FPBA offers redox active Fe2+ centers and suitable channels for the diffusion of Na+ ions, the rGO boosts the conductivity of the composite and helps activate most of the redox centers. Collectively, this synergism leads to lowered internal resistance, improved ion diffusion, enhanced charge transfer kinetics, and an expanded active surface area, resulting in an improved charge storage capacity.
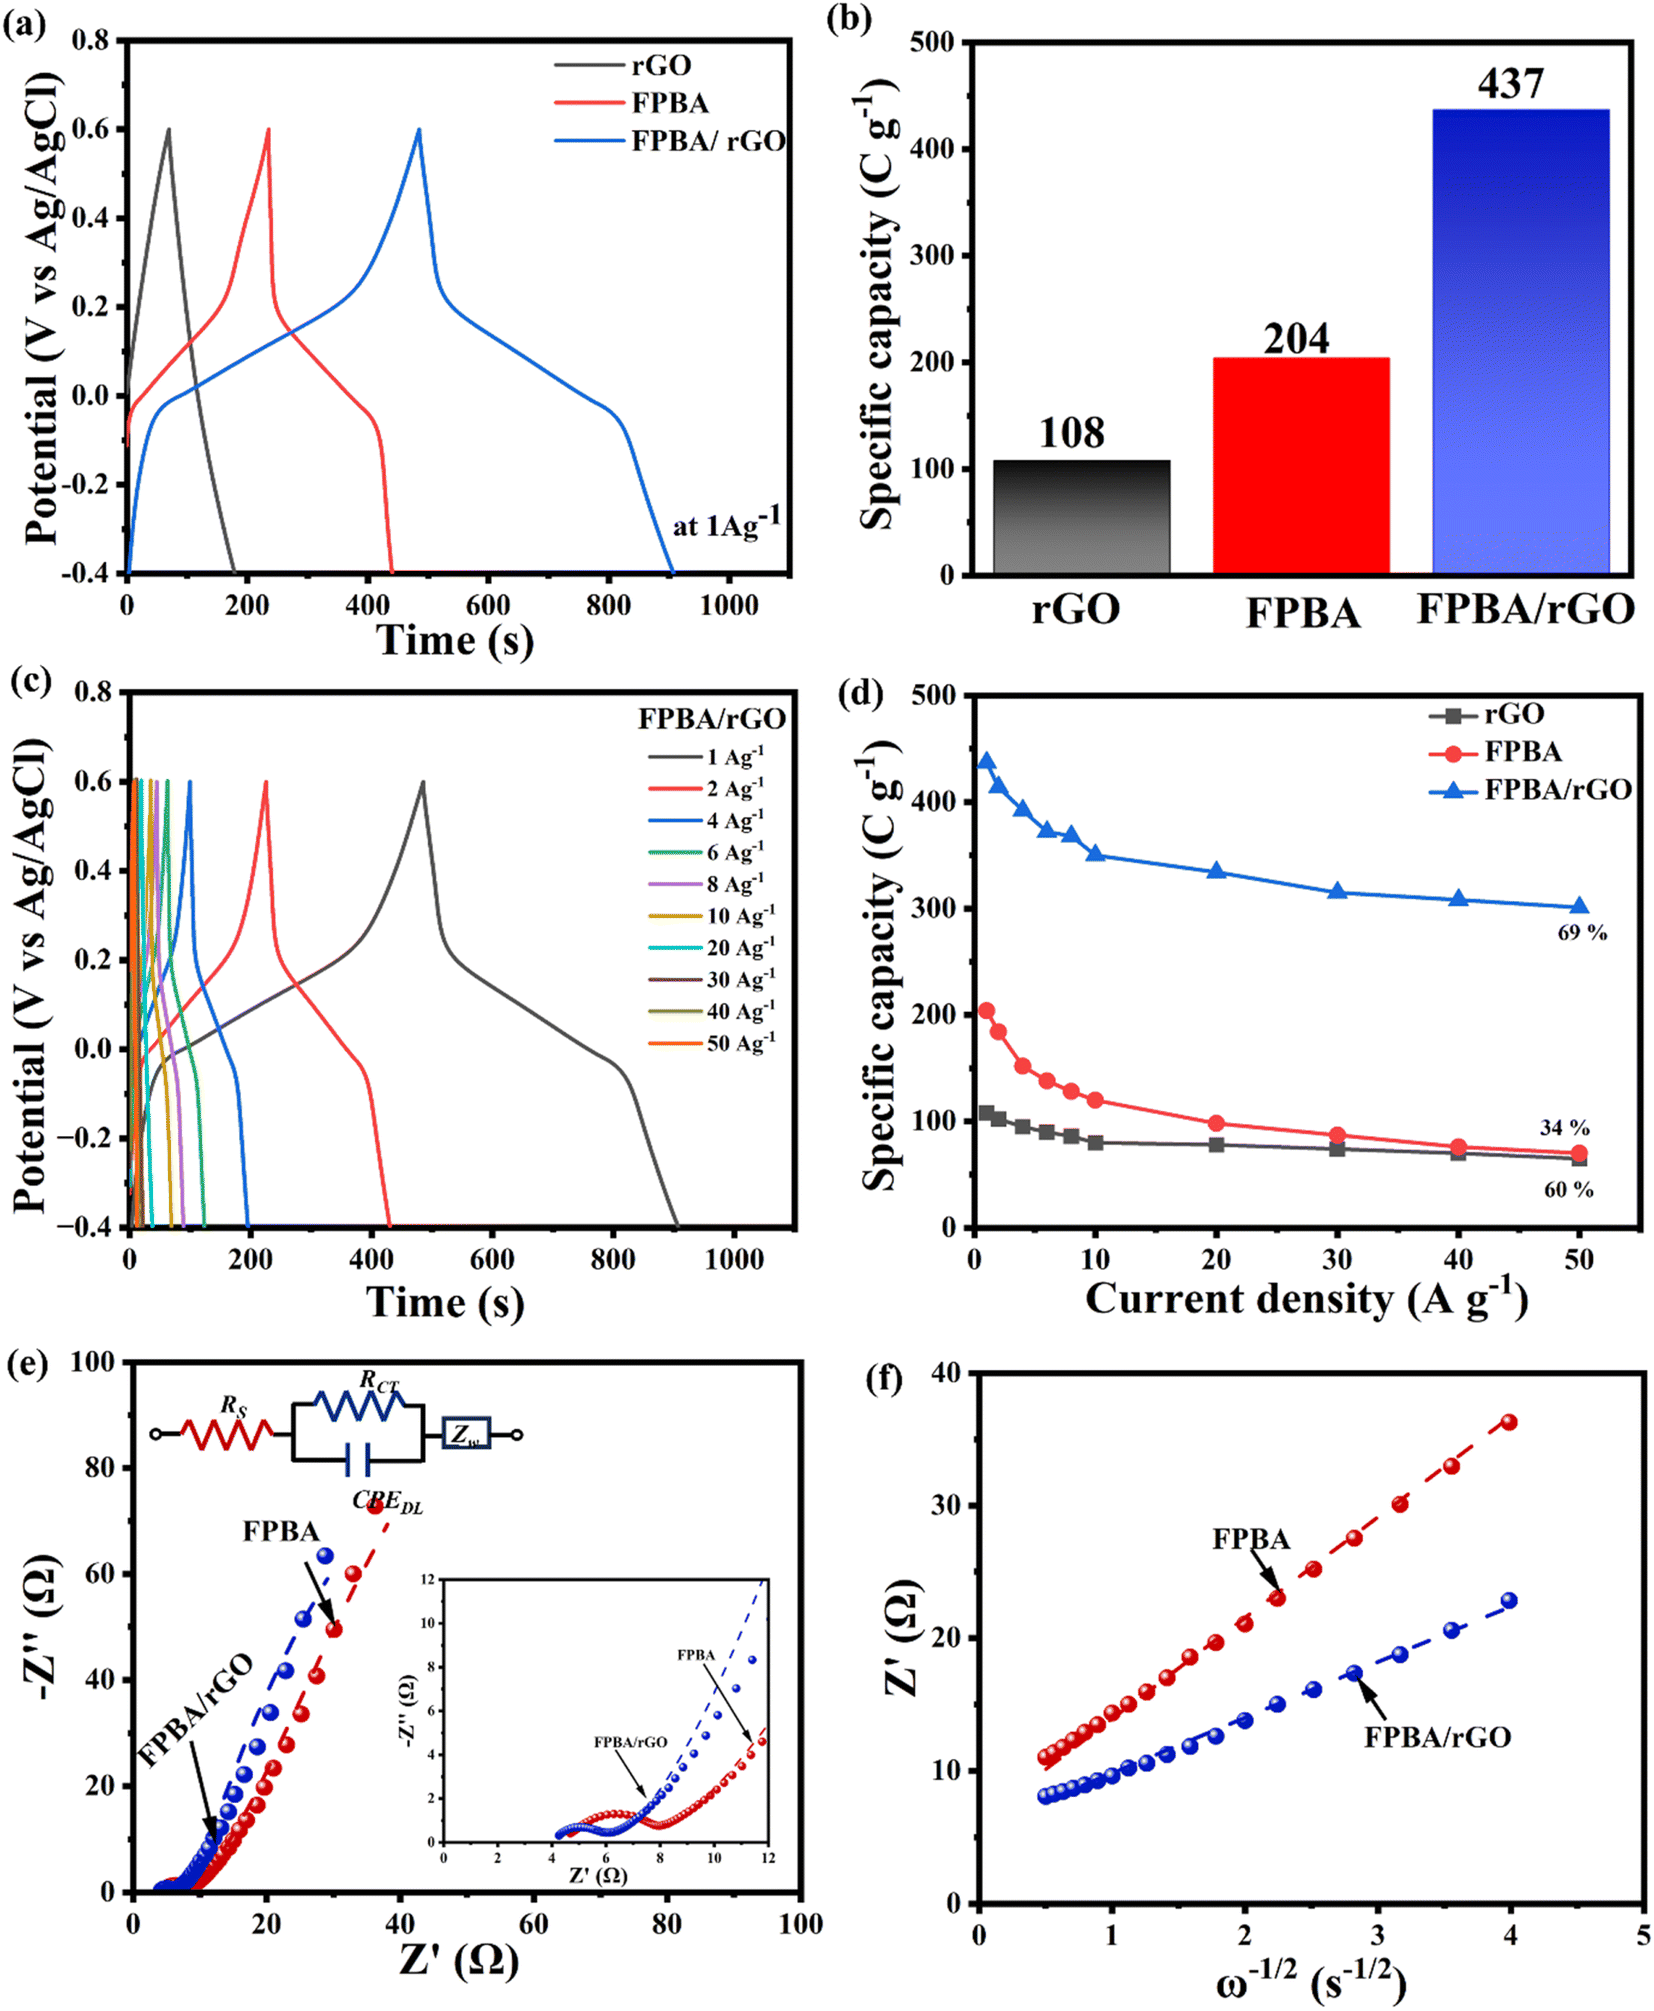 | ||
| Fig. 4 (a) Galvanostatic charge discharge curve comparison of rGO, FPBA, and FPBA/rGO at a current density of 1 A g−1 in 0.5 M Na2SO4; (b) specific capacity comparison of rGO, FPBA, and FPBA/rGO at 1 A g−1; (c) GCD plots of FPBA/rGO at different current densities (1–50 A g−1); (d) comparison of the change in the specific capacity of rGO, FPBA, and FPBA/rGO at varying current densities; (e) Nyquist plot and equivalent Randles circuit, and (f) the slope of the graph of real impedance (Z′) vs. square root of angular frequency (ω−1/2) representing the Warburg coefficients (σ) (Z′ = R + σω−1/2, where R is the gas constant).48 | ||
Fig. 4c and S9† reveal that with increasing current density, the shape of the GCD profiles of FPBA and FPBA/rGO remains unaltered, suggesting excellent reversibility of the materials. Moreover, with increasing current density, the specific capacity decreases, mainly due to the fact that the ion diffusion rate fails to keep up with the charge transfer rate.3 The variation of specific capacities of the three materials with increasing current density is shown in Fig. 4d. It reveals that, upon increasing the current density from 1 A g−1 to 50 A g−1, the composite shows the highest capacity retention (69%) compared to FPBA (34%) and rGO (60%), confirming excellent rate capability of FPBA/rGO. This corroborates that blending of rGO not only boosts the specific capacity of FPBA but also significantly improves the rate capability by increasing the diffusion rate. Moreover, this observation also matches well with the calculated diffusion coefficient (6.91 × 10⁻¹² cm2 s−1 for FPBA and 2.28 × 10⁻¹¹ cm2 s−1 for FPBA/rGO) as discussed above.
EIS was employed to assess the conductivity and ion transport characteristics of the prepared electrode materials. Fig. 4e and S10† display Nyquist plots and the corresponding fitted Randles circuit for the FPBA, FPBA/rGO, and rGO electrodes across a frequency range of 100 kHz to 10 mHz. The enlarged view of the Nyquist plots in the high-frequency zone is depicted in the inset. The different circuit elements used to represent the Randles circuit for FPBA, FPBA/rGO, and rGO are as follows: the extrapolated intercept of the high-frequency end of the Nyquist plot on the real axis corresponds to the equivalent series resistance (RS), also referred to as solution resistance. This resistance results from the total resistance contributed by the active material, electrolyte, current collector and the contact between the current collector and the active material. The diameter of the semicircle observed in the high-to-medium frequency zone represents the charge-transfer resistance (RCT). This resistance characterizes the rate of redox reactions occurring at the electrode–electrolyte interface. A low RCT indicates rapid charge transfer across this interface. CPEDL, or the constant phase element (CPE), represents the double-layer capacitance, which arises at the interfaces between solids and ionic solutions due to the segregation of ionic and electronic charges. Finally, the inclined slope in the low-frequency region signifies the diffusion resistance of the electrode material, commonly referred to as Warburg impedance.49 The values of impedance imposed by these circuit elements in FPBA, FPBA/rGO, and rGO are given in Table S3.†
Table S3† shows that the FPBA/rGO composite exhibits lower RS, RCT, and Warburg coefficient (σ) as compared to FPBA. These findings suggest that the composite exhibits a faster charge transfer rate at the electrode–electrolyte interface as well as facilitates faster Na+ ion diffusion. To assess the correctness of the Randles circuit, the values of the Warburg coefficient (σ) for FPBA and FPBA/rGO obtained from the Randles circuit and those calculated experimentally from the slope of the Z′ vs. ω−1/2 (angular frequency ω = 2πf) graph were also compared. The experimentally obtained values of the Warburg coefficient (σ) (7.602 Ω s−1/2 for FPBA and 4.180 Ω s−1/2 for FPBA/rGO) are very close to those observed from the fitted Randles circuit (7.013 Ω s−1/2 for FPBA and 3.936 Ω s−1/2 for FPBA/rGO), confirming the correctness of the fitted circuit. Based on the Warburg coefficient (σ) values of FPBA and FPBA/rGO, the Na+ diffusion rates inside the electrode materials were also calculated using the following equation.48
| DNa+ = 0.5R2T2/A2n4F4C2σ2 | (5) |
485 C mol−1), and C is the molar concentration of Na+ ions. Using the above equation, the calculated value of DNa+ for FPBA/rGO (1.283 × 10⁻¹⁰ cm2 s−1) was found to be significantly higher than that of FPBA (3.881 × 10⁻¹¹ cm2 s−1). This indicates that the composite exhibits faster diffusion kinetics, a result attributed to the conductive properties of reduced graphene oxide (rGO). These findings are consistent with the values obtained from cyclic voltammetry conducted at various scan rates for both FPBA and FPBA/rGO.
Furthermore, the charging and discharging rates of the electrode materials were assessed by determining the phase relaxation time constants (t0) from their Bode plots (Fig. S11†), which can be determined using eqn (6).3
 | (6) |
Owing to the metal dissolution problem, particularly in the aqueous medium, the cycling stability of FPBA is one of the major challenges that limit the wide-scale employment of PBAs as cathode materials. Therefore, the effect of rGO blending on the cycling durability of FBPA has also been investigated. The cycling stabilities of FPBA and the FPBA/rGO composite have been studied over 10000 GCD cycles at a current density of 10 A g−1 (Fig. S12†). Compared to FPBA which shows 72% capacity retention after 10000 cycles, the FPBA/rGO composite electrode exhibits 84% retention of the initial capacity. The enhanced cycling stability of the FPBA/rGO composite compared to neat FPBA can be attributed to the coordinative interactions between the carboxylate and oxy-functional groups of rGO with the surface Fe2+ ions of the FPBA. Through this coordination, the rGO sheets provide a stable platform for anchoring multiple surface Fe2+ ions, thereby reducing their dissolution during repeated charge–discharge cycles.
To evaluate the structural and morphological changes, as well as the extent of iron dissolution during cycling in each electrode, we conducted PXRD, FESEM, and EDX studies on both fresh and 1000-cycled FPBA and FPBA/rGO samples. The PXRD results for fresh and 1000-cycled FPBA/rGO are shown in Fig. S13.† Prior to cycling, the material displayed sharp and well-defined peaks, indicating good crystallinity and stability of the phase. After completing 1000 cycles, we observed a slight reduction in peak intensity and some broadening, suggesting a partial loss of crystallinity or slight structural degradation. Despite these changes, the positions of the peaks remained largely unchanged, which indicates that the primary phase was retained after cycling. The decrease in intensity, however, suggests that some degradation or phase transformation may have occurred due to the cycling process.
The FESEM images of fresh and 1000-cycled FPBA and FPBA/rGO, along with the extent of metal dissolution, are presented in Fig. S14† for comparison. The FPBA demonstrated a significant reduction in nanocube size after 1000 cycles and showed a substantial loss of Fe content, indicating severe metal dissolution. Analysis of the EDX spectra for fresh and recycled FPBA revealed that the calculated Fe loss in the recycled FPBA was 67% (Fig. S14a–c†). In contrast, when examining the same parameters for FPBA/rGO composites (Fig. S14d–f†), we found that the morphology and size of the FPBA remained largely unchanged after cycling, and the Fe loss was limited to 25%, approximately 2.7 times less than that observed in the recycled PBA.
We also subjected the remaining electrolyte from FPBA and FPBA/rGO recycling to UV-vis spectroscopy to further quantify the metal dissolution (Fig. 5a–f). After 1000 cycles, the electrolytes related to FPBA and FPBA/rGO exhibited characteristic peaks for [Fe(CN)6]4− at 319 nm and [Fe(CN)6]3− at 415 nm. Notably, the peak intensity of FPBA was significantly higher compared to that of FPBA/rGO. By using calibration plots of Na4[Fe(CN)6] and K3[Fe(CN)6], we quantified the concentrations of [Fe(CN)6]4− (Fig. 5a and b) and [Fe(CN)6]3− (Fig. 5c and d) in the electrolyte after 1000 cycles (refer to Table S4†). The total concentration of dissolved Fe ions in the electrolyte taken from FPBA was found to be 2.7 times higher than that in the case of FPBA/rGO, which aligns well with our comparative EDX study. These findings confirm that incorporating rGO with FPBA helps prevent the dissolution of iron into the electrolyte during stability analysis.
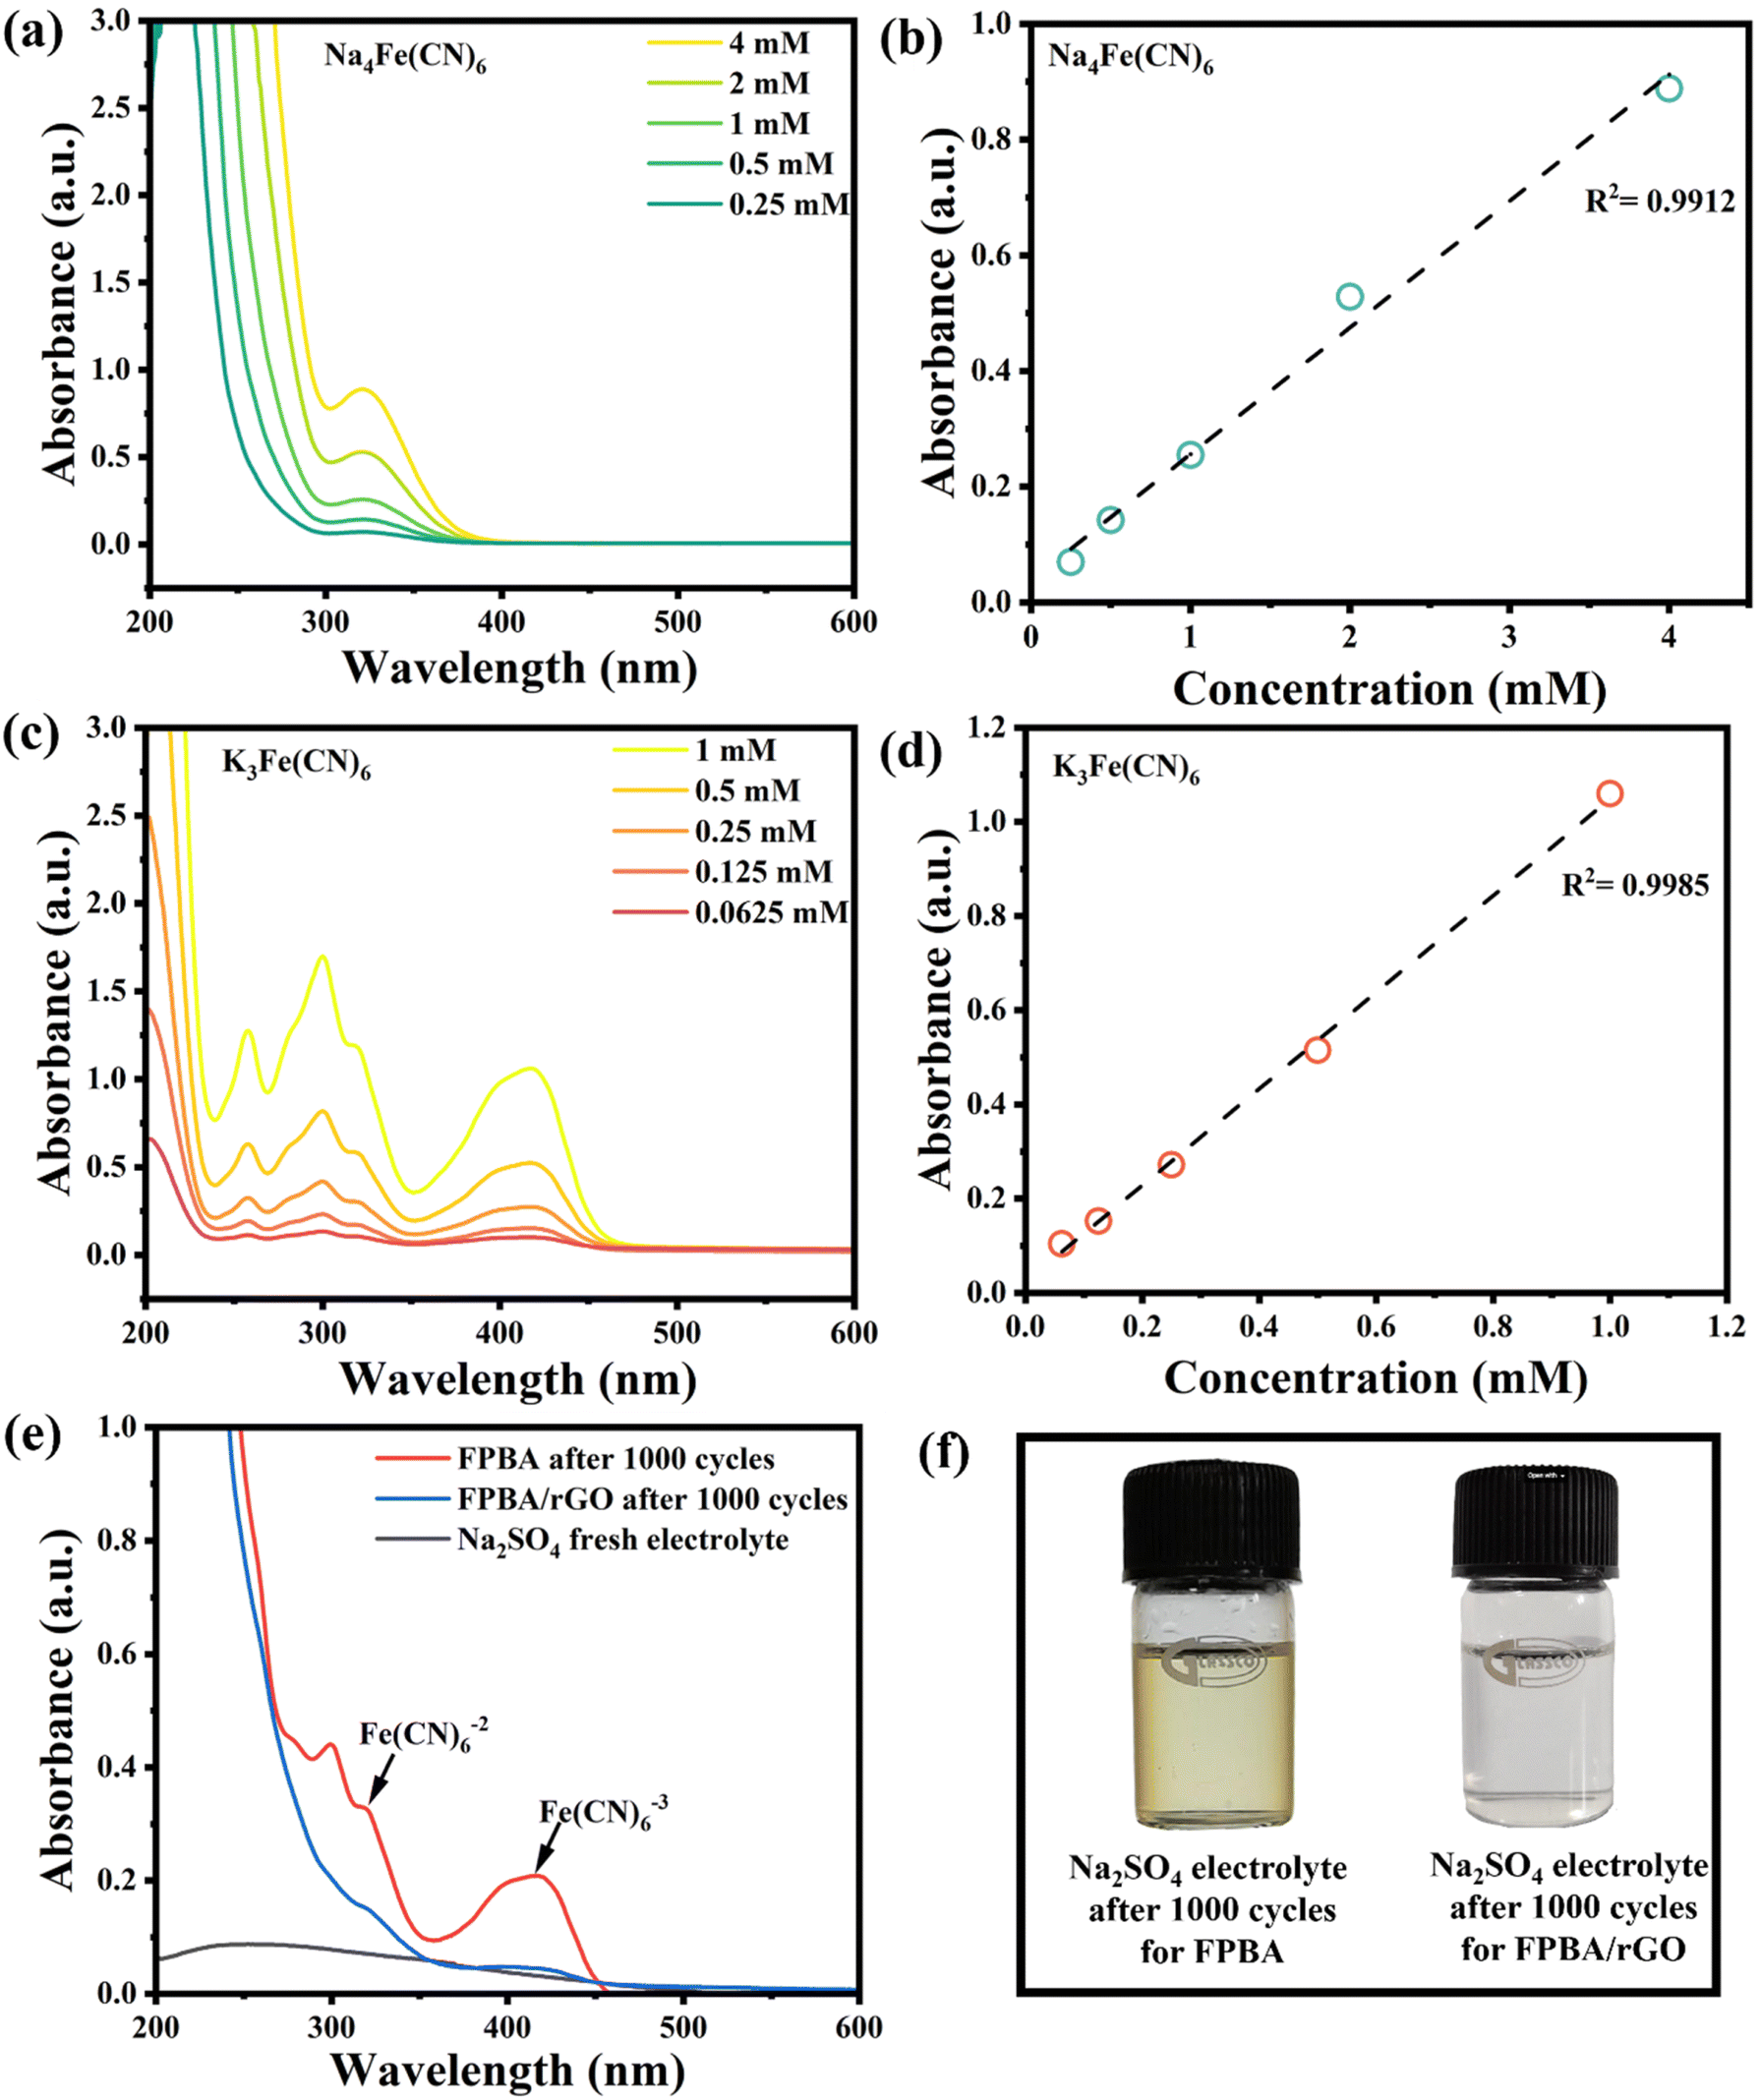 | ||
| Fig. 5 (a and b) UV-vis spectra (a) of Na4Fe(CN)6 at varying concentrations in 0.5 M Na2SO4, with the corresponding calibration plots (b) showing maximal absorption at 319 nm; (c and d) UV-vis spectra (c) of K3Fe(CN)6 at different concentrations in 0.5 M Na2SO4, along with the corresponding calibration plots (d) indicating maximal absorption at 415 nm; (e) UV-vis spectra of electrolyte, FPBA and the FPBA/rGO composite (0.5 M Na2SO4) after 1000 cycles; (f) concentration change graph after 1000 cycles calculated according to the calibration plots of electrolyte for FPBA and the FPBA/rGO composite (digital picture of 0.5 M Na2SO4 electrolyte after 1000 cycles of FPBA and FPBA/rGO composite samples). | ||
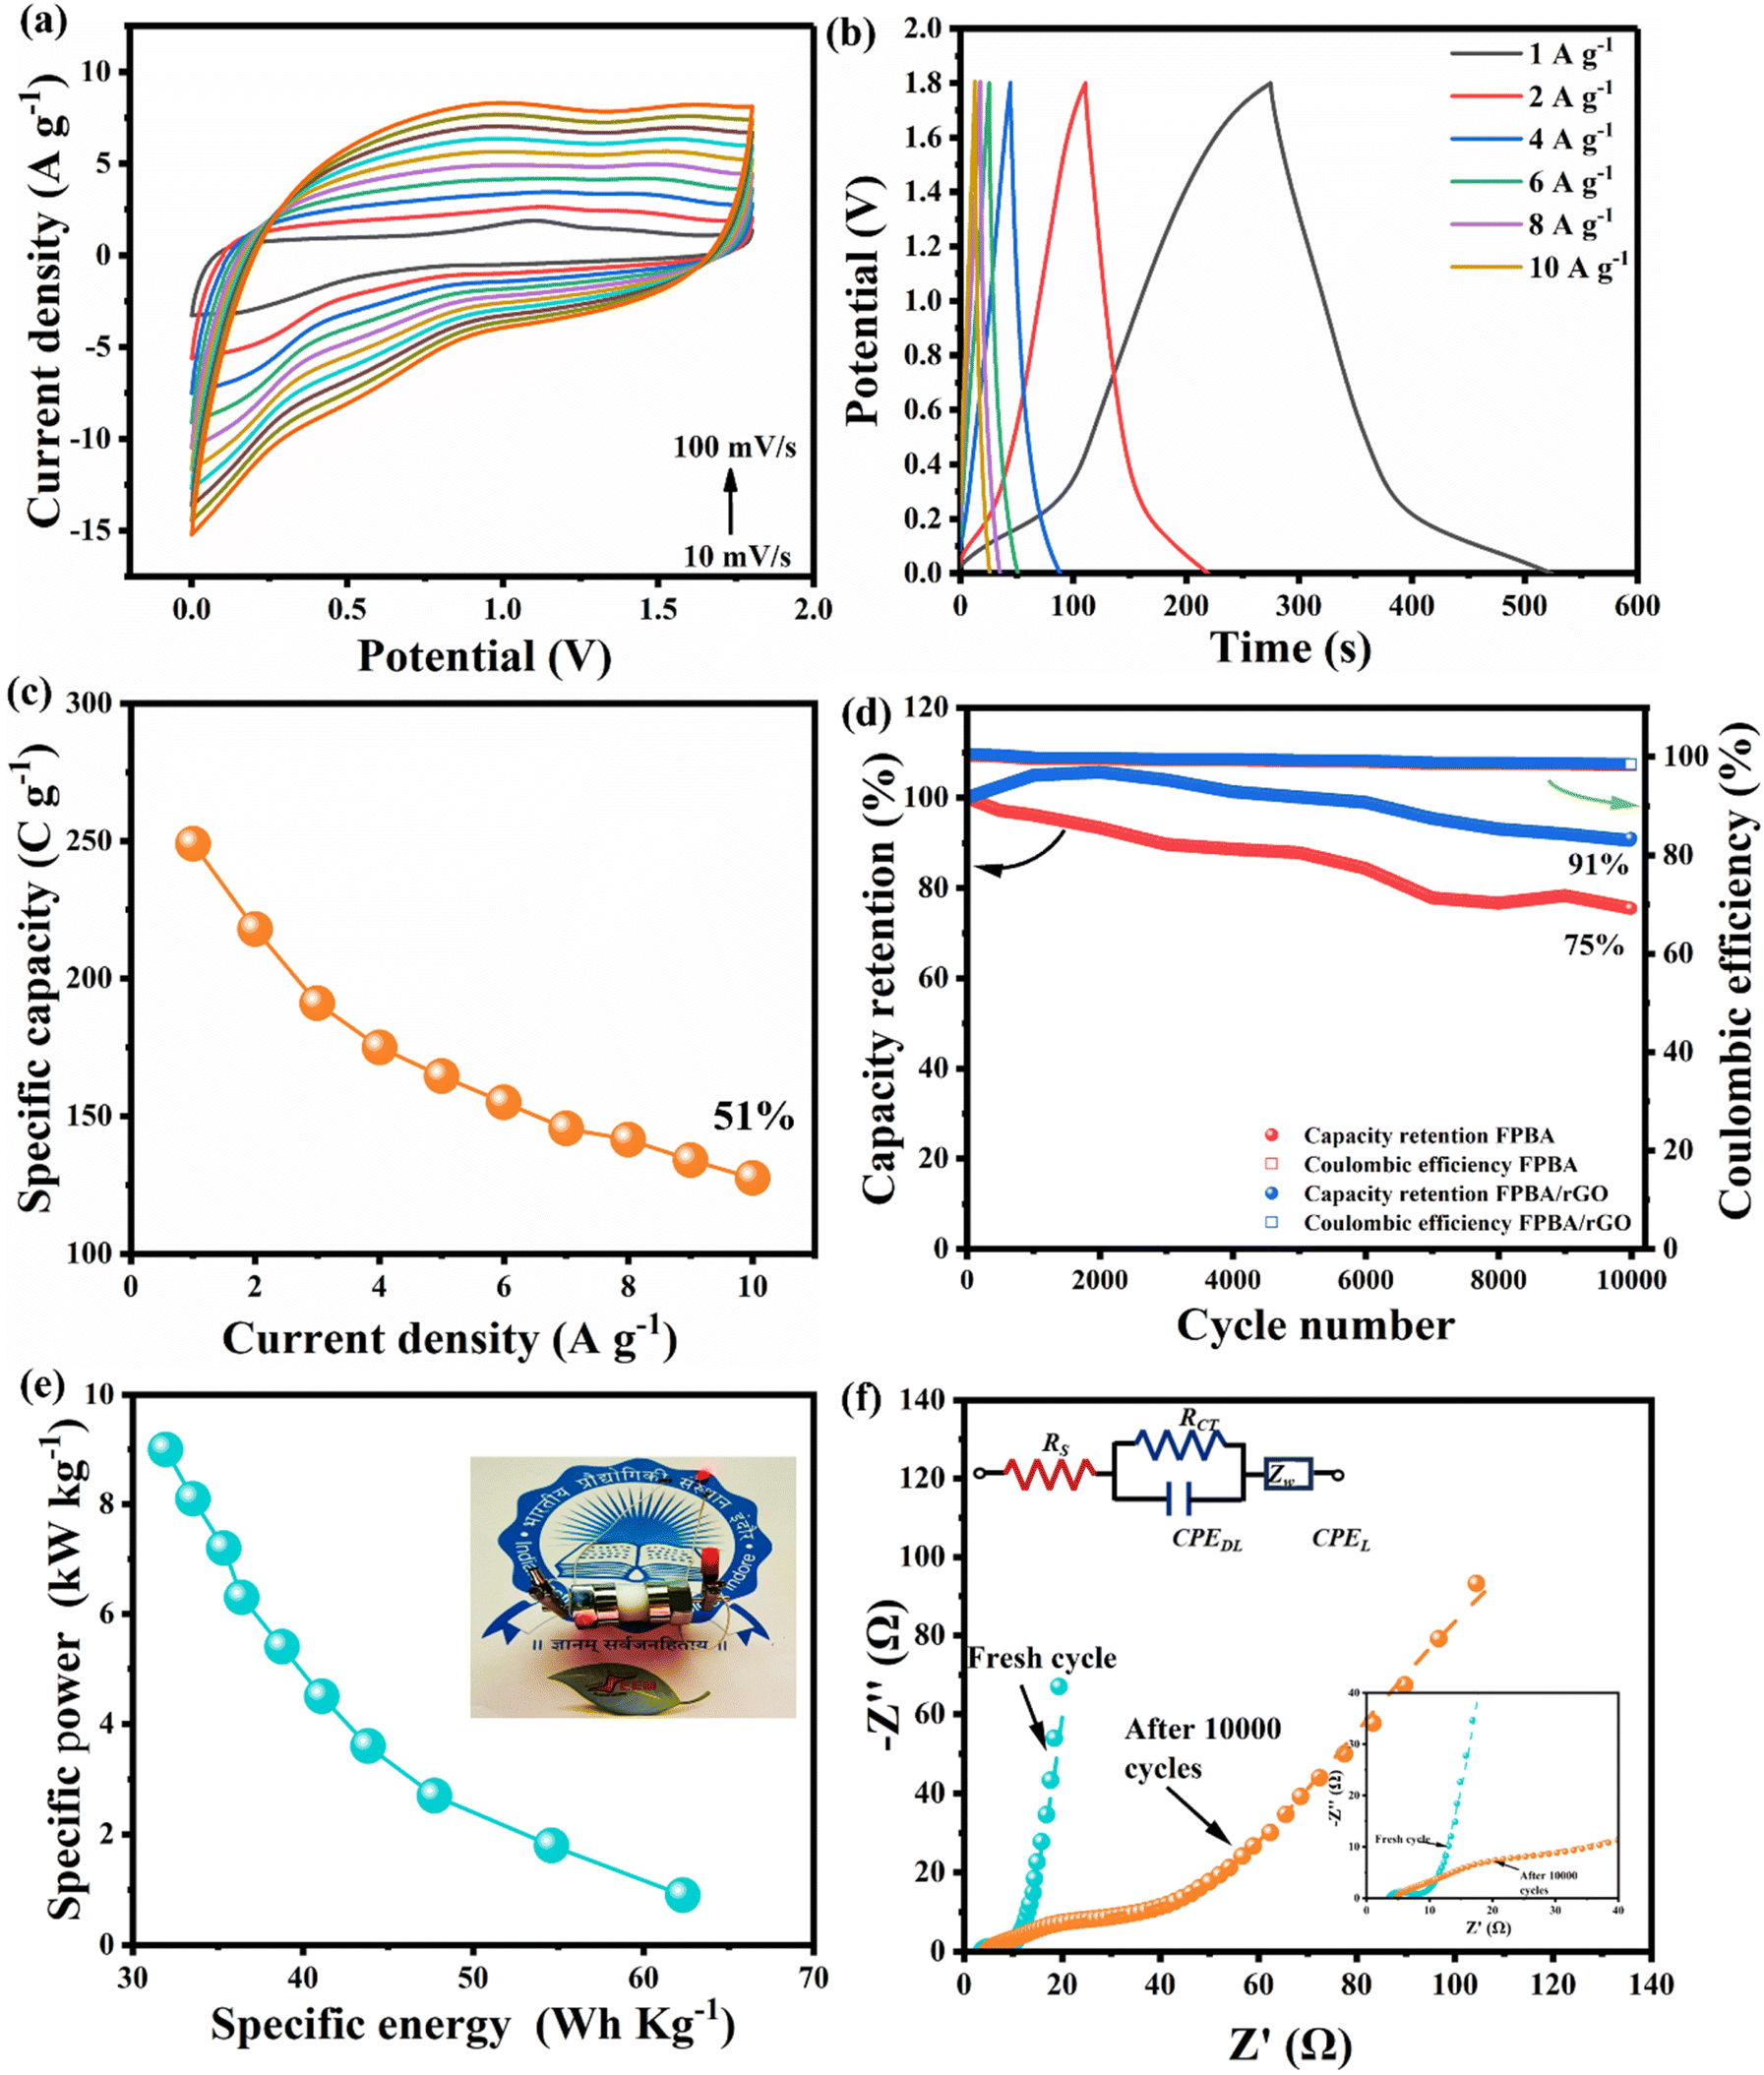
To demonstrate the practical applicability of the FPBA/rGO composite, a solid-state SScD (FPBA/rGO//FPBA/rGO) was prepared using a cellulose membrane separator. The CV and GCD profiles of the fabricated SScD, within 1.8 V, at different scan rates (10 mV s−1 to 100 mV s−1) and current densities (1 A g−1 to 10 A g−1), respectively, are given in Fig. 6a and b. For comparison purpose, a similar study for FPBA SScD (FPBA//FPBA) is shown in Fig. S15.† In contrast to the duck-shaped CV profile observed in a three-electrode setup, the SScD exhibited a more rectangular profile, with less prominent faradaic peaks. This behavior can be attributed to a pseudo-constant rate of charge storage, resembling that of electric double-layer capacitors (EDLC).35,50 A similar trend was observed in the device's GCD profile, which also lacked distinct plateaus during the charging and discharging phases. The variation in specific capacity with different current densities is shown in Fig. 6c, where the device reached a maximum specific capacity of 249.3 C g−1 at a current density of 1 A g−1. We conducted a stability test on the SScD over 10000 GCD cycles at a constant current density of 10 A g−1 within a voltage range of 0–1.8 V (Fig. 6d). The results indicate that the device retained 91% of its capacity after completing 10000 cycles, demonstrating excellent cycling performance. In the case of FPBA-based SScD only 75% capacity retention was observed after 10000 cycles. This finding confirms that the incorporation of rGO significantly enhances the cycling performance of FPBA, a trend also observed in the three-electrode setup mentioned earlier. A comparison of the Nyquist plots for the FPBA/rGO SScD before and after 10000 cycles revealed an increase in charge transfer and ion diffusion resistance, similar to the post-cycle analysis in the three-electrode setup (Fig. S16†). The parameters of different circuit elements from the Randles circuits fitted to the Nyquist plots of both the fresh and cycled SScD are summarized in Table S5.†
 | ||
| Fig. 6 (a) CV profiles of the SScD at scan rates from 10 mV s−1 to 100 mV s−1; (b) GCD profiles of the SScD at current densities from 1 A g−1 to 10 A g−1 (c) specific capacity of the SScD vs. current densities (1–10 A g−1) plot; (d) cycling performance of the SScD at 10 A g−1; (e) Ragone plots of the FPBA/rGO SScD; (f) comparison of Nyquist plots of the fresh FPBA/rGO SScD and after 10000 cycles. | ||
The goal of developing the Na+ ion solid-state composite device (SScD) is to achieve both high energy and high specific power, something that cannot be accomplished with either a battery or a supercapacitor alone. In this context, the Ragone plot illustrating specific power (P) versus specific energy (E) for the FPBA/rGO-based SScD is shown in Fig. 6e. The graph demonstrates the expected trend where specific power decreases as specific energy increases, and vice versa. With the composite electrode, the fabricated device achieves a maximum specific energy of 62.32 W h kg−1 at a specific power of 0.9 kW kg−1 and a maximum specific power of 9 kW kg−1 at a specific energy of 31.92 W h kg−1. To showcase the practical application of the FPBA/rGO electrode, a 1.7 V red light-emitting diode (LED) was successfully illuminated using a single device (see Fig. 6e inset). To compare the performance of FPBA/rGO cathode materials regarding specific capacity, cycling stability, specific energy, and specific power with previously reported PBA-carbonaceous material composites, a comparison table is provided in the ESI (Table S6).† The data clearly indicate that the FPBA/rGO composite outperforms others in all energy storage performance metrics. These impressive electrochemical properties make the FPBA/rGO composite a promising candidate for future energy storage devices. Additionally, as this material is composed of earth-abundant, eco-friendly, and low-cost components and offers high rate capability, long cycle life, and elevated energy and specific power, it is particularly well-suited for grid-scale energy storage applications.51
4. Conclusion
In summary, we successfully addressed the inherent issues of poor conductivity and excessive metal dissolution in Fe-based PBA (Na2−xFe[Fe(CN)6]·nH2O) cathodes by compositing them with reduced graphene oxide (rGO). The conductive properties of rGO enhance the overall conductivity of the composite. Additionally, the surface functional groups of rGO provide strong anchorage for the metal ions on the surface of the PBA, reducing their dissolution in the electrolyte during the charging and discharging cycles. As a result, the composite electrode demonstrates significant improvements in performance: it achieves a specific capacity of 437 C g−1 at 1 A g−1, shows a rate capability with only a 31% capacity loss when increasing the current from 1 to 50 A g−1, and maintains 84% capacity retention after 10000 cycles. In comparison, the neat PBA cathode achieves a specific capacity of 204 C g−1 at 1 A g−1, experiences a 66% capacity loss when moving from 1 to 50 A g−1, and retains only 72% of its capacity after 10000 cycles. Moreover, due to the presence of rGO, the composite electrode exhibits a notable contribution from capacitive charge storage in addition to faradaic charge storage. This results in high specific energy without compromising specific power, achieving a maximum energy density of 62.32 W h kg−1 and a maximum power density of 9.0 kW kg−1 in the symmetrical device fabricated using the composite electrode. Overall, our approach not only mitigates metal dissolution and enhances conductivity but also positively influences all performance metrics for energy storage.
Data availability
All the data will made available on reviewers’ request.Author contributions
Sheetal Gupta: conceptualization, methodology, validation, data curation, formal analysis, and writing – original draft. Mayank K. Singh: electrochemical measurement, data analysis and writing – review & editing. Sarathkumar Krishnan: data analysis and writing – review & editing. Suporna Bhowmik: writing – review & editing and formal analysis. Khushwant Singh: data analysis and writing – review & editing. Dhirendra K. Rai: conceptualization, validation, supervision, writing – original draft, writing – review & editing, funding acquisition, and resources.Conflicts of interest
The authors declare no competing interests associated with this research paper.Acknowledgements
All authors thank the Department of Metallurgical Engineering and Materials Science and Sophisticated Instrumentation Center, IIT Indore, for providing research infrastructure and instrumentation facilities. S. G. thanks the DST INSPIRE fellowship (IF190547) for providing financial support through a JRF fellowship. M. K. S. acknowledges the Translational Research Fellowship (IIT Indore). K. S. acknowledges ANRF for providing the Junior Research Fellowship. The authors sincerely thank Sarvesh Aware for his valuable assistance in designing the graphical abstract. The authors convey their gratitude to Akash Kankane for his help in many of the experimentations.References
- K. Khan, A. K. Tareen, M. Aslam, R. Wang, Y. Zhang, A. Mahmood, Z. Ouyang, H. Zhang and Z. Guo, J. Mater. Chem. C, 2020, 8, 387–440 RSC.
- F. Li, B. Liao, J. Shen, J. Ke, R. Zhang, Y. Wang and Y. Niu, Molecules, 2024, 29, 2447 CrossRef CAS PubMed.
- S. Krishnan, A. K. Gupta, M. K. Singh, N. Guha and D. K. Rai, Chem. Eng. J., 2022, 435, 135042 CrossRef CAS.
- M. Z. Iqbal and U. Aziz, J. Energy Storage, 2022, 46, 103823 CrossRef.
- H. Chen, X. Du, X. Liu, R. Wu, Y. Li and C. Xu, J. Energy Storage, 2022, 50, 104297 CrossRef.
- J. Sun, X. Tian, C. Xu and H. Chen, J. Materiomics, 2021, 7, 1358–1368 CrossRef.
- H. Chen, Y. Liu, R. Wu, X. Liu, Y. Liu and C. Xu, Int. J. Hydrogen Energy, 2022, 47, 15807–15819 CrossRef CAS.
- R. Wu, J. Sun, C. Xu and H. Chen, Sustainable Energy Fuels, 2021, 5, 4807–4829 RSC.
- J. Sun, X. Du, R. Wu, Y. Zhang, C. Xu and H. Chen, ACS Appl. Energy Mater., 2020, 3, 8026–8037 CrossRef CAS.
- C. Delmas, Adv. Energy Mater., 2018, 8, 1703137 CrossRef.
- X. Hu, M. Wang, R. Hu, L. Yang, Q. Li, Z. Yang, J. Yang, Q. Duan, J. Chen, B. Yu, B. Guo, Z. Ma, Y. Huang and X. Li, J. Energy Storage, 2024, 99, 113245 CrossRef.
- Z.-Y. Gu, X.-T. Wang, Y.-L. Heng, K.-Y. Zhang, H.-J. Liang, J.-L. Yang, E. H. Ang, P.-F. Wang, Y. You, F. Du and X.-L. Wu, Sci. Bull., 2023, 68, 2302–2306 CrossRef CAS PubMed.
- J.-L. Yang, X.-X. Zhao, W. Zhang, K. Ren, X.-X. Luo, J.-M. Cao, S.-H. Zheng, W.-L. Li and X.-L. Wu, Angew. Chem., 2023, 135, e202300258 CrossRef.
- J. Xiao, X. Li, K. Tang, D. Wang, M. Long, H. Gao, W. Chen, C. Liu, H. Liu and G. Wang, Mater. Chem. Front., 2021, 5, 3735–3764 RSC.
- H. Luan, W. Mao, Q. Wang, Z. Zhang, J. Peng and N. Peng, J. Alloys Compd., 2024, 1005, 176108 CrossRef CAS.
- J. Cattermull, M. Pasta and A. L. Goodwin, J. Am. Chem. Soc., 2023, 145, 24471–24475 CrossRef CAS PubMed.
- A. Kanwade, S. Gupta, A. Kankane, M. K. Tiwari, A. Srivastava, J. A. K. Satrughna, S. C. Yadav and P. M. Shirage, RSC Adv., 2022, 12, 24478–24479 RSC.
- T. Jin, H. Li, K. Zhu, P.-F. Wang, P. Liu and L. Jiao, Chem. Soc. Rev., 2020, 49, 2342–2377 RSC.
- Q. Liu, Z. Hu, M. Chen, C. Zou, H. Jin, S. Wang, S.-L. Chou, Y. Liu and S.-X. Dou, Adv. Funct. Mater., 2020, 30, 1909530 CrossRef CAS.
- J. Peng, W. Zhang, Q. Liu, J. Wang, S. Chou, H. Liu and S. Dou, Adv. Mater., 2022, 34, 2108384 CrossRef CAS PubMed.
- W. Wang, Y. Gang, Z. Hu, Z. Yan, W. Li, Y. Li, Q.-F. Gu, Z. Wang, S.-L. Chou, H.-K. Liu and S.-X. Dou, Nat. Commun., 2020, 11, 980 CrossRef CAS PubMed.
- Q. Xue, L. Li, Y. Huang, R. Huang, F. Wu and R. Chen, ACS Appl. Mater. Interfaces, 2019, 11, 22339–22345 CrossRef CAS PubMed.
- H. Fu, C. Liu, C. Zhang, W. Ma, K. Wang, Z. Li, X. Lu and G. Cao, J. Mater. Chem. A, 2017, 5, 9604–9610 RSC.
- J.-G. Wang, Z. Zhang, X. Zhang, X. Yin, X. Li, X. Liu, F. Kang and B. Wei, Nano Energy, 2017, 39, 647–653 CrossRef CAS.
- Z. Liang, F. Tian, G. Yang and C. Wang, Nat. Commun., 2023 DOI:10.1038/s41467-023-39385-6.
- T. Miao, J. Zhang, Y. Wang, K. Fang, Z. Wang, K. Zhan and B. Zhao, J. Colloid Interface Sci., 2023, 648, 768–777 CrossRef CAS PubMed.
- R. Bai, P. Chen, S. Zeng, Y. Zhou, W. Nie and Y. Xu, Int. J. Energy Res., 2021, 45, 14870–14878 CrossRef CAS.
- Y. Yuan, D. Bin, X. Dong, Y. Wang, C. Wang and Y. Xia, ACS Sustain. Chem. Eng., 2020, 8, 3655–3663 CrossRef CAS.
- Z. Shen, Y. Sun, J. Xie, S. Liu, D. Zhuang, G. Zhang, W. Zheng, G. Cao and X. Zhao, Inorg. Chem. Front., 2018 10.1039/C8QI00768C.
- B. Abdolahi, M. B. Gholivand, M. Shamsipur, A. (Arman) Taherpour, M. Mirzaei and A. H. Daramroudi, J. Energy Storage, 2023, 73, 109181 CrossRef.
- R. Kumar, E. Joanni, R. K. Singh, D. P. Singh and S. A. Moshkalev, Prog. Energy Combust. Sci., 2018, 67, 115–157 CrossRef.
- B. Abdolahi, M. B. Gholivand, M. Shamsipur and M. Amiri, J. Energy Storage, 2023, 62, 106906 CrossRef.
- H. Kumar, R. Sharma, A. Yadav and R. Kumari, J. Energy Storage, 2021, 33, 102032 CrossRef.
- T. Tene, S. Bellucci, M. Guevara, P. Romero, A. Guapi, L. Gahramanli, S. Straface, L. S. Caputi and C. Vacacela Gomez, Batteries, 2024, 10, 256 CrossRef CAS.
- M. K. Singh, N. Neha, K. Singh, S. Bhowmik, S. Gupta and D. K. Rai, Mater. Lett., 2024, 366, 136539 CrossRef CAS.
- S. Mishra, M. K. Singh, D. Pandey, D. K. Rai and A. Raghuvanshi, J. Mater. Chem. A, 2024, 12, 4534–4543 RSC.
- D. Liu, Y. Liu, X. Liu, C. Xu, J. Zhu and H. Chen, J. Energy Storage, 2022, 52, 105048 CrossRef.
- P. Bhatt, M. K. Sharma, M. D. Mukadam, S. S. Meena and S. M. Yusuf, Sustainable Mater. Technol., 2023, 35, e00532 CrossRef CAS.
- S. Sadhukhan, T. K. Ghosh, D. Rana, I. Roy, A. Bhattacharyya, G. Sarkar, M. Chakraborty and D. Chattopadhyay, Mater. Res. Bull., 2016, 79, 41–51 CrossRef CAS.
- M. Khairy, K. G. Mahmoud and H. M. El-Sagher, Int. J. Hydrogen Energy, 2023, 48, 29887–29897 CrossRef CAS.
- Y. Ma, Y. Hu, Y. Pramudya, T. Diemant, Q. Wang, D. Goonetilleke, Y. Tang, B. Zhou, H. Hahn, W. Wenzel, M. Fichtner, Y. Ma, B. Breitung and T. Brezesinski, Adv. Funct. Mater., 2022, 32, 2202372 CrossRef CAS.
- J. Wang, B. Wang, X. Liu, J. Bai, H. Wang and G. Wang, Chem. Eng. J., 2020, 382, 123050 CrossRef CAS.
- W. O. Silva, V. Costa Bassetto, D. Baster, M. Mensi, E. Oveisi and H. H. Girault, ACS Appl. Electron. Mater., 2020, 2, 927–935 CrossRef CAS.
- A. Cano, J. Rodríguez-Hernández, L. Reguera, E. Rodríguez-Castellón and E. Reguera, Eur. J. Inorg. Chem., 2019, 2019, 1724–1732 CrossRef CAS.
- M. T. U. Malik, A. Sarker, S. M. S. Mahmud Rahat and S. B. Shuchi, Mater. Today Commun., 2021, 28, 102685 CrossRef CAS.
- T. Yimtrakarn, Y.-A. Lo, J. Kongcharoenkitkul, J.-C. Lee and W. Kaveevivitchai, Chem.–Asian J., 2024, 19, e202301145 CrossRef CAS PubMed.
- Y. Xu, M. Ou, Y. Liu, J. Xu, X. Sun, C. Fang, Q. Li, J. Han and Y. Huang, Nano Energy, 2020, 67, 104250 CrossRef CAS.
- S. Li, P. Ge, F. Jiang, H. Shuai, W. Xu, Y. Jiang, Y. Zhang, J. Hu, H. Hou and X. Ji, Energy Storage Mater., 2019, 16, 267–280 CrossRef.
- Y. Su, S. Li, D. Wu, F. Zhang, H. Liang, P. Gao, C. Cheng and X. Feng, ACS Nano, 2012, 6, 8349–8356 CrossRef CAS PubMed.
- X. Lang, A. Hirata, T. Fujita and M. Chen, Nat. Nanotechnol., 2011, 6, 232–236 CrossRef CAS PubMed.
- L. Ren, J.-G. Wang, H. Liu, M. Shao and B. Wei, Electrochim. Acta, 2019, 321, 134671 CrossRef CAS.
Footnote |
| † Electronic supplementary information (ESI) available. See DOI: https://doi.org/10.1039/d4ta08419e |
| This journal is © The Royal Society of Chemistry 2025 |