
 Open Access Article
 This Open Access Article is licensed under a
 Creative Commons Attribution 3.0 Unported Licence
Zirconium fluoride-supported high-entropy fluoride: a catalyst for enhanced oxygen evolution reaction†
Christian
Heinekamp
 ab,
Arkendu
Roy
ab,
Stephanos
Karafiludis
ab,
Sourabh
Kumar
a,
Ana
Guilherme Buzanich
a,
Tomasz M.
Stawski
a,
Aistė
Miliūtė
ab,
Marcus
von der Au
a,
Mike
Ahrens
b,
Thomas
Braun
*b and
Franziska
Emmerling
*ab
ab,
Arkendu
Roy
ab,
Stephanos
Karafiludis
ab,
Sourabh
Kumar
a,
Ana
Guilherme Buzanich
a,
Tomasz M.
Stawski
a,
Aistė
Miliūtė
ab,
Marcus
von der Au
a,
Mike
Ahrens
b,
Thomas
Braun
*b and
Franziska
Emmerling
*ab
aDepartment Materials Chemistry, Federal Institute for Material Research and Testing, Richard-Willstätter-Straße 11, 12489 Berlin, Germany. E-mail: franziska.emmerling@bam.de
bInstitut für Chemie, Humboldt Universität zu Berlin, Brook-Taylor-Straße 2, 12489 Berlin, Germany. E-mail: thomas.braun@cms.hu-berlin.de
First published on 1st April 2025
Abstract
Extended hydrogen initiatives promote the urgency of research on water splitting technologies and, therein, oxygen evolution reaction catalysts being developed. A route to access a ZrF4 supported high-entropy fluoride catalyst using a facile sol–gel route is presented. The high-entropy character of the catalyst was confirmed by scanning transmission electron microscopy and energy dispersive X-ray spectroscopy (STEM-EDX) as well as inductively coupled plasma-mass spectrometry (ICP-MS). Additional investigations on the local structure were performed using extended X-ray absorption fine structure spectroscopy (EXAFS) and pair distribution function (PDF) analysis. The catalyst shows significant potential for oxygen evolution reaction (OER) in alkaline media with a current density of 100 mA cm−2 at approximately 1.60 V, thus outperforming benchmark materials such as IrO2, despite a significant reduction in electrochemical mass loading. A potential mechanism is suggested based on free energy calculation using DFT calculations.
Introduction
Climate change is accelerating, prompting a growing need for new energy sources and reduced dependence on fossil fuels.1,2 In response, many countries have implemented “hydrogen strategies” at the political level, which refers to strategies to implement hydrogen as a new fuel in energy and heat consuming processes.3 Alongside these efforts, research on water splitting technologies has intensified.4 Within this field, the development of stable and non-precious metal catalysts has become a major focus due to concerns about cost-efficiency and the limited supply of noble metals.5–7 This trend coincided with the discovery of high-entropy materials (HEMs) in 2004.8,9 These complex materials, composed of five or more elements in near-equimolar ratios, have attracted considerable interest in the search for water splitting catalysts.10 The high-entropy effect offers increased thermodynamic phase stability due to the mixture of elements. Additionally, the unique properties arising from the high-entropy effect in HEMs can enhance their catalytic activity compared to single-element catalysts. Furthermore, unlike noble metals, which are often scarce and expensive, HEMs can be composed of abundant elements, significantly reducing costs.11 Given these advantages, the potential of HEMs for various industrial applications is undeniable.12The main reasons for catalytic activity are due to the reduction of the activation energy of adsorption of reagents and stabilisation of intermediates.13 This becomes particularly relevant when more than one intermediate complicates the reaction mechanism. HEMs directly target these issues by the available high-entropy surface through the modified local structure.10,14 In the electrochemical water oxidation, the H2 production at the cathode is limited due to the “sluggish” kinetics at the anode for the oxygen evolution reaction (OER). Thus, improving this reaction side allows for a significant improvement in hydrogen production.15,16 Evidently, several types of HEM have proven to be of significant contribution to finding a suitable catalyst for OER. For example, Zhao et al. and Yu et al. have demonstrated the performance of high-entropy alloys supported on conducting MoC and Ni2P, respectively.17,18 Further examples of high-entropy layered hydroxides,19–21 -oxides,22–25 -ceramics26 and -metal organic frameworks27,28 have been investigated. In particular, Roy et al. were able to specifically reduce the amount of active metal sites in their catalyst (≈60% OER active metals), while maintaining a current density of 100 mA cm−2 at ≈1.64 VRHE.28 However, the field of high-entropy fluorides29,30 remains relatively unexplored.
Herein, we report on a two-step sol–gel route to access a high-entropy fluoride consisting of Mn, Fe, Co, Ni and Zn on a ZrF4-support (Fig. 1), which exhibits an overpotential of 317 mV and stability of 50 h at 10 mA cm−2. Furthermore, the content of elements involved in the catalysis is minimised to 8 wt% in the synthesised material. Detailed structural analysis, together with theoretical calculation, provided insight into active species and a potential reaction mechanism.
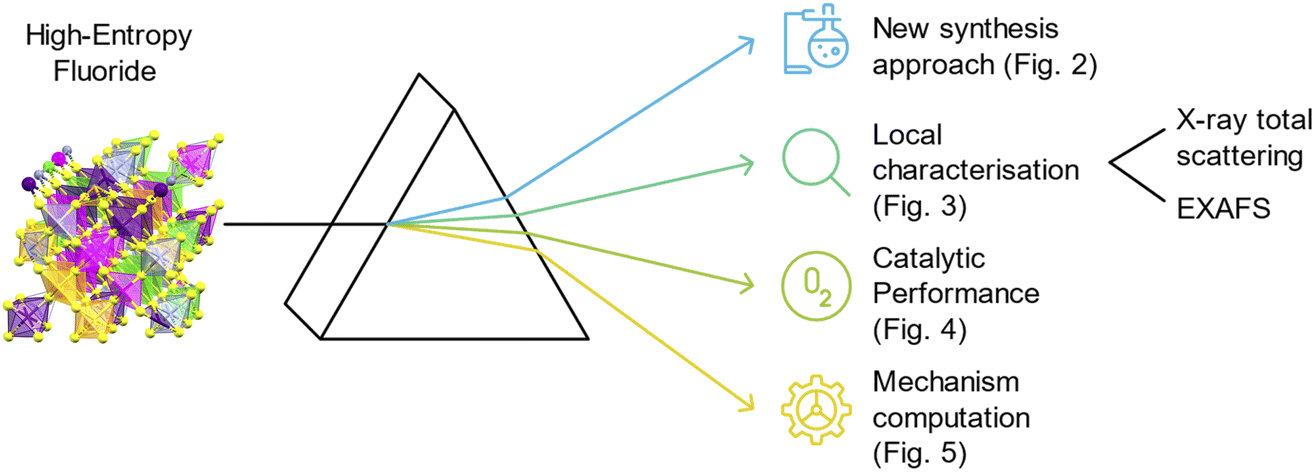 | ||
| Fig. 1 Schematic description of the presented high-entropy fluoride (Mn: violet, Fe: orange, Co: pink, Ni: green, Zn: grey, F: yellow) and the list of the performed synthesis and analysis in this work. It is also shown where the data is presented. | ||
Methods
The metal acetylacetonates (acac) Mn(acac)2 (prod. 245![[thin space (1/6-em)]](https://www.rsc.org/images/entities/char_2009.gif) 763), Fe(acac)3 (97%), Co(acac)2 (≥99%), and zinc acetate Zn(OAc)2 (99,99%) were purchased from Sigma-Aldrich. Ni(acac)2 (90–95%) was supplied from Fluka. Zr(acac)4 (98%+) was purchased from ChemPur. iPrOH (99.5%, extra pure) was supplied by Carl-Roth, distilled and stored over molecular sieves. Aqueous HF (28.7 M) solution was received from Solvay.
763), Fe(acac)3 (97%), Co(acac)2 (≥99%), and zinc acetate Zn(OAc)2 (99,99%) were purchased from Sigma-Aldrich. Ni(acac)2 (90–95%) was supplied from Fluka. Zr(acac)4 (98%+) was purchased from ChemPur. iPrOH (99.5%, extra pure) was supplied by Carl-Roth, distilled and stored over molecular sieves. Aqueous HF (28.7 M) solution was received from Solvay.
Preparation of the catalyst
1 g (0.75 eq.) of the Zr(acac)4 precursor was weighed in under atmospheric conditions and the reaction vessel was purged with Ar for 5 min before the procedure was continued. 100 mL of water free iPrOH were then added to the reagent. The mixture was refluxed for 1 h and allowed to cool down. Three equivalents of aq. HF (28.7mol L−1) were added, and a milky gel was formed, which was stirred for 15 min. In parallel, the other precursors (35 mg (0.05 eq.) Mn(acac)2, 49 mg (0.05 eq.) Fe(acac)3, 35 mg (0.05 eq.) Co(acac)2, 35 mg (0.05 eq.) Ni(acac)2 and 25 mg (0.05 eq.) Zn(OAc)2) were added in another vessel and also purged 5 min with Ar. 40 mL of water free iPrOH were added and the mixture was refluxed for 10 min to ensure that all reactants were dissolved. The solution was then transferred to the aged Zr gel under inert conditions. The mixture was again refluxed for 30 min to ensure homogeneity. Subsequently, 1.5 eq. aq. HF were added to the mixture. The solvent was removed under a vacuum after the mixture was aged overnight under vigorous stirring. The obtained pale pink product was stored under ambient conditions. Monometallic fluorides on the ZrF4-support were synthesised using the same procedure while maintaining the overall Zr to metal ratio at 75%:25%.
X-ray diffraction (XRD)
X-ray diffraction patterns were collected using Cu Kα radiation on a Bragg Brentano D8 Advanced diffractometer (Bruker AXS, Germany) equipped with a LYNXEYE XE-T detector. Samples were measured in reflection geometry in a 2θ range from 5° to 90° with a step size of 0.02° using a spinning setup.Transmission electron microscopy (TEM)
High-resolution transmission electron microscopy (HRTEM), high-angle annular dark-field scanning transmission electron microscopy (HAADF-STEM) and energy dispersive X-ray analysis (EDX) elemental mapping were performed on an FEI Talos F200S scanning/transmission electron microscope (S/TEM) at an acceleration voltage of 120 kV. Dry TEM grid preparation was used. Therefore, TEM grids were carefully swiped across the powder samples. The excess of powder on the grids was removed by tapping lightly.TGA/DSC
The TGA and DSC measurements were performed at a TGA/DSC 3+ from Mettler Toledo, Switzerland in Al crucibles. The samples were heated from 25 to 600 °C at a rate of 10 K min−1. The samples were then cooled down to 25 °C at the same rate.Infrared spectroscopy (IR)
The IR-spectra were recorded on a Bruker Vertex 70 spectrometer equipped with a Golden Gate diamond ATR (attenuated total reflectance) module.Extended X-ray absorption fine structure spectroscopy (EXAFS)
EXAFS measurements were performed at the BAMline at BESSY-II.31 The beam was monochromatized using a double crystal monochromator (DCM) installed at the beamline, with a resolution (ΔE/E) of about 2 × 10⁻⁴. The slits were adjusted to provide a 4 mm (H) × 1 mm (V) spot size. The measurements were performed at the Zr K-edge (17998 eV) in transmission mode. Optimal absorption was achieved by choice of the appropriate sample thickness, leading to an edge jump factor of about 2. This was achieved by diluting the powder samples with boron nitride (BN). Further measurements (at K-edges of Mn – 6539 eV, Fe – 7112 eV, Co – 7709 eV, Ni – 8330 eV, Zn – 9659 eV) were performed in fluorescence mode as the Zr content did not allow any X-ray transmission. The excitation energy was varied from −200 eV to −20 eV below the edge in 10 eV steps, from −20 eV below the edge and 200 eV above the edge in 1 eV steps (for Zr K-edge and in 0.25 eV steps for all others), and in the EXAFS region with a constant step in the k-space of 0.04 Å−1 until k = 16 Å. EXAFS data were processed by ATHENA and ARTEMIS.32 These GUIs programs belong to the main package IFEFFIT (v. 1.2.12).33 The AutoBK background subtraction procedure was used with the Rbkg parameter set to 1.0 Å and kw = 1. Afterwards, all spectra were normalized to the far post-edge region, free from absorption features. Regarding the EXAFS region, with ATHENA, one can plot χ(k) against R(Å), and the oscillations represent different frequencies, which correspond to the different distances for each coordination shell. Hence, Fourier transforms (FT) are necessary for the analysis process. The FT from the k-space to the R-space was performed with a Hanning-type window with a range of 1.5 Å to 12 Å and dk = 1. By analysing the signal in the frequency domain in ATHENA the window range was selected to exclude the noisy part of the signal.
Total scattering/pair distribution function analysis (PDF)
High-energy X-ray diffraction (HEXD) measurements were performed at the beamline ID15-A of the ESRF (France). The diffraction patterns were collected at 70 keV, corresponding to a wavelength of 0.1771203 Å. The 2D patterns were measured with a Pilatus3 X CdTe 2M detector in Debye–Scherrer geometry. The powder samples were measured in rotating capillaries using the standard ID15-A setup. The q-range was calibrated using a CeO2 standard. Dark current contributions were corrected automatically by the acquisition software. We obtained the atomic pair distribution functions (PDFs) from the diffraction patterns using the PDFgetX3 software,34 which was also used for the background and Compton scattering subtractions. Further analysis was performed in Python using a DiffPy library.35Computational methodologies
First-principles calculations are performed using the projector-augmented wave (PAW) method implemented in the Vienna Ab Initio Simulation Package (VASP).36,37 The Perdew–Burke–Ernzerhof (PBE) generalized gradient approximation (GGA) is used for exchange–correlation energy.38,39 A plane-wave cutoff energy of 500 eV is applied to truncate the wave functions. Structural relaxations are carried out using the conjugate gradient algorithm, with an energy convergence criterion of 10−6 eV for structural optimization and 10−8 eV for electronic structure and total energy calculations. The force convergence criterion is set at 10−2 eV Å−1 for individual atoms. The high-entropy fluoride (HEF) structure is modelled using the special quasi-random structure (SQS) generator code.40 The HEF structure is based on a rutile-type motif (MF2), with a unit cell comprising 40 metal (M) atoms and 80 fluorine (F) atoms, considering the (001) surface. A vacuum region exceeding 15 Å is included to prevent interactions between periodic images. The free energy change ΔG for an electrochemical reaction is calculated using the following expression:| ΔG = ΔEDFT + TΔS + ΔEZPE + ΔGU |
Electrochemical measurements
Electrodes for electrochemical measurements were prepared by drop-casting a catalyst-ink containing the respective materials containing powders on a carbon paper electrode. Typically, the catalyst ink was prepared with 5 mg of the catalyst and 1 mg of volcan carbon black in 980 μl water/ethanol (1:1) with 20 μl 5 wt% Nafion solution, followed by sonication in an ultra-sonic water bath for 1 h. The electrochemical measurements were performed using Hg/HgO reference electrode and Pt counter electrode in an H-cell set-up in 1 mol L−1 NaOH electrolyte solution. The linear sweep voltammetry (LSV) measurements were performed at a scan rate of 5 mV s−1. Ohmic losses in the electrochemical measurements were corrected by subtraction of the ohmic drop from the measured electrolyte resistance, which is determined by high frequency alternating current impedance, where 85% iR corrected potentials are denoted as E (V). All measured potentials were converted to values relative to an RHE according to the equation: E (V) = Eref + E (ref vs. RHE), with E (ref vs. RHE) the potential difference between the reference electrode and RHE.
The chronopotentiometry was performed in the identical setup at 10 mA cm−2.
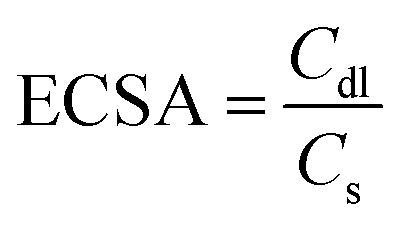
The electrochemical active surface area (ECSA) was obtained by measuring the double-layer charging current (ic) resulting from scan-rates (ν) dependent CVs at non-faradic potential (0.02–0.08 mV vs. Hg/HgO) and determining the Cdl. Cs corresponds to the specific capacitance value of 12.16 mF cm−2.46 The average of the positive and the negative slopes was taken.
| ic = Cdl × v |
Electrochemical impedance spectroscopy (EIS) measurements were made in the frequency ranges from 105 to 1 Hz at 1.55 V vs. RHE.
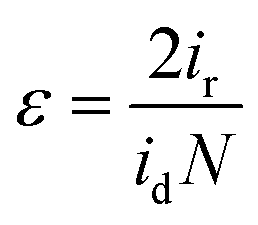
The faradaic efficiency ε was determined using a Rotating Ring-Disk electrode setup at a rotational speed of 1600 rpm. The cell was first purged with N2 until saturation was achieved. The disk and the Pt-ring current were integrated over 5 min, respectively. Together with the collection efficiency (0.19), the efficiency was calculated using the following equation, where we followed the previous procedure by McCrory et al.47
The produced O2 was calculated by the following equation, where Q is the transferred charge, z is the number of electrons needed and F is the Faraday constant:

ICP-MS analysis
Consumables (50 mL tubes, pipette tips) were cleaned with diluted double sub-boiled nitric acid (w = approx. 3%) prior to analysis. Type I reagent-grade water (18.2 MΩ cm, HQ-water) was obtained from a Milli-Q Integral water purification system (Merck-Millipore, Darmstadt, Germany). Analytical reagent-grade nitric acid (w = 65%, Merck, Darmstadt, Germany) was purified by double sub-boiling using a sub-boiling distillation system.Approx. 20 mg of the sample was dissolved in a mixture of 2 mL of double sub-boiled nitric acid (w = 65%) and 200 μl sub-boiled hydrofluoric acid (w = 40%, Merck, Darmstadt, Germany). The digest was diluted with HQ-water to a final volume of 50 mL. ICP-MS measurements of the sample were performed in triplicates after the dilution by a factor of 1000 with diluted nitric acid (w = 2%). Multi-elemental analyses (incl. Mg, Cr, Fe, Mn, Co, Ni, Cu, Zn and Zr) of the diluted HEF-samples were performed using an ICP-MS (ICAP-Q, Thermo Scientific, Bremen, Germany). The ICP-MS instrument was optimised in STD-mode in a daily routine using a tuning solution (Thermo Scientific) to obtain maximum signal intensity while maintaining high stability, low oxide and double-charged rates.
General instrumental settings for the multi-elemental measurements are described in ESI Table 1.†
The multi-elemental quantification of the diluted HEF-samples was accomplished by external calibration (4-point calibration ranging for Mg, Cr, Fe, Mn, Co, Ni, Cu and Zn and Zr from 5 μg L−1 to 50 μg L−1 and for Zr from 50 μg L−1 to 500 μg L−1) with standards prepared volumetrically from a multielement stock solution (ICP multielement standard Merck IV, 23 Elements in nitric acid 1000 mg L−1) and a zirconium single element standard (Certipur, 1000 mg L−1, Merck, Darmstadt, Germany) including 1 μg L−1 yttrium (prepared from an Y stock solution 1000 mg L−1, Merck, Darmstadt, Germany) as internal normalisation standard. Furthermore, the performance of the multi-elemental analysis was monitored with in-house quality control solution (incl. Mg, Cr, Fe, Mn, Co, Ni, Cu and Zn and Zr) prepared in HNO3 (w = 2%).
Results and discussion
A nanocrystalline high-entropy fluoride (M = Mn, Fe, Co, Ni, Zn) on a zirconium fluoride support was synthesised using an adapted strategy for xerogel synthesis previously described for other metal fluorides.48,49 In the first step, the support was synthesised by adding three equivalents of an aqueous HF solution to a solution of zirconium acetylacetonate (Zr(acac)4) in dry isopropanol forming a mostly amorphous material, although a small broad reflection is observed in the PXRD that could not be attributed to any known Zr fluoride or oxide phase (see ESI†). In the second step, after gelation a warm solution of the other metal precursors also in dry isopropanol was added to the gel and additional HF in a water solution was added after homogenisation (Fig. 2A). The mixture was homogenised by reheating the solution for 10 min. After subsequent gelation the solvent was removed. In this synthesis, the acac-ligand is protonated by the added HF and the H2O in a competitive manner, as it has been described in detail for similar sol–gel routes to obtain the respective metal fluorides.48,50 The polymeric behaviour of the fluoride allows for bridging between the ZrF4 support and the HE metal fluoride surface. | ||
| Fig. 2 Structural and compositional analysis of the HEF. (A) Scheme of the experimental procedure for the synthesis. The reaction scheme can be found in the ESI.† (B) HAADF image of a representative HEF particle and elemental mapping by scanning transmission electron microscopy (STEM) energy dispersive X-ray spectroscopy (EDX) elemental mapping of six different metals (Zr, Mn, Co, Fe, Ni, Zn). (C) Powder X-ray diffractograms of the HEF@ZrF4 and the ZrF4 and ZnF2 (rutile type) calculated patterns. (D) Showing the distribution and normalised atomic percentage of the five different metals in the high-entropy entity along the black line drawn on the particle in (B). The Zr representation is normalised to the sum of the HEF contribution and the Zr based support. | ||
Structural characterisation
The elemental homogeneity of the material was confirmed by elemental STEM mappings (Fig. 2B and D), which show a close to equimolar distribution of Mn, Fe, Co, Ni and Zn on the particles. This is consistent with the ICP MS findings (see ESI†). The PXRD pattern obtained for the prepared HEF displays a two-phase system, where the higher crystalline phase can be assigned to ZrF4 while the second phase indicates a nanocrystalline entity of the respective rutile-type metal fluorides (MF2). The use of a Fe3+ precursor is likely to introduce additional bias due to the different structure of the corresponding fluoride, resulting in a broader and less defined PXRD pattern.51 In addition, the low content of elements forming this phase makes it difficult to analyse the structure by PXRD alone. TEM and selected area electron diffraction (SAED, see ESI†) confirmed the interplanar distances observed in the PXRD pattern (Fig. 2C), which also indicates the presence of the (110) planes of ZrF4 and the rutile MF2. Therefore, EXAFS measurements were performed to better understand the local structure. Here, the presence of Fe(III) was confirmed by the absorption edge at 7127 eV (Fig. 3). The small pre-peak at 7115 eV has also been reported for octahedral FeF3 species.52 The first coordination sphere appears more distorted compared to the single metal counterpart or the reagent Fe(acac)3 as the magnitude of χ(R) is broadened and lower in magnitude (see ESI-Fig. 11†). Nevertheless, an octahedral FeF3 coordination could be confirmed (Fig. 3B bottom left, see ESI Table S8†).53 For Co and Zn, the expected respective oxidation state +II was also confirmed by the edges at 7719 eV and 9665 eV, respectively. A small contribution of Co(III) could be identified only for Co, as indicated by a second maximum at 7725 eV in the derivative of the absorption spectrum. However, the combined Co entities exhibit an octahedral metal(II)F2, similar to rutile-type metal fluorides (Fig. 3, see ESI Table S9†).54 The present pre-peak at 7709 eV reported for CoF2 (ref. 55) indicates distorted centrosymmetry, as discussed by de Groot.56 The EXAFS suggests a more warped environment with a lower coordination number for the Ni sites. Therefore, a model with reduced degeneracy of the fluorine atoms resulted in a corresponding lower amplitude of the fit. The corresponding Ni–F distances were not affected by this aspect. Nevertheless, this suggests a distorted and potentially undercoordinated nickel fluoride environment (see ESI Table S5†). Mn sites represent a more complex case with respect to its oxidation state, as Mn has several different stable states available in fluorides57 as well as in oxides. The XANES data reveal a mixture of two oxidation states. Mn(II) was identified by an edge at 6545 eV, whereas a second Mn species assigned to 6553 eV is present. The comparison to Mn2O3 and MnO2 suggests an oxidation state of +III (Fig. 3B) as a MnF4 coordination would shift the absorption edge to higher energies than MnO2. Hence, we attribute the value at 6553 eV to an additional Mn(III) fluoride species in the material. A small pre-peak can be identified at 6540 eV, similar to what was observed for Mn(II) and Mn(III) in minerals.58 Despite the different oxidation states present in the sample, the octahedral coordination sphere of MnF2 is confirmed by the model used in the EXAFS fit. The radial distribution of the elements did not reveal additional information about further coordination distances around the respective absorbing elements that could directly be attributed to another specific element (Fig. 3B). This observation is expected in an HE material where the second coordination sphere metal distance is broadened due to the random composition. Fitting of the Zr K-edge data revealed the expected eightfold fluorine coordination of the Zr.59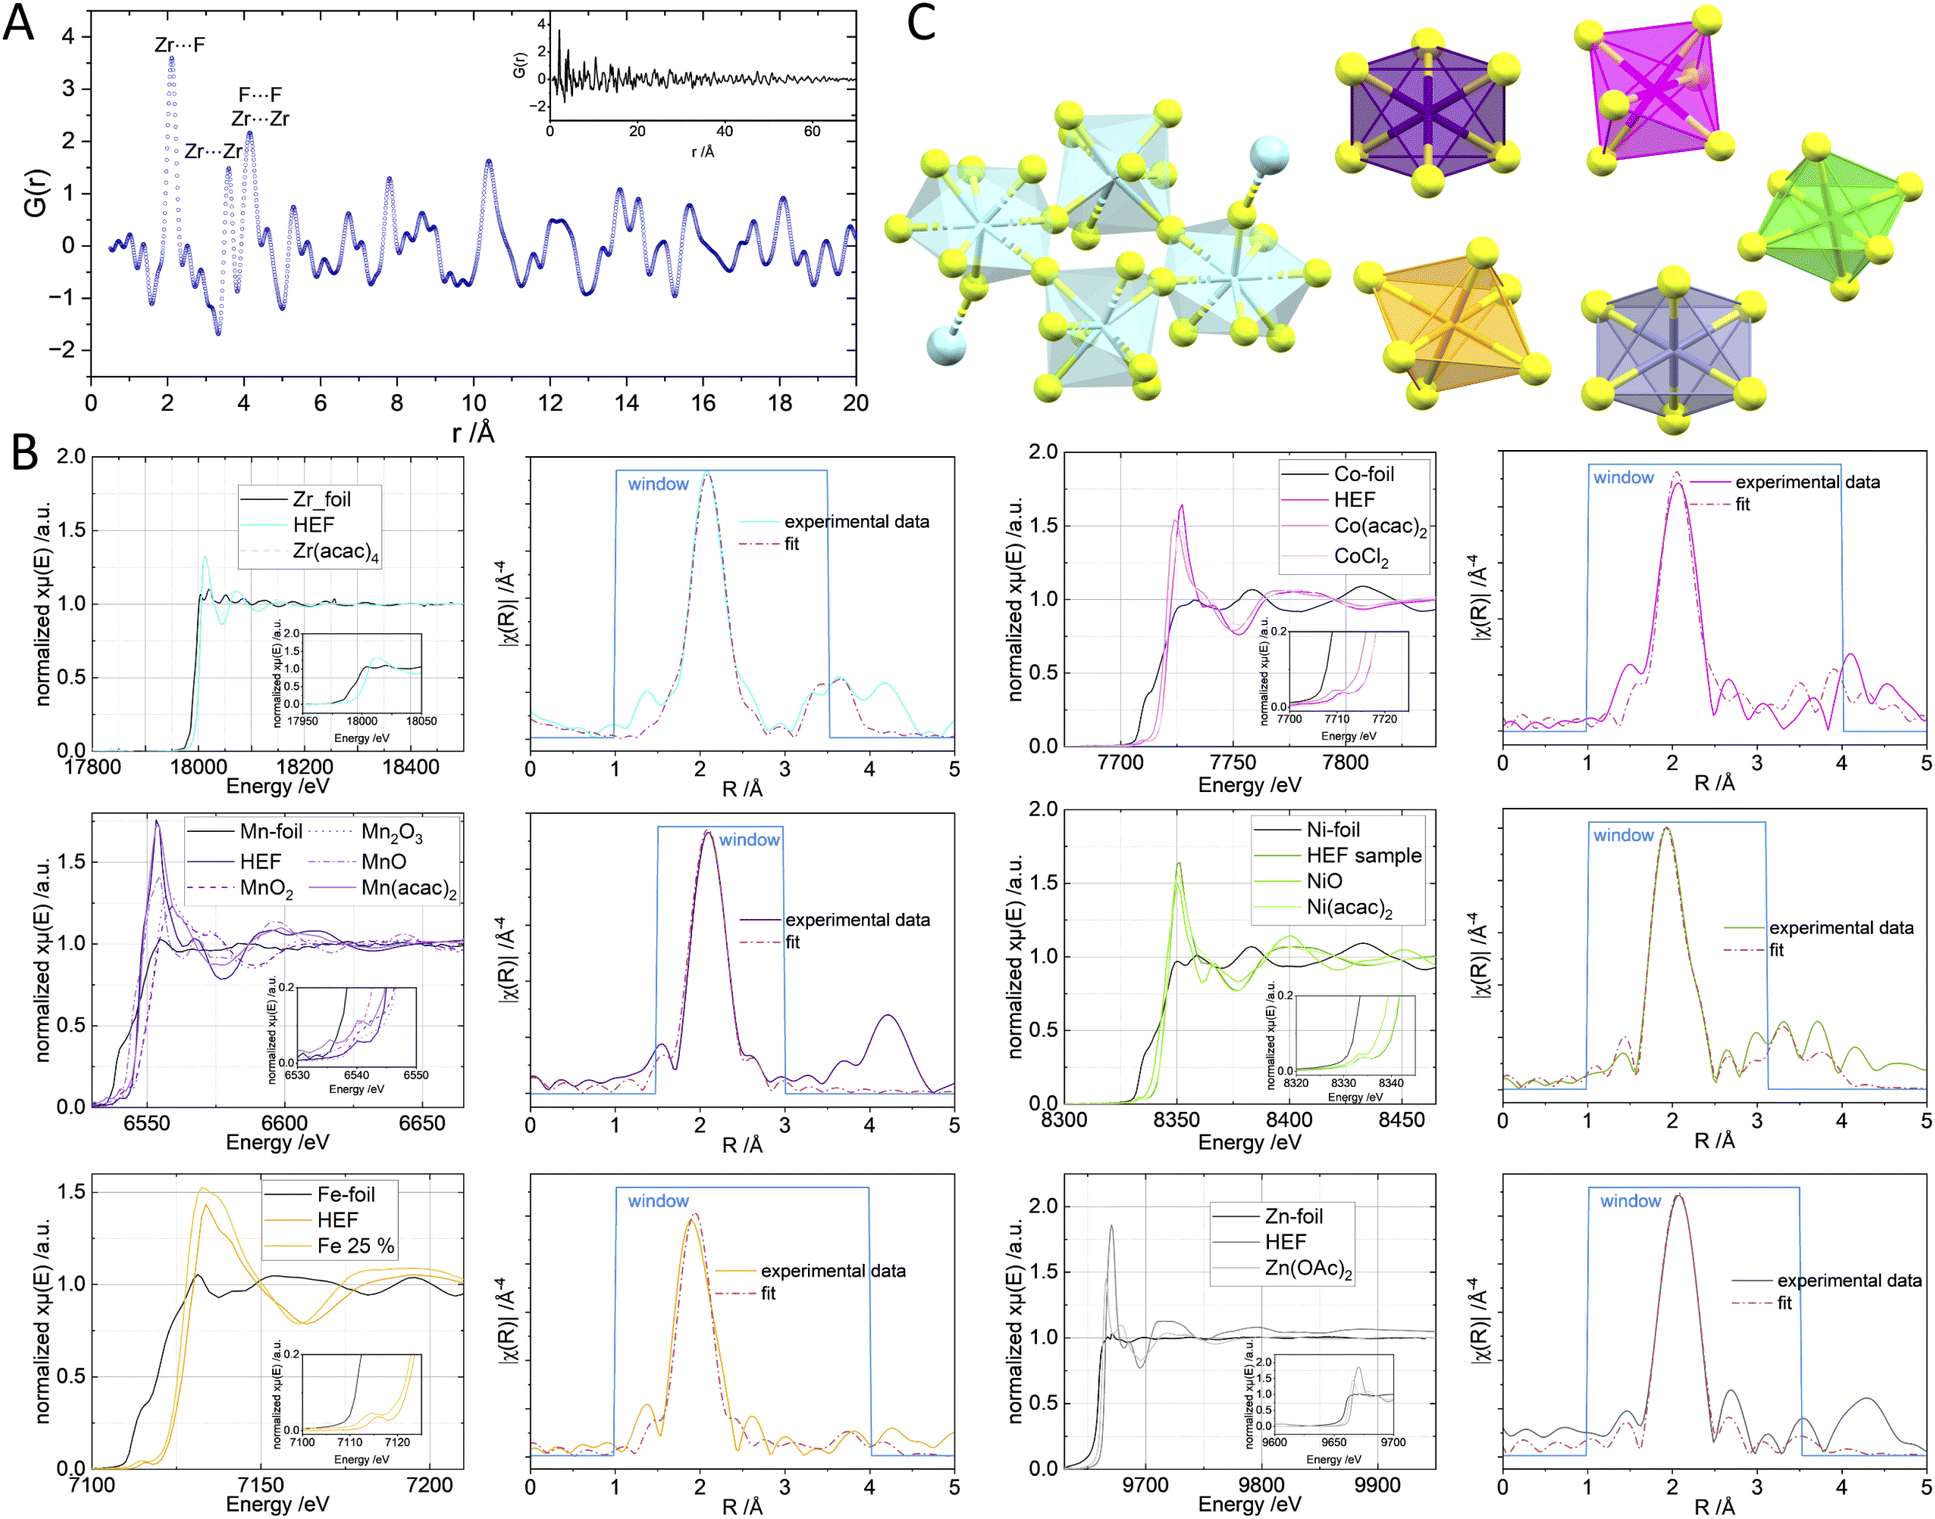 | ||
| Fig. 3 (A) G(r) of the HEF and selected attributed distances of ZrF4 in the close environment. The reciprocal data is presented in the ESI.† (B) The normalised K-edge spectra of the six metals including appropriate reference samples. The inlet shows a zoom on the respective edge step or the present pre-peak feature. The spectra are also shown in the ESI.† The magnitude plots of the χ(R) and the fits of the respective metal(II) fluoride are shown next to the respective K-edge spectrum. In case of Fe the Fe(III) was taken as fitting model. The Zr data was fitted against a ZrF4 model. The obtained R values are listed in ESI Table 2.† (C) Structural models of the respective confirmed structural motifs in the ZrF4 and the HEF entities. | ||
In order to generate a more than atomistic model using experimental data, total scattering experiments were performed. Attempts to fit a combined model of ZrF4 and the HE-phase using the total scattering data were unsuccessful because the material's small crystallite size and amorphous fraction made establishing a suitable model difficult. Therefore, the G(r) was investigated qualitatively by comparing the dominant distances to the dominant ZrF4 bulk phase (Fig. 3A). Here, the Zr⋯F distance could be attributed similarly to the EXAFS fit at approx. 2.1 Å. The next closer distances at 3.56 and 4.16 Å can be attributed equally to Zr⋯Zr and F⋯F distances, whereas the partial contribution cannot be determined. Furthermore, the PDF data revealed that the highest contribution of the PDF can be found at about 70 Å in accordance with the TEM data (see ESI†), suggesting only very small single crystallites of ZrF4 in the particles.
As mentioned above, the characterisation of the high entropy material proved to be difficult due to its complex composition. Therefore, the single metal derivatives were also synthesised. Examination of the XRD data obtained (see ESI†) revealed some differences. While the single metal Fe-containing sample shows the previously reported structure of a ZrF4−x(OH,F)x Xerogel49 (see ESI†), the single metal Co, Mn and Zn-containing samples are similar to each other except that Co and Mn also exhibit a ZrF4·H2O phase. This can be due to the use of aq. HF solution in the synthesis, although such difference is rather unexpected due to the identical treatment during the synthetic procedure.
Electrochemical OER performance
The obtained high-entropy material was evaluated in a three-electrode cell containing a 1 mol L−1 NaOH solution at a low scan rate of 5 mV s−1. The electrodes were prepared by depositing a homogeneous ink of the materials on an electrochemically inert carbon paper. This allowed the intrinsic activity of the catalysts to be studied instead of using conductive materials such as Ni foams. The HEF on the ZrF4 support exhibits higher activity (1.60 VRHE @ 100 mA) than the typical benchmark material IrO2 (1.67 VRHE @ 100 mA). The electrochemical surface area (ECSA) was calculated to be 0.15 cm−2 after estimating the double layer capacitance from the slope in the plot of current density versus the scan rate (Fig. 4E and F). By normalising the geometrical current density by the ECSA one would therefore obtain a specific activity of 66 mA cm−2, emphasising the significant activity of the material. The electrochemical impedance spectroscopy (EIS; Nyquist plot) of the HEF material is presented in Fig. 4D and was obtained at 1.3 and 1.55 V vs. RHE. The data was fitted with a pseudo Randles circuit, resulting in a charge transfer resistance of 4.784 Ω. The comparison to recent developments in the field of high-entropy catalysts elaborates on the performance of the ZrF4 supported material. For instance, aluminium based high-entropy oxides Al1−x(FeCuNiCo)xO (350 mV @ 10 mA cm−2),60 high-entropy perovskite fluorides (315 mV @ 10 mA cm−2)61 as well as relatively newly reported high entropy molybdates (318 mV @ 10 mA cm−2)62 are outperformed. The previously mentioned supported high-entropy alloy supported on MoC shows higher activity (232 mV @ 10 mA cm−2)18 compared to our catalyst. It should be noted that their support is conductive, which affects the current density, and that we significantly reduce the number of catalytically active metal sites in our material while maintaining competitive activity. This is revealed by the calculation of the mass activity of the catalyst to be 80 mA mg−1 at 1.6 V, outperforming the IrO2 benchmark at only 56 mA mg−1. For the control study respective to the enhancement through the compositional complexity, single metal derivatives were investigated. The Mn, Fe, Zn single metal derivatives of the support material (Fig. 4A, see ESI†) exhibit poorer performance. In particular, only the Co and Ni containing single metal derivatives show any significant activity in the investigated OER (Fig. 4A). An equal physical mixture of all single metallic ZrF4 supported materials was also tested as an OER catalyst (see ESI-Fig. 2†). The mixture did not exceed the Co and Ni catalysts, confirming the superior nature of the HEF. This is likely due to the so-called “cocktail effect”, which describes the random distribution of the active elements nurturing the activity of the overall material.63,64 To test whether the complex composition of the catalyst could be simplified to the indicated main catalytic sites originating from Ni and Co a bimetallic fluoride was synthesised. The combination of Ni and Co in one material did not improve the catalytic performance compared to the single metal derivatives (Fig. 4A). However, in subsequent tests the stability of the HE-catalyst was also demonstrated for 50 h (Fig. 4C). | ||
| Fig. 4 (A) Linear sweep voltammetry (LSV) of the HEF (blue), the Ni (green) and Co (pink) single metallic derivatives, the Ni–Co bimetallic compound (brown) and an IrO2 (grey) reference measurement on conductive carbon paper. (B) Tafel slope plot of the in A presented samples in their respective colours. (C) Chronopotentiometry stability test of the HEF for 50 h. (D) Electrochemical impedance spectroscopy (EIS) Nyquist plot of the HEF material for OER by fixing a constant potential (above the overpotential) at 1.55 V (red) and 1.6 V (grey) vs. RHE. The corresponding circuit is drawn for representation. (E) Cyclic voltammetry (CV) results in the non-faradaic potential region at scan rate varying from 2 mV s−1 to 10 mV s−1. (F) Current vs. scan rate plot for obtaining the double capacitance. | ||
Another parameter that is not consistently reported is the faradaic efficiency, which indicates how effectively the electrons are being used to produce O2. Our system has an efficiency of 0.98, which is remarkable. The corresponding data is shown in the ESI.† Nevertheless, the calculated O2 produced is about 0.057 mmol. The discrepancy with the theoretical value of 0.080 mmol of O2 produced can be explained by the saturation of O2 in the electrolyte, which reduces the oxygen reaching the ring electrode and, thus, the detected O2. In addition, other diffusion effects may affect the detected oxygen by reducing the ring electrode current, although the collection efficiency should compensate for these effects. Although the catalyst shows the stability shown, a small amount of Zr, Zn and Co could be detected in the electrolyte. The other elements could not be determined, but were also detected. This is most likely due to the decomposition of the carbon paper electrode material (see ESI†).
To understand the role of the high-entropy matrix on electrocatalysis, we constructed a free energy diagram to study the OER energetics of the HEF sample, considering possible adsorbate evolution mechanisms. Similarly, to investigate the kinetics of OER, we calculated a Tafel slope of ≈45 mV dec−1 for the HEF matrix (Fig. 4B). Based on previous observations of monometallic MF2 samples, we considered Co and Ni to be catalytically more active for OER. Other metals such as Mn, Fe, and Zn modify the electronic environment of Co and Ni and stabilize the MF2 matrix, inducing synergistic effects that ultimately enhance catalyst performance. In the HEF matrix, the stability of the M2+/M3+ redox pair is dynamic, and the M3+ oxidation state is easily accessible to Co in a highly alkaline solution compared to Ni. Fig. 5C and D illustrate the free energy diagrams based on DFT calculations, comparing the energetics of OER between Co and Ni. The deprotonation of Ni2+(H2O) to Ni3+(OH) species occurs at approximately ≈1.21 VDFT,RHE, which is about 0.45 VDFT,RHE higher than the Co2+(H2O)/Co3+(OH) pair. This suggests further deprotonation of hydroxide species is easily feasible, which may lead to different catalytic sites on the HEF surface with increasing electrode potentials. Our investigations support that at a higher potential, reaching a catalytic cycle between the formal Ni3+/Ni4+ pair is equally feasible. Here, we have constructed free energy diagrams specifically for the formal Ni2+,3+/Ni4+ and Co3+/Co4+ pairs.
 | ||
| Fig. 5 Reaction-mechanism of OER on HEF-surface: (A and B) proposed adsorbate evolution mechanism for Co (pink) and Ni (green) involving the formation of *OOH species as a rate-determining step via *O–O coupling from *Ni–O and *Co–(O)(OH) species. “H” and “L” represent suggested oxidation states for metal ions that could be accessible in higher and lower potential regimes (VRHE) to derive the kinetics of reactions. (C and D) Free energy diagrams for possible OER active metals (Co and Ni) under consideration, at thermodynamic potential (1.23 VRHE) and the potential considered for the calculation of experimental Tafel slope (≈1.50 VRHE). | ||
Examining the free energy diagram for Co and Ni at 1.23 VDFT,RHE reveals two uphill reactions. Our ab initio simulations confirm that the HEF surface is predominantly covered with *OH or *O species at around 1.50 VDFT,RHE. According to the conventional adsorbate evolution mechanism, *O–O coupling (peroxide formation) is the most crucial step in OER energetics. For Ni, the reaction proceeds via forming a peroxo species from *Ni–O to *Ni–OOH. In contrast, the formation of oxo/hydroxyl species from *Co–O to *Co–(O)(OH) is more favored for Co. According to the free energy diagram, the H-3 (Fig. 5) formation is the rate-determining step (RDS), leading to the formation of *M–(OOH)(*/OH) species. The same RDS is observed for Ni and Co on the HEF surface.
To correlate the observed kinetics—specifically the Tafel slope—with the proposed OER mechanism at the experimental potential of ≈1.50 VDFT,RHE, we consider several assumptions: prior to the RDS, all reactions are in quasi-equilibrium; all OER active species participate in driving the reactions; and after the RDS, reactions only modify the current/overpotential curve.
The Tafel slope (b)65 is related to the transfer coefficient (α) by the expression

For Co, considering the formation of *Co–(OH)(OOH) as the RDS from *Co–(O)(OH) requires only one electron transfer at the RDS (nr = 1). Assuming that all the reactions proceed via concerted electron transfer processes, we calculated a Tafel slope of approximately ≈120 mV dec−1. Similarly, for Ni, considering the formation of *Ni–(OOH) requires two concerted electron transfer reactions:
Assigning np = 1 and nr = 1 (α = 1.5) results in a calculated Tafel slope of approximately ≈40 mV dec−1. This emphasizes that the initial kinetics of OER could be triggered by the *Ni species at the HEF surface. However, the kinetics of OER are mainly affected by the local environment of the metal, which is modified by the formation of the high-entropy matrix. This synergistic behavior may lead to more complex intermediates and kinetics. Integrating data from operando spectroscopy with ab initio calculations in future work has the potential to provide deeper mechanistic insights into HEFs, which could lead to the advancement of OER catalysis.
Conclusions
In conclusion, this study introduces a novel zirconium fluoride supported high-entropy fluoride (HEF) synthesized via a simple sol–gel method. The combination of detailed characterization and ab initio calculations provides crucial insights into the material's structure, composition, and catalytic mechanisms. Based on the combined investigations from XRD, ICP-MS and EDX-STEM studies the homogeneity of the HEF sample is shown. The identification of the local structure of the HEF compounds was probed by EXAFS and PDF analysis.Despite its low content of electrochemically active elements, the HEF demonstrates exceptional catalytic performance for the oxygen evolution reaction (100 mA cm−2 at 1.60 VRHE), outperforming the benchmark IrO2 catalyst in terms of overpotential and current density (100 mA cm−2 at 1.67 VRHE).
Ab initio simulations reveal various potential intermediates involved in OER catalysis, highlighting Ni and Co sites as the OER active species. This comprehensive approach, integrating experimental and theoretical methods, provides the necessary knowledge to optimize these materials for future applications, paving the way for efficient, durable, and cost-effective alternatives to noble metal-based catalysts in electrochemical technologies specifically H2 production.
Data availability
The data supporting this article have been included as part of the ESI.†Author contributions
CH performed synthesis, characterisation and wrote the original draft. CH and AR conducted electrocatalysis experiments. CH, SK and AGB conducted the XAS measurements and jointly analysed the obtained data. SKu conducted the theoretical calculations. SK, AM and TMS performed the PDF experiment. TMS and CH performed the analysis. MvA performed the ICP-MS analysis. MA, TB and FE supervised the work. All authors contributed to the manuscript and edited it.Conflicts of interest
There are no conflicts to declare.Acknowledgements
We thank Ian Pedraza Ramirez for the synthesis of the bimetallic Ni–Co-derivative of the catalyst. Leandro Augusto Faustino is appreciated for scientific discussions and help in the determination of produced O2. We thank Jörg Radnik and Emil Fuhry for fruitful scientific discussions. The authors thank Nicole Langhammer for additional ICP experiments on the electrolyte. XAS experiments were performed at the BAMline at the BESSY-II storage ring (Helmholtz Centre Berlin). We thank the Helmholtz-Zentrum Berlin für Materialien und Energie for the allocation of synchrotron radiation beamtime. The X-ray total scattering experiment was performed at ESRF under the proposal (Ref. No. 95886). We acknowledge financial support from the CRC 1349 “Fluorine Specific Interactions” funded by the German Research Foundation (project number 387284271) and from the School of Analytical Sciences Adlershof (SALSA).Notes and references
- Intergovernmental Panel On Climate Change (Ipcc), Climate Change 2021 – The Physical Science Basis: Working Group I Contribution to the Sixth Assessment Report of the Intergovernmental Panel on Climate Change, Cambridge University Press, 1st edn, 2023 Search PubMed.
- Intergovernmental Panel On Climate Change (Ipcc), Climate Change 2022 – Impacts, Adaptation and Vulnerability: Working Group II Contribution to the Sixth Assessment Report of the Intergovernmental Panel on Climate Change, Cambridge University Press, 1st edn, 2023 Search PubMed.
- Global Hydrogen Review 2023, IEA, Paris, 2023 Search PubMed.
- L. Sun, Q. Luo, Z. Dai and F. Ma, Coord. Chem. Rev., 2021, 444, 214049 CrossRef CAS.
- S. M. Jowitt, G. M. Mudd and J. F. H. Thompson, Commun. Earth Environ., 2020, 1, 13 CrossRef.
- A. Zupanc, J. Install, M. Jereb and T. Repo, Angew. Chem., Int. Ed., 2023, 62, e202214453 CrossRef CAS PubMed.
- J. Newbold, J. Cleaner Prod., 2006, 14, 248–261 CrossRef.
- B. Cantor, I. T. H. Chang, P. Knight and A. J. B. Vincent, Mater. Sci. Eng., A, 2004, 375–377, 213–218 Search PubMed.
- J. W. Yeh, S. K. Chen, S. J. Lin, J. Y. Gan, T. S. Chin, T. T. Shun, C. H. Tsau and S. Y. Chang, Adv. Eng. Mater., 2004, 6, 299–303 Search PubMed.
- Y. Sun and S. Dai, Sci. Adv., 2021, 7, eabg1600 CrossRef CAS PubMed.
- H. Kamaruddin, Z. Jianghong, L. Yu, W. Yuefan and H. Yizhong, J. Mater. Chem. A, 2024, 12, 9933–9961 RSC.
- A. Amiri and R. Shahbazian-Yassar, J. Mater. Chem. A, 2021, 9, 782–823 RSC.
- E. Roduner, Chem. Soc. Rev., 2014, 43, 8226–8239 Search PubMed.
- J. Åqvist, M. Kazemi, G. V. Isaksen and B. O. Brandsdal, Acc. Chem. Res., 2017, 50, 199–207 CrossRef PubMed.
- J. Song, C. Wei, Z.-F. Huang, C. Liu, L. Zeng, X. Wang and Z. J. Xu, Chem. Soc. Rev., 2020, 49, 2196–2214 RSC.
- S. Z. Oener, A. Bergmann and B. R. Cuenya, Nat. Synth., 2023, 2, 817–827 CrossRef CAS.
- H. Yu, W. Chen, Z. Liu and C. Du, Colloids Surf., A, 2024, 686, 133354 CrossRef CAS.
- J. Zhao, C. Zhang, Z. Zhang, Q. Qi, Y. Zhang and J. Hu, Appl. Catal., A, 2024, 681, 119780 CrossRef CAS.
- Y. Ding, Z. Wang, Z. Liang, X. Sun, Z. Sun, Y. Zhao, J. Liu, C. Wang, Z. Zeng, L. Fu, M. Zeng and L. Tang, Adv. Mater., 2023, 2302860 CrossRef PubMed.
- T. X. Nguyen, C.-C. Tsai, V. T. Nguyen, Y.-J. Huang, Y.-H. Su, S.-Y. Li, R.-K. Xie, Y.-J. Lin, J.-F. Lee and J.-M. Ting, Chem. Eng. J., 2023, 466, 143352 CrossRef CAS.
- H. Wu, J. Zhang, Q. Lu, Y. Li, R. Jiang, Y. Liu, X. Zheng, N. Zhao, J. Li, Y. Deng and W. Hu, ACS Appl. Mater. Interfaces, 2023, 15, 38423–38432 CrossRef CAS PubMed.
- Y. Lin, W. Xu, Z. Gao, Y. Liang, H. Jiang, Z. Li, S. Wu, Z. Cui, H. Sun, H. Zhang and S. Zhu, Chem. Eng. J., 2024, 489, 151233 CrossRef CAS.
- B. L. Božiček, J. Hreščak, M. Kušter, J. Kovač, I. Naglič, B. Markoli, B. Š. Batič, M. Šala, S. Drev, Ž. Marinko, M. Čeh and B. A. Marinho, J. Mater. Sci., 2024, 59, 9189–9207 CrossRef.
- S. Praveen Kumar, P. C. Sharafudeen and P. Elumalai, Int. J. Hydrogen Energy, 2023, 48, 38156–38171 CrossRef CAS.
- Y. Gu, A. Bao, X. Wang, Y. Chen, L. Dong, X. Liu, H. Pan, Y. Li and X. Qi, Nanoscale, 2022, 14, 515–524 RSC.
- A. Bao, J. Wu, Y. Zhang, X. Wang, X. Zhang, Y. Gu and X. Qi, J. Mater. Res. Technol., 2023, 23, 1312–1320 Search PubMed.
- S. Xu, M. Li, H. Wang, Y. Sun, W. Liu, J. Duan and S. Chen, J. Phys. Chem. C, 2022, 126, 14094–14102 CrossRef CAS.
- A. Roy, S. Kumar, A. Guilherme Buzanich, C. Prinz, E. Götz, A. Retzmann, T. Hickel, B. Bhattacharya and F. Emmerling, Adv. Mater., 2024, 2408114 CrossRef CAS PubMed.
- P. A. Sukkurji, Y. Cui, S. Lee, K. Wang, R. Azmi, A. Sarkar, S. Indris, S. S. Bhattacharya, R. Kruk, H. Hahn, Q. Wang, M. Botros and B. Breitung, J. Mater. Chem. A, 2021, 9, 8998–9009 Search PubMed.
- P. Yang, Y. An, C. Feng, Y. Liu, S. Liu, L. Gao, Y. Zhou, X. Li, P. Li and F. Zeng, Int. J. Hydrogen Energy, 2024, 51, 1218–1228 CrossRef CAS.
- A. Guilherme Buzanich, M. Radtke, K. V. Yusenko, T. M. Stawski, A. Kulow, C. T. Cakir, B. Röder, C. Naese, R. Britzke, M. Sintschuk and F. Emmerling, J. Chem. Phys., 2023, 158, 244202 CrossRef CAS PubMed.
- B. Ravel and M. Newville, J. Synchrotron Radiat., 2005, 12, 537–541 CrossRef CAS PubMed.
- M. Newville, J. Synchrotron Radiat., 2001, 8, 322–324 CrossRef CAS PubMed.
- P. Juhás, T. Davis, C. L. Farrow and S. J. L. Billinge, J. Appl. Crystallogr., 2013, 46, 560–566 CrossRef.
- P. Juhás, C. L. Farrow, X. Yang, K. R. Knox and S. J. L. Billinge, Acta Crystallogr., Sect. A:Found. Adv., 2015, 71, 562–568 CrossRef PubMed.
- G. Kresse and J. Hafner, Phys. Rev. B:Condens. Matter Mater. Phys., 1993, 47, 558 CrossRef CAS PubMed.
- G. Kresse and J. Hafner, Phys. Rev. B:Condens. Matter Mater. Phys., 1994, 49, 14251 CrossRef CAS PubMed.
- J. P. Perdew, K. Burke and M. Ernzerhof, Phys. Rev. Lett., 1996, 77, 3865 CrossRef CAS PubMed.
- J. P. Perdew, K. Burke and M. Ernzerhof, Phys. Rev. Lett., 1997, 78, 1396 CrossRef CAS.
- D. Gehringer, M. Friák and D. Holec, Comput. Phys. Commun., 2023, 286, 108664 CrossRef CAS.
- J. K. Nørskov, F. Studt, F. Abild-Pedersen and T. Bligaard, Fundamental Concepts in Heterogeneous Catalysis, Wiley, 1st edn, 2014 Search PubMed.
- I. C. Man, H. Su, F. Calle-Vallejo, H. A. Hansen, J. I. Martínez, N. G. Inoglu, J. Kitchin, T. F. Jaramillo, J. K. Nørskov and J. Rossmeisl, ChemCatChem, 2011, 3, 1159–1165 CrossRef CAS.
- Handbook of Materials Modeling: Applications: Current and Emerging Materials, ed. W. Andreoni and S. Yip, Springer International Publishing, Cham, 2020 Search PubMed.
- J. Rossmeisl, Z.-W. Qu, H. Zhu, G.-J. Kroes and J. K. Nørskov, J. Electroanal. Chem., 2007, 607, 83–89 CrossRef CAS.
- J. K. Nørskov, J. Rossmeisl, A. Logadottir, L. Lindqvist, J. R. Kitchin, T. Bligaard and H. Jónsson, J. Phys. Chem. B, 2004, 108, 17886–17892 CrossRef PubMed.
- R. Yadav, P. H. Maheshwari, P. Dubey and J. S. Tawale, Diamond Relat. Mater., 2024, 149, 111589 CrossRef CAS.
- C. C. L. McCrory, S. Jung, J. C. Peters and T. F. Jaramillo, J. Am. Chem. Soc., 2013, 135, 16977–16987 CrossRef CAS PubMed.
- C. P. Marshall, G. Scholz, T. Braun and E. Kemnitz, Dalton Trans., 2019, 48, 6834–6845 Search PubMed.
- C. Heinekamp, S. Kneiske, A. Guilherme Buzanich, M. Ahrens, T. Braun and F. Emmerling, Catal. Sci. Technol., 2024, 14, 673–680 RSC.
- E. Kemnitz, U. Gross, S. Rudiger and C. S. Shekar, Angew. Chem., Int. Ed., 2003, 42, 4251–4254 CrossRef CAS PubMed.
- J.-E. Jørgensen and R. I. Smith, Acta Crystallogr., Sect. B:Struct. Sci., 2006, 62, 987–992 CrossRef PubMed.
- A. Kuzmin and P. Parent, J. Phys.: Condens. Matter, 1994, 6, 4395–4404 CrossRef CAS.
- M. Leblanc, J. Pannetier, G. Férey and R. de Pape, Rev. Chim. Miner., 1985 DOI:10.1002/chin.198536015.
- W. H. Baur, Acta Crystallogr., 1958, 11, 488–490 CrossRef CAS.
- J. P. Krogman, J. R. Gallagher, G. Zhang, A. S. Hock, J. T. Miller and C. M. Thomas, Dalton Trans., 2014, 43, 13852 RSC.
- F. De Groot, Chem. Rev., 2001, 101, 1779–1808 CrossRef CAS PubMed.
- T. C. Ehlert and M. Hsia, J. Fluorine Chem., 1972, 2, 33–51 CrossRef CAS.
- E. Chalmin, F. Farges and G. E. Brown, Contrib. Mineral. Petrol., 2009, 157, 111–126 CrossRef CAS.
- J.-P. Laval, Acta Crystallogr., Sect. C:Struct. Chem., 2014, 70, 742–748 CrossRef CAS PubMed.
- M. Asim, A. Hussain, S. Kanwal, A. Ahmad, Y. Aykut, A. Bayrakçeken and N. K. Janjua, Mater. Adv., 2024, 5(21), 8490–8509 RSC.
- T. Wang, H. Chen, Z. Yang, J. Liang and S. Dai, J. Am. Chem. Soc., 2020, 142, 4550–4554 CrossRef CAS.
- H. K. Beere, P. Kulkarni, U. N. Maiti, R. G. Balakrishna, P. Mukherjee, H. Y. Jung, K. Samanta and D. Ghosh, Sustainable Energy Fuels, 2023, 7, 4303–4316 RSC.
- X. Zhao, H. Cheng, X. Chen, Q. Zhang, C. Li, J. Xie, N. Marinkovic, L. Ma, J.-C. Zheng and K. Sasaki, J. Am. Chem. Soc., 2024, 146, 3010–3022 CrossRef CAS PubMed.
- D. B. Miracle and O. N. Senkov, Acta Mater., 2017, 122, 448–511 CrossRef CAS.
- J. O. Bockris and A. K. N. Reddy,Modern Electrochemistry: an Introduction to an Interdisciplinary Area Volume 1, Springer US, Boston, MA, 1970 Search PubMed.
Footnote |
| † Electronic supplementary information (ESI) available. See DOI: https://doi.org/10.1039/d4ta08664c |
| This journal is © The Royal Society of Chemistry 2025 |