
 Open Access Article
 This Open Access Article is licensed under a
 Creative Commons Attribution 3.0 Unported Licence
Enhanced capacity of aluminum-ion batteries by adjusting the average pore size of the porous carbon cathode†
Yifeng Chen a,
Hiroo Suzukia,
Shu Fukumotoa,
Chiyu Nakanob,
Takeshi Nishikawaa,
Shigeyuki Umezawac and
Yasuhiko Hayashi*a
a,
Hiroo Suzukia,
Shu Fukumotoa,
Chiyu Nakanob,
Takeshi Nishikawaa,
Shigeyuki Umezawac and
Yasuhiko Hayashi*a
aGraduate School of Environmental, Life, Natural Science, and Technology, Okayama University, Okayama 700-8530, Japan. E-mail: hayashi.yasuhiko@okayama-u.ac.jp
bDepartment of Comprehensive Technical Solutions, Okayama University, Okayama 700-8530, Japan
cSeiwa Electric Mfg. Co., Ltd, Kyoto 610-0192, Japan
First published on 12th February 2025
Abstract
Lithium-ion batteries (LIBs) are widely used but with the increasing scarcity and uneven distribution of global lithium resources, there is a need to explore alternative battery technologies. Due to its abundance, low cost, and high theoretical capacity, aluminum is a strong candidate for metal anodes, making aluminum-ion batteries (AIBs) an area of considerable interest. Current mainstream research focuses on ionic liquid electrolytes, which offer a wide electrochemical window and high ionic conductivity. Carbon materials are ideal cathode candidates due to their low cost, abundance, and high voltage platform. AIBs using carbon materials typically exhibit low discharge capacity. This study addressed the challenge of improving the discharge capacity of carbon-based cathodes in AIBs. By using porous carbon (PC) materials with varying specific surface areas, average pore sizes, and total pore volumes as cathodes, average pore size was found to impact capacity. This contradicts the contention that larger specific surface areas result in higher capacities. There is a key difference in ion behavior: whereas aluminum chloride ions intercalate into layered graphite structures, they do not intercalate into PC materials but are adsorbed to the surface. By adjusting the average pore size, it is possible to increase the discharge capacity of AIBs, challenging the traditional emphasis on specific surface area. This research does not fully solve the problem of low discharge capacity in carbon-based cathodes, but provides a new perspective on the role of pore size in enhancing battery performance, offering valuable insights for future electrode design.
1 Introduction
With the rapid advancement of portable electronic devices, energy storage systems, and electric vehicles, the demand for secondary batteries in the market is increasing, along with the need for optimal performance.1,2 Lithium-ion batteries (LIBs) have become the most commercially successful and widely-used energy storage devices due to their unique advantages.3 However, in recent years, the rising prices of materials, such as lithium iron phosphate and ternary lithium, have driven up the costs of LIBs. Moreover, the lack of safety improvements has severely constrained their large-scale commercial application. As a result, the research focus has shifted to alternative types of metal-ion batteries, such as sodium-ion batteries (SIBs), potassium-ion batteries (PIBs), magnesium-ion batteries (MIBs), zinc-ion batteries (ZIBs), calcium-ion batteries (CIBs), and aluminum-ion batteries (AIBs). These offer benefits like low-cost manufacturing, safety, easy recyclability, and minimal environmental impact.4–9 AIBs, which use metallic aluminum as the counter electrode and aluminum salt ionic liquid (IL) as the electrolyte, represent a new class of electrochemical energy storage devices.10–12 However, the development of AIBs is primarily constrained by the electrochemical performance of their cathode materials, such as low capacity and poor cycling stability, which severely limits their further advancement and potential for practical applications. Therefore, the design and synthesis of cathode materials with high capacity and excellent cycling stability has become a top priority in current AIB research.Currently, the cathode materials used in AIBs include carbon materials, metal oxides, transition metal chalcogenides, and metal–organic frameworks.13–16 Of these, carbon materials have been widely used as cathodes in AIBs due to their abundance, structural diversity, and tunable redox properties, and they have demonstrated excellent electrochemical performance. Carbon materials used in AIBs include graphite, graphene, carbon nanotubes (CNT), and porous carbon (PC).17–20 PC materials are particularly notable for their porosity, diverse morphology, and ease of preparation. Stadie et al. achieved an extraordinary energy density of 64 W h kg−1 at 30 W h L−1 using high specific surface area and dense carbon as cathode materials.21 Due to their high specific surface area and abundant pore structure, ordered mesoporous carbons (OMC) are widely used in energy storage. By utilizing commercially-available mesoporous carbon frameworks (CMK-3), a long cycle life of over 36![[thin space (1/6-em)]](https://www.rsc.org/images/entities/char_2009.gif) 000 cycles with efficiency exceeding 97% can be achieved.22 Compared to other carbon materials, the structurally-stable CMK-8 framework exhibits superior capacity (100.5 mA h g−1 at 300 mA g−1) and higher rate performance (30.5 mA h g−1 at 5 A g−1).23 Xu et al. reported a nitrogen-doped, three-dimensional, porous carbon material (N-3PC) with tunable porosity and disordered structure.24 The pore size and specific surface area of the composite were adjusted by the formation of zinc nitrate as a precursor, resulting in a capacity of 13 mA h g−1 at 2 A g−1. The study on N-3PC indicates that nitrogen doping and microstructure are two critical factors influencing the electrochemical properties of carbon-based materials in AIBs.
000 cycles with efficiency exceeding 97% can be achieved.22 Compared to other carbon materials, the structurally-stable CMK-8 framework exhibits superior capacity (100.5 mA h g−1 at 300 mA g−1) and higher rate performance (30.5 mA h g−1 at 5 A g−1).23 Xu et al. reported a nitrogen-doped, three-dimensional, porous carbon material (N-3PC) with tunable porosity and disordered structure.24 The pore size and specific surface area of the composite were adjusted by the formation of zinc nitrate as a precursor, resulting in a capacity of 13 mA h g−1 at 2 A g−1. The study on N-3PC indicates that nitrogen doping and microstructure are two critical factors influencing the electrochemical properties of carbon-based materials in AIBs.
Thanwisai et al. prepared a highly-porous activated carbon material from coconut shell-derived biomass.25 Their research suggests that the primary mechanism of this material is surface-induced capacitive behavior, which is closely related to specific surface area, mesopores, and defect concentration. Mesopore-dominated carbon exhibits higher specific capacity and better rate performance than micropore-dominated carbon, while also demonstrating excellent cycling stability over 1500 cycles. Therefore, the electrochemical performance of carbon-based cathode materials can be substantially enhanced by strategies such as morphology control and structural adjustment.
The primary hypothesis of this study is that optimizing the pore size of PC cathodes can substantially enhance the adsorption and diffusion of AlCl4− ions, thus improving the capacity of AIBs. This hypothesis challenges the conventional focus on maximizing specific surface area alone by emphasizing the critical role of moderate pore sizes in facilitating ion transport and storage. Previous studies have largely overlooked the interplay between pore size and diffusion resistance. The current study aims to address this and provide insights for optimizing large-scale energy storage systems, portable electronic devices, and other applications requiring sustainable and efficient energy solutions.
2 Results and discussion
2.1 Structural characterization
To date, many studies have focused on AIBs with graphite electrodes, but the evaluation of battery performance using high specific-surface-area carbon materials has rarely been reported. To investigate this, various carbon materials with different pore sizes were prepared (PC1–PC7) and the impact of pore characteristics on battery performance was investigated (Table 1). The porosity characteristics of PC1–7 were characterized by low-temperature nitrogen adsorption. The adsorption isotherms of PC1–7 did not align with the x-axis, indicating significant N2 adsorption capacity and suggesting well-developed pore structures (Fig. 1a). The adsorption isotherms of PC1, PC2, PC3, and PC4 all displayed a typical type I pattern with similar shapes. When the relative pressure (P/P0) was below 0.1, the N2 adsorption capacity of PC1 and PC2 increased rapidly, which can be attributed to micropore filling, and a saturation point was rapidly approached. This indicates that the micropores had been filled and almost no further adsorption occurred. For PC3 and PC4, the N2 adsorption capacity also increased rapidly when the relative pressure (P/P0) was below 0.1, but they gradually approached saturation point, suggesting the presence of a considerable amount of small-sized mesopores. In contrast, the adsorption isotherms of PC5, PC6, and PC7 exhibited a type IV pattern, with a noticeable hysteresis loop observed at relative pressures P/P0 between 0.4 and 0.9. This suggests that these samples contained not only a small amount of micropores (<2 nm) but also a substantial amount of mesopores (2–50 nm).26 The sharp rise in the adsorption isotherms at P/P0 > 0.9 indicated the presence of macropores in the PC5 and PC6 materials.27 The pore size distribution curves of PC1 to PC7 are shown in Fig. 1b, with PC1 to PC7 exhibiting pore sizes primarily within the range of 1–2 nm (micropores) and 2–50 nm (mesopores). Table 1 summarizes the porosity parameters of these materials.| Sample | Specific surface area (m2 g−1) | Average pore width (nm) | Total pore volume (cm3 g−1) |
|---|---|---|---|
| PC1 | 1616 | 1.09 | 0.76 |
| PC2 | 2266 | 1.09 | 1.00 |
| PC3 | 2514 | 2.60 | 1.41 |
| PC4 | 3299 | 2.48 | 1.71 |
| PC5 | 709 | 19.6 | 2.59 |
| PC6 | 1031 | 8.45 | 2.34 |
| PC7 | 1500 | 4.43 | 1.95 |
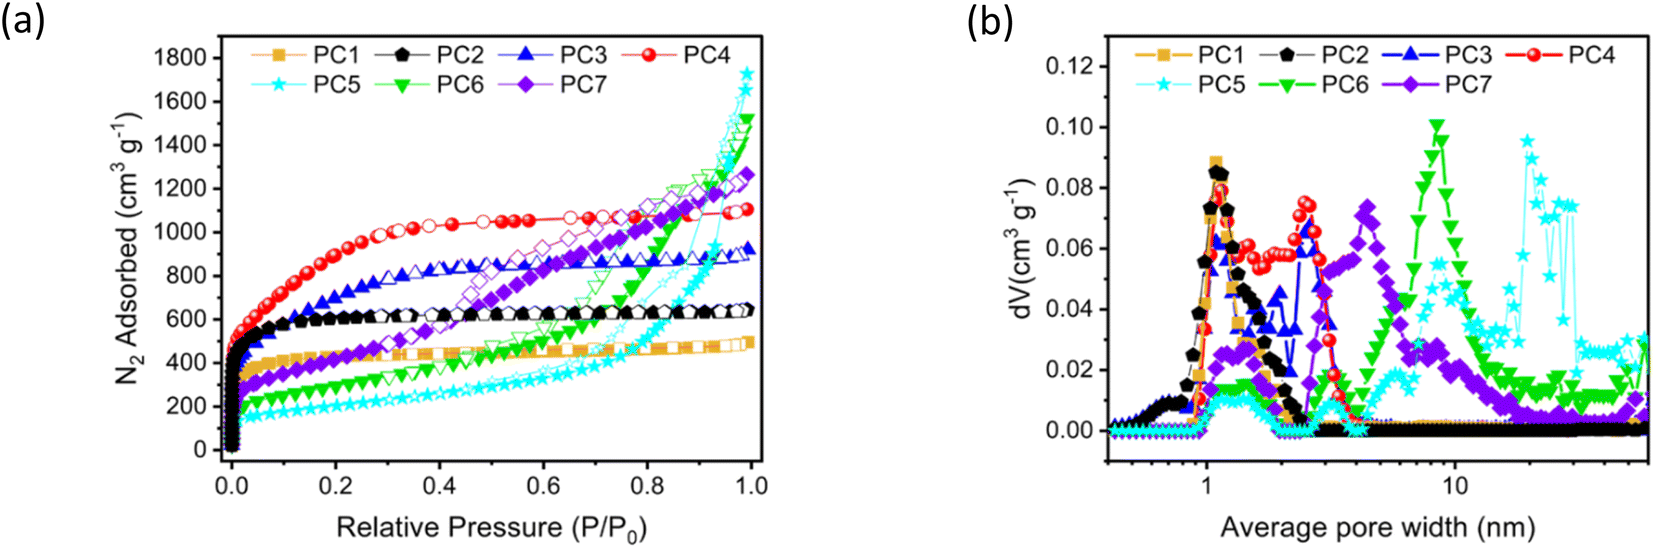 | ||
| Fig. 1 Nitrogen adsorption–desorption isotherms (a) and pore size distribution curves (b) for porous carbon materials PC1, PC2, PC3, PC4, PC6, and PC7. PC1 (YP50F), PC2 (MSP-20), PC3 (MSA-20), PC4 (MSC-30), PC5 (CNovel 20 nm), PC6 (CNovel MJ4 010-00), and PC7 (CNovel MH-00). | ||
The structure and degree of graphitization of PC1, PC2, PC3, PC4, PC5, PC6, and PC7 were further characterized using Raman spectroscopy (Fig. S1–S7†). All samples exhibited prominent D bands, indicating a high level of defects in these PC materials,28 providing abundant active sites for ion adsorption.29,30 The Raman spectroscopy results indicate that, due to the structure and crystallinity of graphite, all samples exhibit the identical intensity of D and G bands. As a result, there was no marked difference in the distribution of adsorption sites among the samples. Fig. S8–S14† present the field emission scanning electron microscopy (FE-SEM) images of PC1 to PC7; the observed pore sizes were consistent with the nitrogen adsorption–desorption results.
2.2 Electrochemical performance
An amount of 3 mL of N-methyl-2-pyrrolidone (NMP) was added to 75 mg of polyvinylidene fluoride (PVDF), and the mixture was sonicated for 30 min to fully dissolve the PVDF in NMP (Fig. 2). Then, 2–5 mL of NMP (depending on the specific PC) was added to 600 mg of PC and 75 mg of acetylene black (AB), and the mixture was sonicated for 30 min to achieve dispersion. Subsequently, the PVDF solution was poured into the PC/AB mixture and stirred magnetically at 25 °C for 12 h to form the electrode slurry. The resulting slurry was coated onto a tungsten substrate, air-dried at 25 °C for 12 h, then vacuum-dried at 25 °C for 12 h, and finally dried in vacuum at 120 °C for 12 h to prepare the PC cathode.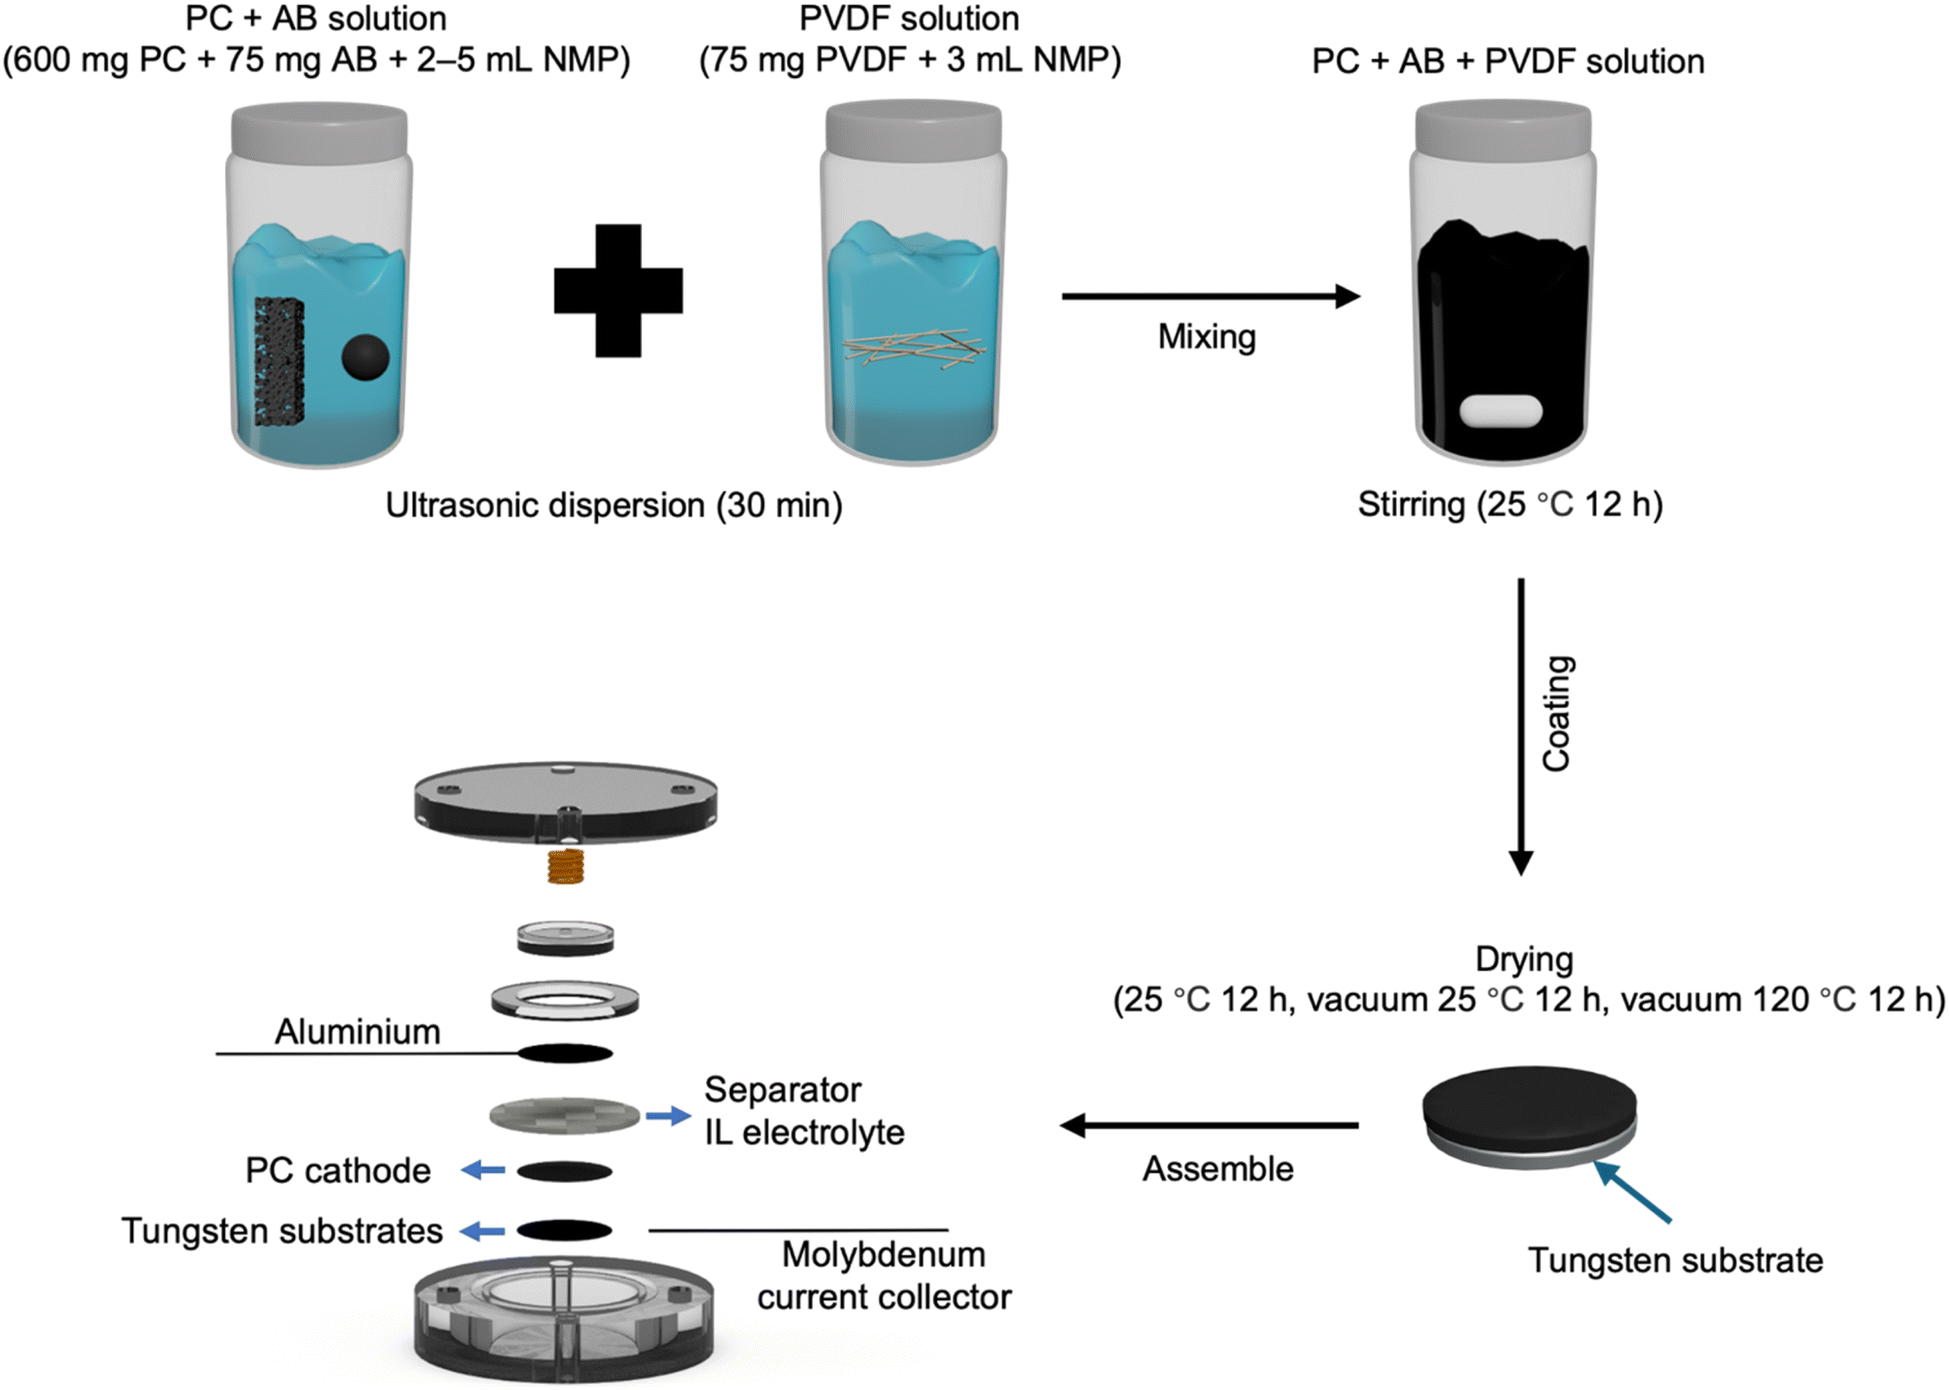 | ||
| Fig. 2 Preparation of cathodes and assembly of porous carbon/aluminium polytetrafluoroethylene cell. PC, porous carbon; AB, acetylene black; PVDF, polyvinylidene fluoride; NMP, of N-methyl-2-pyrrolidone; IL, ionic liquid. | ||
Building on an aluminum anode, its practical application in coin-type cells was investigated by coupling it with the fabricated PC cathodes. The assembly of the coin cell is shown in Fig. 2. After cell assembly, the batteries were activated by running 10 cycles at a current density of 0.05 A g−1. Fig. 3a shows the comparison of the discharge capacities at the 10th cycle for PC1–7 at a current density of 0.10 A g−1 with the respective specific surface area and pore structure characteristics. The discharge capacities for PC1–7 at the 10th cycle were 44.48, 9.48, 103.66, 137.81, 70.79, 118.81, and 128.79 mA h g−1, respectively.
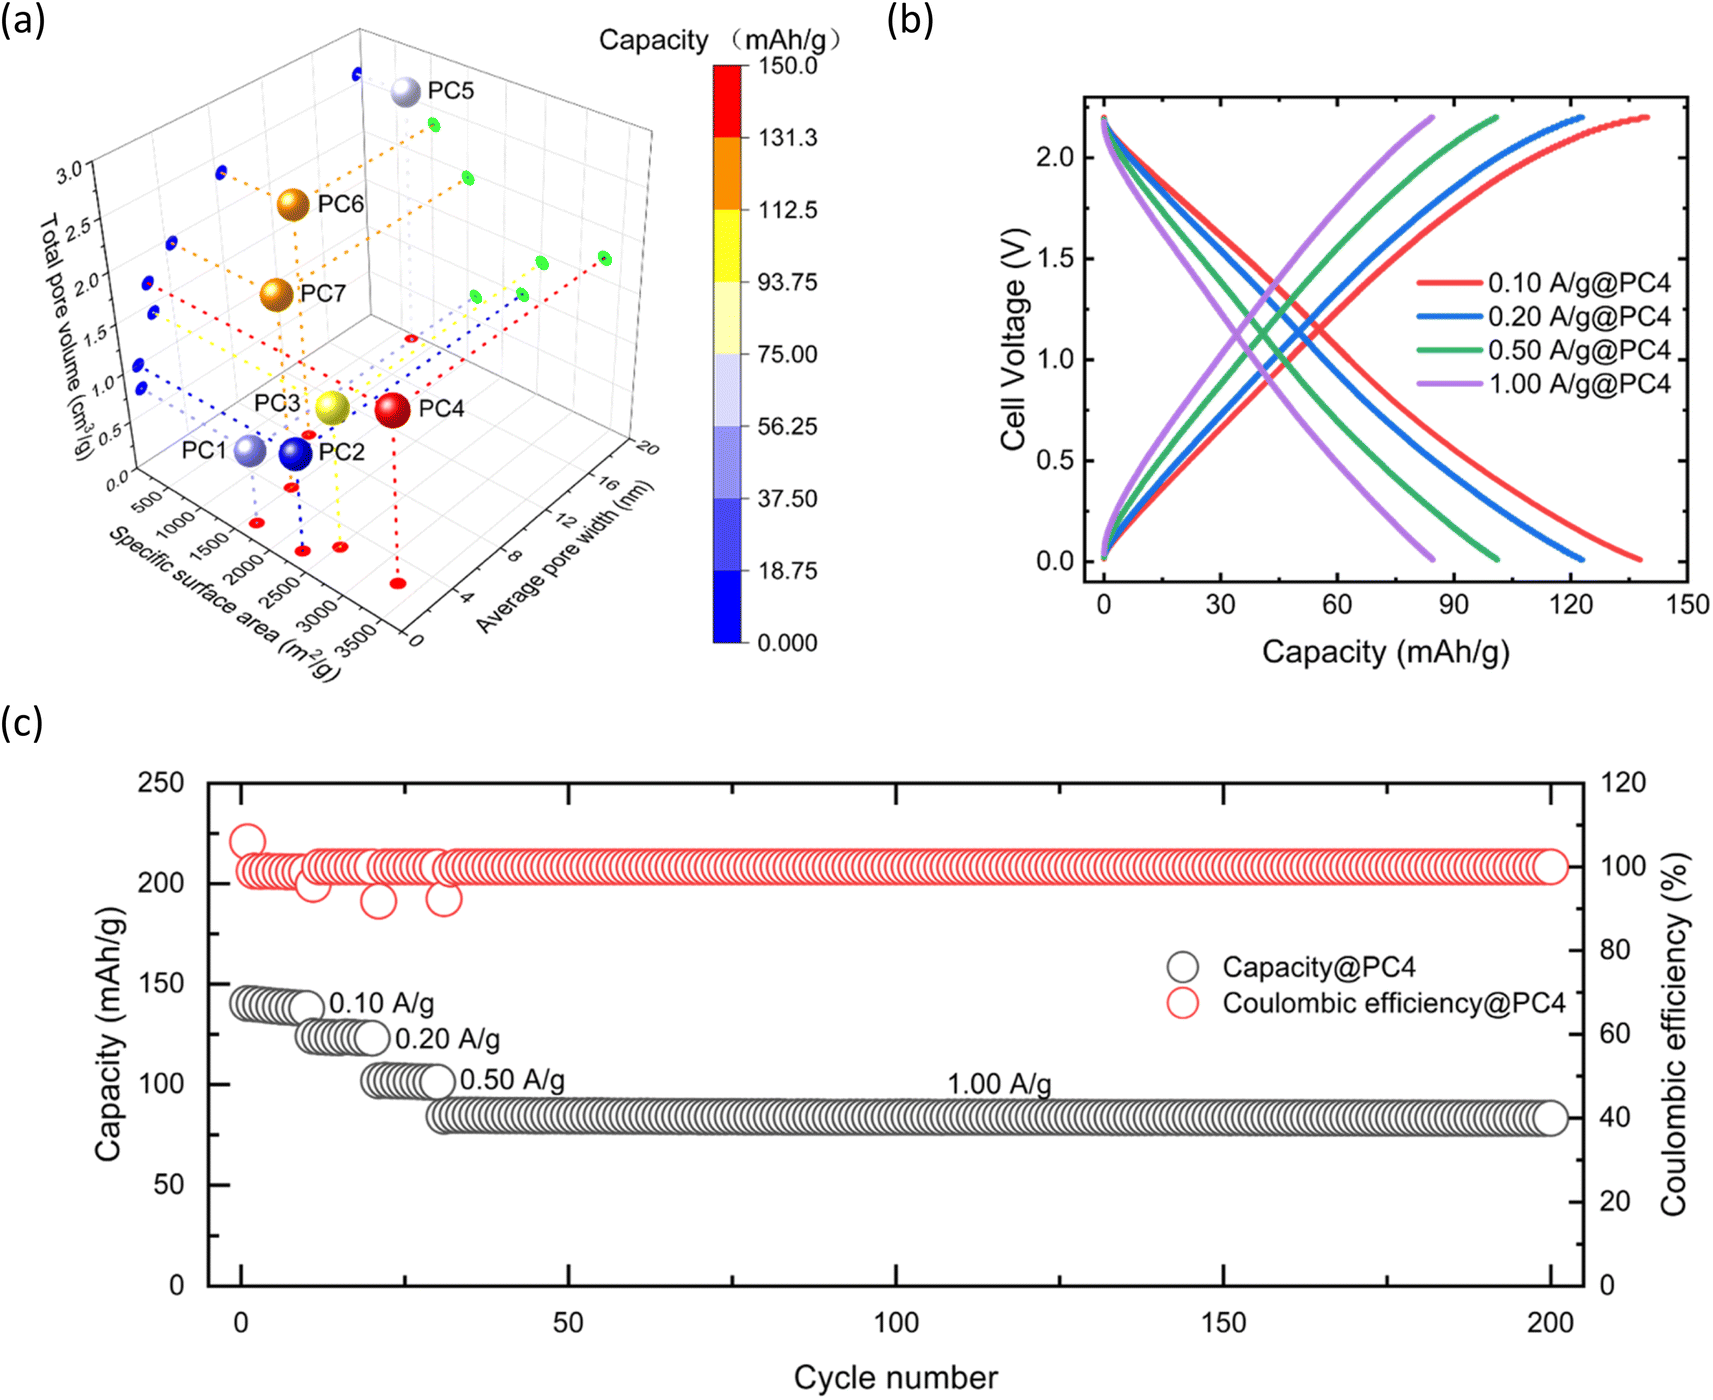 | ||
| Fig. 3 Electrochemical performance of a porous carbon/aluminium cell. (a) Discharge capability and pore structure characteristics of aluminium-ion batteries (AIB) with PC1, PC2, PC3, PC4, PC5, PC6, and PC7 as cathode materials at a current density of 0.10 A g−1. (b) Galvanostatic charge and discharge curves of AIB with cathode material of PC4 at a series of current densities. (c) Discharge capability and coulombic efficiency of AIB with cathode material of PC4 at a series of current densities. PC1 (YP50F), PC2 (MSP-20), PC3 (MSA-20), PC4 (MSC-30), PC5 (CNovel 20 nm), PC6 (CNovel MJ4 010-00), and PC7 (CNovel MH-00); PC, porous carbon. | ||
By analyzing the relationship between specific surface area, average pore size, total pore volume, and discharge capacity, these factors were found to have complex and interrelated effects on discharge capacity. Although a larger specific surface area generally indicates more active sites, which should improve electrochemical efficiency, the experimental results did not fully support this assumption. Specifically, PC1 and PC2 had the same average pore size of 1.09 nm, but as the specific surface area increased from 1616 m2 g−1 (PC1) to 2266 m2 g−1 (PC2), the discharge capacity decreased from 44.48 mA h g−1 to 9.48 mA h g−1. This suggests that the micropores were too small to act as adsorbers. When the average pore size increased to 2.60 nm (PC3), the capacity increased to 103.66 mA h g−1, indicating that AlCl4− ions could be adsorbed into mesopores. As the specific surface area increased from 2514 m2 g−1 (PC3) to 3299 m2 g−1 (PC4), the capacity also increased from 103.66 mA h g−1 to 137.81 mA h g−1, indicating that increasing specific surface area under suitable pore sizes can enhance capacity. However, when the average pore size increased to 19.6 nm (PC5), the capacity decreased to 70.79 mA h g−1, suggesting that large pore size may induce the adsorption of AlCl4− ions more efficiently than those of small pore sizes (approximately 2 nm) when considering its reduction of specific surface area.
To further investigate the optimal pore size, we tested PC6 with an average pore size of 8.45 nm and observed an increase in capacity to 118.81 mA h g−1. When the average pore size was reduced to 4.43 nm (PC7), the capacity reached 128.79 mA h g−1, despite a relatively low specific surface area of 1500 m2 g−1. When average pore size was larger than 4 nm, resulting discharge capacity was roughly proportional to the specific surface area and the maximum value per unit surface area was obtained at a pore size of ∼8 nm (PC6 and Table S1†).
The discharge capacity depends on the specific surface area, and there is a pore size at which the maximum discharge capacity can be obtained by the unit surface area. However, no material possesses such a large specific surface area within its pore size. Among the materials used in this study, PC4 demonstrated the highest capacity. Therefore, controlling the average pore size and specific surface area of PC materials is essential to enhance the discharge capacity of AIBs, as merely increasing the specific surface area may not yield the desired results.
To determine the electrochemical behavior of the PC cathode material during charge–discharge cycles, the galvanostatic charge–discharge curves of PC4 were investigated at different current densities (Fig. 3b). At current densities of 0.10, 0.20, 0.50, and 1.00 A g−1, the discharge capacities of the PC4 cathode at the 10th cycle were 137.81 mA h g−1, 122.98 mA h g−1, 101.15 mA h g−1, and 84.56 mA h g−1, respectively. Even at an ultra-high current density of 1 A g−1, the discharge capacity remained at 84.56 mA h g−1 (Fig. 3c). At a current density of 0.10 A g−1, the initial discharge capacity reached a maximum of 140.31 mA h g−1. As the current density increased, the discharge capacity gradually decreased. When the current density reached 1 A g−1, the discharge capacity was 84.27 mA h g−1. After 170 cycles, the discharge capacity declined to 83.25 mA h g−1, indicating that even after 170 cycles, the capacity showed almost no decay. PC4 exhibited excellent stability and a highly-stable retention capacity, demonstrating good reversibility and structural stability of the PC4 cathode.
2.3 Mechanism investigation
This study investigated the reaction mechanism of the PC/Al battery and the primary sources of its performance. Fig. 4a shows the cyclic voltammogram of the PC/Al battery at a scan rate of 1 mV s−1. No distinct redox peaks were observed for PC1 to PC7, and the curves exhibited a parallelogram shape, indicating that their electrochemical behavior was primarily governed by the adsorption and desorption of AlCl4− ions (the ionic radius is 0.528 nm).31 In addition, the current values of PC3 and PC4 were large. The Nyquist plot (Fig. 4b) illustrates the electrochemical performance differences of PC1 to PC7 based on electrochemical impedance spectroscopy (EIS) analysis. In the low-frequency region, PC1 and PC2 exhibited the highest diffusion impedance (the real part of impedance at 0.1 Hz), indicating that their pore sizes were not conducive to ion diffusion (Table 2). PC3 and PC4 show the lowest diffusion impedance, suggesting that their pore structures facilitated rapid ion diffusion, whereas PC5 to PC7 exhibited diffusion impedances between those of PC1–2 and PC3–4, indicating that larger pore sizes increased diffusion impedance. Analysis of the diffusion resistance in the low-frequency region indicated that pore size substantially impacted ion diffusion performance. Moderate pore sizes (2 nm) provided more diffusion pathways, reducing diffusion resistance, whereas smaller or larger pore sizes restricted ion diffusion, increasing Warburg impedance. These results indicate that optimizing pore size can enhance ion diffusion performance in electrode materials, thereby improving the overall electrochemical performance of AIBs. PC4 had the lowest diffusion impedance and a higher discharge capacity than PC7 at all current densities, consistent with the Nyquist plot results (Fig. S15–S18†).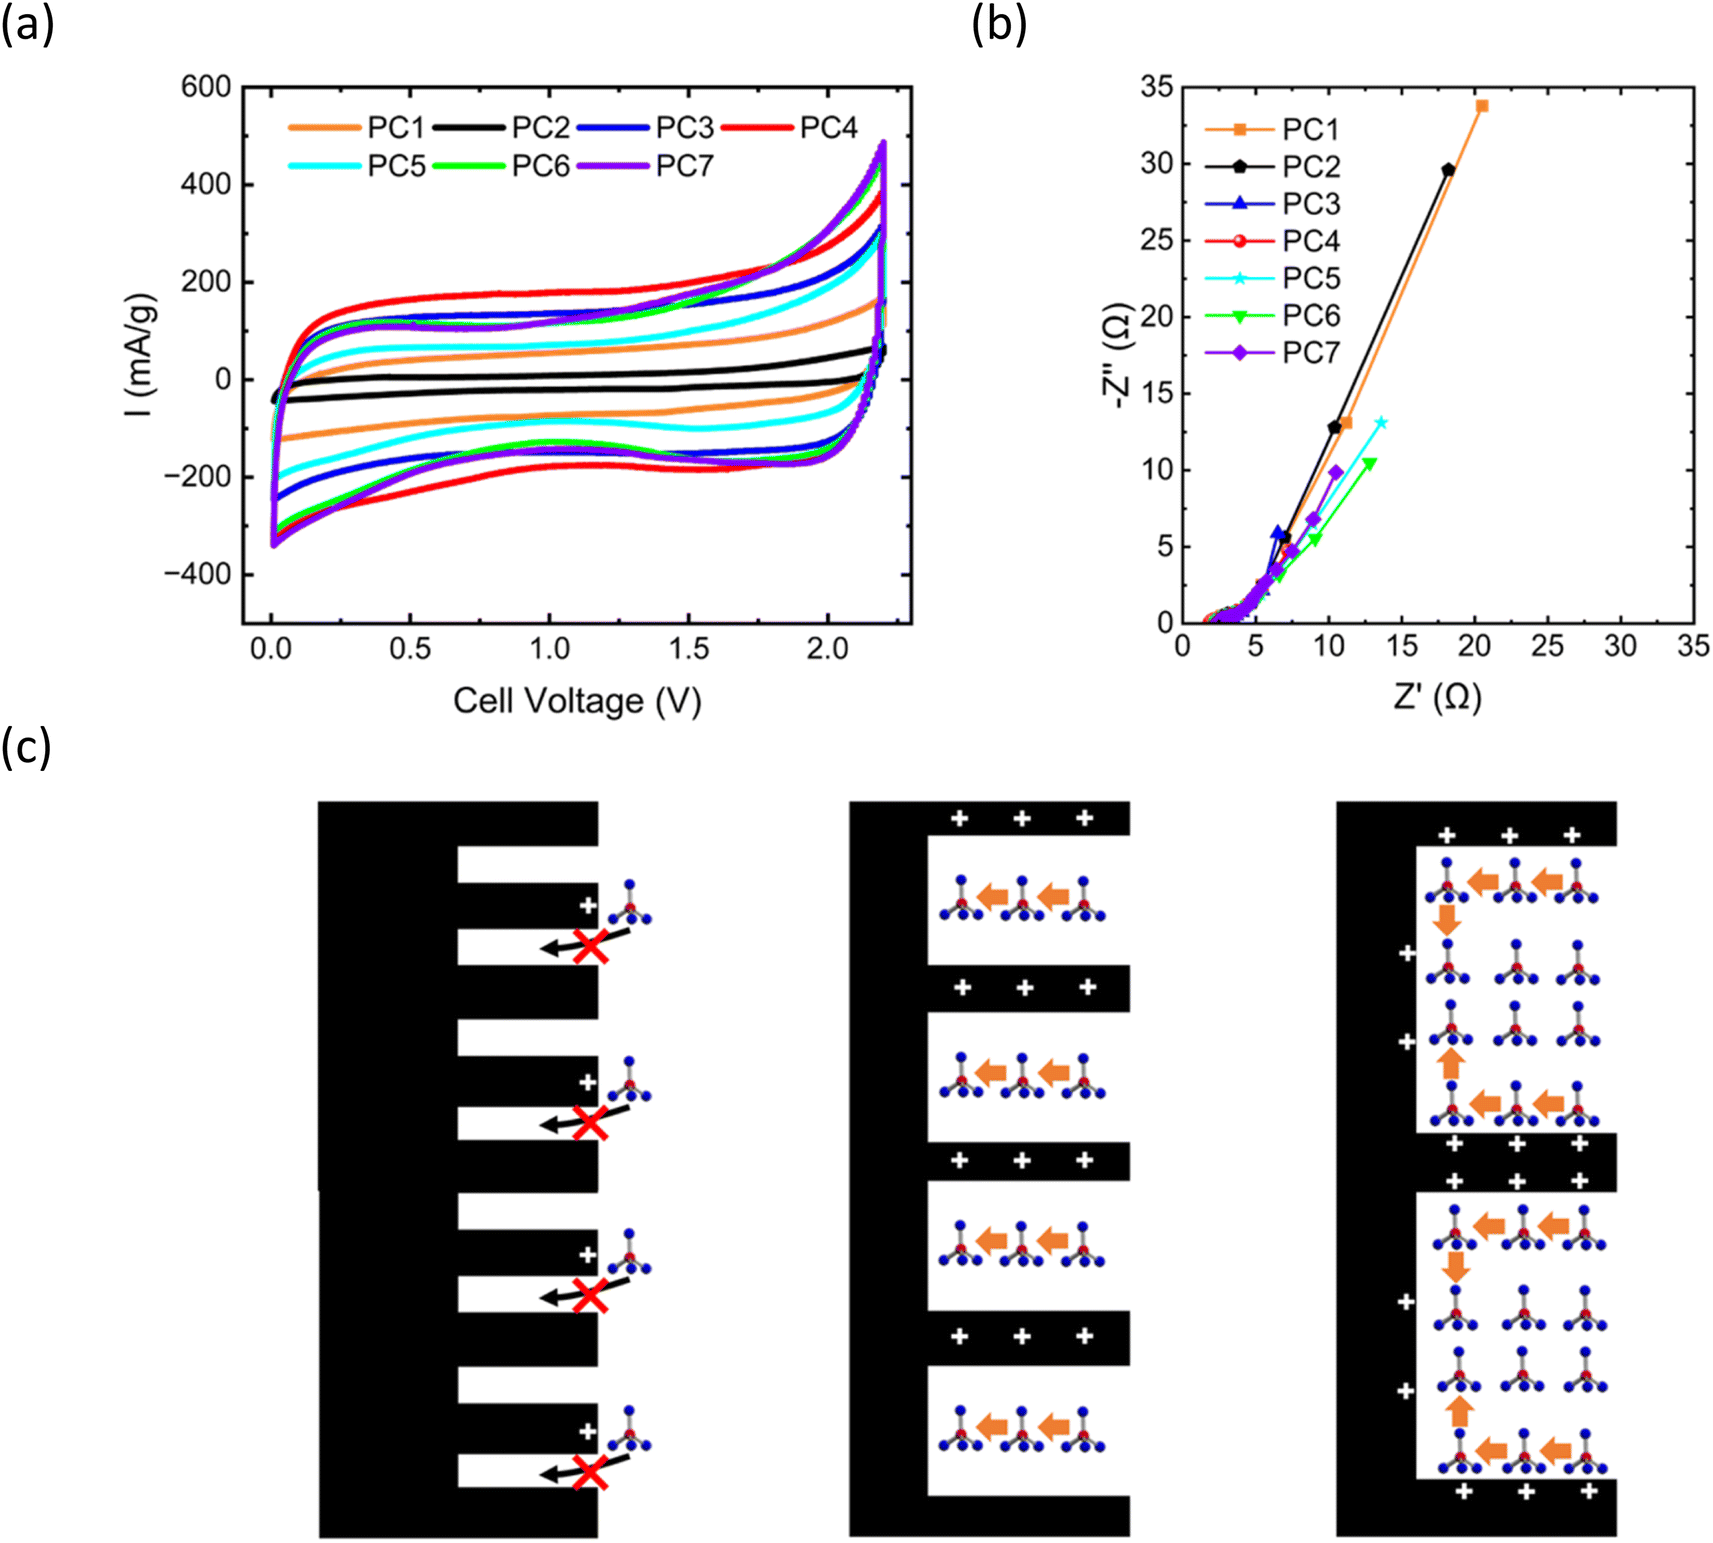 | ||
| Fig. 4 Rechargeable porous carbon/aluminium cell. (a) Cyclic voltammetry of Al foil and PC at a scan rate of 1 mV s−1. (b) Nyquist plots of PC1–7 at 2.2 V and at an amplitude of 10.0 mV and frequencies ranging from 1.0 MHz to 0.1 Hz. (c) Model diagram of the adsorption of AlCl4− ions on the PC cathodes. PC1 (YP50F), PC2 (MSP-20), PC3 (MSA-20), PC4 (MSC-30), PC5 (CNovel 20 nm), PC6 (CNovel MJ4 010-00), and PC7 (CNovel MH-00); PC, porous carbon. | ||
| Sample | The fitted values of R1 (Ω) | The fitted values of R2 (Ω) | The real part of impedance at 0.1 Hz (Ω) |
|---|---|---|---|
| PC1 | 2.113 | 0.7356 | 20.5 |
| PC2 | 2.194 | 0.61106 | 18.2 |
| PC3 | 2.446 | 0.48036 | 6.52 |
| PC4 | 1.812 | 0.22684 | 7.21 |
| PC5 | 2.547 | 1.151 | 13.6 |
| PC6 | 2.325 | 0.91136 | 12.8 |
| PC7 | 2.289 | 0.29664 | 10.5 |
| Equivalent circuit | |||
 |
|||
Fig. S19–S24† present the charge–discharge curves of PC1–7 at various current densities. The charge–discharge curves of PC3 and PC4 exhibited behavior more indicative of a capacitor, whereas PC1–2 and PC5–7 likely involved some degree of redox reactions. Fig. S25–S30† present the discharge capacity and coulombic efficiency of PC1–7 at various current densities. From the discharge curves, the contribution of the absorption current was minimal, and the microporous structure with a pore diameter of 2–8 nm appeared ideal for capacitive applications. The size of 2 nm is close to the ideal capacitor, whereas ∼8 nm is the optimal value when considering capacity. The semicircle in the high-frequency region represents charge transfer resistance, whereas the line in the low-frequency region reflects ion diffusion behavior.32 PC1, PC2, PC5, and PC6 exhibited larger semicircles, indicating higher charge transfer resistance, whereas PC3, PC4, and PC7 had smaller semicircles, indicating lower charge transfer resistance (Table 2). This variation may result from pore sizes that are too large or too small, thus reducing AlCl4− ion adsorption efficiency, although the difference in charge transfer resistance was minor.
In the Nyquist plot (Fig. S31–S37†), the blue line represents experimental data and the red line represents fitted data and indicates a close fit, indicating that the equivalent circuit model accurately describes the electrochemical characteristics of PC1–7 electrodes. The R1 value in the high-frequency region reflects electrolyte resistance, the semicircle in the medium-frequency region corresponds to charge transfer resistance (R2), and the low-frequency EIS measurement reveals diffusion impedance (Zw). During charge, electrons flow from the cathode to the anode, creating a positive charge on the cathode surface, generating an electric field that attracts AlCl4− ions, forming a double layer and capacitor. Fig. 4c represents the AlCl4− ion adsorption model at various pore sizes. When the pore size is small, AlCl4− ions cannot enter the pores. When the pore size is optimal, AlCl4− ions are efficiently adsorbed, and an increase in specific surface area provides more adsorption sites, enhancing capacitation. However, if the pore size is too large, AlCl4− ion adsorption efficiency decreases, reducing the efficiency of the capacitor. Thus, optimizing pore size and specific surface area can enhance AlCl4− ion adsorption and, consequently, improve electrochemical performance.
3 Conclusions
The impact of varying specific surface areas, average pore sizes, and total pore volumes of PC materials used as cathodes in AIBs on their performance was investigated. An increase in specific surface areas could enhance battery capacity when the pore sizes were appropriate. PC cathodes with an average pore size of 2–8 nm exhibited the highest capacity; ∼8 nm was the optimal value when considering capacity. The surface reactions on PC cathodes were governed by the adsorption and desorption of aluminum chloride ions. Therefore, designing PC cathodes with suitable pore sizes and large specific surface areas can substantially improve the overall performance of AIBs. This work represents a novel approach to designing high-performance cathode materials and presents broad prospects for practical applications.4 Experimental
4.1 Cathode preparation
PC1 (YP50F, Kuraray, Japan), PC2 (MSP-20, MC Evolve Technologies Corporation, Japan), PC3 (MSA-20, MC Evolve Technologies Corporation, Japan), PC4 (MSC-30, MC Evolve Technologies Corporation, Japan), PC5 (CNovel 20 nm, TOYO TANSO, Japan), PC6 (CNovel MJ4 010-00, TOYO TANSO, Japan), and PC7 (CNovel MH-00, TOYO TANSO, Japan) were purchased and used directly as cathode materials.4.2 Electrochemical measurements
Electrochemical measurements were conducted using a custom-made polytetrafluoroethylene (PTFE) cell. The working electrode was fabricated by coating a tungsten substrate with a mixture of active material (various PCs), conductive agent (AB), and binder (PVDF) in a weight ratio of 8:1:1. Glass fiber was used as the separator (Whatman GF/D, Cytiva, USA), and aluminum foil (99+%, Nilaco, Japan) served as the anode. The electrolyte was AlCl3/[EMIm]Cl ionic liquid (AlCl3/[EMIm]Cl = 1.5:1, Sigma-Aldrich, Japan). The PTFE cells were assembled in an argon-filled glove box (O2 < 1 ppm, H2O < 1 ppm). Galvanostatic charge–discharge, cyclic voltammetry, and electrochemical impedance spectroscopy measurements were carried out using a potentiostat (SP-150 and VSP-300, BioLogic, France) with a two-electrode system at 25 °C.
4.3 Characterizations
The surface morphology of porous carbon was observed using FE-SEM (SU9000, HITACHI, Japan). Raman spectroscopy was performed using a Raman spectrometer (NRS-4500, JASCO, Japan) with a 532 nm laser. The pore structure characteristics of the PC samples were analyzed using a fully automatic physisorption instrument (BELSORP MINI, Microtrac, Japan).Data availability
The data supporting this article have been included as part of the ESI.†Author contributions
Yasuhiko Hayashi: conceptualization, funding acquisition, supervision, and writing – review & editing. Yifeng Chen: experimental design, data collection & curation, investigation, validation, writing – origin draft. Hiroo Suzuki, Shu Fukumoto, Chiyu Nakano, Takeshi Nishikawa and Shigeyuki Umezawa: data collection, validation, revision. All authors discussed and provided interpretation of the results.Conflicts of interest
There are no conflicts to declare.Acknowledgements
This work was supported by JST SPRING, Japan, Grant Number JPMJSP2126 to Yifeng Chen. The authors thank Prof. Hidetoshi Matsumoto at Institute of Science Tokyo and Assoc. Prof. Noriyuki Sonoyama at Nagoya Institute of Technology for making valuable comments to improve the revised manuscript. We would like to thank Editage (https://www.editage.jp) for English language editing.References
- J. M. Tarascon and M. Armand, Nature, 2001, 414, 359–367 CrossRef CAS PubMed.
- M. Armand and J. M. Tarascon, Nature, 2008, 451, 652–657 CrossRef CAS PubMed.
- Y.-K. Sun, S.-T. Myung, B.-C. Park, J. Prakash, I. Belharouak and K. Amine, Nat. Mater., 2009, 8, 320–324 CrossRef CAS PubMed.
- N. Yabuuchi, K. Kubota, M. Dahbi and S. Komaba, Chem. Rev., 2014, 114, 11636–11682 CrossRef CAS PubMed.
- J. C. Pramudita, D. Sehrawat, D. Goonetilleke and N. Sharma, Adv. Energy Mater., 2017, 7(24), 1602911 CrossRef.
- F. Wang, X. Fan, T. Gao, W. Sun, Z. Ma, C. Yang, F. Han, K. Xu and C. Wang, ACS Cent. Sci., 2017, 3(10), 1121–1128 CrossRef CAS PubMed.
- B. Tang, L. Shan, S. Liang and J. Zhou, Energy Environ. Sci., 2019, 12, 3288–3304 RSC.
- M. Wang, C. Jiang, S. Zhang, X. Song, Y. Tang and H.-M. Cheng, Nat. Chem., 2018, 35, 3523 Search PubMed.
- M.-C. Lin, M. Gong, B. Lu, Y. Wu, D.-Y. Wang, M. Guan, M. Angell, C. Chen, J. Yang, B.-J. Hwang and H. Dai, Nature, 2015, 520, 324–328 CrossRef CAS PubMed.
- J. Wei, W. Chen, D. Chen and K. Yang, J. Mater. Sci. Technol., 2018, 6, 983–989 CrossRef.
- S. Wang, K. V. Kravchyk, F. Krumeich and M. V. Kovalenko, ACS Appl. Mater. Interfaces, 2017, 34, 28478–28485 CrossRef PubMed.
- M. Walter, K. V. Kravchyk, C. Böfer, R. Widmer and M. V. Kovalenko, Adv. Mater., 2018, 30, e1705644 CrossRef PubMed.
- S. Jiao, H. Lei, J. Tu, J. Zhu, J. Wang and X. Mao, Carbon, 2016, 109, 276–281 CrossRef CAS.
- S. Liu, J. J. Hu, N. F. Yan, G. L. Pan, G. R. Li and X. P. Gao, Ener, Energy Environ. Sci., 2012, 5, 9743–9746 RSC.
- Z. Li, C. Gao, J. Zhang, A. Meng, H. Zhang and L. Yang, J. Alloys Compd., 2019, 798, 500–506 CrossRef CAS.
- C. Li, S. Dong, R. Tang, X. Ge, Z. Zhang, C. Wang, Y. Lu and L. Yin, Energy Environ. Sci., 2018, 11, 3201–3211 RSC.
- J. H. Xu, D. E. Turney, A. L. Jadhav and R. J. Messinger, ACS Appl. Energy Mater., 2019, 11, 7799–7810 CrossRef.
- H. Chen, C. Chen, Y. Liu, X. Zhao, N. Ananth, B. Zheng, L. Peng, T. Huang, W. Gao and C. Gao, Adv. Energy Mater., 2017, 17, 1700051 Search PubMed.
- P. Bhauriyal, A. Mahata and B. Pathak, Chem.–Asian J., 2017, 12, 1944–1951 CrossRef CAS PubMed.
- X. Yu, B. Wang, D. Gong, Z. Xu and B. Lu, Adv. Mater., 2016, 4, 1604118 Search PubMed.
- N. P. Stadie, S. Wang, K. V. Kravchyk and M. V. Kovalenko, ACS Nano, 2017, 11, 1911–1919 CrossRef CAS PubMed.
- Z. A. Zafar, S. Imtiaz, R. Li, J. Zhang, R. Razaq, Y. Xin, Q. Li, Z. Zhang and Y. Huang, Solid State Ionics, 2018, 320, 70–75 CrossRef CAS.
- C. Li, P. C. Rath, S.-X. Lu, J. Patra, C.-Y. Su, D. Bresser, S. Passerini and J.-K. Chang, Chem. Eng. J., 2021, 417, 129131 CrossRef CAS.
- J. Xu, P. Jiang, X. Liang, R. Tian and Y. Liu, Fullerenes, Nanotubes Carbon Nanostruct., 2021, 29, 21–27 CrossRef CAS.
- P. Thanwisai, N. Chaiyapo, P. Phuenhinlad, Y. Kanaphan, J. Nash, C. Chotsuwan, A. Klamchuen, Y. Wang, T. Nann and N. Meethong, Carbon, 2022, 191, 195–204 CrossRef CAS.
- C. Schlumberger and M. Thommes, Adv. Mater. Interfaces, 2021, 4, 2002181 CrossRef.
- H. Zeng, B. Xing, C. Zhang, Y. Nie, X. Qu, B. Xu, G. Huang, Q. Sun, Y. Cao and S. W. Won Hong, Appl. Surf. Sci., 2023, 621, 156870 CrossRef CAS.
- T. Li, X. Huang, S. Lei, J. Zhang, X. Li, C. Wang, Z. Zhang, S. Wang, L. Yin and R. Wang, Energy Mater., 2023, 3, 300018 CAS.
- S. Huo, X. Song, Y. Zhao, W. Ni, H. Wang and K. Li, J. Mater. Chem. A, 2020, 8, 19927–19937 RSC.
- B. Amrithraj, A. Grindal and G. Azimi, Electrochim. Acta, 2025, 10, 145612 CrossRef.
- P. Bhauriyal, A. Mahata and B. Pathak, Phys. Chem. Chem. Phys., 2017, 19, 7980–7989 RSC.
- X. Yuan, T. Wang, J. Zhong, B. Peng, Q. Zhou, X. Xiong, C. Li, L. Liu, Y. Chen, L. Fu, J. Zhu, X. Wu, Y. Wu and X. Duan, Adv. Energy Mater., 2024, 2404254 CrossRef.
Footnote |
| † Electronic supplementary information (ESI) available: Fig. S1–S37. See DOI: https://doi.org/10.1039/d4ta08671f |
| This journal is © The Royal Society of Chemistry 2025 |