 Open Access Article
Accelerating discovery of glass materials in electronic devices through topology-guided machine learning†
Huang
Ming
 ,
Li
Yahao
,
Hu
Yongxing
,
Mao
Haijun
,
Liu
Zhuofeng
,
Li
Wei
,
Wang
Fenglin
,
Ye
Yicong
,
Zhang
Weijun
* and
Chen
Xingyu
*
,
Li
Yahao
,
Hu
Yongxing
,
Mao
Haijun
,
Liu
Zhuofeng
,
Li
Wei
,
Wang
Fenglin
,
Ye
Yicong
,
Zhang
Weijun
* and
Chen
Xingyu
*
Department of Materials Science and Engineering, College of Aerospace Science and Engineering, National University of Defense Technology, Changsha, China. E-mail: zhwjun@nudt.edu.cn; chenxingyu@nudt.edu.cnaa
First published on 25th February 2025
Abstract
The trial-and-error method, which is one of the most used methods in the glass industry, is extremely time-consuming and cost-intensive. In order to alleviate energy consumption and improve efficiency in glass development, a multi-tasking framework with topology-informed descriptors is proposed to obtain key properties, such as TEC, Tg, and Tm values, without conducting additional experiments. Herein, we disclosed that the casually generated findings on compositions are difficult to fabricate experimentally, and the predicted results largely deviate from the real values. To counter these issues, a confidence indicator was used to evaluate the composition's reliability, which embodied expert knowledge by classifying glass components into network formers, intermediates, and modifiers through the weighted Euclidean distance. Consequently, we were able to obtain real glass compositions with designed TEC values in the range of 3–12 ppm °C−1 within a short cycle. Achieving a matched sealing with Kovar alloy (∼5.0 ppm °C−1), five generated glasses exhibited TEC values closer to Kovar alloy and good wettability under 1000 °C. This work sheds light on developing efficient and cost-effective methods for the discovery of novel glasses in the field of electronic materials, such as GTMS, LTCC, and MLCC.
Introduction
Glass materials are widely used in various types of electronic materials, such as low temperature co-fired ceramic (LTCC), multi-layer ceramic capacitor (MLCC), and glass-to-metal seal (GTMS), owing to their design versatility. Among these, GTMS is one of the most important parts in high-reliability electronic components as they reliably enable the passage of electrical or optical signals through vacuum housings. More specifically, GTMS maintains the normal function of the components under harsh operating conditions, such as elevated temperature, moisture, pressure, or corrosive chemicals, to prevent moisture, gas intrusion, and leakage, as these factors might cause catastrophic failure of the encapsulated electrical system. Matched seals, a sealing method where the difference in thermal expansion coefficient (TEC) between metal and glass materials does not exceed 10%, have attracted extensive attention owing to their high reliability at elevated temperatures. Thus, discovering sealant materials with appropriate TECs is an urgent requirement for developing high-performance GTMS. Several methods have been developed for determining the properties of glass materials, such as empirical formulas and thermodynamic methods. Although these methods are well explored and demonstrate considerable promise, they have significant limitations. Empirical formulas strongly rely on a considerable amount of experimental data. Furthermore, the methods have certain limitations in the range of compositions, and the predicted accuracy of these methods is not completely satisfactory. Thermodynamic methods are currently unable to predict the properties of multi-composition glass owing to the overly complicated formula deduction. Interestingly, machine learning (ML) methods have recently exhibited excellent ability to discover new materials with designed properties in the fields of invar alloy,1 perovskite solar cells,2,3 and two-dimensional functional materials,4 significantly reducing the research and development costs for new materials. Moreover, some ML methods5,6 have been developed to theoretically predict the properties of glass materials. Yueh-Ting Shih et al.5 used combinations of elemental properties, such as atomic number, atomic volume, and atomic weight, to calculate some glass properties, such as Young's modulus, shear modulus, and electrical resistance. Overall, the descriptors were consistent with the framework summarized by Logan Ward.7 The framework generally consists of four parts, including stoichiometric attributes, elemental property statistics, electronic structure attributes, and ionic compound attributes. Undeniably, the ML method opens the door to properties prediction of inorganic materials, e.g., glass and ceramic. Still, there are several limitations and challenges in conventional ML methods. One of the most significant problems is that the data-driven model exhibits remarkable ability to “interpolate” predictions but has insufficient capacity to “extrapolate” predictions owing to the uncertainty of the relationship between the learned descriptors and properties.Leaving various ML methods aside, topological constraint theory is another useful tool to calculate glass properties based on composition evolution. Simply put, in this theory, which originated from the stability study of mechanical trusses,8 the glass structure is considered a random truss. In three dimensions, the degrees of freedom of the glass structure are as follows.
| F = 3N − Nc − 6 |
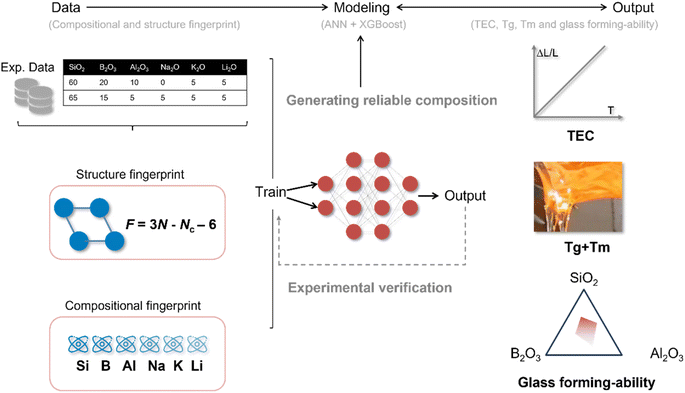
In this work, by merging ML approaches with topological constraint theory, we aim to develop a quantitatively accurate learning model with adequate ability to extrapolate predictions far from the training data. However, a host of properties, such as thermal expansion coefficient, glass transition temperature, and glass-forming ability, is required to assist in the discovery of new sealing glass in the encapsulated electrical system. It is cumbersome to build models for each property mentioned above, and it is difficult to obtain data for the training models. To address these challenges, a multi-task learning framework was established to increase the feasibility of deploying the model in the glass industry. In particular, the models to forecast TEC and Tg of the glass were constructed first. Additionally, nc was chosen as an indicator to evaluate the glass-forming ability of the generated glass composition. Specifically, glass compositions with nc values far from 3 were filtered out from the generated glass. Meanwhile, melting point can also be estimated based on the Tg − Tm empirical equation. To ensure reliability of the generated glass, a confidence indicator was proposed according to the weighted Euclidean distance, combined with expert knowledge.
Results and discussion
Multi-tasking learning framework
There are many aspects, such as thermal expansion, melting point, and glass-forming ability, that determine whether a new glass can be used to achieve a highly reliable sealant with metal materials. To accelerate the discovery of sealing glass for encapsulated electrical systems, a multi-task learning framework was designed to obtain these properties without building separate models for each one. However, the requirements for various properties differ. For example, in this work, the demand for accurately predicting the thermal expansion coefficient of the targeted glass is higher than that for the glass transition temperature. Actually, the error in Tg prediction does not greatly influence the quality of the sealant.The multi-task learning framework includes three main steps: data/input, modeling, and output, as shown in Fig. 1. It is well known that too many input parameters will increase the difficulty of interpreting the model, and the input data in traditional machine learning methods merely contain chemical composition information. This leads to a hurdle where models relying solely on chemical composition lack the ability to extrapolate predictions far from the training set.15 Correspondingly, several topological fingerprints are introduced into the descriptors. Topological constraint theory reduces a complex disordered material to simpler networks (structure fingerprints), providing realistic predictions extrapolated far from the training dataset.15 As noted earlier, the thermal expansion coefficient (TEC) of glass materials significantly influences the reliability of the sealant, and the thermal expansion behavior of materials has become one of the most desired glass properties. In addition, most sealants are fabricated through specific heat treatments in GTMS technology, which generally consist of three stages: (i) heating until the sealing glass starts to melt, (ii) holding at the same temperature to ensure the melting glass fills the sealant, and (iii) annealing at a temperature slightly below the glass-transition temperature to eliminate residual stress in the sealant. It can be concluded that the melting point and glass transition temperature are key parameters in the manufacturing process of high-reliability GTMS. There is no doubt that a framework including several models to predict Tm and Tg would theoretically be a better choice; however, this approach would simultaneously increase the difficulty of obtaining the related training data and make the framework cumbersome. Fortunately, for a number of glasses, there is a proportionality between the glass transition temperature and the melting point, as presented below.15–19
| Tg ≈ (2/3)Tm |
Thus, in this work, the model to calculate the melting point is excluded from the framework, and the melting point of the glass will be estimated based on the above formulation. Regarding glass-forming ability, academia has not reached a consensus on how to evaluate the glass-forming ability of disordered systems. However, there are still some indicators, such as the glass transition temperature (Tg) and the average constraint number (nc) to assess whether a nominal glass composition ultimately becomes a real glass. In this context, researchers have found that the nc value of the glass network former equals 3, and the disordered system exhibits maximum glass-forming ability when the nc value is approximately 3. Integrated with the glass transition temperature and the average constraint number, a composite indicator is created to help screen out unreliable glass compositions.20,21
Topology constraint parameters strengthen the interpretation of the ML model
A random molecular network is viewed as mechanical trusses in topological constraint theory. The atoms and chemical bonds are likened to mechanical constraints. Additionally, there are two kinds of constraints: (i) radial 2-body bond-stretching (BS) and (ii) angular 3-body bond-bending (BB). The exact value of these constraints depends on their coordination number, r. Consequently, the average number of constraints per atom (nc) in the disordered system is presented as follows.| nc = nBS + nBB |
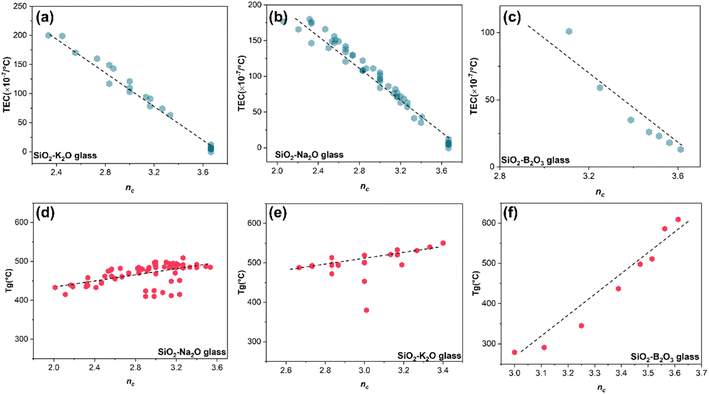
The parameters have been proven to exhibit a stronger relationship with glass properties, such as hardness, fracture toughness, and dissolution kinetics.9 Thus, the related data from the database, including TEC and Tg, were extracted, and the topology parameters were calculated based on their composition. Detailed processes can be found in the methods section. Surprisingly, our findings in Fig. 2 reveal that the thermal expansion behavior of glass also has a stronger connection with the topological structure of the disordered system. In this context, a continual rise in nc is associated with a gradual reduction in TEC, while the continual increase of nc corresponds to a gradual decrease in Tg. Additionally, in Fig. 2(f), the interaction mode between nc and thermal expansion in SiO2–B2O3 glass seems to differ completely from that in Na2O–SiO2 and K2O–SiO2 systems, despite their trends appearing to be similar. Different oxides play different roles in the disordered glass network, and they are usually divided into network formers (SiO2, B2O3), network intermediates (Al2O3), and network modifiers (Li2O, Na2O, and K2O). Accordingly, it can be concluded that the glass transition temperature is more susceptible to the influence of glass network formers in the glass composition compared to modifiers.
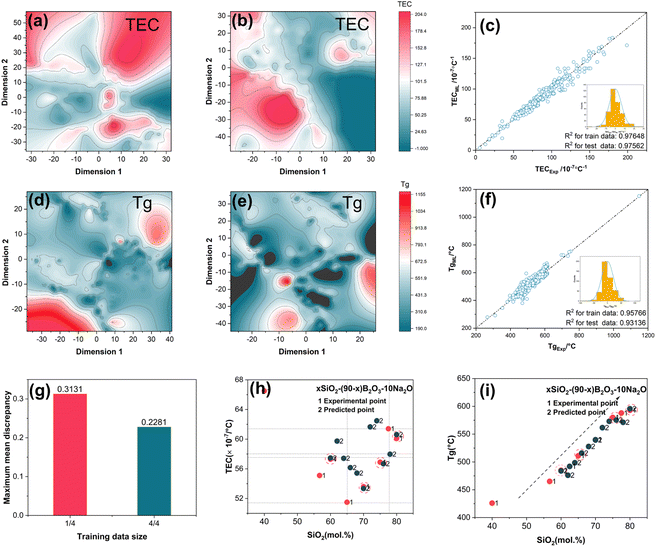
Based on the above discussion, topological constraint parameters should be considered as important features to reflect the structural information in the disordered system. These parameters are included in the descriptor system to enhance the interpretation and efficiency of the machine learning (ML) model. To assess the performance of the original and improved descriptors, t-SNE (t-Distributed Stochastic Neighbor Embedding) was used to visualize the effects of different descriptors. In Fig. 3(a) and (c) show the distribution of the training data only with chemical composition descriptors, while Fig. 3(b) and (d) display the distribution with chemical composition + topology-informed descriptors. The color differences of the descriptors without topology-informed descriptors are smaller than those of the improved descriptors. This trend also occurs with the glass transition temperature (Tg).
Obviously, with the inclusion of topology-informed descriptors, the algorithm can better cluster high-expansion and high-Tg glass compositions, making them more distinguishable. This demonstrates that the improved descriptors better reflect the features of the glass. Next, the compositional data in the SciGlass database, including SiO2, Al2O3, B2O3, Na2O, K2O, and Li2O, were selected as the training set. Thermal expansion coefficient (TEC) and glass transition temperature (Tg) prediction models were trained using 652 and 561 data points of (Al2O3)_a(B2O3)_b(Na2O)_c(K2O)_d(Li2O)_e(SiO2)1−a−b−c−d−e, respectively. ML models, namely, XGBoost and artificial neural networks (ANN), were then applied to learn each of the glass properties separately. As shown in Fig. 3(c) and (f), the TEC and Tg predictions from the ML models agree well with the original data from the dataset. Additionally, it was found that the distributions of the model residuals are similar to a normal distribution. This implies that the topology-informed descriptors have adequate ability to establish correlations with the glass properties without any abnormal performance.
However, it is important to point out that in this glass composition space, models containing only compositional fingerprints can also exhibit excellent predictive ability for both training and test data points. In other words, highly accurate models for predicting glass properties do not always require these additional descriptors. Nevertheless, including topology-informed descriptors will be highly beneficial for increasing efficiency in the discovery of new glass materials with desired TEC and appropriate Tg.
To further unravel the relationship between the training dataset size and distance between the domain and target, maximum mean discrepancy (MMD) was applied to evaluate this influence. The training dataset was divided into four parts. Thus, a 1/4 training dataset contains 163 data points, while the 3/4 training dataset contains 562 data points. The MMD of the two training datasets is shown in Fig. 3(e). When using the full training set, the distance between the domain and target is 0.2281. However, when the number of training data points is reduced to 1441 of the full dataset, the distance increases to 0.3131. This result suggests that methods to improve the performance of the framework involve either increasing the amount of training data or optimizing the distribution of the training data. Next, the xSiO2–(90 − x)B2O3–10Na2O system was selected to illustrate the ML model performance in detail.
The predicted and real values (Tg and TEC) for the xSiO2–(90 − x)B2O3–10Na2O system are presented in Fig. 3(h) and (i). The distribution of TEC predicted by the topology-informed model is relatively closer to the experimental values, and it exhibits good accuracy at some points (i.e., x = 70 mol%) with similar compositions. Although there is an increase in error at some points (i.e., x = 65 mol%), the error range still remains within 10 × 10−7 °C−1. Interestingly, Tg data predicted by the topology-informed model manifest a similar pattern to the experimental point in the distribution of glass transition temperatures, with Tg gradually increasing as nc increases. This indicates that the topology-informed model accurately captures the influence pattern of composition on Tg. Concisely, the ML model created through topology constraint parameters has proven efficient in anticipating the pattern of thermal expansion and glass transition point changes for glasses in the (Al2O3)a(B2O3)b(Na2O)c(K2O)d(Li2O)e(SiO2)1−a−b−c−de system. This lays the groundwork for utilizing the ML model to develop novel glass compositions.
Strategy for the discovery of new glass materials
This work was carried out to alleviate the tedious “trial-and-error” process and improve efficiency in the sealing glass industry. Thus, accelerating the discovery of sealing glass using the proposed framework becomes a crucial challenge. However, generating a glass composition based solely on specific rules easily leads to invalid glass compositions that are unlikely to exist experimentally and simultaneously result in predicted values that deviate significantly from actual measurements. To solve this problem, in addition to the topological constraints theory, a confidence indicator was developed to determine whether a predicted composition is worth experimentally validating. This indicator is based on the weighted Euclidean distance, as shown below.where D is weighted Euclidean distance or called as confidence indicator, wi is a weighted factor, xi is a composition vector of the generated glass composition and yi is a composition vector of the training and test sets. The data points used for training machine learning were selected to calculate the distance. As discussed earlier, the glass network former has a more significant influence on the glass properties. Thus, the weighted factors of SiO2 and B2O3 were set as 3 while the weighted factors of Al2O3 and R2O (R = Li, Na, K) were set as 2 and 1, respectively. The idea that a supervised learning model will be deployed to predict an unknown dataset comes from inductive transfer learning. The goal of the indicator is to distinguish some generated glass compositions that could not be accurately predicted from the generated composition space. In other words, the closer the generated compositions resemble the raw dataset, the higher the prediction accuracy of the model. Now, with the help of the confidential indicator and topology constraint parameter, it is easy to recommend a reliable glass composition with a targeted TEC and Tm.
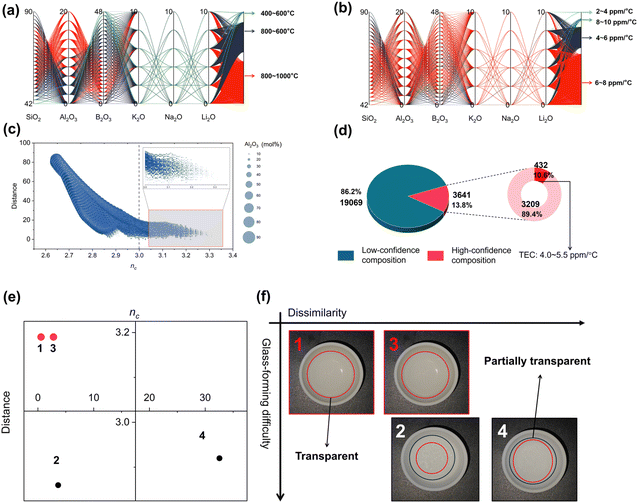
The number of randomly generated glass compositions reaches up to 22![[thin space (1/6-em)]](https://www.rsc.org/images/entities/char_2009.gif) 710, of which 13.8% (3641) show high reliability, as presented in Fig. 4(d). To visualize the distribution of TEC and Tg in the high-confidence glass compositions, parallel coordinates are used in Fig. 4(a) and (b). In the unscreened composition space, the concentration ranges of SiO2, Al2O3, B2O3, and R2O (R = K, Na, Li) were [0, 100 mol%], [0, 100 mol%], [0, 100 mol%], and [0, 10 mol%], respectively. The composition interval of each oxide was 2 mol%. Under the influence of the framework, the generated glass composition space, which was originally filled with unreliable ingredients, evolved into a smaller, more reliable composition space. More specifically, the concentration ranges of SiO2, Al2O3, B2O3, and R2O (R = K, Na, Li) were reduced to [42, 90 mol%], [0, 20 mol%], [0, 48 mol%], and [0, 10 mol%], respectively. Additionally, in the last coordinate of the parallel coordinate system, color distribution represents the distribution of properties in high-reliability glass compositions. For the melting point of glass, it can be observed that the melting points of most high-confidence glass compositions are in the range of 800–1000 °C (2090/3641), while the number of glass compositions in the 400–600 °C range is the smallest (56/3641). Similarly, in the distribution of thermal expansion coefficient (TEC) of glass, the majority of glass compositions have a TEC in the range of 6–8 ppm °C−1 (2489/3641). To validate that this framework is capable of significantly enhancing the productivity of sealing glass development, the framework was used to achieve a matching seal with Kovar alloy. Therefore, glass compositions with a TEC in the range of 4–5.5 ppm °C−1 are of particular interest. As shown in Fig. 4(d), glass compositions with a targeted TEC in the range of 4–5.5 °C account for 10.6% of the total number of high-confidence glass compositions.
710, of which 13.8% (3641) show high reliability, as presented in Fig. 4(d). To visualize the distribution of TEC and Tg in the high-confidence glass compositions, parallel coordinates are used in Fig. 4(a) and (b). In the unscreened composition space, the concentration ranges of SiO2, Al2O3, B2O3, and R2O (R = K, Na, Li) were [0, 100 mol%], [0, 100 mol%], [0, 100 mol%], and [0, 10 mol%], respectively. The composition interval of each oxide was 2 mol%. Under the influence of the framework, the generated glass composition space, which was originally filled with unreliable ingredients, evolved into a smaller, more reliable composition space. More specifically, the concentration ranges of SiO2, Al2O3, B2O3, and R2O (R = K, Na, Li) were reduced to [42, 90 mol%], [0, 20 mol%], [0, 48 mol%], and [0, 10 mol%], respectively. Additionally, in the last coordinate of the parallel coordinate system, color distribution represents the distribution of properties in high-reliability glass compositions. For the melting point of glass, it can be observed that the melting points of most high-confidence glass compositions are in the range of 800–1000 °C (2090/3641), while the number of glass compositions in the 400–600 °C range is the smallest (56/3641). Similarly, in the distribution of thermal expansion coefficient (TEC) of glass, the majority of glass compositions have a TEC in the range of 6–8 ppm °C−1 (2489/3641). To validate that this framework is capable of significantly enhancing the productivity of sealing glass development, the framework was used to achieve a matching seal with Kovar alloy. Therefore, glass compositions with a TEC in the range of 4–5.5 ppm °C−1 are of particular interest. As shown in Fig. 4(d), glass compositions with a targeted TEC in the range of 4–5.5 °C account for 10.6% of the total number of high-confidence glass compositions.
To understand the reasons for low confidence in low-confidence glass composition, the average number of constraints, distance, and alumina for all components are displayed in Fig. 5(c). In components with an average number of constraints less than 3, the distance from the original training set is significantly larger. Additionally, for a larger distance, the content of alumina in the glass is also notably higher. Apparently, this result is consistent with professional knowledge. As a glass network intermediate oxide, alumina requires stringent conditions for the formation of a glass state, typically necessitating a cooling rate faster than water quenching to achieve vitrification, that is to say, an increase in alumina content leads to a decrease in the average number of constraints in the glass, thus reducing the stability of the glass network. Then, four glass compositions were picked and smelted at 1650 °C for 2 hours in a furnace, then cooled. More specifically, the topological information and distances for the four glasses are depicted in Fig. 4(e). Unlike the remainder of the compositions, Glasses 1 and 3 are characterized by a modest elevation in the average number of constraints, exceeding the value of 3, and are further marked by their reduced Euclidean distance from the training dataset. Consequently, the likelihood of synthesizing the two glass compositions in the experiment is higher than the remainder, as is indeed represented in Fig. 4(f). Glasses 1 and 3 manifest a pronounced translucent quality following the process of high-temperature fusion and subsequent cooling, indicating a strong probability that these compositions have achieved a fully amorphous state. In contrast, the remaining two compositions show relatively weaker glass-forming ability, as illustrated in Fig. 4(f).
The compositional information of selected glasses is presented in Table 1. From an analytical standpoint, focusing on the glass compositions and nc, it becomes evident that the elevated alumina content coupled with reduced nc values constitute the principal factors underlying the poor glass-forming ability observed in the two remaining glass compositions. To date, it has been established that nc and the weighted Euclidean distance are effective metrics for the identification and exclusion of non-viable glass compositions, thereby expediting the selection process of feasible glass compositions.
| Index | SiO2 | Al2O3 | B2O3 | K2O | Na2O | Li2O | Distance | n c |
|---|---|---|---|---|---|---|---|---|
| 1 | 76 | 8 | 6 | 0 | 10 | 0 | 0.5639 | 3.19 |
| 2 | 12 | 6 | 72 | 10 | 0 | 0 | 3.6293 | 2.86 |
| 3 | 72 | 0 | 18 | 0 | 8 | 2 | 2.7854 | 3.19 |
| 4 | 38 | 28 | 22 | 2 | 2 | 6 | 32.5576 | 2.92 |
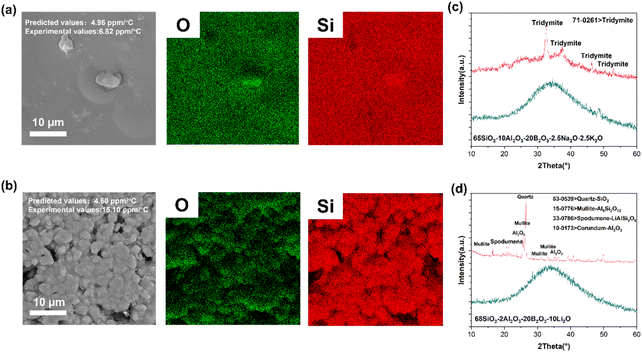
To verify the effectiveness of the strategy, two glass compositions, namely, 65SiO2–10Al2O3–20B2O3–2.5Na2O–2.5K2O (D = 0.2676) and 68SiO2–2Al2O3–20B2O3–10Li2O (D = 0.2908) glass, were used for verification. Initially, the glasses were synthesized through a water-quenching method. The surface morphology and elemental distribution are displayed in Fig. 5(a) and (b), implying that the two kinds of glass reflect different states after heat treatment. The former has a smoother surface compared to the other, indicating that the 65SiO2–10Al2O3–20B2O3–2.5Na2O–2.5K2O glass realizes densification at elevated temperature. However, the sintering behavior of the latter resembles that of a ceramic, and the surface is comprised of grain-like particles, which implies that the glass prefers to crystallize during the sintering process. To further determine the difference between the two states, X-ray diffraction was carried out to explore the phase composition of the samples. In Fig. 5(c) and (d), the raw powders of the samples were amorphous. After heat treatment, the samples gradually crystallized. However, there are significant differences between 65SiO2–10Al2O3–20B2O3–2.5Na2O–2.5K2O and 68SiO2–2Al2O3–20B2O3–10Li2O glass with respect to the crystallization degree. Lithium atom, with the smallest radius, easily penetrates into the disordered network and has a stronger attraction to the surrounding atoms because of the high electronegativity. Put simply, the glass composition with high-concentration lithium tends to largely crystallize at elevated temperatures. As stated in the method part, the glass in the training data point is assumed to be in the same state: amorphous. It is suggested that the predicted result should correspond to the properties of the amorphous glass. Consequently, to guarantee a result closer to the prediction, the glass composition should have enough capacity to stabilize the disordered states during the thermal cycles.
Potential applications of the framework in electronic devices
The structure of the framework is shown in Fig. 6. To accelerate the discovery of novel glass using the framework, the workstream generally includes three parts: (i) generating nominal chemical compositions according to the requirements; (ii) obtaining the properties of candidate glasses through topology-informed machine learning; and (iii) eliminating unrealistic and low-reliability chemical compositions using the average constraint number and weighted Euclidean distance. Although only six components (SiO2, Al2O3, B2O3, K2O, Na2O, and Li2O) are selected as the ingredient pool for glass compositions, the latent composition space is so vast that listing all combinations mathematically is highly demanding. Thus, the concentration of the oxides has been limited to simplify the problem. From domain knowledge, alkali metals have a stronger ability to reduce the melting point and depolymerize the disordered network. Meanwhile, this deteriorates the dielectric performance of glass materials, especially in terms of dielectric loss. Consequently, in devices where high dielectric loss is undesirable, alkali metals are typically avoided or used in minimal quantities. Subsequently, the concentration of the three alkali metals is restricted to 10 mol% in this work. Next, combined with composition filtering and topology-informed machine learning, high-confidence glass compositions and their properties are obtained simultaneously. Ultimately, the selection of glass compositions can be determined based on the distinct requirements of the engineering project. As depicted in Fig. 6, the proposed framework exhibits substantial utility in the design of low-temperature co-fired ceramics (LTCC), facilitating the sintering process of electronic ceramics and advancing glass-to-metal sealing technologies.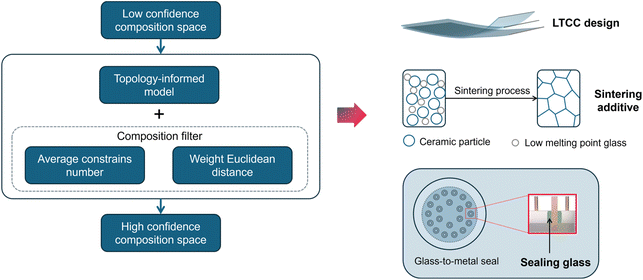 | ||
| Fig. 6 Flowchart of the screening process for effective glass composition and their potential applications. | ||
Low-temperature co-fired ceramics, or LTCC, typically comprise a high-modulus phase in conjunction with a glass phase. To prevent the development of significant residual stresses within LTCC materials during the sintering process, it is imperative to ensure that the thermal expansion coefficient (TEC) of the glass phase is closely matched to that of the high-modulus phase. Likewise, achieving densification in ceramic parts is challenging, generally requiring higher temperatures and external pressures during the process. It is common practice to add a certain amount of glass to ceramics to make the sintering conditions less harsh. This is because glass undergoes transformation from solid to liquid phase at elevated temperatures. Naturally, the diffusion rate of the ceramics in the liquid phase is significantly enhanced. Clearly, the framework will be beneficial for the quick identification of reliable glass compositions with desired properties.
In addition, for glass-to-metal sealing, it is critical to ensure that the thermal expansion coefficient (TEC) of the sealing glass aligns with that of the metal, thereby preventing the induction of thermal stress due to disparities in TEC. Furthermore, Kovar alloy is one of the most widely used materials in GTMS technology due to its excellent chemical durability and thermal stability. The thermal expansion coefficient of this alloy ranges from 4.6 to 5.5 ppm °C−1. Next, the implementation of a compatible sealing process with Kovar alloy will be exemplified through a case study utilizing this framework.
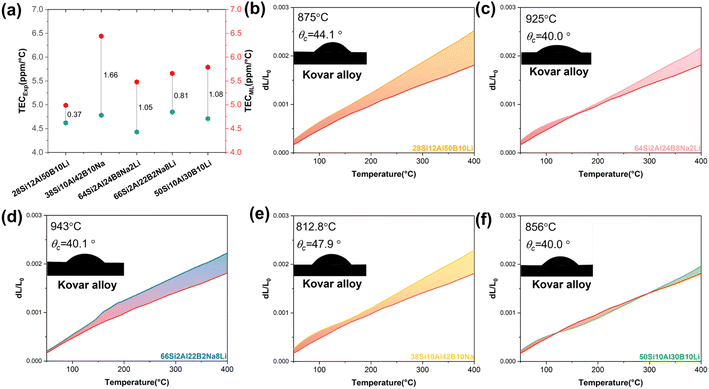
To achieve a matched sealant with Kovar alloy, five candidates were selected from the generated dataset. All five candidates form a disordered network and exhibit good stability. Among them, 28Si12Al50B10Li denotes chemical composition in mole fractions and comprises 28 mol% SiO2, 12 mol% Al2O3, 50 mol% B2O3, and 10 mol% Li2O. To characterize the thermal expansion behavior of these sealing glasses, the samples were first sintered at 600–700 °C and subsequently placed in a graphite die for specific heat treatment (melting-sealing process). More details can be found in the methods section. The average TEC and thermal expansion behavior are presented in Fig. 7(a), respectively. Overall, there is an acceptable error between the predicted and experimental TEC, with the maximum error being only 1.66 ppm °C−1 in 38Si10Al42B10Na glass and the minimum error being 0.37 ppm °C−1 in 28Si12Al50B10Li glass.
In Fig. 7(b)–(f), the red line (down) presents the thermal strain curve of Kovar alloy, and the fill areas denote the difference in the thermal strain. It can be clearly seen from the above figure that the fill area gradually increases with an increase in temperature. Thus, the stress caused by the difference in the thermal expansion behavior will surge as the temperature goes up. The generation of thermal stress is inevitable due to the mismatch of thermal expansion, though they have similar thermal expansion behavior. In the meantime, it is also vital whether a glass material at elevated temperature could wet the surface of Kovar alloy. If glass materials exhibit poor wettability with metal materials, it also indicates that it is difficult for the sealing glass to fulfill the role of a sealant and eliminate the hole in the green body. Further, the air impermeability of the sealant used in this sealing glass is usually poor with high probability. The wettability of the glasses 28Si12Al50B10Li, 64Si2Al2B8Na2Li, 66Si2Al22B2Na8Li, 38Si10Al42B10Na and 50Si10Al30B10Li with Kovar alloy was observed through a high-temperature microscope, as shown in Fig. 7(b)–(f) inset. The wetness behavior between the glass and metal materials was observed at 800–1000 °C. Naturally, it is suitable to realize matched sealing with Kovar alloy. Otherwise, Kovar alloy easily softens once the sealing temperature exceeds 1000 °C. Summing up, based on the thermal expansion behavior and wettability, these glasses have good potential as candidate materials for matching sealing with Kovar alloy. More importantly, the five candidates were developed in short cycles, including composition generation, preparation, and characterization process. Conversely, following the guidance of the traditional trial-and-error method, it would take a month or even more time to repeat the fabrication and characterization process in order to obtain the targeted glass composition.
Conclusion
In summary, this study focuses on alleviating the tedious “trial-and-error” process and improving efficiency in the glass industry through machine learning (ML). By introducing novel topology-informed descriptors into the ML model, the interpretation and efficiency of the model have been enhanced. To avoid situations where a generated glass composition cannot be synthesized experimentally, a confidence indicator has been created to identify the compositions that have a higher probability of success. Results demonstrate that the generated glass compositions with nc slightly larger than 3 and smaller distances are generally considered more reliable. Notably, through the framework constructed in this work, the customization of the thermal expansion coefficient (TEC) and glass transition temperature (Tg) for glass materials can be achieved. This will benefit the rational design of novel composites and the development of new sintering additives. To demonstrate the application of the framework, five candidate compositions that match the sealant requirements for Kovar alloy were discovered within a short cycle. Interestingly, this work has huge potential to extend the framework to other applications, such as low-temperature co-fired ceramics (LTCC) and multi-layer ceramic capacitors (MLCC), and to advance the traditional glass industry into the AI era with enhanced cost-effectiveness and efficiency.Methods
Data source for ML
The chemical composition, thermal expansion coefficient and (Al2O3)a(B2O3)b(Na2O)c(K2O)d(Li2O)e(SiO2)1−a−b−c−d−e glass transition temperature information used for training and test data were obtained from SciGlass database. In this database, most glass chemical information and glass properties originate from the reported literature in the past, and it is unknown at this time if the glass goes through some specific thermal treatment, for which each glass and their properties included is assumed to be the same in this work.Topological constraint theory (TCT) focuses on atomic topology in the glass network that governs macroscopic characteristics while disregarding less relevant second-order structure. Based on the TCT, the disordered network system could be divided into three states according to the average coordination of the system, namely, flexible, isostatic, and stressed-rigid, implying different glass-forming ability. Therefore, the problem whether a candidate disordered system has the potential to form a real glass in the experimental could be measured through topology constraint parameters. The topology constraint parameters are summarized in Table 1. BS constrains are radial 2-body interactions that maintain fixed interatomic distances between bonded atoms. The number of BS constraints per atom is typically half its coordination number (r/2) since each bond is shared between two toms. BB constraints are angular 3-body interactions that preserve the angles between bonds, thus maintaining the geometry of the atomic network. For atoms with coordination number r ≥ 2, the number of BB constrains is given by 2r − 3. BS and BB constrains collectively determine the rigidity and flexibility of glass networks. The balance between BS and BB constraints influences the ability of a materials to form a stable glass. For instance, an optimal number of constraints (isostatic condition) leads to maximum glass-forming ability. More importantly, accurate enumeration of BS and BB constraints, as shown in Table 2, allows for the prediction of various glass properties, such as hardness, brittleness and viscosity. More details about the topology constraint parameters can be found in ref. 15.
Machine learning method
The raw dataset was partitioned into the training and test set, which comprised 30% of the dataset and was formed by randomly selecting data from the raw dataset. The model in this work was developed using the eXtreme Gradient Boosting (XGBoost) technique, which exhibits better accuracy and generalization ability using the second-order Taylor expansion and adding regularization. A 10-fold cross-validation technique was adopted to avoid obtaining an overfitting model and reducing the complexity of the model. Hyperparameter optimizations were conducted through the GridSearchCV method, which had good ability to find the most accurate learning parameter in our given range, and the scoring algorithm is shown as follows.where m is the total number of the input data, xi is the descriptors, and yi are thermal expansion coefficient and glass transition temperature, respectively.
Maximum mean discrepancy is originally proposed to determine whether two samples originate from two different distributions. If the mean discrepancy reaches its maximum, it suggests that the sample comes from entirely distinct distribution. But when q and p have the same distribution, MMD equals zero. The formula is as follows.
Material preparation
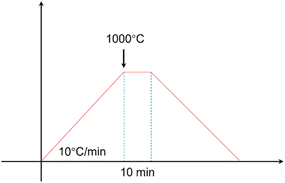
The purity of the raw materials and chemical formulations are described in the brackets. Silicon oxide (SiO2, AR), boron oxide (B2O3, AR), alumina (Al2O3, AR), potassium carbonate (K2CO3, AR), sodium carbonate (Na2CO3, AR) and lithium carbonate (Li2CO3, AR) were bought from Sinopharm Chemical Reagent Co., Ltd. All glasses generated by the model were fabricated through the water-quenching method. Detailed information of this process is given as follows: (i) raw materials were weighed according to the predicted chemical composition and then mixed with some zirconia balls through a pot mill machine for 12 h, (ii) the prepared powders were placed into a Pt crucible and heated up to 1550 °C for 4 h in a muffle furnace until the glass-melts became uniform, (iii) the glass-melt were poured into the water to create the glass slag once the heat treatment had finished, (vi) the slag becomes particles with a specific size through the ball milling method.In order to obtain TEC of the glass after the sealing process, the samples after the pre-sintering process at 600–700 °C were heated, as presented in Fig. 8.
Material characterization
In this work, information about the glass, such as thermal expansion coefficient, phase composition, element distribution, and surface morphologies, was experimentally obtained. Specifically, the thermal expansion strain of the samples was tested by a dilatometer (DIL 402 Expedis Classic, NETZSCH, Germany) and then the thermal expansion coefficient at different temperatures could be calculated based on the thermal strain. It is important to point out that the sample should have a shape of 3 mm × 4 mm × 25 mm, and a cylindrical alumina sample with a similar shape was used for instrument calibration. The phase composition of the samples was characterized by X-ray diffraction (SmartLab, Rigaku, Japan) with Cu Kα (λ = 1.5406 Å) radiation. Finally, elemental distribution and morphologies of the glass were observed by energy-dispersive spectroscopy (X-MaxN20) and field-emission scanning electron microscopy (Mira3, TESCAN, Czech). The contact angle between Kovar alloy and glass was measured through a heating microscope (HESSE, EM301-M17, Germany).Data availability
The data supporting this article have been included as part of the ESI.†Conflicts of interest
There are no conflicts to declare.References
- Z. Rao, P. Y. Tung and R. Xie, et al., Machine learning–enabled high-entropy alloy discovery, Science, 2022, 378(6615), 78–85, DOI:10.1126/science.abo4940.
- Q. Tao, P. Xu and M. Li, et al., Machine learning for perovskite materials design and discovery, npj Comput. Mater., 2021, 7(1), 23, DOI:10.1038/s41524-021-00495-8.
- Z. Hui, M. Wang and X. Yin, et al., Machine learning for perovskite solar cell design, Comput. Mater. Sci., 2023, 226, 112215 CrossRef CAS.
- M. Lu, J. Haining and Z. Yong, et al., Machine Learning-Assisted Synthesis of Two-Dimensional Materials, ACS Appl. Mater. Interfaces, 2022, 1871–1878 Search PubMed.
- Y. T. Shih, Y. Shi and L. Huang, Predicting glass properties by using physics- and chemistry-informed machine learning models, J. Non-Cryst. Solids, 2022, 584, 121511, DOI:10.1016/j.jnoncrys.2022.121511.
- S. Bishnoi, S. Badge and Jayadeva, et al., Predicting oxide glass properties with low complexity neural network and physical and chemical descriptors, J. Non-Cryst. Solids, 2023, 616, 122488, DOI:10.1016/j.jnoncrys.2023.122488.
- L. Ward, A. Agrawal and A. Choudhary, et al., A general-purpose machine learning framework for predicting properties of inorganic materials, npj Comput. Mater., 2016, 2(1), 16028, DOI:10.1038/npjcompumats.2016.28.
- J. C. L. Maxwell, On the calculation of the equilibrium and stiffness of frames, London, Edinburgh Dublin Phil. Mag. J. Sci., 1864, 27(182), 294–299, DOI:10.1080/14786446408643668.
- M. Bauchy, Topological Constraint Theory and Rigidity of Glasses, arXiv, 2020, preprint, arXiv:2005.04603, DOI:10.48550/arXiv.2005.04603.
- M. M. Smedskjaer, M. Bauchy and J. C. Mauro, et al., Unique effects of thermal and pressure histories on glass hardness: Structural and topological origin, J. Chem. Phys., 2015, 143(16), 164505, DOI:10.1063/1.4934540.
- M. M. Smedskjaer, J. C. Mauro and Y. Yue, Prediction of Glass Hardness Using Temperature-Dependent Constraint Theory, Phys. Rev. Lett., 2010, 105(11), 115503, DOI:10.1103/PhysRevLett.105.115503.
- M. Bauchy and M. Micoulaut, Atomic scale foundation of temperature-dependent bonding constraints in network glasses and liquids, J. Non-Cryst. Solids, 2011, 357(14), 2530–2537, DOI:10.1016/j.jnoncrys.2011.03.017.
- J. Du and L. R. Corrales, Compositional dependence of the first sharp diffraction peaks in alkali silicate glasses: A molecular dynamics study, J. Non-Cryst. Solids, 2006, 352(30–31), 3255–3269 CrossRef CAS.
- R. Azoulay, H. Thibierge and A. Brenac, Devitrification characteristics of GexSe1−x glasses, J. Non-Cryst. Solids, 1975, 18(1), 33–53, DOI:10.1016/0022-3093(75)90006-X.
- H. Liu, T. Zhang and N. M. Anoop Krishnan, et al., Predicting the dissolution kinetics of silicate glasses by topology-informed machine learning, npj Mater. Degrad., 2019, 3(1), 32, DOI:10.1038/s41529-019-0094-1.
- S. Sakka and J. D. Mackenzie, Relation between apparent glass transition temperature and liquids temperature for inorganic glasses, J. Non-Cryst. Solids, 1971, 6(2), 145–162, DOI:10.1016/0022-3093(71)90053-6.
- Z. Lu and J. Li, Correlation between average melting temperature and glass transition temperature in metallic glasses, Appl. Phys. Lett., 2009, 94(6), 061913, DOI:10.1063/1.3081028.
- V. K. Malinovsky and V. N. Noviokov, The nature of the glass transition and the excess low-energy density of vibrational states in glasses, J. Phys.: Condens. Matter, 1992, 4(9), L139, DOI:10.1088/0953-8984/4/9/003.
- C. A. Angell, K. L. Ngai and G. B. Mckenna, et al., Relaxation in glass-forming liquids and amorphous sids, J. Appl. Phys., 2000, 88(6), 3113–3157, DOI:10.1063/1.1286035.
- S. Lu, Y. Wu, M. G. Ju, et al., Machine Learning Accelerated Insights of Perovskite Materials, Springer International Publishing, 2021, pp. 197–223, DOI:10.1007/978-3-030-68310-8-8.
- J. Lin, Z. Liu and Y. Guo, et al., Machine learning accelerates the investigation of targeted MOFs: Performance prediction, rational design and intelligent synthesis, Nano Today, 2023, 49, 101802, DOI:10.1016/j.nantod.2023.101802.
Footnote |
| † Electronic supplementary information (ESI) available. See DOI: https://doi.org/10.1039/d4ta08686d |
| This journal is © The Royal Society of Chemistry 2025 |

