
 Open Access Article
 This Open Access Article is licensed under a Creative Commons Attribution-Non Commercial 3.0 Unported Licence
How does an antisolvent additive affect all interfaces in aqueous Zn–MnO2 batteries?†
Michael J.
Counihan
ab,
Lacey
Roberts
ac,
Stefan
Ilic
ab,
Yingjie
Yang
 ad,
Claire
Ely
c,
Robert F.
Klie
ad,
Michael F.
Toney
ac and
Sanja
Tepavcevic
*ab
ad,
Claire
Ely
c,
Robert F.
Klie
ad,
Michael F.
Toney
ac and
Sanja
Tepavcevic
*ab
aJoint Center for Energy Storage Research, Argonne National Laboratory, Lemont, Illinois 60439, USA. E-mail: sanja@anl.gov
bMaterial Science Division, Argonne National Laboratory, Lemont, Illinois 60439, USA
cDepartment of Chemical and Biological Engineering, Materials Science and Engineering Program, Renewable and Sustainable Energy Institute (RASEI), University of Colorado Boulder, Boulder, Colorado 80309, USA
dDepartment of Physics, University of Illinois at Chicago, Chicago, Illinois 60607, USA
First published on 13th May 2025
Abstract
Organic solvents are common additives for aqueous zinc-ion batteries (ZIBs) to improve plating on the zinc metal anode. However, additives are often only studied for anodes, neglecting effects at the cathode as well any evolution of corrosion products over ZIB lifetime. Here, we studied the effect of acetonitrile (ACN) concentration on the overpotentials and efficiencies of Zn anodes and MnO2 cathodes. Overpotentials for Zn plating and stripping show local minima with low (0.5–2 vol%) ACN concentrations, with all stripping overpotentials lower than plating overpotentials due to the ACN's antisolvent character. The amount of zinc hydroxide sulfate (ZHS), a Zn corrosion byproduct, varies with ACN concentrations and between plating and stripping steps. The energy efficiency and capacity fade of MnO2 cathodes show different ACN concentration trends but similar degradation products, with optimal performance at 0 vol% ACN. This highlights the importance of analysing additive effects on all battery components and interfaces.
1. Introduction
Rechargeable aqueous zinc-ion batteries (ZIBs) are attracting increased interest for grid-scale energy storage due to lower cost and enhanced safety compared to more commercially mature lithium-ion batteries.1–4 ZIBs with zinc metal anodes and cathodes based on manganese chemistries (Zn–MnO2) offer the most energy dense and low-cost batteries in this space.5,6 However, numerous challenges remain due to interfacial processes at both anode and cathode. Zn anodes suffer from dendrite formation during plating, which can short the battery, as well as corrosion from the hydrogen evolution reaction (HER) in near-neutral pH electrolytes.7–9 This leads to the formation of insulating zinc hydroxide species; in the most common ZnSO4-based electrolytes, this is zinc hydroxide sulfate Zn4(OH)6SO4·xH2O (ZHS).10 At the cathode, pH-sensitive MnO2 chemistries also exhibit and even depend on ZHS formation.11–13 Dissolution of Mn2+ during discharge11,14,15 leads to capacity fade over time and limits access to a two-electron cathode, which would double the theoretical energy density.5,6,16,17One often exploited approach to solving these interfacial challenges is adding an organic solvent to the aqueous electrolyte, whose role is to regulate the interfacial water activity.18–27 Solvents with high donor numbers, such as dimethyl sulfoxide,20 or chelating agents, such as ethylene glycol,24 displace the water molecules from the Zn2+ solvation sheath and minimize interfacial water decomposition. Organic solvents can also decrease water activity by interrupting the water network through the formation of additional hydrogen bonds.21,23,26 In addition, organic solvents can suppress water decomposition by regulating the electrical double layer structure and displace the water from the electrode surface.22,25 Our recent work demonstrated that adding acetonitrile (ACN) to ZnSO4 electrolytes leads to antisolvent behaviour, where ACN is excluded from the Zn2+ and SO42− solvation shells in the bulk electrolyte but adsorbs on the electrode surface and changes interfacial solvation structures.28 This leads to improved zinc metal plating morphologies and lower HER rates, which cumulatively increase the efficiency of Zn plating and stripping.
While these findings showcase the promise of organic solvent additives at the Zn anode, a more comprehensive understanding is still lacking. In particular, in most studies, very little attention is paid to both the effect of solvent concentration as well as solvent effect on the cathode besides the Zn anode.29,30 Additionally, the total energy efficiency of the charge–discharge process in full cells is rarely quantified, despite the discharge energy efficiency being a strong determinant for commercial ZIB implementation.31 Herein, we study the effect of ACN concentration in 1 M ZnSO4 electrolytes on overpotentials, coulombic efficiency (CE), and energy efficiency of Zn anodes and MnO2 cathodes as well as the dynamic structures of Zn and ZHS formed at the anode–electrolyte interface.
2. Experimental section
2.1 Materials
Zinc sulfate heptahydrate (ZnSO4·7H2O, ≥99.95% metals basis), manganese sulfate monohydrate (MnSO4·H2O, ≥99%), potassium permanganate (KMnO4, ≥99.0%), poly(vinylidene difluoride) (PVDF, 400 kDa), acetonitrile (ACN, 99.8%, anhydrous), and N-methyl-2-pyrrolidone (NMP, 99%) were purchased from Sigma-Aldrich. Methanol (HPLC) was purchased from Fisher. High purity MilliQ water (resistivity 18.2 MΩ cm) was used to prepare solutions and rinse electrodes postmortem. Zn foil (250 μm, 99.95%) was purchased from ThermoFisher, Cu foil (6 μm, 99.8%) was purchased from MSE Supplies, and Ti foil (127 μm, Grade 2) was purchased from TBI. Super P carbon powder was purchased from MSE Supplies. Whatman glass fiber discs were used as separators. All coin cell parts were made from 304 stainless steel.2.2 Electrolytes
Solutions of 1 M ZnSO4 were prepared by dissolving ZnSO4·7H2O in an appropriate amount of H2O and adding ACN to volume. The volume percent of ACN was calculated based on the room temperature densities of H2O (0.997 g mL−1) and ACN (0.786 g mL−1), and the waters of hydration from the salt were taken into account. All ZnSO4 concentrations were 1.00 ± 0.01 M. At these concentrations of salt and solvents, molarity is equivalent to molality within 3%, so 1 M ZnSO4 is roughly 1 m ZnSO4 in all cases here.2.3 Electrodes
Electrodes were punched from their respective foils at 1/2′′ diameter for Zn electrodes, 9/16′′ or 5/8′′ for Ti electrodes, and 5/8′′ for Cu electrodes. Glass fiber separators were 5/8′′ diameter for half cells and 9/16′′ for full cells. Cu electrodes were washed with 3 M hydrochloric acid for 30 seconds, rinsed in excess four times with acetone, and dried under low vacuum at room temperature overnight to remove the native oxide. This is a more aggressive and thorough cleaning procedure than used in our previous work.32 Zn electrodes were polished with 400, 800, and 1000 grit sandpaper prior to punching. Zn and Ti electrodes were cleaned with water, acetone, and isopropanol and dried under low vacuum at room temperature prior to use.MnO2 cathodes were prepared from a slurry mix. The slurries consisted of 75 wt% δ-MnO2, 15 wt% PVDF, and 10 wt% Super P carbon mixed in NMP (∼20 wt% solids) in a Thinky mixer for 15 minutes total. The slurry was painted evenly on individually-weighed Ti foils in a 1.7 cm2 area, dried at 70 °C for 2–3 hours to remove the solvent, and re-weighed to estimate the mass loading. Mass loadings were 4–6 mgMnO2 cm−2.
2.4 Electrochemistry
All tested cells were in 2032 coin cells. Cu‖Zn half cells were prepared with Cu foil as working electrode, 80 μL of electrolyte infiltrated into a glass fiber disc as separator, and Zn foil as counter/reference electrode. Zn‖MnO2 full cells were prepared with MnO2-on-Ti foil as working electrode, 50 μL of electrolyte infiltrated into a glass fiber disc as separator, and Zn foil as counter/reference electrode. One 0.5 mm thick steel spacer and wave spring were used to apply stack pressure, and cells were crimped at 0.57 tons. Half cell cycling was performed on a Maccor battery cycler at ambient temperature of 20 °C. Full cell cycling was performed on a Biologic BCS-800 battery cycler at ambient temperature of 23 °C. At least two individual cells were used for each condition. Points and error bars in the figures represent average and standard deviation of the relevant values from these cells.For half cells, galvanostatic cycling was performed at a current density of 1 mA cm−2 and plated capacities of 1 mA h cm−2. The stripping cut-off voltage was 0.5 V. For full cells, galvanostatic cycling was performed at current densities of 0.1, 0.2, 0.5, 1, 2, 0.5, 0.2, and 0.1 A gMnO2−1; the nominal loadings and currents are given in Table S1.† Ten cycles at 0.1 A gMnO2−1 were used in the initial cycling beginning with a discharge step (the synthesized MnO2 is nominally in the charged state), and five cycles were done at each subsequent current density. Following five 0.1 A gMnO2−1 cycles, cells were cycled for 50 more cycles at 0.1 A gMnO2−1 (current density using the nominal loading from the starting cathode), during which a 12 h open circuit hold was deployed between every fifth charge and discharge cycle.
2.5 SEM-FIB and EDX
Scanning electron microscopy (SEM), focused ion beam (FIB) milling and energy dispersive X-ray (EDX) spectroscopic analysis were performed on a Thermo Fisher Helios 5CX SEM-FIB. SEM and EDX were also performed on a JEOL JSM-IT500HR FESEM. During imaging, representative areas on the sample surface were chosen, a voltage of 5 kV and currents between 0.69–2.8 nA were used, and EDX analysis were performed at 15–30 kV, 2.8 nA depending on the extent of sample charging. FIB was used to expose the Cu–Zn plated cross-section under representative morphologies of respective ACN concentration. FIB milling used Ga ion beams starting with large currents (5–10 nA) to mill large volumes away from the region of interest, then decreased the current (300 pA to 1 nA) for fine polishing of the cross-section to minimize ion-beam damage. The same samples were characterized top-down and in cross-section, EDX data was acquired and analyzed with the Oxford Aztec software.2.6 X-ray diffraction
X-ray diffractograms were acquired on a Rigaku SmartLab 9 kW rotating anode utilizing Cu K-alpha radiation (1.54 angstrom). K-beta radiation was removed with a nickel filter. For measurements on Cu‖Zn half cell electrodes, the instrument was operating in parallel beam grazing incidence mode with an incidence angle of 2.5 degrees. For measurements on MnO2 cathodes, the instrument was operating in the Bragg–Brentano mode. The HyPix3000-SE detector was set to 0D continuous acquisition. The axial divergence was reduced with symmetric 2.5 degree Soller slits on the incident and receiving optics path. An additional 0.5 degree parallel slit analyzer was used to reduce vertical divergence of the diffracted X-rays. All data was acquired and reduced using the Rigaku SmartLab Studio II software.3. Results and discussion
3.1 Effect of ACN on Zn anode
Overpotentials of the plating and stripping processes are good determinants of metal plating morphology and battery efficiency.33 To demonstrate the effect of ACN on nucleation, growth, and stripping overpotentials as well as estimate CE, Cu‖Zn half cells were tested by galvanostatic cycling at 1 mA cm−2 with 1 mA h cm−2 plated charge (Fig. 1a). As shown in Fig. 1b and c, there is a local minimum in both Zn nucleation and growth overpotentials in the 0.5–2 vol% ACN range before greater ACN concentration increases the overpotentials above low-ACN concentration. We note that absolute nucleation overpotentials can vary widely depending on cell conditions,33 but the trends hold; growth overpotential values should be accurate. Importantly, these improvements are seen at concentrations well below a 1![[thin space (1/6-em)]](https://www.rsc.org/images/entities/char_2009.gif) :1 ACN:Zn2+ molar ratio, indicating an interface-dominated rather than bulk solvation-dominated mechanism.28
:1 ACN:Zn2+ molar ratio, indicating an interface-dominated rather than bulk solvation-dominated mechanism.28
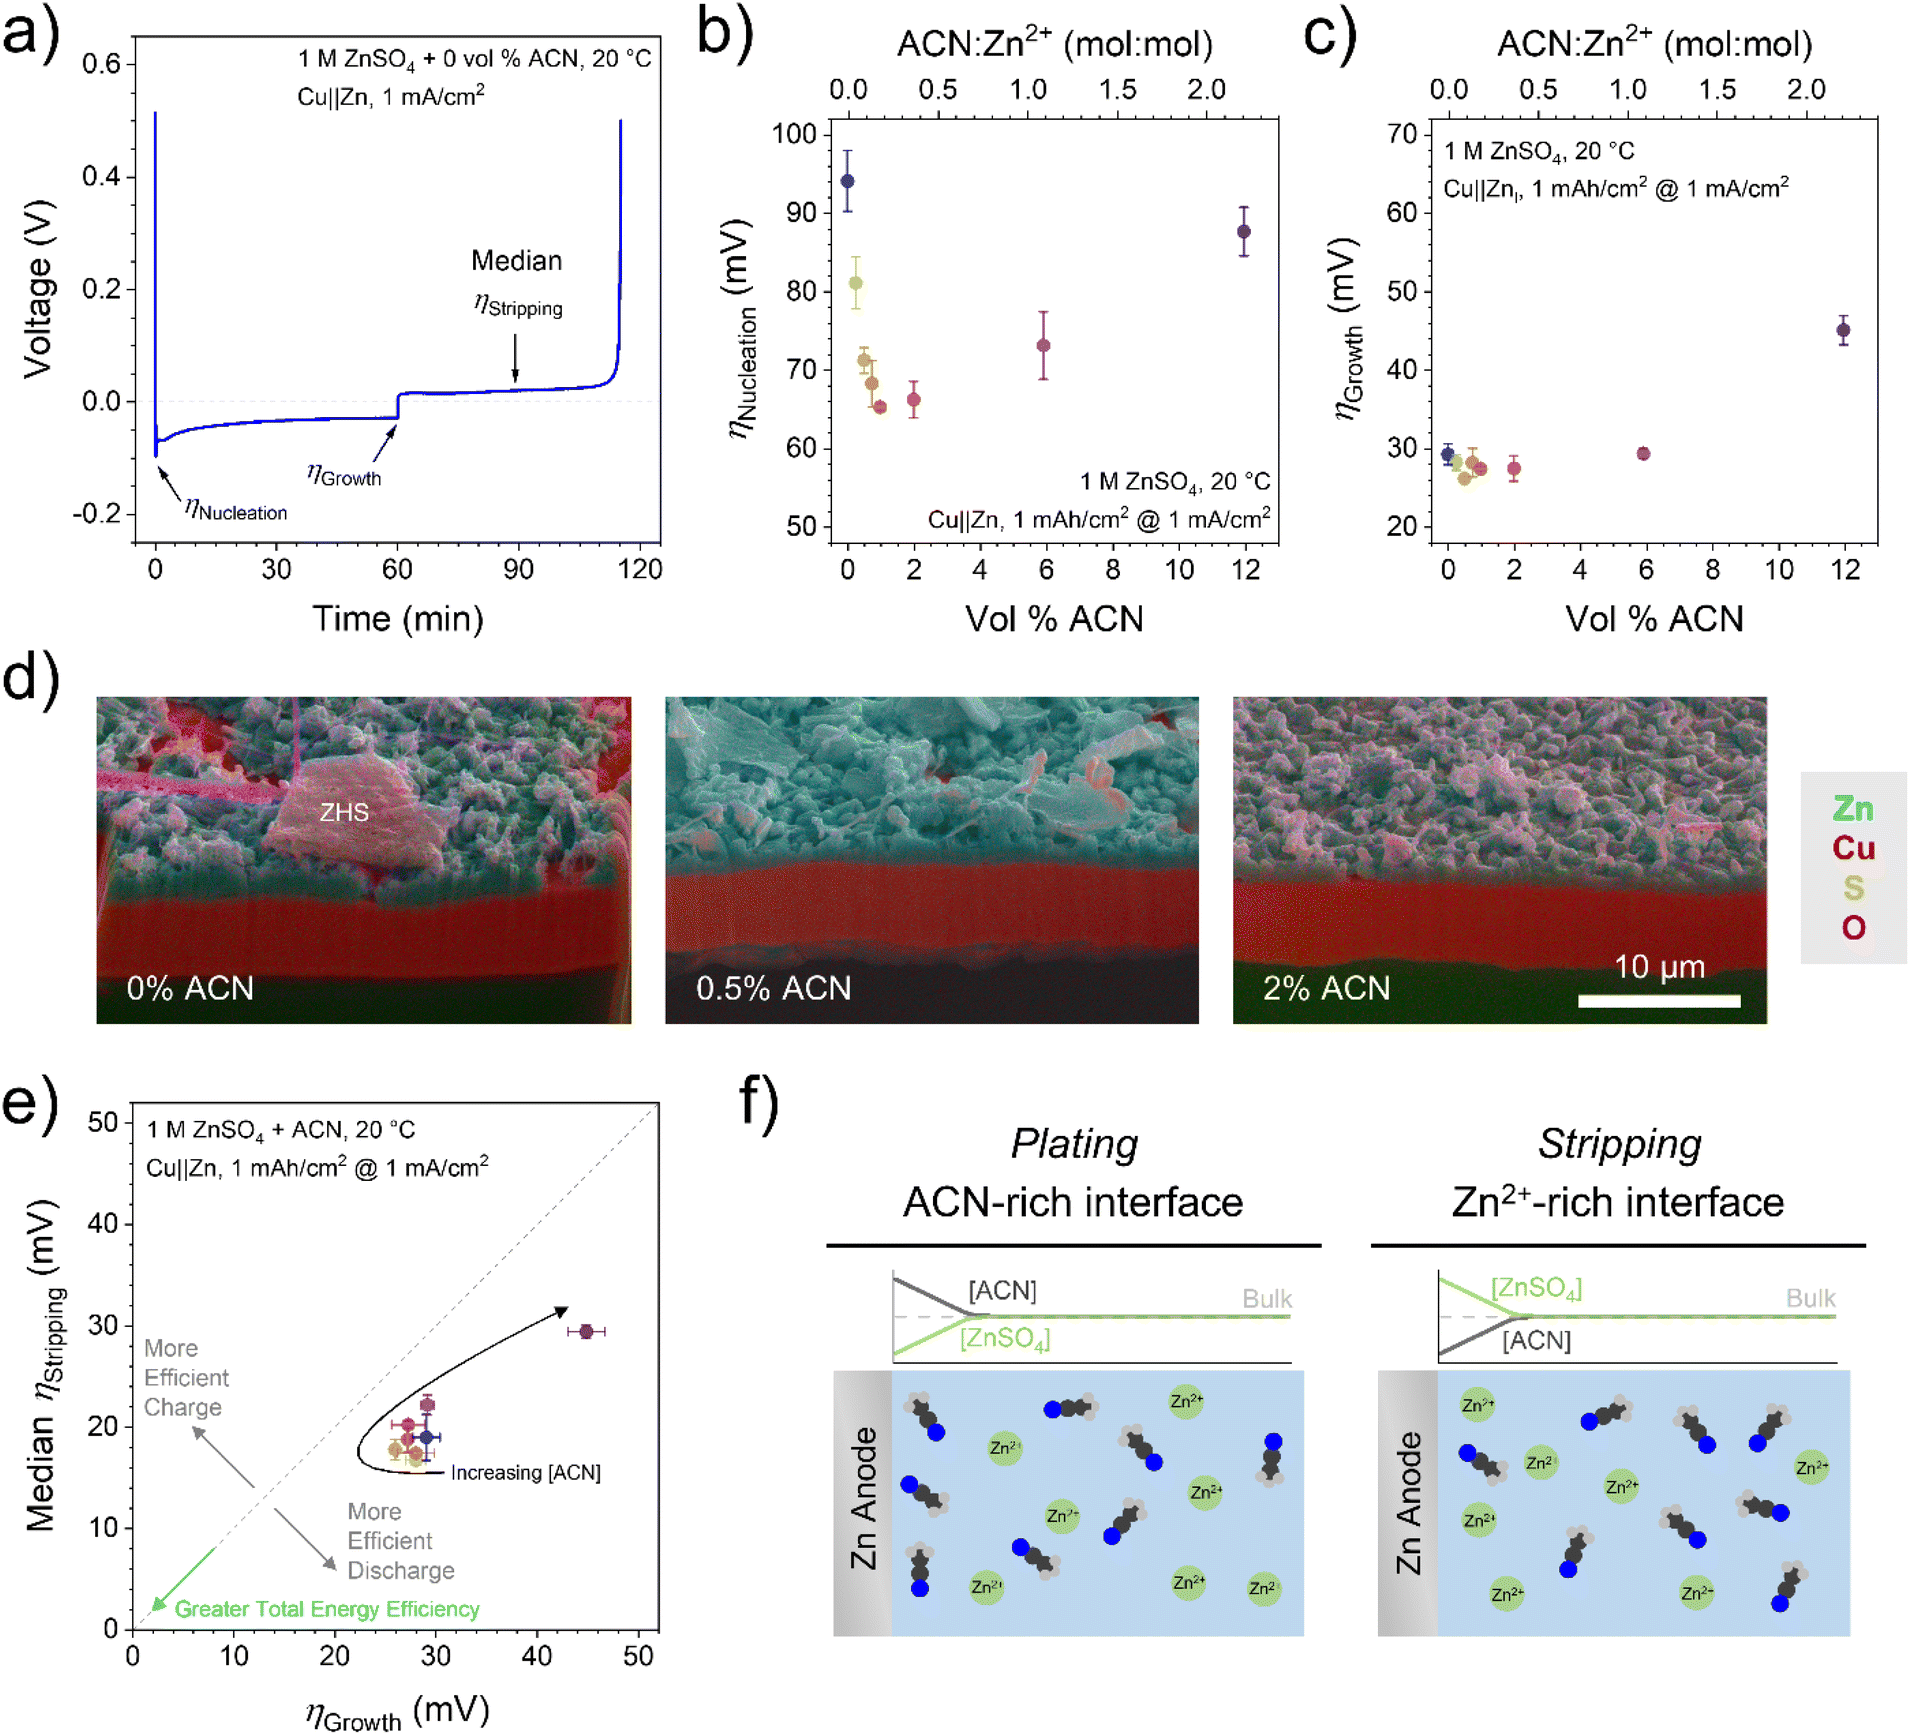 | ||
| Fig. 1 (a) Galvanostatic cycling of a Cu‖Zn half cell with overpotentials noted on the graph. (b) Nucleation overpotentials as a function of ACN content in the first cycle. (c) Growth overpotentials as a function of ACN content in the first cycle. (d) SEM-EDX cross-section images of plated Zn on Cu electrodes after 100 plating/stripping steps for 0, 0.5, and 2 vol% ACN in 1 M ZnSO4 electrolyte. (e) Comparison of stripping and growth overpotentials from Cu‖Zn half cells in the first cycle from 0–12 vol% ACN. The gray dashed line shows 1:1 parity; colors denote ACN content as in (b) and (c). (f) Qualitative depiction of ZnSO4 and antisolvent concentration during plating and stripping at the Zn anode. | ||
To observe low-[ACN] effects on long-term Zn morphology, SEM-FIB was performed on Cu electrodes samples cycled 100 times before final plating and analysis. As apparent in Fig. 1d and S1,† 0.5–2 vol% ACN results in more even, contiguous Zn growth compared to the purely aqueous electrolyte. Along with reduced overpotentials, this may also be due to reduced HER rates which limit Zn corrosion, as explored previously.28
Lowering overpotentials is also critical for practical battery applications, where energy efficiency is determined by overvoltage losses. For Zn anodes, this is driven by growth overpotentials during charging and stripping overpotentials during discharging. Fig. 1e shows that with increasing ACN concentration, both overpotentials initially decrease (resulting in greater total energy efficiency) before increasing above the pure aqueous electrolyte. Lowering overpotentials for Zn plating also reduces electrochemical HER rates by keeping anode potentials more positive, consistent with our X-ray diffraction (XRD) results (vide infra). Interestingly, all the points show lower median stripping overpotentials than growth overpotentials (this is not due to shifting potentials at the Zn counter/reference electrode; see ESI†). Especially at high ACN concentration, there is a lower barrier for stripping than plating relative to the purely aqueous electrolyte (Fig. S2†). This is advantageous for grid-storage applications, as the discharge process is more efficient with this antisolvent additive. While the anode overpotential is higher during charging, the projected low cost of renewable energy sources34 makes it viable to use additional energy on charging as long as the battery delivers excellent energy efficiency on discharge.
The proposed mechanism behind this observation is shown in Fig. 1f. During Zn plating, Zn2+ is consumed at the electrode surface, so the local ZnSO4 concentration decreases, allowing more antisolvent into that space as it is no longer excluded by the salt-rich environment. With more antisolvent adsorbing onto the electrode and/or displacing Zn2+ in the double layer, plating overpotentials increase as with higher [ACN] in Fig. 1b and c. ACN has previously been shown to not participate or have minimal impact in the formation of solid electrolyte interphase layer.35,36 Conversely, during stripping, Zn2+ is released into the near-surface solution, excluding antisolvent molecules even more and resembling low-ACN concentration trends.
Another important consideration for battery health is CE at the Zn anode. Zn loss via HER or dead Zn formation during the plating–stripping process lowers the available charge in the cell,37 decreasing battery lifetime and possibly increasing overvoltage. While individual plate–strip cycles in Cu‖Zn half cells virtually always show >99% CE after the first several cycles (Fig. S3†), cumulative coulombic efficiency (CCE) shows the total zinc loss over time, revealing more accurate trends with varied electrolyte or cell conditions.28,38
Fig. 2a shows CCEs for Cu‖Zn half cells over 100 cycles with 0–12 vol% ACN, with a depth of discharge (DoD) of 100%. Notably, the variation between cells with the same electrolyte is often greater than the variation between electrolyte conditions; still, some trends are apparent. After 10 cycles (Fig. 2b), the CCE is maximized at 0.5–2 vol% ACN, in line with the optimized overpotentials in Fig. 1. After 100 cycles (Fig. 2c), however, the only [ACN] trend is that adding any ACN concentration generally improves CCE above the pure aqueous electrolyte, in agreement with our previous results.28
 | ||
| Fig. 2 (a) Cumulative coulombic efficiency (CCE) over 100 cycles for Cu||Zn cells with 0–12 vol% ACN. Lines represent CCE averages of multiple cells, and average standard deviations are included in the table inset. (b) CCE after 10 cycles. (c) CCE after 100 cycles. (d) SEM-EDX of plated Zn on Cu electrodes after 100 plating/stripping steps for 0, 0.5, and 2 vol% ACN in 1 M ZnSO4 electrolyte. | ||
Zn loss can occur via dead Zn formation or through corrosion (which leads to ZHS formation).37 Scanning electron microscopy with energy dispersive X-ray spectroscopy (SEM-EDX) images after 100 cycles (Fig. 2d, S4 and S5†) show that the ZHS coverage and morphology varies drastically from 0 to 0.5 vol% ACN, with ZHS crystals becoming flatter and more dispersed with the small ACN addition. At 2 vol% ACN, the ZHS becomes even more dispersed over a wider range, indicating that charge loss through Zn corrosion is reduced by low ACN concentrations, consistent with our XRD below. Since CCE is comparable at 100 cycles despite these massive changes to ZHS coverage, dead Zn formation may be the main charge loss mechanism in these cells. This is most likely driven by practical considerations like cell pressure39 and separator design40 that overpower antisolvent effects in the long-term.
ACN-driven changes in Zn and ZHS at a macroscopic level drove explorations into changes in the atomic structure. XRD was performed ex situ on Cu electrodes after one plating step (1 cycle) and after 100 plating–stripping steps with a final plate (100 cycles) to identify ZHS phases and Zn crystallographic texturing (Fig. 3a). Antisolvent concentrations of 0.5, 2, 12 vol% ACN and 12 vol% methanol (MeOH, a similar antisolvent with an H-bonding alcohol group instead of a nitrile)41 were used. First, the counts per second diffracted intensity (Fig. S6†) and total ZHS peak area (Fig. 3c) of 100 cycles is much higher than 1 cycle, showing that ZHS accumulated over time and does not passivate the Zn surface.42,43Fig. 3c shows that adding antisolvent decreases ZHS amount, and this amount is dynamic depending on whether the electrode last underwent plating or stripping. Second, one cycle samples show that with any addition of antisolvent, the ZHS shifts to a less hydrated structure (greater 2θ, Fig. 3b). The absence of this shift after 100 cycles indicates the ZHS structure is most dependent on antisolvent additions during the initial cycling stages. Third, 100 cycle samples show two ZHS structures of different hydration levels, ZHS·4H2O and ZHS·3H2O, while one cycle samples show only the ZHS·4H2O structure. This suggests various ZHS structures are formed during longer cycling, but in situ measurements are required to confirm this. Finally, at 12 vol% ACN and MeOH, there are clear differences in the ZHS amount and structure (Fig. 3b and c), showing antisolvent strength, H-bonding, or other chemical differences can influence ZHS growth over time. While ZHS is not a directly active component in ZIBs, its structure affects interfacial ion transport and/or local pH changes10,12,13 and influence HER rates. The dynamics of ZHS demonstrated here should be considered in this context.
 | ||
| Fig. 3 (a) XRD pattern of a Cu electrode after 100 plate/strip cycles with 0 vol% ACN and identified peaks. (b) XRD patterns after one plating step (light lines) and 100 plate/strip cycles followed by one plate (dark lines) for different antisolvent concentrations, normalized by maximum intensity of the ZHS peaks. (c) Fit peak area for both ZHS peaks in (b) with antisolvent concentrations after plate and strip steps following 1 and 100 cycles. (d) Comparison of Zn(002) and Zn(100) peaks after 100 cycles and plate step for different antisolvent concentrations; colors match those in (b). (e) Structure factor-corrected peak area ratios of Zn(002) relative to Zn(100) with antisolvent concentrations following 1 and 100 cycles. | ||
Plated zinc metal textures were compared using the ratios of Zn(002) and Zn(100) XRD peaks (Fig. 3d), normalized by the structure factors and Lorentz-polarization factor (see ESI†). For a non-textured zinc film, the Zn(002):Zn(100) ratio is 1. Though all concentrations of ACN show Zn(100) texturing, low amounts of ACN (0.5–2 vol%) shift the texturing towards more Zn(002) after the first plating step and after 100 cycles (Fig. 3e). This aligns with lower plating overpotentials and lower amounts of ZHS, indicating this is the optimal ACN concentration for Zn anodes. Zn(002) is considered the preferred facet for promoting uniform Zn growth and decreasing ZHS formation,42,44,45 and these results indicate that antisolvents (albeit to small extents for ACN) can affect this variably with concentration.
3.2 Effect of ACN on MnO2 cathode
While most electrolyte additive studies focus on improving performance of the zinc anode, relatively little attention is paid to the cathode, where full cells are typically studied only with the anode-optimized electrolyte. The type of cathode matters, as inorganic cathodes can be pH-sensitive and experience metal dissolution while organic cathodes must combat solubility and charged state stability. We studied MnO2 for the reasons listed earlier.5,6 δ-MnO2 nanostructured particles were synthesized according to previous reports11,46 and slurry coated onto Ti current collectors with areal loadings of 4–6 mgMnO2 cm−2 (Table S1†). Full cells with Zn foil anodes were constructed under more electrolyte-lean conditions than the half cells used above (∼12 mL gMnO2−1) to better illustrate any challenges with electrolyte depletion in full cells. ACN concentrations of 0 to 18 vol% (the maximum amount before phase separation) were used, with a DoD of 36.5%. The voltage window was 0.9 V discharge limit to 1.9 V charge limit to prevent excessive Mn2+ dissolution and oxygen evolution, respectively.11,16,47Fig. 4a shows charge–discharge curves of the 5th and 50th cycles during repeated cycling at 0.1 A gMnO2−1. Across the entire [ACN] range, the voltage profiles have similar shapes and the same change in shape over time. Capacity fading is also similar (Fig. 4b), indicating ACN may have much less impact on the cathode than the anode. The loss of voltage plateau features by the 50th cycle (Fig. 4a) indicates degradation of the MnO2 cathode. Mn2+ dissolution and redeposition followed by Zn2+ intercalation into tunnel-like electrolytic MnOx is known to lower the capacity of channel-like δ-MnO2 cathodes.11,16,48 We hypothesize that the cell degradation due to Mn dissolution outcompetes the improvement on the anode due to ACN addition.
 | ||
| Fig. 4 (a) Galvanostatic charge–discharge curves of Zn‖MnO2 full cells for 0–18 vol% ACN in 1 M ZnSO4 in the 5th (left) and 50th (right) cycles at 0.1 A gMnO2−1. (b) Discharge capacities from 0.1 to 2.0 A gMnO2−1 for representative cells; colors correspond to ACN concentrations noted in (a). (c) XRD of MnO2 cathodes after 100 cycles in the charged and discharged states for 0 and 10 vol% ACN. Non-labeled peaks are ZHS formed on the Zn anode and transferred to the cathode. (d) Structure factor-corrected ratios of δ-MnO2 to Zn1.67Mn1.33O4 from XRD data. | ||
XRD was employed on isolated cathodes after 100 cycles to investigate if ACN affects stability. Fig. 4c and S7† show XRD of discharged and charged cathodes. Small amounts of δ-MnO2 remain in both charged states, indicating some inaccessible active material. The majority identified species was Zn1.67Mn1.33O4. Since Zn2+-intercalated MnOx structures are less electrochemically reversible than simple (de-)intercalation with δ-MnO2 and present lower capacities due to incomplete oxidation of all Mn-ions to Mn4+, this structure represents the origin of capacity fade in the cells over time.
Fig. 4d shows the relative amounts of these two phases versus ACN concentration. δ-MnO2 content in discharged cells increases with ACN concentration, suggesting that acetonitrile slows or partially suppresses the transformation to Zn1.67Mn1.33O4 during cycling. This is likely due to reduced water activity in ACN-containing electrolytes, which mitigates conversion to spinel phases.
However, while more δ-MnO2 is preserved at high ACN concentrations, the phase reversibility between charge and discharge decreases with increasing ACN concentration. At low ACN levels (0.5–2 vol%), the δ-MnO2/Zn1.67Mn1.33O4 ratio increases in the charged state, suggesting improved phase reversibility. This may be due to a favourable balance between suppressed conversion reactions and retained Zn2+ mobility. Interestingly, at 0% ACN, the trend is reversed: more δ-MnO2 is observed in the discharged state, which indicates some degree of reversibility, but along a different pathway.
At higher ACN levels (10–18 vol%), despite higher overall δ-MnO2 content, the δ-MnO2/Zn1.67Mn1.33O4 ratio is less dependent on the charged or discharged state, indicating lower reversibility. This could result from hindered Zn2+ de-insertion or sluggish redox kinetics due to decreased water content and altered solvation environment. Additionally, at high ACN concentrations, the electrolyte may undergo nanoscale phase separation or ACN clustering, leading to local inhomogeneities. As a result, δ-MnO2 formed during cycling could be embedded within inactive domains, reducing the apparent phase reversibility.
Supporting this interpretation, conductivity measurements (Fig. S8†) show a modest increase in ionic conductivity at 0.5 vol% ACN, suggesting enhanced Zn2+ mobility at low ACN concentrations. This aligns with the improved phase reversibility observed at 0.5–2 vol% ACN, where the phase reversibility of δ-MnO2 and Zn1.67Mn1.33O4 is increased.
Importantly, across all ACN concentrations, the dominant phase observed remains Zn1.67Mn1.33O4, with only small fractions of δ-MnO2 detected, concluding that irreversible conversion and Mn2+-driven reprecipitation still dictate the long-term cathode chemistry. Thus, while ACN modulates the phase evolution, it does not eliminate the primary degradation mechanism.
Given that ACN does not prevent MnO2 degradation, its effect on shorter-term battery energy efficiency was investigated next. Zn‖MnO2 full cells were cycled at currents of 0.1–2.0 A gMnO2−1 (Fig. 5a), and their capacity retention was quantified in Fig. 5b. Cells with no ACN show greater capacity than those with ACN, but the trend between ACN concentration and capacity is not linear. Cells with 0.5 and 10 vol% ACN show capacities close to purely aqueous electrolytes, while 18 vol% ACN is significantly hindered. (Multiple cells with 2 vol% ACN showed lower-than-expected capacities, possibly due to cathode wetting or delamination issues under these rate tests.) All cells showed significant decreases in accessible capacity with increased current density, but this was mostly reversible (<10% decrease) when returning to lower currents.
 | ||
| Fig. 5 (a) Example voltage profiles of a Zn‖MnO2 full cell (0% ACN) at different current densities. (b) Discharge capacities from 0.1 to 2.0 A gMnO2−1 for representative cells. Cathode loadings were around 5 mgMnO2 cm−2, corresponding to areal current densities ranging from 0.5–10 mA cm−2. (c) Energy efficiency as a function of current density and effective C-rate. (d) Differential capacity curves based of representative cells at 0.1 A gMnO2−1. (e) Voltage hysteresis of the O1–R1 and O2–R2 dQ/dV peaks as a function of ACN content. Overvoltage contributions from the Zn anode were subtracted based on estimates from the data in Fig. 1 for a given [ACN] and corrected for the lower current densities used here. (f) Example voltage profiles showing charge–discharge cycles with a 12 h open circuit rest period after every fifth charge cycle at 0.1 A gMnO2−1. (g) Open circuit voltage at the end of the rest period over 50 cycles (10 total rest periods). (h) Nominal and relative decreases in the discharge capacity from the first cycle to the final discharge after the tenth rest period as a function of ACN content. | ||
Overvoltages in the cells also vary with [ACN], which impacts the energy efficiency (EE) of the battery, i.e., total discharge vs. total charge energy. Fig. 5c compares energy efficiency vs. effective C-rate for 0–18 vol% ACN. No cell achieves above 87% EE, with continuous drops with increasing current density. As with discharge capacity, 0 vol% ACN performs the best, and EE drops with increasing [ACN].
To understand the origin of energy efficiency losses apart from capacity, differential capacity curves were analyzed at 0.1 A gMnO2−1. Fig. 5d shows two distinct peaks on charge (O1 & O2) and discharge (R2 & R1). The potentials of these peaks are quantified in Fig. S9,† and the voltage hysteresis (i.e., overvoltage determined by the difference between peaks) is shown in Fig. 5e. Cells with 0 vol% ACN have the lowest overvoltages for both O1–R1 and O2–R2 processes, and these only increase with increasing [ACN], in line with EE trends. Voltage increases with ACN concentration are much higher than those seen with anodes alone, implying that most of the overpotential comes from the MnO2 cathode and higher [ACN] negatively impacts the cathode more. To isolate this ACN effect, growth and stripping overpotentials at each [ACN] were estimated from the data in Fig. 1 and subtracted from the nominal data to yield an effective cathode overpotential (red points in Fig. 5e). Interestingly, there is a steep climb in overvoltage with low ACN concentration, but a plateau is formed at high ACN amounts. This points to an interface-dominated mechanism like adsorption at the cathode, but there is no overpotential benefit in the case of MnO2 compared to Zn plating and stripping.
Finally, it is important to simulate rest periods (calendar aging) that a practical battery would experience.37,49Fig. 5f shows a simple charge–discharge protocol with 12 h open circuit hold implemented after every fifth charge cycle, followed by a discharge step. This protocol was repeated ten times following the C-rate tests in Fig. 5b. The energy delivered after extended rest is dependent on two factors: voltage and capacity. Fig. 5g tracks the open circuit voltage (OCV) of the cells following the 12 h hold steps. Despite having higher initial OCVs, cells with 0, 0.5, and 18 vol% ACN show faster decline as the cell ages (∼150 mV drop over 50 cycles), while 2 and 10 vol% ACN show minimal losses over the same time (<50 mV). This trend is mostly replicated in the discharge capacity fade over time, shown in Fig. 5h. Over 50 cycles, the purely aqueous electrolyte shows the highest total capacity fade (over 100 mA h gMnO2−1), and adding ACN lowers this loss with a local minimum at 10 vol% ACN. After normalizing capacity fade to initial capacities, this trend still holds, although there are only marginal differences from 0–10 vol% ACN (39–47% capacity loss). Surprisingly, 18 vol% ACN showed significant capacity losses over 50%. In agreement with Fig. 4, this shows that ACN does not prevent metal dissolution even at the highest possible concentrations and points to another avenue of electrolyte design to prevent cathode dissolution, in addition to common approaches like purposeful addition of Mn salts.11,12 This demonstrates the intricate nature of antisolvent behavior on all parts of the battery and that the cathode (which determines the energy density of the battery much more than the Zn anode in practical systems) should not be neglected in favor of optimizing Zn metal plating.
4. Conclusions
In conclusion, we have demonstrated that an antisolvent additive, acetonitrile, produces highly variable effects on different interfaces in Zn–MnO2 batteries with ZnSO4 electrolytes. Low [ACN] (0.5–2 vol%) have the lowest nucleation, growth, and stripping overpotentials at the Zn anode before higher ACN concentration increases them. Stripping overpotentials are consistently lower than growth overpotentials, an effect exacerbated by the antisolvent due to local concentration gradients during stripping vs. plating. This affects the morphology of plated zinc, with noticeably denser Zn deposits for low ACN amounts compared to the aqueous baseline. The long-term coulombic efficiency of the Zn anode is relatively insensitive to ACN concentration. This implies that despite significantly different ZHS morphologies and coverage, dead Zn formation and not corrosion is the primary cause of capacity loss at the anode. XRD shows that ZHS, much like Zn metal, is not a static byproduct from Zn corrosion. The amount and structure of ZHS varies significantly over time in Zn‖Cu half cells, with antisolvent concentration and chemistry, and whether the electrode was plated or stripped. At the cathode, despite some preservation of δ-MnO2 at higher ACN concentrations, phase reversibility is highest at low ACN levels (0.5–2 vol%), suggesting a balance between suppressed conversion and retained Zn2+ mobility. However, irreversible formation of Zn1.67Mn1.33O4 remains the dominant cathode degradation pathway. In full cell testing, the improvements on the anode with ACN are insignificant compared to the cathode degradation, concluding that the cathode is the limiting electrode in full cell performance. Overvoltages increase non-linearly with ACN content, while resting voltage drop and capacity fade are minimized at 10 vol% but surprisingly maximized at 18 vol% ACN. While the fundamental physicochemical reasons behind these trends are unknown, this work highlights the need for careful analysis of additive effects on anodes, cathodes, and interfacial byproducts over cell lifetime. One antisolvent alone is unlikely to improve every aspect of battery performance, so future works should explore the interface effects of multi-component electrolytes with complementary additives.Data availability
The authors confirm that the data supporting the findings of this study are available within the article [and/or] its ESI.† Should any raw data files be needed in another format they are available from the corresponding author upon reasonable request.Author contributions
Michael J. Counihan: conceptualization, methodology, investigation, validation, resources, writing-original draft, and visualization. Lacey Roberts: methodology, investigation, validation, resources, writing-review and editing. Yingjie Yang: methodology, investigation and writing-review and editing. Stefan Ilic: investigation and writing-review and editing. Claire Ely: investigation and writing-review and editing. Robert F. Klie: writing-review and editing, supervision. Michael F. Toney: writing-review and editing, supervision. Sanja Tepavcevic: writing-review and editing, supervision, project administration, and funding acquisition.Conflicts of interest
There are no conflicts to declare.Acknowledgements
This work was supported as part of the Joint Center for Energy Storage Research (JCESR), an Energy Innovation Hub funded by the U.S. Department of Energy (DOE), Office of Science, Basic Energy Sciences. Electrochemical measurements were performed at the Electrochemical Discovery Laboratory, a JCESR facility at Argonne National Laboratory. L. S. R. acknowledges funding from the National Science Foundation Graduate Research Fellowship Program under Grant No. DGE 2040434. This research was supported in part by the Colorado Shared Instrumentation in Nanofabrication and Characterization (COSINC): the COSINC-CHR (Characterization), College of Engineering & Applied Science, University of Colorado Boulder. The authors would like to acknowledge the support of the staff Nicholas Weadock and the facility that have made this work possible. This work made use of the ThermoFisher Helios 5CX (cryo)FIB-SEM instrument in the Electron Microscopy Core of UIC's Research Resources Center, which received support from UIC, Northwestern University, and ARO (W911NF2110052).References
- Z. Zhu, T. Jiang, M. Ali, Y. Meng, Y. Jin, Y. Cui and W. Chen, Chem. Rev., 2022, 122, 16610–16751 CrossRef CAS PubMed.
- L. E. Blanc, D. Kundu and L. F. Nazar, Joule, 2020, 4, 771–799 CrossRef CAS.
- T. Mageto, S. D. Bhoyate, K. Mensah-Darkwa, A. Kumar and R. K. Gupta, J. Energy Storage, 2023, 70, 108081 CrossRef.
- M. Yan, H. Ni and H. Pan, Adv. Energy Sustainability Res., 2020, 1, 2000026 CrossRef.
- E. D. Spoerke, H. Passell, G. Cowles, T. N. Lambert, G. G. Yadav, J. Huang, S. Banerjee and B. Chalamala, MRS Energy & Sustainability, 2022, 9, 13–18 Search PubMed.
- G. G. Yadav, D. Turney, J. Huang, X. Wei and S. Banerjee, ACS Energy Lett., 2019, 4, 2144–2146 CrossRef CAS.
- C. Liu, X. Xie, B. Lu, J. Zhou and S. Liang, ACS Energy Lett., 2021, 6, 1015–1033 CrossRef CAS.
- W. Lu, C. Zhang, H. Zhang and X. Li, ACS Energy Lett., 2021, 6, 2765–2785 CrossRef CAS.
- J. Chen, W. Zhao, J. Jiang, X. Zhao, S. Zheng, Z. Pan and X. Yang, Energy Storage Mater., 2023, 59, 102767 CrossRef.
- W.-G. Lim, X. Li and D. Reed, Small Methods, 2024, 8, 2300965 CrossRef CAS PubMed.
- N. Becknell, P. P. Lopes, T. Hatsukade, X. Zhou, Y. Liu, B. Fisher, D. Y. Chung, M. G. Kanatzidis, N. M. Markovic, S. Tepavcevic and V. R. Stamenkovic, Adv. Funct. Mater., 2021, 31, 2102135 CrossRef CAS.
- H. Chen, C. Dai, F. Xiao, Q. Yang, S. Cai, M. Xu, H. J. Fan and S.-J. Bao, Adv. Mater., 2022, 34, 2109092 CrossRef CAS.
- K.-H. Ha, H. Moon, E. J. Joo, D. H. Jo and K. T. Lee, Energy Storage Mater., 2024, 65, 103150 CrossRef.
- T.-H. Wu, Y.-Q. Lin, Z. D. Althouse and N. Liu, ACS Appl. Energy Mater., 2021, 4, 12267–12274 CrossRef CAS.
- H. Moon, K.-H. Ha, Y. Park, J. Lee, M.-S. Kwon, J. Lim, M.-H. Lee, D.-H. Kim, J. H. Choi, J.-H. Choi and K. T. Lee, Adv. Sci., 2021, 8, 2003714 CrossRef CAS.
- T. N. T. Tran, S. Jin, M. Cuisinier, B. D. Adams and D. G. Ivey, Sci. Rep., 2021, 11, 20777 CrossRef CAS.
- I. A. Rodríguez-Pérez, H. J. Chang, M. Fayette, B. M. Sivakumar, D. Choi, X. Li and D. Reed, J. Mater. Chem. A, 2021, 9, 20766–20775 RSC.
- Y. Lv, Y. Xiao, L. Ma, C. Zhi and S. Chen, Adv. Mater., 2022, 34, 2106409 CrossRef CAS.
- L. Li, S. Yue, S. Jia, C. Wang, H. Qiu, Y. Ji, M. Cao and D. Zhang, Green Chem., 2024, 26, 5004–5021 RSC.
- L. Cao, D. Li, E. Hu, J. Xu, T. Deng, L. Ma, Y. Wang, X.-Q. Yang and C. Wang, J. Am. Chem. Soc., 2020, 142, 21404–21409 CrossRef CAS PubMed.
- Y. Zhu, J. Hao, Y. Huang and Y. Jiao, Small Struct., 2023, 4, 2200270 CrossRef CAS.
- T. Wei, Y. Ren, Y. Wang, L. e. Mo, Z. Li, H. Zhang, L. Hu and G. Cao, ACS Nano, 2023, 17, 3765–3775 CrossRef CAS.
- W. He, Y. Ren, B. S. Lamsal, J. Pokharel, K. Zhang, P. Kharel, J. J. Wu, X. Xian, Y. Cao and Y. Zhou, ACS Appl. Mater. Interfaces, 2023, 15, 6647–6656 CrossRef CAS.
- V. Verma, R. M. Chan, L. Jia Yang, S. Kumar, S. Sattayaporn, R. Chua, Y. Cai, P. Kidkhunthod, W. Manalastas Jr and M. Srinivasan, Chem. Mater., 2021, 33, 1330–1340 CrossRef CAS.
- C. Huang, X. Zhao, Y. Hao, Y. Yang, Y. Qian, G. Chang, Y. Zhang, Q. Tang, A. Hu and X. Chen, Energy Environ. Sci., 2023, 16, 1721–1731 RSC.
- L. Hong, J. Guan, Y. Tan, Y. Chen, Y.-S. Liu, W. Huang, C. Yu, Y. Zhou, J.-S. Chen and K.-X. Wang, Energy Environ. Sci., 2024, 17, 3157–3167 RSC.
- D. Xie, Y. Sang, D.-H. Wang, W.-Y. Diao, F.-Y. Tao, C. Liu, J.-W. Wang, H.-Z. Sun, J.-P. Zhang and X.-L. Wu, Angew. Chem., Int. Ed., 2023, 62, e202216934 CrossRef CAS PubMed.
- S. Ilic, M. J. Counihan, S. N. Lavan, Y. Yang, Y. Jiang, D. Dhakal, J. Mars, E. N. Antonio, L. Kitsu Iglesias, T. T. Fister, Y. Zhang, E. J. Maginn, M. F. Toney, R. F. Klie, J. G. Connell and S. Tepavcevic, ACS Energy Lett., 2024, 9, 201–208 CrossRef CAS PubMed.
- Y. Wang, Z. Wang, W. K. Pang, W. Lie, J. A. Yuwono, G. Liang, S. Liu, A. M. D. Angelo, J. Deng, Y. Fan, K. Davey, B. Li and Z. Guo, Nat. Commun., 2023, 14, 2720 CrossRef CAS PubMed.
- Y. Dong, L. Miao, G. Ma, S. Di, Y. Wang, L. Wang, J. Xu and N. Zhang, Chem. Sci., 2021, 12, 5843–5852 RSC.
- C. Li, S. Jin, L. A. Archer and L. F. Nazar, Joule, 2022, 6, 1733–1738 CrossRef.
- S. Ilic, M. J. Counihan, S. N. Lavan, Y. Yang, Y. Jiang, D. Dhakal, J. Mars, E. N. Antonio, L. Kitsu Iglesias and T. T. Fister, ACS Energy Lett., 2023, 9, 201–208 CrossRef PubMed.
- X. Yu, Z. Li, X. Wu, H. Zhang, Q. Zhao, H. Liang, H. Wang, D. Chao, F. Wang, Y. Qiao, H. Zhou and S.-G. Sun, Joule, 2023, 7, 1145–1175 CrossRef CAS.
- W. Cole, B. Frew, P. Gagnon, A. Reimers, J. Zuboy and R. Margolis, Energy, 2018, 155, 690–704 CrossRef.
- A. S. Etman, M. Carboni, J. Sun and R. Younesi, Energy Technol., 2020, 8, 2000358 CrossRef CAS.
- Z. Wu, Y. Li, A. Amardeep, Y. Shao, Y. Zhang, J. Zou, L. Wang, J. Xu, D. Kasprzak and E. J. Hansen, Angew. Chem., 2024, 136, e202402206 CrossRef.
- B. Liu, X. Yuan and Y. Li, ACS Energy Lett., 2023, 8, 3820–3828 CrossRef CAS.
- K. L. Bassett, K. A. Small, D. M. Long, L. C. Merrill, B. Warren and K. L. Harrison, Front. Batter. Electrochem., 2023, 2, 1292639 CrossRef.
- Y. Li, C. B. Musgrave III, M. Y. Yang, M. M. Kim, K. Zhang, M. Tamtaji, Y. Cai, T. W. Tang, J. Wang, B. Yuan, W. A. Goddard III and Z. Luo, Adv. Energy Mater., 2024, 14, 2303047 CrossRef CAS.
- Y. Zhang, G. Yang, M. L. Lehmann, C. Wu, L. Zhao, T. Saito, Y. Liang, J. Nanda and Y. Yao, Nano Lett., 2021, 21, 10446–10452 CrossRef CAS.
- J. Hao, L. Yuan, C. Ye, D. Chao, K. Davey, Z. Guo and S.-Z. Qiao, Angew. Chem., Int. Ed., 2021, 60, 7366–7375 CrossRef CAS PubMed.
- J. Wang, B. Zhang, Z. Cai, R. Zhan, W. Wang, L. Fu, M. Wan, R. Xiao, Y. Ou, L. Wang, J. Jiang, Z. W. Seh, H. Li and Y. Sun, Sci. Bull., 2022, 67, 716–724 CrossRef CAS.
- W. Yuan, G. Ma, X. Nie, Y. Wang, S. Di, L. Wang, J. Wang, S. Shen and N. Zhang, Chem. Eng. J., 2022, 431, 134076 CrossRef CAS.
- Y. Xin, J. Qi, Y. Ge, B. He, F. Zhang, S. Wang and H. Tian, Energy Fuels, 2024, 38, 10275–10286 CrossRef CAS.
- M. Zhou, S. Guo, J. Li, X. Luo, Z. Liu, T. Zhang, X. Cao, M. Long, B. Lu, A. Pan, G. Fang, J. Zhou and S. Liang, Adv. Mater., 2021, 33, 2100187 CrossRef CAS.
- S.-D. Han, S. Kim, D. Li, V. Petkov, H. D. Yoo, P. J. Phillips, H. Wang, J. J. Kim, K. L. More, B. Key, R. F. Klie, J. Cabana, V. R. Stamenkovic, T. T. Fister, N. M. Markovic, A. K. Burrell, S. Tepavcevic and J. T. Vaughey, Chem. Mater., 2017, 29, 4874–4884 CrossRef CAS.
- O. Rubel, T. N. T. Tran, S. Gourley, S. Anand, A. Van Bommel, B. D. Adams, D. G. Ivey and D. Higgins, J. Phys. Chem. C, 2022, 126, 10957–10967 CrossRef CAS.
- D. Wang, L. Wang, G. Liang, H. Li, Z. Liu, Z. Tang, J. Liang and C. Zhi, ACS Nano, 2019, 13, 10643–10652 CrossRef CAS PubMed.
- J. Sun, J. Zhang, S. Wang, P. Sun, J. Chen, Y. Du, S. Wang, I. Saadoune, Y. Wang and Y. Wei, Energy Environ. Sci., 2024, 17, 4304–4318 RSC.
Footnote |
| † Electronic supplementary information (ESI) available. See DOI: https://doi.org/10.1039/d5ta00951k |
| This journal is © The Royal Society of Chemistry 2025 |