 Open Access Article
Creative Commons Attribution 3.0 Unported Licence
Mechanisms of interaction between bismuth-based materials and contaminants for subsurface remediation†
Carolyn I. Pearce *a,
Daria Boglaienko
 *a,
Amanda R. Lawter
 a,
Elsa A. Cordova
 a,
Kirk J. Cantrella,
Mark E. Bowden
 a,
Nabajit Lahiri
 a,
Odeta Qafoku
 a,
Sebastian T. Mergelsberg
 a,
Charles T. Rescha,
Ferdinan Cintron Colona,
Vanessa A. Garayburu-Caruso
 a,
Nicolas D'Annunzio
 a,
Mahalingam Balasubramanian
 b,
Sarah A. Saslow
 a,
Nikolla P. Qafoku
 ac,
Vicky L. Freedmana and
Tatiana G. Levitskaia
 *a
*a
aPacific Northwest National Laboratory, P. O. Box 999, 902 Battelle Boulevard, Richland, WA 99352, USA. E-mail: carolyn.pearce@pnnl.gov
bAdvanced Photon Source, Argonne, IL 60439, USA
cDepartment of Civil andEnvironmental Engineering, University of Washington, Seattle, WA 98195, USA
First published on 23rd April 2025
Abstract
Successful deployment of in situ subsurface remediation strategies requires knowledge of contaminant geochemistry, and the impact of physicochemical sediment properties on remedy performance. Bismuth (Bi) materials can sequester multiple contaminants that are present in the unsaturated zone and groundwater at Department of Energy (DOE) legacy nuclear sites, such as the Hanford Site. Adsorption experiments for individual contaminants (chromate, iodate, pertechnetate, and uranyl carbonate) were conducted with two Bi materials: commercially available Bi-subnitrate (BSN); and laboratory synthesized Bi oxyhydroxide nitrate (BOH). The structure and composition of the Bi material influenced hydrolysis and ion exchange interactions in aqueous solution, with subsequent impacts on solution pH, contaminant speciation, and contaminant uptake. X-ray diffraction revealed that the disordered BOH structure, initially containing charge balancing nitrate and hydroxide anions, rapidly converted to bismutite, Bi2O2(CO3), in the presence of carbonate. During this transformation, BOH removed most contaminant ions from solution. [Bi6O5(OH)3]5+ clusters in BSN underwent hydrolysis upon exposure to aqueous solutions, substantially reducing pH, and transforming into several mineral phases, including a daubreeite (BiO(OH,Cl)) structure, and an unidentified mineral phase (unk-Bi(NO3)x(OH)yOz). This transformation decreased uptake efficiency relative to BOH, except for pertechnetate. The adsorption isotherms for the contaminants were fit with a Freundlich model that describes adsorption to Bi materials with dissimilar binding sites. Solid phase characterization after reaction confirmed structural rearrangement of the Bi materials and direct association of the contaminant ions with Bi mineral structures via different mechanisms, including anion exchange or outer-sphere complexation for pertechnetate, and inner-sphere adsorption for all other contaminants. Uranyl carbonate could substitute between the [Bi2O2]2+ layers, and some iodate was incorporated into a neo-formed δ-Bi2O3 phase. This remarkable versatility of Bi-based materials demonstrated here means that they are cost-effective materials with the potential to sequester co-located contaminants at DOE legacy sites.
1 Introduction
Bismuth (Bi)-based materials are used in a wide variety of disciplines, including energy generation, medical applications, and adsorbents for air and water treatment.1 Bi is a low-cost, environmentally benign element with low toxicity, and it forms stable layered structures preserved during ion exchange processes with several anions.2 For these reasons, Bi-based materials have potential application to in situ subsurface remedies for sequestering multiple co-located contaminants.3Different strategies for the synthesis of Bi-based materials can be used to obtain a product with targeted composition, morphology and particle size. By controlling the (i) physicochemical properties of synthesis medium; (ii) nature and concentration of Bi precursor and counterion; (iii) addition of templating surfactants and capping agents; and (iv) time and temperature of heating step, Bi-based materials with predictable structure-composition functionality can be engineered for specific environmental remediation applications.4 For example, the synthesis of Bi-based materials can be tailored to incorporate radioiodine (129I) as iodide in bismoclite BiOCl (I–BiOCl) microspheres,5 or as iodate in Bi iodate, Bi(IO3)3,6 and BiO(IO3) with Aurivillius layers (Bi2O2)2+ separated by IO3− anions.7 Three-dimensional hierarchical Bi-based materials have been successfully used for the sorption of contaminants, e.g., uniform bismite (Bi2O3) nanotubes, synthesized by a facile solvothermal method show high chromate (CrO42−) removal rates over a pH range from 3 to 11.8
Layered Bi-based materials are structurally versatile and can accommodate a range of environmentally important chemical species, including uranium 238U, as uranyl carbonate complexes (UO2(CO3)x2−2x, iodine, 129I, as iodate (IO3−) or iodide (I−), hexavalent chromium (Cr(VI) as chromate (CrO42−), selenite (SeO32−), arsenate (AsO43−), and perchlorate (ClO4−).9,10 Bi-based materials sequester aqueous contaminants through multiple mechanisms of interaction, including (i) outer- and inner-sphere adsorption of contaminants; (ii) ion exchange and interlayer intercalation; and (iii) precipitation and incorporation of different contaminants within co-precipitated Bi-based neophases.11 Bismuth oxide hydroxide materials intercalated with nitrate (NO3−) and carbonate (CO32−) can readily exchange interlayer anions for contaminant anions such as CrO42−, pertechnetate (TcO4−), IO3−, and I−. The layered structure of these Bi-based materials is preserved during ion exchange processes and, depending on the contaminant, the structure can undergo subsequent molecular reorganization to generate a final product in which the contaminant anions, e.g., IO3− and I−, are structurally bound within the Bi oxide layers (Leonard, Chatterjee et al. 2020). For cationic aqueous species, such as the uranyl UO22+ ion, the uptake mechanism is more complex, involving formation of negatively charged uranyl carbonate complexes (UO2(CO3)x2−2x), e.g., UO2(CO3)34−, with uptake driven by the presence of intercalated CO32− in the layered structure.2b
During forty-five years of plutonium production at the Department of Energy's (DOE) Hanford Site, aqueous waste was disposed to the ground, and the water under 168 km2 of the 1502 km2 site is contaminated beyond safe drinking water limits.12 DOE is currently evaluating and implementing actions to remediate contaminated soil and groundwater at the Hanford Site. Lawter et al.,10 assessed the potential for a Bi-based oxyhydroxide material to sequester multiple contaminants of concern relevant to contaminated soil and groundwater at the Hanford Site, including TcO4−, CrO42−, IO3−, and UO2(CO3)x2−2x, including the effect of variable aqueous chemistry and the presence of sediment. Batch experiments were conducted using (i) a Hanford synthetic groundwater containing combination of anionic species of 99Tc, 238U, 129I, and Cr along with competing anions such as carbonate (CO32−) and sulfate (SO42−); and (ii) a synthetic perched water containing high concentrations of 99Tc, 238U, and NO3−. Removal efficiency was investigated when the contaminants were present individually and when they were comingled. Successful removal from the aqueous phase was demonstrated for the one-contaminant system (98 to > 99% after 24 hours) and when they were co-mingled, with 99Tc removal decreasing slightly when all contaminants were present. In the high ionic strength synthetic perched water, 99Tc removal decreased by a factor of four, but 238U removal was largely unaffected. Although solid phase characterization of the Bi oxyhydroxide demonstrated morphological and structural changes upon exposure to the aqueous matrices containing the contaminants, the mechanisms of interaction between the Bi-based materials and the different contaminants were not identified.10
Hence, the objective of this work is to identify the mechanisms of contaminant sequestration for Bi-based materials by conducting a series of batch experiments with multiple contaminants, e.g., CrO42−, IO3−, TcO4−, and UO22+-containing species. Two Bi materials were targeted for investigation (i) a commercially available bismuth subnitrate (BSN); and (ii) a lab-synthesized bismuth oxyhydroxide nitrate (BOH). The influence of hydrolysis and CO32− exchange reactions upon exposure to aqueous matrices on the structure of the Bi materials was assessed. Adsorption isotherms were produced over a concentration range that is representative of Hanford Site field conditions, and the Bi materials were subsequently characterized to determine the nature of the uptake processes for the different contaminants. Brunauer–Emmett–Teller (BET) specific surface area analysis, X-ray diffraction (XRD), X-ray absorption spectroscopy (XAS), X-ray photoelectron spectroscopy (XPS), total X-ray scattering for pair distribution function analysis (XPDF), and scanning electron microscopy-energy-dispersive X-ray spectroscopy (SEM-EDS) were used to (i) characterize the Bi-based materials before and after contaminant interaction; (ii) determine the mechanisms of contaminant uptake; and (iii) compare removal of co-contaminants by the two Bi-based materials.
2 Materials and methods
The experimental design involved a comparison of two materials: (i) a predominantly amorphous Bi oxyhydroxide nitrate prepared in the laboratory by solvothermal treatment of Bi nitrate and urea in ethylene glycol; and (ii) a more crystalline commercial analogue of this material, Bi subnitrate, manufactured by hydrolysis of an acidic solution of Bi nitrate through the addition of alkali. The extent of further Bi hydrolysis, accompanied by NO3− exchange for CO32−, and associated structural changes were investigated for each material. Laboratory studies were conducted using contaminant and subsurface geochemical conditions representative of contaminated soil and groundwater at the DOE's Hanford Site. The synthetic groundwater (SGW) composition is based on the groundwater chemistry beneath the Hanford Site and contains other competing anions, predominantly, chloride (Cl−), CO32−, and sulfate (SO42−). A range of concentrations of TcO4−, CrO42−, IO3−, and UO22+-containing species were added to the experiments, encompassing those measured in a highly contaminated perched water zone at the Hanford Site,13 and within representative Hanford Site contaminant plumes in the groundwater, to measure adsorption isotherms and to understand Bi-based material transformation as a function of contaminant uptake.2.1 Materials
Caution! 99Tc and 238U are radioactive materials. Work with all radioactive samples was performed by trained personnel inside of a radiological fume hood.Bi subnitrate (BSN) was obtained from Sigma-Aldrich (Stock# B0426, Lot # MKCG7424). To synthesize Bi oxyhydroxide (BOH), Bi(NO3)3·5H2O (0.75 mmol), and urea (2.7 mmol) were suspended in 50 mL ethylene glycol with stirring. The mixture was subjected to solvothermal treatment at 150 °C for 5 hours in a Teflon-lined autoclave. After the reaction mixture cooled to room temperature, the ethylene glycol supernatant was decanted, and the solid reaction product was collected via centrifugation. The solid was resuspended in ultrapure water (10 mL/0.1 g sorbent), vortexed for 1 min, and collected by centrifugation. The washing procedure was repeated with ultrapure water for a total of five washes. The solid was then suspended in 100% methanol (10 mL/0.1 g sorbent), vortexed for 1 min, and collected by centrifugation. The methanol wash step was repeated twice more, and the product allowed to dry at room temperature.
Hanford SGW was prepared by addition of the reagents to deionized water (DIW) in the order identified in Table 1.14 Once the chemicals were dissolved, an excess of calcium carbonate (CaCO3) was added to reproduce the carbonate-saturated Hanford groundwater, and the solution was stirred. After approximately 1 week, the solution was filtered to remove excess CaCO3 using a 0.45 μm filter. The pH of the Hanford SGW prior to addition of Bi-based materials was 7.96.
The contaminant solutions were prepared as follows:
• Chromium (Cr) was added as potassium chromate (K2CrO4) obtained from Fisher Scientific.
• Iodine (I) was added as sodium iodate (NaIO3), Acros Organics, or potassium iodate (KIO3) obtained from Fisher Scientific.
• Technetium (99Tc, or Tc) was added as ammonium pertechnetate (NH4TcO4) obtained from in-house stocks available at the Radiochemical Processing Laboratory, Pacific Northwest National Laboratory.
• Uranium (238U, or U) was added as uranyl nitrate (UO2(NO3)2·6H2O) obtained from Alfa Aesar.
• Nitrate was added as NaNO3, obtained from Sigma-Aldrich.
For the adsorption isotherms, single contaminant solutions were prepared by adding the appropriate amount of K2CrO4, KIO3, NH4TcO4, and UO2(NO3)2·6H2O to Hanford SGW to obtain concentrations around 1.70 × 10⁻⁷ mol L−1 (A), 1.70 × 10⁻⁶ mol L−1 (B), 1.70 × 10⁻⁵ mol L−1 (C), and 1.70 × 10⁻⁴ mol L−1 (D); 1.5 × 10⁻³ mol L−1 (E). K2CrO4 and NaIO3 solutions of 0.02 mol L−1 (S) were also prepared to produce Bi-based materials with high contaminant loading for solid phase characterization (Table 2).
| Contaminant | Single contaminanta | |||||
|---|---|---|---|---|---|---|
| Concentration (μg L−1 unless stated) | ||||||
| A | B | C | D | E | S | |
| a For adsorption isotherms, contaminants were tested individually at concentrations ranging from 1.70 × 10⁻⁷ to 1.70 × 10⁻⁴ mol L−1 (A to D); the higher concentrations were used for solid phase characterization.b iodine concentrations were in the range from 1.70 × 10⁻⁶ to 1.70 × 10⁻⁴ mol L−1 (B to D), and 1.5 × 10⁻³ mol L−1 (E). | ||||||
| Tc | 17.2 | 169 | 1630 | 16.5 mg L−1 | — | — |
| U | 38.4 | 382 | 3770 | 37.7 mg L−1 | — | — |
| Cr | 8.94 | 88.4 | 869 | 9.7 mg L−1 | — | 1040 mg L−1 |
| Ib | — | 213 | 1990 | 21.6 mg L−1 | 190 mg L−1 | 2540 mg L−1 |
2.2 Methods
| Kd = (Ci − Ct)/Ct × V/W | (1) |
Langmuir and Freundlich models were used to fit the experimental isotherms. The Langmuir model is commonly applied to adsorption on a completely homogenous surface with negligible interaction between adsorbed molecules. It assumes surface monolayer sorption by identical binding sites15 and is given by eqn (2).
 | (2) |
The Freundlich model describes sorption to a substrate that has dissimilar binding sites, with the stronger binding sites occupied first,15 and is given by eqn (3).
| q = KFC1/n, | (3) |
2.2.4.1 Brunauer–Emmett–Teller (BET) specific surface area (SSA). The SSA of the materials was measured with an Accelerated Surface Area and Porosity System (ASAP) 2020, from Micromeritics. The materials were degassed at 80 °C for 9 hours, with a temperature ramp of 5 °C min−1. An aluminosilicate standard (Micromeritics) with a known surface area of 214 ± 6 m2 g−1 was analyzed immediately after the sample. The measured surface area of the standard was 212 m2 g−1, which is within the accepted standard deviation range for the instrument.
2.2.4.2 X-ray diffraction (XRD). Materials were analyzed by XRD to determine mineral phase composition and purity. Each sample was prepared by crushing the sample into fine powder using a mortar and pestle. Diffraction data were collected from 3 to 90° 2θ, scanning at 0.5° min−1 and recording counts every 0.04° (5 s), using a Rigaku MiniFlex II Bragg–Brentano diffractometer with Cu-Kα radiation (λ = 1.5418 Å) and a graphite post-diffraction monochromator. Identification of material phases was carried out using JADE® and TOPAS® XRD pattern processing software and reference patterns from the International Centre for Diffraction Data (ICDD) powder diffraction database.
2.2.4.3 Total X-ray Scattering for pair distribution function analysis (XPDF). Total XPDF analysis of BOH was completed at beamline 11ID-B of the Advanced Photon Source (Argonne, IL USA),16 using an incident photon energy of 58.6 keV (λ = 0.2115 Å). Samples were measured using 0.8 mm ID Kapton® capillaries at a sample-to-detector distance of 16 cm. The scattering patterns were acquired using an amorphous Si Perkin ElmerTM detector system (2048 × 2048 pixels, 200 × 200 μm2 pixel size). An empty capillary background was measured at identical exposure parameters for each sample and subtracted after normalizing by beam intensity. A dilute ceria (CeO2) standard (NIST diffraction standard set 674a) was used to calibrate the sample-to-detector distance and orientation of the detector relative to the incident beam path. Threshold, frame, spot, and polygon masks were applied to the data to remove (1) the beam stop (polygon mask), (2) over-/underexposed pixels (threshold and spot masks), and (3) edge-related artifacts (threshold and frame masks). Only two spots were specifically masked. 2D Scattering data were integrated from q = 0.55 to 25 Å−1 in GSAS-II17 using a polarization correction of 0.99 to produce 1D profiles. PDFgetX3
![[thin space (1/6-em)]](https://www.rsc.org/images/entities/char_2009.gif) 18 was used to calculate the experimental pair distribution profiles. Instrument parameters for the calculation were derived from a Rietveld-type refinement for the PDF profile of the CeO2 standard in PDFgui:19 qdamp = 0.03640, qbroad = 0.00118. The total structure factor and PDF profiles of previously published structures were calculated in Discus20 and PDFgui.
18 was used to calculate the experimental pair distribution profiles. Instrument parameters for the calculation were derived from a Rietveld-type refinement for the PDF profile of the CeO2 standard in PDFgui:19 qdamp = 0.03640, qbroad = 0.00118. The total structure factor and PDF profiles of previously published structures were calculated in Discus20 and PDFgui.
2.2.4.4 Scanning electron microscopy-energy dispersive X-ray spectroscopy (SEM-EDS). SEM imaging and EDS elemental distribution mapping were performed on thin sections prepared by mixing an aliquot of material (∼100 mg) with epoxy resin. The mixture was transferred into a 10-mm-base Plexiglas mount, which was degassed and cured overnight under vacuum. The dried mount was then cut and polished into 4-mm-thin sections. The thin sections were carbon coated with 10 nm carbon layer by thermal evaporation using a 108 °C Auto Carbon Coater (Ted Pella, Inc.), which improved sample conductivity, reduced sample charging, and increased the SEM image quality. SEM analyses were conducted with a FEI Quanta 3D field emission electron microscope. Particle morphology was examined using a secondary electron detector at acceleration voltage of 5–10 kV and current of 0.17–0.34 nA. EDS elemental mappings were collected using a X-Max 80 mm2 Silicon Drift Detector from Oxford Instruments, at acceleration voltage of 30 kV and current of 4–6 nA. Elemental mapping acquisition time, controlled with Oxford INCA software, varied from 300 to 500 s.
2.2.4.5 X-ray absorption spectroscopy (XAS). The Advanced Photon Source at Argonne National Laboratory was used to determine the oxidation state and local coordination environment of the Bi-based material and the contaminants. The X-ray absorption near edge structure (XANES) and extended X-ray absorption fine structure (EXAFS) data at the Cr K-edge (5989 eV), I K-edge (33
![[thin space (1/6-em)]](https://www.rsc.org/images/entities/char_2009.gif) 169 eV), Tc K-edge (21
169 eV), Tc K-edge (21![[thin space (1/6-em)]](https://www.rsc.org/images/entities/char_2009.gif) 048 eV) and U LIII-edge (17
048 eV) and U LIII-edge (17![[thin space (1/6-em)]](https://www.rsc.org/images/entities/char_2009.gif) 166 eV) were acquired in fluorescence mode on the beamline 20-BM. The incident beam energy was selected using a Si (111) monochromator, and the X-ray beam was focused to a spot size of ∼400 μm using a toroidal mirror. The fluorescence signal was monitored using a multielement, energy dispersive germanium detector. Initial energy calibration was performed using a chromium (Cr) foil and tin (Sn) foil for iodine. The XANES and EXAFS data at the Bi LIII-edge (13
166 eV) were acquired in fluorescence mode on the beamline 20-BM. The incident beam energy was selected using a Si (111) monochromator, and the X-ray beam was focused to a spot size of ∼400 μm using a toroidal mirror. The fluorescence signal was monitored using a multielement, energy dispersive germanium detector. Initial energy calibration was performed using a chromium (Cr) foil and tin (Sn) foil for iodine. The XANES and EXAFS data at the Bi LIII-edge (13![[thin space (1/6-em)]](https://www.rsc.org/images/entities/char_2009.gif) 419 eV) were acquired in transmission mode. Initial energy calibration was performed using a lead (Pb) foil. The XANES and EXAFS data were analyzed using the Athena and Artemis interface to the IFEFFIT program package (version 0.9.26), respectively.21 The EXAFS fit to the Bi LIII-edge data for both BOH and BSN used the crystal structure of tetraoxotetrahydroxohexabismuth(III) perchlorate heptahydrate, Bi6O4(HO)4(ClO4)6 (H2O)7 (ICSD 37147), and bismutite (ICSD 94740) for BOH exposed to CO32−.
419 eV) were acquired in transmission mode. Initial energy calibration was performed using a lead (Pb) foil. The XANES and EXAFS data were analyzed using the Athena and Artemis interface to the IFEFFIT program package (version 0.9.26), respectively.21 The EXAFS fit to the Bi LIII-edge data for both BOH and BSN used the crystal structure of tetraoxotetrahydroxohexabismuth(III) perchlorate heptahydrate, Bi6O4(HO)4(ClO4)6 (H2O)7 (ICSD 37147), and bismutite (ICSD 94740) for BOH exposed to CO32−.
2.2.4.6 X-ray photoelectron spectroscopy (XPS). A Kratos AXIS Ultra DLD system was used to acquire XPS spectra using a monochromatic Al-Ka source (hν = 1486.7 eV). The samples were mounted in a powder form using a double-sided 3M Scotch brand tape attached to a silicon substrate. The XPS instrument work function was calibrated to give binding energy of 84 ± 0.1 eV for the Au 4f7/2 line for metallic gold and the spectrometer dispersion was calibrated to give a BE of 932.65 ± 0.1 eV for the Cu 2p3/2 line of metallic copper. Data acquisition was carried out at normal take-off angle on an area of 300 μm × 700 μm. Survey spectra were collected at a pass energy of 160 eV with a step size of 1 eV, while high-resolution scans were at 40 eV at a step size of 0.1 eV (full width at half maximum, FWHM, of Au 4f7/2 at 40 eV pass energy was 0.8 eV). During analysis, a low-energy electron flood gun was used to minimize surface charging, and the data were calibrated by referencing the adventitious C 1s peak to 285 eV. All data processing was performed using the software CasaXPS. Wherever applicable, a Shirley background correction was applied, and the peaks fitted using a Gaussian–Lorenztian (GL(30)) type curve.
3 Results and discussion
3.1 Characterization of Bi-based materials
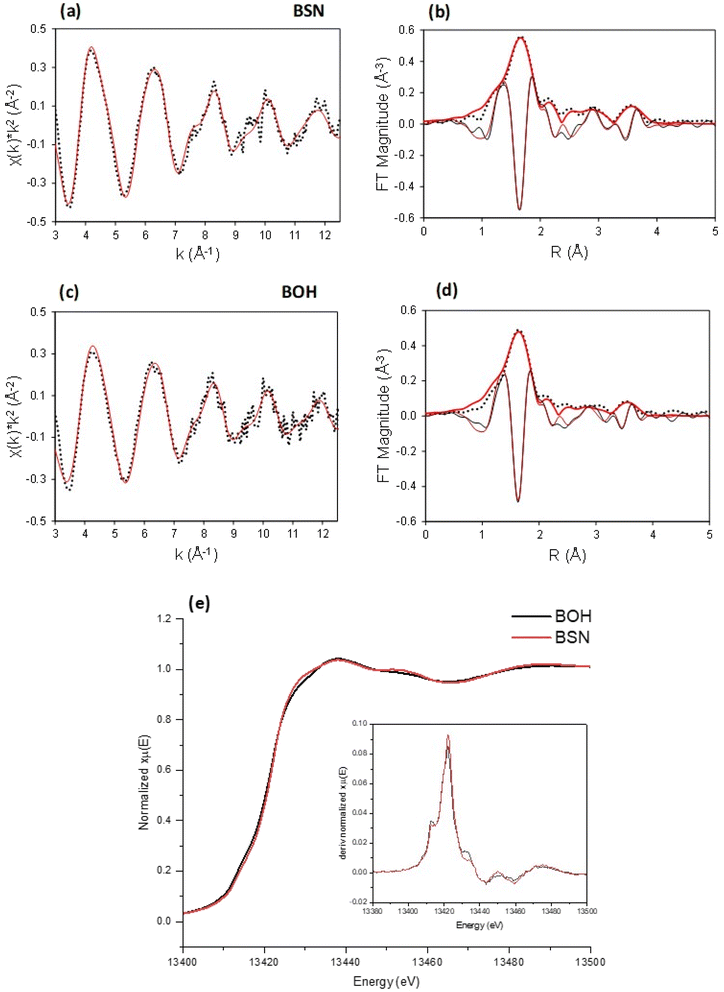
The Bi-based materials investigated here, commercial bismuth subnitrate, BSN, and synthesized bismuth oxyhydroxide nitrate, BOH, were selected based on their ability to sequester chromate (CrO42−), iodate (IO3−), pertechnetate (TcO4−), and uranyl (UO22+) from synthetic Hanford groundwater and in the presence of Hanford sediments.3,10,22 BSN and BOH were characterized by SEM-EDS, XRD, XPDF, BET, XAS, and XPS to determine their structural similarities and differences that might affect subsequent mechanisms of interaction with contaminants in solution.The BSN starting commercial material was defined by a vendor as “bismuth subnitrate” Bi5O(OH)9(NO3)4, but our XRD analysis (Fig. S1(b)† showed that the diffraction pattern was consistent with the bismuth basic nitrate23 comprised of [Bi6O5(OH)3]5+ clusters linked in pairs through two bridging Bi–O bonds and surrounded by charge-balancing NO3− and H2O in the arrangement shown in Fig. 1(f). The general formula for the cluster can be written as clus-Bi12O10(OH)6(NO3)10·6(H2O).24 Refinement of the structure to the XPDF data revealed only a 0.2% discrepancy in unit cell volume (SI) compared to the published structure and no significant attenuation of the signal at high r values (Fig. S1†). The fit to Bi LIII-edge EXAFS data for the BSN starting material showed two Bi–O paths at 2.14 ± 0.01 and 2.70 ± 0.03 Å and Bi–Bi path at 3.67 ± 0.03 Å (Table 4, Fig. 2(a) and (b), which was in good agreement with XPDF peak positions around 2.1 and 2.8 Å for O atoms and around 3.7 Å for Bi atom (Fig. S1†). The Bi LIII-edge XANES data for BSN starting material and its derivative (Fig. 2(e) with inset) was indicative of asymmetrical coordination caused by the lone electron pair, as investigated earlier by Tooth et al.;25 and described in more detail for Bi aqueous solutions by Driscoll et al.26 Bi LIII-edge XANES data did not provide information on coordination geometry due to spectral broadening.25 The SEM images (Fig. 1(a) and (b)) show that BSN has a densely packed physical structure ordered into large crystalline domains. Thus, the BSN material can be considered macro-crystalline and phase-pure.
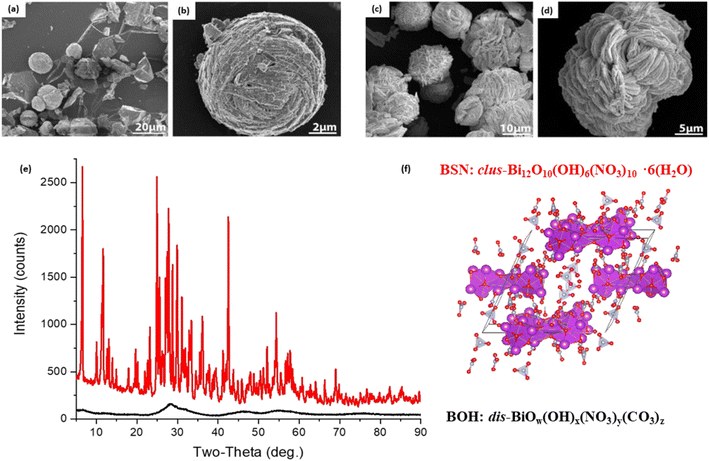 | ||
| Fig. 1 SEM images at lower and higher magnification for (a and b) commercial bismuth subnitrate (BSN), clus-Bi12O10(OH)6(NO3)10·6(H2O), and (c and d) for synthesized bismuth oxyhydroxide nitrate (BOH), dis-BiOw(OH)x(NO3)y(CO3)z; (e) XRD patterns for BSN (red) and BOH (black) – the matching to the bismuth basic nitrate from Lazarini23 is in Fig. S1,† and (f) pairs of [Bi6O5(OH)3]5+ clusters surrounded by nitrate groups. Bi atoms are purple, O atoms red, N atoms grey. | ||
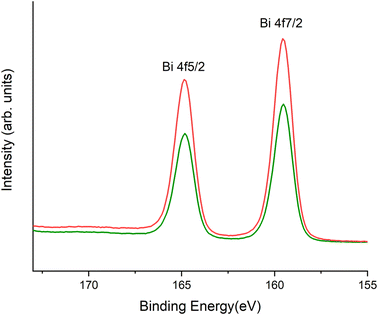
The BOH starting material has a broad diffraction pattern (Fig. 1(e) and S1(a)†) similar to that for the metastable delta (δ)-polymorph of bismite (Bi2O3). Compositional analysis confirms that NO3−, OH−, and CO32− are also present in this disordered material. Here we use a prefix “dis-” to indicate a high degree of structural disorder of this material, dis-BiOw(OH)x(NO3)y(CO3)z. XPDF analysis, with refinement of the published structure of δ-Bi2O3,27 suggests the material is coherent to approximately 2.6 nm, with an average particle size below 3 nm (Fig. S1†). Comparison of unit cell parameters to the published values is difficult because the phase has previously only been observed at high temperature (>1000 K). Hence, the refined unit cell volume is only 92% of the published value, despite the increased disorder commonly observed for materials with particle sizes < 10 nm. The residual of the XPDF refinement suggests the presence of some BSN-like material at approximately 5 vol% (Fig. S1(c)†). The small crystallite size observed is supported by BET measurements with BOH having a SSA two orders of magnitude greater than that for the macro-crystalline BSN (Table 3). The pore size distribution calculated from the desorption curve for BOH (Fig. S1(e)†) shows that it is composed of mesopores ranging from 3 nm to 8 nm. The non-overlapping adsorption and desorption curves form a hysteresis loop (Fig. S1(f)†) and, based on the shape of hysteresis loop, the pores are aggregates of plate-like shaped pores (Fig. S1(F),† inset).22 As with BSN, the Bi LIII-edge EXAFS data for BOH could be fit with two Bi–O paths at 2.13 ± 0.01 and 2.67 ± 0.03 Å, and a Bi–Bi path at 3.66 ± 0.03 Å (Table 4, Fig. 2(c) and (d)), which is in reasonable agreement with the XPDF data. Depsite the coordination numbers from the fit to the EXAFS data having relatively large errors due to the noise in the data at high k, the coordination number for Bi–Bi in BOH was smaller than in BSN (Table 4). The wider Bi peak in the XPDF data for BOH, also signifies disorder (Fig. S1(c)†). The Bi LIII-edge XANES spectrum for BOH was similar to that for BSN (Fig. 2(e) with inset), which also had a stereochemically active lone pair and distortion in the geometry.25 The similar coordination environment is also confirmed by XPS analysis, in which the Bi 4f peaks for BSN and BOH are at the same binding energies (Fig. 3). The SEM images for BOH (Fig. 1(c) and (d)) show a more open structure than BSN (Fig. 1(a) and (b)), supporting the higher SSA from the BET data.
![[thin space (1/6-em)]](https://www.rsc.org/images/entities/char_2009.gif) 422 eV)
422 eV)
| Sample | Path | Coordination number, CN | Bond distance, R (Å) | Sigma squared, σ2 (Å2) | ΔE0 (eV) | Chir2 | R-factor |
|---|---|---|---|---|---|---|---|
| BSN | Bi–O | 2.6 ± 0.3 | 2.14 (1) | 0.004 (1) | −4.3 ± 1.5 | 45.5 | 0.02 |
| Bi–O | 0.8 ± 0.3 | 2.70 (3) | 0.004 (1) | ||||
| Bi–Bi | 4.8 ± 1.9 | 3.67 (3) | 0.014 (3) | ||||
| BOH | Bi–O | 2.3 ± 0.3 | 2.13 (1) | 0.005 (1) | −5.4 ± 1.6 | 25.8 | 0.02 |
| Bi–O | 0.5 ± 0.2 | 2.67 (3) | 0.005 (1) | ||||
| Bi–Bi | 1.6 ± 1.0 | 3.66 (3) | 0.007 (4) |
Overall, BSN and BOH have different long range order (crystalline vs. disordered, respectively) and morphology, but have similar local coordination environments.
3.2 Hydrolysis and carbonate exchange
Bi-based materials are under evaluation for use in subsurface remediation of contaminated groundwater; therefore, their structural transformation due to hydrolysis upon exposure to groundwater, and the effect of dominant ions present in the groundwater on the composition of the material must be considered. Hanford SGW (Table 1) is slightly alkaline (initial pH = 7.96) and contains predominantly bicarbonate (HCO3−) species (Fig. S2†). It is hypothesized that some of the NO3− present in the structure of both BSN and BOH will be released via exchange for CO32−, as well as via hydrolysis with subsequent incorporation of OH−. The extent of CO32− incorporation will be significantly affected by pH, due to the change in relative speciation of carbon dioxide (CO2), bicarbonate (HCO3−), and carbonate (CO23−).28 At low pH the dominant species is aqueous CO2, denoted on the diagram as , and concentrations of CO32− species are negligible.29 At higher pH, the dominant species is HCO3−, and CO32− becomes the second dominant carbonate species at pH > 8.3.
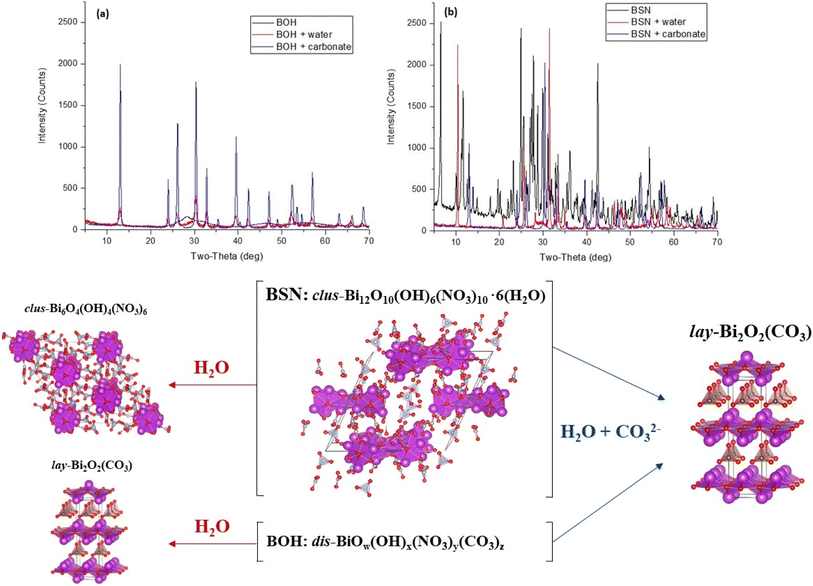
Samples of BSN and BOH were exposed to: (i) DIW to assess the effect of aqueous hydrolysis; and (ii) a solution contaning NaHCO3 at pH 8.29 to assess the effect of carbonate exchange. To investigate structural transformation of BOH and BSN, the solid phases were collected and analyzed by XAS (Fig. S3†) and XRD (Fig. 4).
When BSN is added to DIW, the pH decreases to 4.14 due to aqueous hydrolysis (Table 8). This significant drop in pH indicates that BSN undergoes further incorporation of OH−, leading to the formation of a clustered structure of Bi basic nitrate described in Henry et al.30 clus-Bi6O4(OH)4(NO3)6, as confirmed by XRD (Fig. 4). The intercalation of NO3−, in addition to OH−, between the [Bi2O2]2+ layers has been demonstrated in the literature at pH ≤ 5.4.31
When BOH is added to DIW, the presence of CO32− in BOH structure (from its synthesis with ethylene glycol) partially acts as a buffer, and the pH only decreases to 5.48 (Table 8). BOH undergoes hydrolysis and incorporation of OH− upon exposure to DIW, but the XRD pattern is dominated by bismutite, lay-Bi2O2(CO3), due to the amount of CO32− in the BOH structure, (Fig. 4), although the peaks are broad, suggesting a disordered structure. The broad background is evidence that some of the disordered BOH starting material remains after 24 hours exposure to DIW. The XANES spectrum for BOH changes slightly upon exposure to DIW (Fig. S3(a)†), and the fit of the EXAFS data (Table S1†) shows an increase in the number of coordinating Bi atoms, implying a more ordered structure.
BSN and BOH were also contacted with a solution containing more HCO3− (1.37 × 10⁻³ mol per L NaHCO3, with a starting pH of ∼8.3) than the estimated quantity of NO3− present. Table 8 shows that the buffering capacity of carbonate species is sufficiently high to maintain the pH range where HCO3− dominates (pH 7.71 for BSN and pH 8.57 for BOH). Table 5 shows that NO3− in Bi materials had been exchanged for HCO3−/CO32−, which leads to formation of bismutite (Fig. 4).
| Bi-based material | Theoretical structural NO3−(mM g−1) | Measured removed NO3−(mM g−1) |
|---|---|---|
| BSN | 0.272 | 0.279 |
| BOH | 0.240 | 0.126 |
Hydrolysis and HCO3−/CO32− uptake had a significant effect on the crystal structure of both BOH and BSN, resulting in transformation to bismutite,32 in which CO32− coordinates the [Bi2O2]2+ layers such that the Bi atoms are regularly stacked on top of each other along the c-axis (Fig. 4 and S4†). Conversion to bismutite requires disruption of the initial structure and reassembly to form [Bi2O2]2+ layers of 8-coordinate Bi polyhedral, with a high affinity for CO32− in the interlayer. Such transformation of the [Bi6O5(OH)3]5+ cluster to the bismutite structure was observed by Afonina et al.33 during exposure of the crystalline [Bi6O5(OH)3](NO3)5·3H2O material to a carbonate solution at pH 8. The XANES and EXAFS spectra for BOH (also representative of BSN), show an increase in the intensity of the white line and an increase in the Bi–Bi coordination number to 4.3 ± 1.4, confirming an increase in structural order (Table S1 and Fig. S3†). The Bi–Bi distance of 3.72 (±0.02) Å closely matches the shortest Bi–Bi distance in the bismutite crystal structure (3.717 Å). The XANES spectra for BOH in HCO3−/CO32− solution (Fig. S3(a)†) resembles literature data for bismutite nanosheets.34
Hydrolysis and incorporation of anions also changes the morphology of BOH and BSN, with Fig. 5 showing the swelling of BOH structure after exposure to Hanford SGW.
These results demonstrate that BOH and BSN have significant flexibility, exhibiting different structural motifs, crystallinity, and anion interactions, depending on the nature of the starting material, the presence of HCO3−/CO32− in solution, and the presence of other ions. In the environment, CO2 from the air will dissolve in water to form carbonate, which will result in the transformation of both BOH and BSN into bismutite. However, the difference in localized pH change for BOH vs. BSN may influence their interaction with other ions present in solution, and the buffering capacity provided by carbonate present in the BOH structure may offer an advantage. These interactions will have implications for the use of BOH and BSN in remediation strategies to remove ionic contaminants (CrO42−, IO3−, TcO4−, UO2(CO3)x2−2x) from groundwater and porewater at contaminated sites such as the Hanford Site; this is discussed in the following sections.
3.3 Adsorption isotherms
Batch experiments were used to investigate the adsorption behavior of CrO42−, IO3−, TcO4−, and UO2(CO3)x2−2x with BOH and BSN. The maximum concentrations of groundwater contaminants in the Central Plateau are 463 μg per L Cr(VI), 0.14 μg per L 129I, 1.80 μg per L 99Tc, and 3520 μg per L 238U.12 Thus, adsorption behavior of these contaminants was tested at concentrations in the ∼1–200![[thin space (1/6-em)]](https://www.rsc.org/images/entities/char_2009.gif) 000 μg L−1 range to give a wide range of loading values on the BOH and BSN materials (Table 6). BOH exhibited almost quantitative uptake for CrO42− and UO2(CO3)x2−2x (>97%), with reasonable uptake for IO3− (>76%) up to 21.6 mg L−1 (sample D), but limited uptake for TcO4− (9–18%) over all concentrations tested (Table 6). Sorption capacity for the highest contaminant concentration (sample D) ranged from 1.5 mg g−1 for TcO4− to 36.4 mg g−1 for UO2(CO3)34− (Table 6). BSN also exhibited good uptake capacity for CrO42− and IO3− (>94%), but only up to ∼0.9 mg L−1 for CrO42− and up to ∼2 mg L−1 for IO3− (samples C). Uptake of UO2(CO3)34− by BSN (37–83%) was lower than that for BOH, while uptake for TcO4− was two times higher for BSN across all initial concentrations. Sorption capacity for the highest concentration (sample D) ranged from ∼3.0 mg g−1 for TcO4− up to almost 20 mg g−1 for UO2(CO3)x2−2x (Table 6). The similar adsorption behavior of BOH and BSN is surprising, given that the nano-crystalline BOH has a SSA two orders of magnitude greater than that for the macro-crystalline BSN (Table 3). This highlights that the mechanism of interaction between bismuth-based materials and contaminants is not just sorption but involves more complex transformations that require investigation through solid phase characterization of the materials after the adsorption experiments.
000 μg L−1 range to give a wide range of loading values on the BOH and BSN materials (Table 6). BOH exhibited almost quantitative uptake for CrO42− and UO2(CO3)x2−2x (>97%), with reasonable uptake for IO3− (>76%) up to 21.6 mg L−1 (sample D), but limited uptake for TcO4− (9–18%) over all concentrations tested (Table 6). Sorption capacity for the highest contaminant concentration (sample D) ranged from 1.5 mg g−1 for TcO4− to 36.4 mg g−1 for UO2(CO3)34− (Table 6). BSN also exhibited good uptake capacity for CrO42− and IO3− (>94%), but only up to ∼0.9 mg L−1 for CrO42− and up to ∼2 mg L−1 for IO3− (samples C). Uptake of UO2(CO3)34− by BSN (37–83%) was lower than that for BOH, while uptake for TcO4− was two times higher for BSN across all initial concentrations. Sorption capacity for the highest concentration (sample D) ranged from ∼3.0 mg g−1 for TcO4− up to almost 20 mg g−1 for UO2(CO3)x2−2x (Table 6). The similar adsorption behavior of BOH and BSN is surprising, given that the nano-crystalline BOH has a SSA two orders of magnitude greater than that for the macro-crystalline BSN (Table 3). This highlights that the mechanism of interaction between bismuth-based materials and contaminants is not just sorption but involves more complex transformations that require investigation through solid phase characterization of the materials after the adsorption experiments.
| Target, M | Initial concentration, μg L−1 | Equilibrium concentration, μg L−1 | Uptake, % | Sorption capacity, μg g−1 | |||||||||||||
|---|---|---|---|---|---|---|---|---|---|---|---|---|---|---|---|---|---|
| Cr | I | Tc | U | Cr | I | Tc | U | Cr | I | Tc | U | Cr | I | Tc | U | ||
| a Sample S prepared for solid phase characterization; data not used in sorption isotherms.b — = experiments were not performed. | |||||||||||||||||
| BOH | |||||||||||||||||
| A | 1.70 × 10⁻⁷ | 8.94 | — | 17.2 | 38.4 | 0.261 | — | 14.05 | <0.020 | 97.1 | — | 18.3 | ∼100 | 8.38 | — | 3.11 | >37.5 |
| B | 1.70 × 10⁻⁶ | 88.4 | 213 | 169 | 382 | 0.300 | 33.3 | 143 | <0.020 | 99.7 | 84.4 | 15.4 | ∼100 | 85.4 | 174 | 25.5 | >373 |
| C | 1.70 × 10⁻⁵ | 869 | 1990 | 1630 | 3770 | 1.62 | 308 | 1450 | 0.55 | 99.8 | 84.5 | 11.0 | ∼100 | 845 | 1619 | 178 | 3650 |
| D | 1.70 × 10⁻⁴ | 9680 | 21![[thin space (1/6-em)]](https://www.rsc.org/images/entities/char_2009.gif) 600 600 |
16![[thin space (1/6-em)]](https://www.rsc.org/images/entities/char_2009.gif) 500 500 |
37![[thin space (1/6-em)]](https://www.rsc.org/images/entities/char_2009.gif) 700 700 |
2.67 | 5210 | 14![[thin space (1/6-em)]](https://www.rsc.org/images/entities/char_2009.gif) 950 950 |
55.8 | 99.97 | 75.9 | 9.4 | 99.9 | 9459 | 15![[thin space (1/6-em)]](https://www.rsc.org/images/entities/char_2009.gif) 817 817 |
1500 | 36![[thin space (1/6-em)]](https://www.rsc.org/images/entities/char_2009.gif) 400 400 |
| E | 1.50 × 10⁻³ | — | 190![[thin space (1/6-em)]](https://www.rsc.org/images/entities/char_2009.gif) 000 000 |
— | — | — | 142![[thin space (1/6-em)]](https://www.rsc.org/images/entities/char_2009.gif) 000 000 |
— | — | — | 25.3 | — | — | — | 45![[thin space (1/6-em)]](https://www.rsc.org/images/entities/char_2009.gif) 693 693 |
— | — |
| Sa | 0.02 | 1040 mg L−1 | 2110 mg L−1 | — | — | 0.26 mg L−1 | 47 mg L−1 | — | — | ∼100 | 97.8 | — | — | 25.7 mg g−1 | 51.6 mg g−1 | — | — |
![[thin space (1/6-em)]](https://www.rsc.org/images/entities/char_2009.gif) |
|||||||||||||||||
| BSN | |||||||||||||||||
| A | 1.70 × 10⁻⁷ | 8.94 | — | 17.2 | 38.4 | <0.19 | — | 11.35 | 6.73 | >98 | — | 34.0 | 82.5 | >8.55 | — | 5.78 | 30.6 |
| B | 1.70 × 10⁻⁶ | 88.4 | 213 | 169 | 382 | <0.19 | 3.21 | 117 | 156 | ∼100 | 98.5 | 30.8 | 59.2 | >85.8 | 202 | 50.7 | 316 |
| C | 1.70 × 10⁻⁵ | 869 | 1990 | 1630 | 3770 | <0.19 | 123 | 1245 | 2365 | ∼100 | 93.8 | 23.6 | 37.3 | >841 | 1820 | 382 | 1360 |
| D | 1.70 × 10⁻⁴ | 9680 | 21![[thin space (1/6-em)]](https://www.rsc.org/images/entities/char_2009.gif) 600 600 |
16![[thin space (1/6-em)]](https://www.rsc.org/images/entities/char_2009.gif) 500 500 |
37![[thin space (1/6-em)]](https://www.rsc.org/images/entities/char_2009.gif) 700 700 |
4055 | 7815 | 13![[thin space (1/6-em)]](https://www.rsc.org/images/entities/char_2009.gif) 500 500 |
17![[thin space (1/6-em)]](https://www.rsc.org/images/entities/char_2009.gif) 350 350 |
58.1 | 63.8 | 18.2 | 54.0 | 5420 | 13![[thin space (1/6-em)]](https://www.rsc.org/images/entities/char_2009.gif) 228 228 |
2900 | 19![[thin space (1/6-em)]](https://www.rsc.org/images/entities/char_2009.gif) 700 700 |
| E | 1.50 × 10⁻³ | — | 190![[thin space (1/6-em)]](https://www.rsc.org/images/entities/char_2009.gif) 000 000 |
— | — | — | 183![[thin space (1/6-em)]](https://www.rsc.org/images/entities/char_2009.gif) 500 500 |
— | — | — | 3.4 | — | — | — | 6270 | — | — |
| Sa | 0.02 | 1040 mg L−1 | 2540 mg L−1 | — | — | 784 mg L−1 | 2390 mg L−1 | — | — | 23.9 | 5.9 | — | — | 6.2 mg g−1 | 3.8 mg g−1 | — | — |
The adsorption–desorption distribution coefficients (Kd) for the experiments (Table 7) demonstrate that BOH and BSN have Kd values > 1000 for most of the conditions tested, except for TcO4− with both materials, for UO2(CO3)34− with BSN (sample C), and for BSN with the highest concentration of contaminants (sample E, S).
| Initial concentration, μg L−1 | Kd, mL g−1 | |||||||
|---|---|---|---|---|---|---|---|---|
| Cr | I | Tc | U | Cr | I | Tc | U | |
| a “—” = experiments that were not performed. | ||||||||
| BOH | ||||||||
| A | 8.94 | — | 17.2 | 38.4 | 32![[thin space (1/6-em)]](https://www.rsc.org/images/entities/char_2009.gif) 107 107 |
— | 221 | 1![[thin space (1/6-em)]](https://www.rsc.org/images/entities/char_2009.gif) 837 837![[thin space (1/6-em)]](https://www.rsc.org/images/entities/char_2009.gif) 190 190 |
| B | 88.4 | 213 | 169 | 382 | 284![[thin space (1/6-em)]](https://www.rsc.org/images/entities/char_2009.gif) 193 193 |
5225 | 178 | 18![[thin space (1/6-em)]](https://www.rsc.org/images/entities/char_2009.gif) 300 300![[thin space (1/6-em)]](https://www.rsc.org/images/entities/char_2009.gif) 302 302 |
| C | 869 | 1990 | 1630 | 3770 | 521![[thin space (1/6-em)]](https://www.rsc.org/images/entities/char_2009.gif) 358 358 |
5256 | 123 | 6![[thin space (1/6-em)]](https://www.rsc.org/images/entities/char_2009.gif) 624 624![[thin space (1/6-em)]](https://www.rsc.org/images/entities/char_2009.gif) 724 724 |
| D | 9680 | 21![[thin space (1/6-em)]](https://www.rsc.org/images/entities/char_2009.gif) 600 600 |
16![[thin space (1/6-em)]](https://www.rsc.org/images/entities/char_2009.gif) 500 500 |
37![[thin space (1/6-em)]](https://www.rsc.org/images/entities/char_2009.gif) 700 700 |
3![[thin space (1/6-em)]](https://www.rsc.org/images/entities/char_2009.gif) 537 537![[thin space (1/6-em)]](https://www.rsc.org/images/entities/char_2009.gif) 285 285 |
3036 | 100 | 652![[thin space (1/6-em)]](https://www.rsc.org/images/entities/char_2009.gif) 672 672 |
| E | — | 190![[thin space (1/6-em)]](https://www.rsc.org/images/entities/char_2009.gif) 000 000 |
— | — | — | 322 | — | — |
| S | 1![[thin space (1/6-em)]](https://www.rsc.org/images/entities/char_2009.gif) 030 030![[thin space (1/6-em)]](https://www.rsc.org/images/entities/char_2009.gif) 000 000 |
2![[thin space (1/6-em)]](https://www.rsc.org/images/entities/char_2009.gif) 540 540![[thin space (1/6-em)]](https://www.rsc.org/images/entities/char_2009.gif) 000 000 |
— | — | 100![[thin space (1/6-em)]](https://www.rsc.org/images/entities/char_2009.gif) 396 396 |
43![[thin space (1/6-em)]](https://www.rsc.org/images/entities/char_2009.gif) 894 894 |
— | — |
![[thin space (1/6-em)]](https://www.rsc.org/images/entities/char_2009.gif) |
||||||||
| BSN | ||||||||
| A | 8.94 | — | 17.2 | 38.4 | 45![[thin space (1/6-em)]](https://www.rsc.org/images/entities/char_2009.gif) 000 000 |
— | 509 | 4551 |
| B | 88.4 | 213 | 169 | 382 | 451![[thin space (1/6-em)]](https://www.rsc.org/images/entities/char_2009.gif) 579 579 |
63![[thin space (1/6-em)]](https://www.rsc.org/images/entities/char_2009.gif) 094 094 |
434 | 1384 |
| C | 869 | 1070 | 1630 | 3770 | 4![[thin space (1/6-em)]](https://www.rsc.org/images/entities/char_2009.gif) 426 426![[thin space (1/6-em)]](https://www.rsc.org/images/entities/char_2009.gif) 834 834 |
14![[thin space (1/6-em)]](https://www.rsc.org/images/entities/char_2009.gif) 797 797 |
307 | 574 |
| D | 9680 | 1990 | 16![[thin space (1/6-em)]](https://www.rsc.org/images/entities/char_2009.gif) 500 500 |
37![[thin space (1/6-em)]](https://www.rsc.org/images/entities/char_2009.gif) 700 700 |
1337 | 1693 | 215 | 1136 |
| E | — | 21![[thin space (1/6-em)]](https://www.rsc.org/images/entities/char_2009.gif) 600 600 |
— | — | — | 34 | — | — |
| S | 1![[thin space (1/6-em)]](https://www.rsc.org/images/entities/char_2009.gif) 030 030![[thin space (1/6-em)]](https://www.rsc.org/images/entities/char_2009.gif) 000 000 |
2![[thin space (1/6-em)]](https://www.rsc.org/images/entities/char_2009.gif) 110 110![[thin space (1/6-em)]](https://www.rsc.org/images/entities/char_2009.gif) 000 000 |
— | — | 8 | 63 | — | — |
The presence of both the BOH and BSN materials (“Test” results in Table 8), and the higher concentrations of contaminants, had a significant influence on pH of the experiments. As discussed in Section 3.2, carbonate species concentrations in solution are affected by pH, and HCO3−/CO32− is no longer the dominant species below pH ∼6.3 for Hanford SGW (Fig. S2†). Addition of BSN lowers the pH more than BOH due to hydrolysis and exchange reactions. Compared to BOH and BSN tests in DIW, the pH did not decrease as much for BOH in contaminant solutions, except for TcO4− solutions, implying some effect of the other ions on BOH mineral transformation and their possible exchange with structural CO32−. As described in Section 3.2, BSN undergoes more hydrolysis than BOH, and the presence of the contaminants did not significantly affect this except at high concentration of CrO42− (sample E). This highlights that (i) the extent of hydrolysis and interlayer substitution in BOH and BSN strongly influences solution pH; (ii) the pH-dependent CO32− concentration plays an important role in determining the structure of the BOH and BSN; and (iii) the structure of BOH and BSN dictates the mechanism of interaction with the different contaminants.
| Sample | H2O | CO32− | Hanford SGW (pH 7.96) | |||||||||
|---|---|---|---|---|---|---|---|---|---|---|---|---|
| CrO42− | IO3− | TcO4− | UO2(CO3)x2−2x | |||||||||
| Blank | Test | Blank | Test | Blank | Test | Blank | Test | Blank | Test | Blank | Test | |
| a n.m. = not measured.b “—” = experiments that were not performed. | ||||||||||||
| BOH | 6.45 | 5.48 | 8.24 | 8.57 | ||||||||
| A | 7.99 | 6.53 | — | — | n.m. | n.m. | n.m. | n.m. | ||||
| B | 7.87 | 6.64 | 7.90 | 6.60 | 7.92 | 5.56 | 6.62 | 6.73 | ||||
| C | 7.93 | 6.57 | 7.95 | 6.39 | n.m. | n.m. | n.m. | n.m. | ||||
| D | 7.89 | 7.07 | 7.95 | 6.98 | 7.92 | 5.13 | 7.76 | 5.18 | ||||
| E | — | — | 7.88 | 7.58 | — | — | — | — | ||||
| S | 8.29 | 6.97 | 5.67 | 5.83 | — | — | — | — | ||||
![[thin space (1/6-em)]](https://www.rsc.org/images/entities/char_2009.gif) |
||||||||||||
| BSN | 6.45 | 4.14 | 8.24 | 7.71 | ||||||||
| A | 7.99 | 3.97 | — | — | n.m. | n.m. | n.m. | n.m. | ||||
| B | 7.87 | 3.96 | 7.90 | 3.95 | 7.92 | 5.02 | 6.62 | 6.47 | ||||
| C | 7.93 | 3.96 | 7.95 | 3.97 | n.m. | n.m. | n.m. | n.m. | ||||
| D | 7.89 | 4.53 | 7.95 | 4.29 | 7.92 | 4.90 | 7.76 | 4.27 | ||||
| E | — | — | 7.88 | 5.81 | — | — | — | — | ||||
| S | 8.29 | 7.07 | 5.67 | 4.45 | — | — | — | — | ||||
To determine the influence of the other competing ions in the Hanford SGW, the uptake of calcium (Ca), magnesium (Mg), potassium (K), sodium (Na), and sulfur (S) was measured by subtracting the concentrations in the test solutions from the solution blanks containing the contaminant but no BOH or BSN material (Table 9).
| Ca uptake (mg L−1) | Mg uptake (mg L−1) | K uptake (mg L−1) | Na uptake (mg L−1) | S uptake (mg L−1) | |
|---|---|---|---|---|---|
| BOH | |||||
| CrO42− | 1.0 | 0.0 | 0.3 | 0.0 | 4.1 |
| IO3− | −0.3 | 0.0 | −0.2 | −0.1 | 3.6 |
| TcO4− | 0.6 | −0.1 | −0.4 | −0.3 | 5.8 |
| UO2(CO3)34− | 0.1 | 0.1 | 0.5 | −0.2 | 8.8 |
![[thin space (1/6-em)]](https://www.rsc.org/images/entities/char_2009.gif) |
|||||
| BSN | |||||
| CrO42− | 0.6 | 0.0 | 0.1 | 0.0 | 1.1 |
| IO3− | 0.2 | 0.0 | 1.2 | 0.1 | 1.3 |
| TcO4− | −2.2 | −0.2 | −0.3 | −0.3 | 8.7 |
| UO2(CO3)34− | −0.6 | 0.0 | 0.6 | −0.2 | 14.3 |
Ca+, Mg2+, K+, and Na+ cations are not significantly taken up or released by the BOH or BSN materials. Sulfur, present as anionic sulfate (SO42−), is taken up by both BOH and BSN and likely competes with the other contaminants for active sorption sites. The most SO42− uptake occurs in the presence of TcO4− and UO2(CO3)x2−2x, with more uptake by BSN than BOH, suggesting that SO42− has a similar mechanism of interaction with Bi-based materials and competes with these species for available sites.
The sorption data for contaminants concentrations up to 1.7 × 10⁻⁴ M (sample D) were fit with both Langmuir and Freundlich models, and showed better correlation (R2 ≥ 0.90) with the Freundlich isotherm model (Fig. 6). The Freundlich isotherm describes sorption onto substrates with dissimilar binding sites, with the stronger binding sites occupied first. A comparison of the sorption behavior of BOH and BSN revealed important trends. Sorption of CrO42− was difficult to quantify as both BSN and BOH exhibited highly efficient sorption such that the residual Cr concentration in solution was at the detection limit for ICP-OES (except at the highest concentration). BSN demonstrated higher uptake and only one data point was above detection limit. The parameter n was >1 for most of the isotherms, suggesting that sorption sites become less attractive for the contaminant at higher concentrations. In one instance, CrO42− sorption to BOH, the n parameter was < 1 (n = 0.41) suggesting that BOH favored further sorption at high concentrations. The pH of most of the contaminant solutions was significantly lower with BSN than with BOH, but the pH of the TcO4− solution decreased to a similar value for both BSN and BOH (Table 8). TcO4− uptake by BSN and BOH also showed very similar isotherms, implying similar sorption mechanisms. TcO4− sorption by BSN was two times more efficient, with higher Kf value (Kf = 7.4 × 10⁻⁴ for BSN vs. 3.1 × 10⁻⁴ for BOH). Isotherms for UO2(CO3)x2−2x sorption by BSN and BOH also had similar slopes, but BOH exhibited nearly three orders of magnitude higher uptake (Kf = 2.7 for BOH vs. 5.2 × 10⁻³ for BSN). The improved sorption with BOH is attributed to the difference in pH of solutions equilibrated with BOH (8.45 at highest U concentration) in comparison with BSN (4.98 at highest U concentration) (Table 8). The lower pH solutions contained less CO32− and resulted in the conversion of negatively charged UO2(CO3)x2−2x complexes to other U-bearing species with less affinity for the positively charged BSN binding sites. BSN and BOH exhibited comparable uptake efficiency for IO3−, but the sorption isotherms had drastically different slopes, suggesting different incorporation mechanisms. This is investigated further by solid phase characterization in Section 3.4.
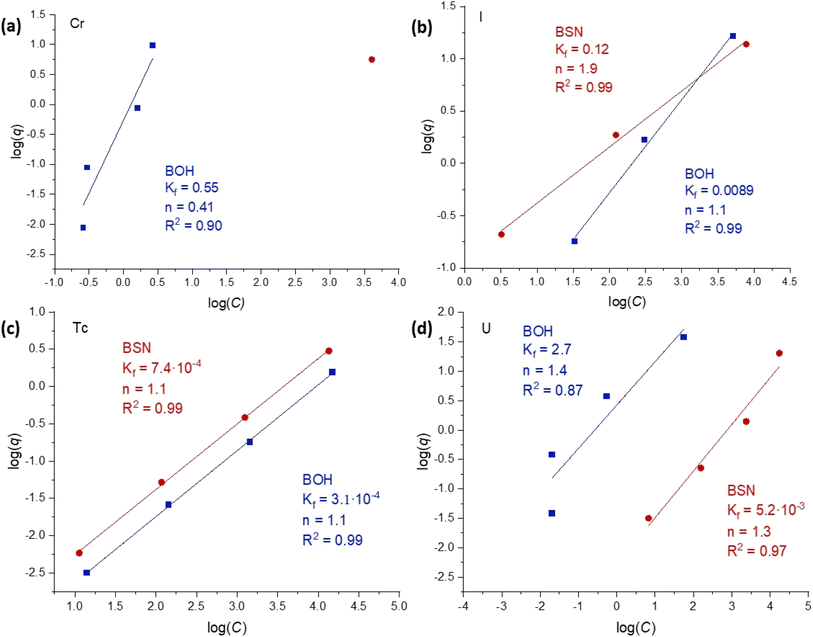 | ||
| Fig. 6 Linear fits to Freundlich sorption isotherms (linear form of eqn (3): log(q) = log(Kf) +(1/n) × log(C)), where q is the sorbed concentration at the time of equilibrium (μg per g Bi material) and C is the equilibrium concentration, of a sorbate (μg L−1), for concentrations up to 1.7 × 10⁻⁴ M of (a) Cr, (b) I, (c) Tc, and (d) U anionic species with BOH (blue) and BSN (red) obtained at a solution-to-solid ratio of 1000, contacted for 24 hours in Hanford SGW. | ||
3.4 Adsorption experiment solid phase characterization
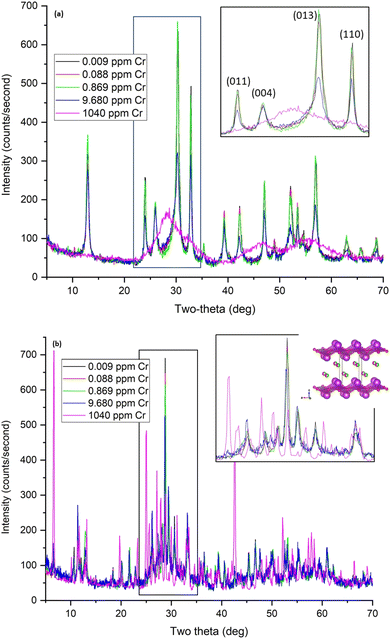
Solid phase characterization by XRD, XAS, and XPS was used to investigate the interactions between the contaminants and the Bi-based materials as a function of contaminant concentration, and changes in pH. These interactions are evaluated for the individual contaminants in the next sections.Due to the hydrolysis reactions discussed in Section 3.2, the pH of Hanford SGW and Cr samples A–D with concentrations below 9.7 ppm, decreases to ∼4 upon contact with BSN (Table 8), and there is insufficient HCO3− at this pH to promote the transformation to bismutite. The speciation of Cr is also different in the acidic pH regime, forming HCrO4− species.35 The structure changes from clus-Bi12O10(OH)6(NO3)10·6(H2O) starting material to a crystalline compound that did not match any reference patterns in the ICDD database. However, the XRD pattern did resemble that for the product formed when bismuth was oxidized in dilute nitric acid, which has a reported stoichiometry of Bi6(NO3)4(OH)2O6·2H2O (ICDD reference 00-028-0654).38 This stoichiometry suggests Bi clusters of the general formula Bi6Ox(OH)8−x charge-balanced by NO3−, referred to here as unknown or unk-Bi(NO3)x(OH)yOz. Another structure in these samples resembled clus-Bi6O4(OH)4(NO3)6 and a layered structure similar to daubreeite lay-BiO(OH,Cl) (Fig. 7(b)), incorporating Hanford SGW constituents, e.g. Cl−. Sample D (9.7 ppm or 0.19 mM) also had some initial BSN, clus-Bi12O10(OH)6(NO3)10·6(H2O). At the highest Cr concentration (1040 ppm or 0.02 M; sample S), CrO42− inhibits the hydrolysis reaction with the pH remaining at 7.07, and BSN remaining as clus-Bi12O10(OH)6(NO3)10·6(H2O) (Fig. 7(b) and S5†). Removal of Cr by this crystalline BSN material is much less than with the disordered BOH, dis-BiOw(OH)x(NO3)y(CO3)z, under the same high Cr conditions (24% vs. 100%, Table 6).
At the highest Cr concentration, the amount of CrO42− removed by BOH and BSN (Table S2†) and the structure of the materials before and after uptake (Fig. S8†) were the same in DIW and Hanford SGW, implying that groundwater constituents cannot compete with CrO42− at high concentrations.
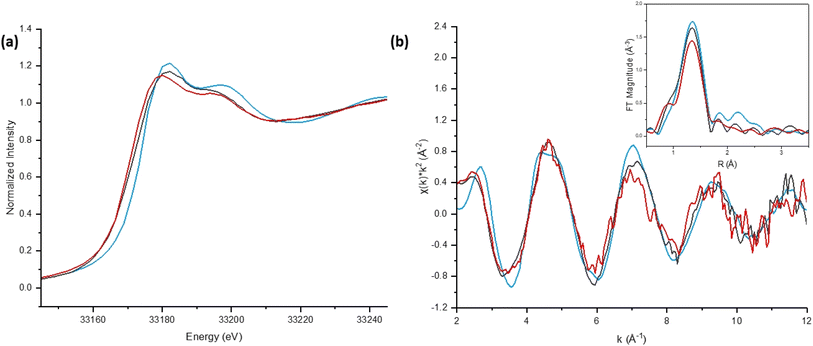
To confirm Cr speciation, and to assess any potential coordination between Bi-based material and CrO42−, the BOH sample after contact with the highest Cr concentration in water (1040 ppm) was analyzed by Cr K-edge and Bi LIII-edge XANES and EXAFS (Fig. 8 and S9†). The pre-edge features in the Cr K-edge XANES are similar and very sharp, as would be expected for the regular tetrahedral CrO42− oxyanion, and as suggested by the XPDF data (Fig. S6†). There are differences in the Cr K-edge EXAFS and Fourier transform (Fig. 8(b)) showing higher amplitude for Cr–O first shell in BOH (black line) and suggesting preferable formation of bidentate over monodentate complexes on the BOH surface, which are characterized by the increased first shell Cr–O coordination numbers with higher surface coverage.40 This is supported by the higher Cr uptake by BOH compared to BSN (sample S, Table 6).
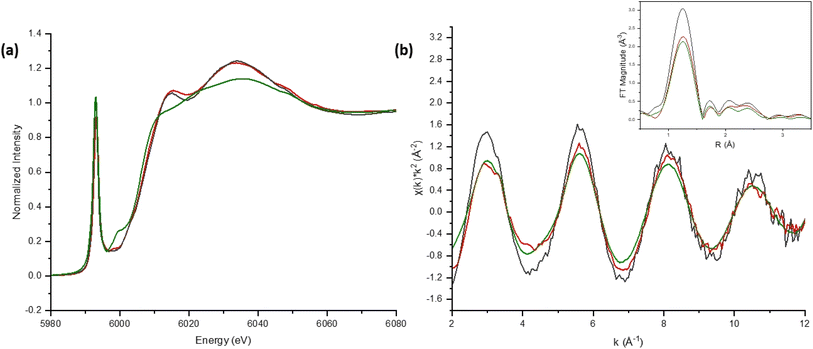 | ||
| Fig. 8 (a) Cr K-edge XANES spectra; (b) k2-weighted χ(k) spectra and Fourier transform magnitude for Cr (1040 ppm or 0.02 M; sample S) associated with BOH (black line), BSN (red line) and for a 1.45 molal solution of CrO42− at pH 13 (green line).39 | ||
The XPS survey scans for sample D (∼10 ppm Cr) for both the BOH and BSN materials show that the concentration of Cr was too low to detect on the surface. Only peaks for O 1s, Bi 4p, 4d and 4f, and C 1s were present, therefore none of the components from Hanford SGW became associated with the BOH/BSN surface in quantities greater that 1 atomic % (Fig. S11 and S12†). The Cr concentration on BOH and BSN exposed to 1040 ppm Cr in Hanford SGW and in DIW was high enough to obtain Cr 2p XPS spectra (Fig. 9). The binding energies for the Cr 2p3/2 and Cr 2p1/2 regions were 578.8 and 588.1 eV for BOH in Hanford SGW (Cr–BOH-2), and 579.0 and 588.3 eV for BOH in water (Cr–BOH-4), respectively. Similar results were obtained for BSN in Hanford SGW (Cr-BSN-1) and BSN in water (Cr-BSN-4), where the Cr 2p3/2 binding energy was 579.2 eV in both cases. These binding energies correspond to the presence of Cr(VI) species on the surface of the samples, in agreement with Cr K-edge XAS results. The Cr 2p3/2 binding energies are 0.3–0.7 eV lower than that for the starting K2CrO4 material, which may indicate a slight increase in electron density on the Cr atoms associated with the Bi material compared with K2CrO4. This effect is more pronounced for Cr associated with BOH than for Cr associated with BSN. To confirm that Cr did not undergo X-ray beam induced reduction, Cr 2p XPS spectra were collected for both BSN and BOH with an increasing time of acquisition (Fig. S15†), and no change in Cr 2p3/2 binding energy was observed.
SEM analysis of BOH after exposure to ∼10 ppm Cr (0.19 mM, sample D) in Hanford SGW reveals ∼50 μm bismutite particles with a ‘flower-like’ morphology often associated with Bi-based materials.41 This structure is very different from the morphology of BOH exposed to Hanford SGW in the absence of Cr (Fig. 5), suggesting specific interactions between Cr and the BOH material. EDS maps showed that the Cr was more concentrated on the outer edges of the particles than in the center (Fig. 10).
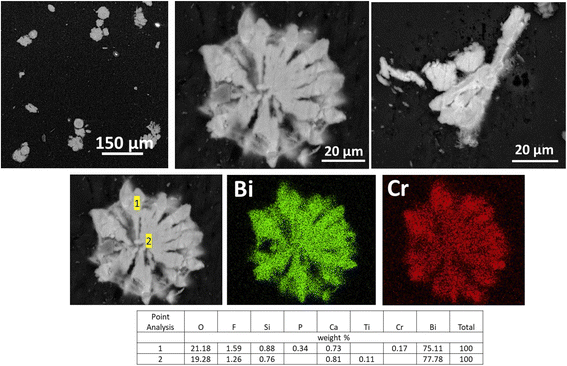 | ||
| Fig. 10 SEM images and EDS maps for BOH exposed to 10 ppm Cr (0.19 mM, sample D) in Hanford SGW for 24 hours. | ||
In contrast to BOH, SEM analysis of the BSN particles exposed to ∼10 ppm Cr (sample D) in Hanford SGW reveals that they are smaller in size (1–5 μm) and have an irregular morphology, consistent with the disordered and crystalline phases identified by XRD. EDS maps showed that the Cr was more evenly distributed over the smaller BSN particles (Fig. 11).
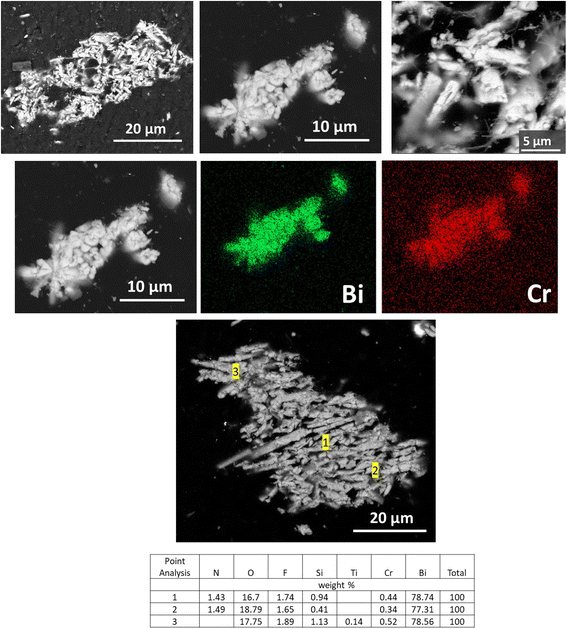 | ||
| Fig. 11 SEM images and EDS maps for BSN exposed to 10 ppm Cr (0.19 mM, sample D) in Hanford SGW for 24 hours. | ||
BOH and BSN samples exposed to the highest Cr concentration (1040 ppm, 20 mM, sample S) were used for solid phase characterization and preserved their initial structure in DIW and in Hanford SGW. The contact time for these experiments was relatively short (24 hours) and mineral transformation of Bi materials is expected to continue over longer exposure times; the dynamics of these transformations in the environment will be studied in future publications. XAS and XPDF analyses showed that Cr was taken up by the Bi materials as CrO42−. BOH showed quantitative uptake of CrO42− (1040 ppm, 20 mM, sample S), while BSN removed only around 24%. This supports EXAFS data showing higher surface coverage of CrO42− on BOH than BSN, possibly as a bidentate complex, even though coverage was not uniform (Fig. 10). At lower Cr concentrations (0.17 to 17 μM, samples A to C), CrO42− uptake by BOH was quantitative and BOH transformed into bismutite with modified stacking of the [Bi2O2]2+ layers. At lower Cr concentrations, CrO42− uptake by BSN was also near quantitative, and BSN underwent different mineral transformation, resulting in the unidentified structure unk-Bi(NO3)x(OH)yOz. These observations are supported by pH data (Table 8), implying changes in the extent of hydrolysis affected mineral transformation. Relatively small quantities of BOH and BSN can quantitatively remove Cr(VI) from solution at concentrations relevant to remediation of contaminated sites, and in the presence of common competing anions present in groundwater and porewater.
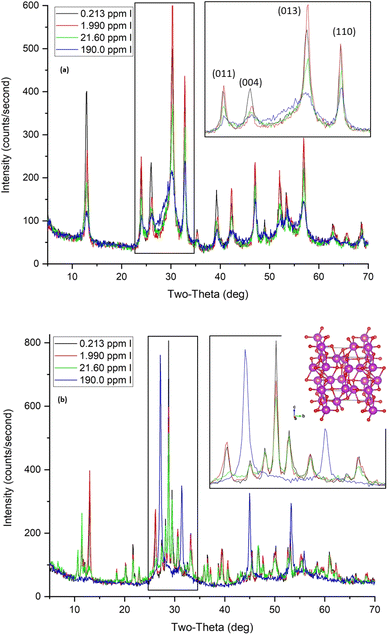
BSN also exhibited good uptake capacity for IO3− (>94%) up to 2 ppm (16 μM; sample C). Hydrolysis reduced the pH of IO3− samples B, C, and D to ∼4.0–4.3 upon contact with BSN (Table 8). There is insufficient HCO3−/CO32− content for transformation to bismutite under these acidic conditions, but the crystal structure does change from clus-Bi12O10(OH)6(NO3)10·6(H2O) to the unidentified layered structure, unk-Bi(NO3)x(OH)yOz, to lay-BiO(OH,Cl) and to clus-Bi6O4(OH)4(NO3)6 (Fig. 12(b)), incorporating Hanford SGW constituents, e.g., Cl−. Clus-Bi6O4(OH)4(NO3)6 was not found in sample D. At the highest IO3− concentration (sample E, 190 ppm, 1.5 mM), the solution pH decreased from 7.9 to 5.8, and the XRD for the solids exhibited sharp peaks corresponding to a face-centered cubic (FCC) structure with a 5.7 Å lattice parameter. A reliable match with Bi-containing reference patterns was not found, but the metastable δ-Bi2O3 has an FCC structure with a similar lattice parameter (Fig. 12(b) inset). Consequently, the material formed at 190 ppm of IO3− may be a compound related to δ-Bi2O3 with IO3− substitution. This structure was not as efficient at IO3− uptake (around 3%) as the structures formed at lower pH (∼4.0–4.3).
To determine IO3− speciation, and assess any potential coordination between Bi and IO3−, the BOH sample with the highest IO3− concentration (2540 ppm or 0.02 M; sample S) in water was analyzed by I K-edge and Bi LIII-edge XANES and EXAFS (Fig. 13 and S10†). The main I K-edge XANES absorption edge for I associated with BOH (black line) and BSN (red line) differs from that for the KIO3 standard (Fig. 13(a)), including a reduction in the intensity of the white line, and a shift to lower energy, corresponding to IO3− reduction. There are also differences in the I K-edge EXAFS (Fig. 13(b)), and a reduction in intensity in the first oxygen shell of BSN, as well as slight amplitude reduction for the first shell in BOH. This may suggest that one of the three I–O bonds of IO3− became elongated, reducing the number of oxygens at the shorter distance. XPDF data show a very small peak right by the peak at 1.92 Å, supporting this observation (Fig. S7†). A similar elongation of the I–O bond length from 1.81 Å to 1.94–1.95 Å was also observed for IO3− adsorbed on chalcopyrite.42
Surface sensitive XPS was performed to investigate the nature of the I species associated with BOH and BSN. The survey scans for sample E (190 ppm or 1.5 mM of I) for BOH and BSN show peaks for I 3d, O 1s, Bi 4p, 4d and 4f, and C 1s, but none of the other components present in Hanford SGW (Fig. S11 and S12†). The binding energies for the Bi 4f7/2 and Bi 4f5/2 regions show a slight shift to higher energies for BOH and BSN exposed to IO3−, compared to BOH and BSN exposed to Hanford SGW only (Fig. S13 and S14†), suggesting slightly lower electron density around Bi in the presence of IO3−. The I 3d XPS spectra for BOH shows two sets of peaks (Fig. 14). The first set of I 3d5/2 and I 3d3/2 peaks at binding energies of 619 and 630.5 eV, respectively, correspond well to an I− species. The second set of I 3d5/2 and I 3d3/2 binding energies are at 624 and 635.5 eV, respectively, which correspond to an IO3− species. To determine if IO3− underwent X-ray beam induced reduction, I 3d XPS spectra were collected for both BSN and BOH with an increasing time of acquisition (Fig. S16†). For BOH, the X-ray beam induced the slow reduction of IO3− to I− with increasing acquisition time (Fig. S16(a)†). Such beam induced reduction was not observed in the I K-edge XANES analysis, but at the high energy of the I K-edge (33 keV), it is likely that this would have occurred immediately upon beam exposure and before collection of the first XANES spectrum. For the BSN, there is only one set of peaks in the I 3d XPS spectra for I 3d5/2 and I 3d3/2 at 624 eV and 635.5 eV, respectively, corresponding to IO3− (Fig. 14). No beam induced reduction of IO3− occurred with BSN (Fig. S16(b)†), which may imply that the IO3− is bound more rigidly.
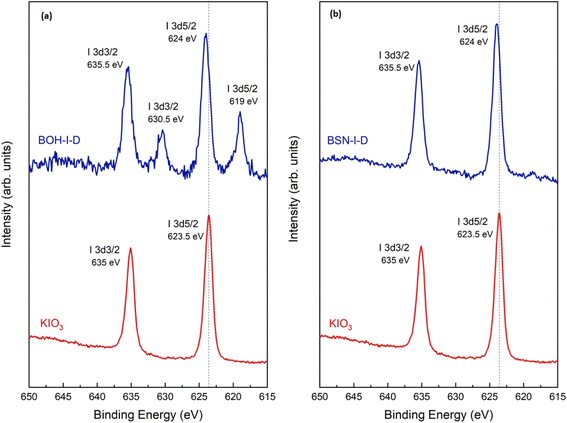 | ||
| Fig. 14 I 3d XPS spectra for (a) BOH exposed to 190 ppm I in Hanford SGW (BOH–I-D) and (b) BSN exposed to 190 ppm (1.5 mM; sample E) I in Hanford SGW (BSN–I-D) for 24 hours. | ||
SEM analysis of BOH after exposure IO3− in Hanford SGW revealed ∼50 μm bismutite particles, some with an irregular morphology, and some with a ‘flower-like’ morphology like those for BOH after exposure to Cr, but with thinner ‘petals’ (Fig. 15). As shown by XRD in Fig. 12(a), IO3− sorbs onto surfaces of the crystallites as they grow, interfering with crystal growth in the (001) plane, resulting in thinner stacks of [Bi2O2]2+, and changing the aggregate morphology from thicker ‘petals’ with CrO42− (Fig. 10) to thinner ‘petals’ with IO3− (Fig. 15), but differences in the initial concentrations (1.5 mM IO3− vs. 0.19 mM CrO42−) should be considered. This structure is very different from the morphology of BOH exposed to Hanford SGW only (Fig. 5), confirming specific interactions between IO3− and BOH. EDS maps showed that the I was evenly distributed over the Bi particles (Fig. 15).
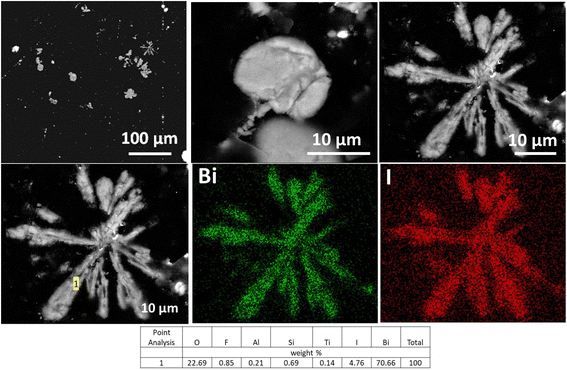 | ||
| Fig. 15 SEM images and EDS maps for BOH exposed to 190 ppm I (1.5 mM; sample E) in Hanford SGW for 24 hours. | ||
SEM analysis showed that the BSN particles exposed to IO3−, identified by XRD as a related to δ-Bi2O3 structure with IO3− substitution, have an irregular morphology very different from bismutite. EDS maps showed that IO3− was closely associated with BSN and evenly distributed over the particles (Fig. 16).
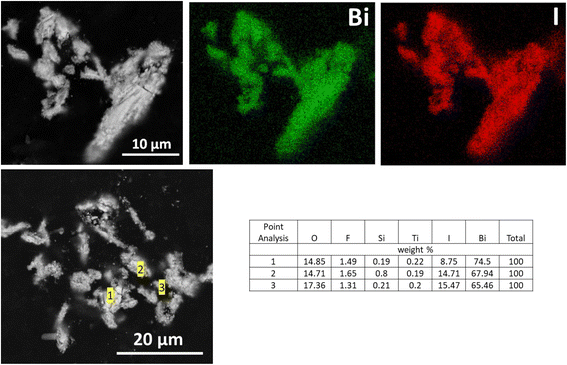 | ||
| Fig. 16 SEM images and EDS maps for BSN exposed to 190 ppm I (1.5 mM; sample E) in Hanford SGW for 24 hours. | ||
The data imply substantial differences between the mechanism of uptake for IO3− by BOH and BSN. At low IO3− concentrations, BOH formed bismutite, with IO3− substituting for CO32−in the interlayer due to their similar ionic radii. At high concentrations, 25.3% of the IO3− was removed from solution by BOH, and reduction of IO3− to I− occurred during XPS data collection. Only 3.4% of the IO3− was removed from solution by BSN under the same conditions, and only IO3− was detected by XPS. This might be because IO3− is more rigidly bound in the δ-Bi2O3 structure formed by the transformation of BSN. Both BOH and BSN remove IO3− (around 84 and 98%, respectively) from solution at lower concentrations (1.7 and 16 μM, samples B and C, respectively) in the presence of common competing anions, but the different uptake mechanisms may affect IO3− retention over longer timescales, and under changing geochemical conditions.
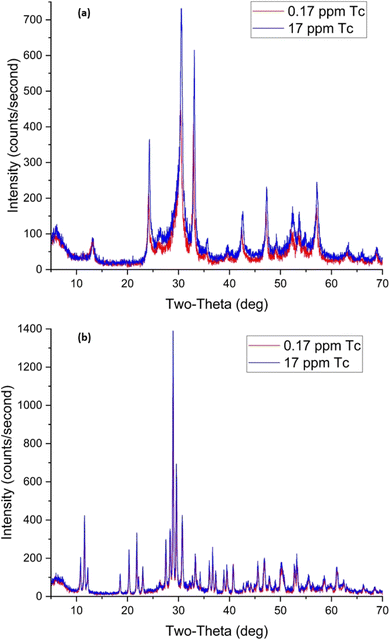 | ||
| Fig. 17 XRD patterns for BOH (a) and BSN (b) after exposure to different concentrations of technetium for 24 hours. | ||
Uptake of TcO4− by BSN under these conditions was twice that for BOH; 34% with 0.017 ppm Tc dropping to 18% with 17 ppm Tc. The pH of the solution dropped to 4.9–5.0 in the presence of BSN (Table 8). The XRD patterns for samples B and D (0.17 ppm, 1.7 μM, and 17 ppm, 170 μM Tc, respectively), are very similar and show that BSN converted into crystalline compounds unk-Bi(NO3)x(OH)yOz and lay-BiO(OH,Cl).
Although the Tc concentration in these solid phases was too low for Tc K-edge XANES and EXAFS, data were collected for BOH with 100 ppm Tc and a lower solution-to-solid ratio, and compared with that for NH4TcO4 (Fig. S17, S18 and Table S3†). The Tc K-edge XANES and EXAFS spectra were very similar, with the prominent pre-edge peak corresponding to tetrahedral TcO4−. There is no indication of any significant differences in the EXAFS data beyond the first shell that might suggest coordination with Bi.
The BOH and BSN sample D (17 ppm, 170 μM Tc) was analyzed by XPS, but the survey scans show that the Tc concentration at the surface was below detection, and peaks were only present for O 1s, Bi 4p, 4d and 4f, and C 1s (Fig. S11 and S12†). However, the binding energies for the Bi 4f7/2 and Bi 4f5/2 regions do shift to higher energies for BOH and BSN in the presence of Tc, compared to BOH and BSN exposed to Hanford SGW (Fig. S13 and S14†).
SEM analysis of BOH after exposure to 17 ppm Tc in Hanford SGW (Fig. 18, top) showed a morphology that resembled the ‘flower-like’ morphology for BOH exposed to Cr (Fig. 10) and I (Fig. 15). SEM analysis of BSN after exposure to 17 ppm Tc in Hanford SGW (Fig. 18, bottom) showed an irregular morphology that had finer nano-scale structure than BSN exposed to Cr (Fig. 11) or I (Fig. 16). It was not possible to obtain an EDS map for Tc as the Bi Mα line at 2.423 KeV and Mβ at 2.526 keV overlaps with Tc Lα at 2.424 KeV and Lβ at 2.537 keV.
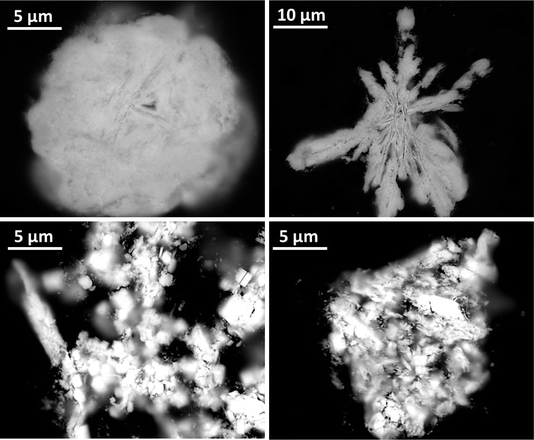 | ||
| Fig. 18 SEM images for BOH (top) and BSN (bottom) exposed to 17 ppm (170 μM; sample D) Tc in Hanford SGW for 24 hours. | ||
The isotherms for BOH and BSN have the same slope and fit (Fig. 6), suggesting that both materials interact with TcO4− by the same, non-specific adsorption mechanism. TcO4− is a large, charge-diffuse anion and only forms outer sphere complexes (as implied by the EXAFS data in Fig. S18†); therefore, the mechanism of interaction involves exchange for the charge balancing NO3− on the surface. Because this is a non-specific interaction, the efficiency of uptake is correlated with the number of available exchange sites, and directly linked to the amount of bismuth in the system. This non-specific interaction also means that TcO4− is susceptible to release from BOH and BSN if there are significant concentrations of competing exchangeable anions in solution.
 | ||
| Fig. 19 XRD patterns for BOH (a) and BSN (b) after exposure to different concentrations of uranium for 24 hours. | ||
BSN exhibited lower capacity for UO22+, taking up 83% at low U concentrations (0.04 ppm), but with uptake decreasing by variable amounts to 59% at 0.4 ppm U, 37% at 4 ppm U, and 54% at 40 ppm U. Solution pH decreased to 4.27 in sample D (40 ppm, 160 μM U), and there was insufficient CO32− in solution to complex with positively charged UO22+, resulting in the formation of neutral UO2SO4 or UO2(NO3)2 species that have poor affinity for positively charged binding sites on BSN (Table 8). The XRD pattern for BSN with 0.4 ppm U shows that it converted from ordered [Bi6O5(OH)3]5+ clusters in the starting material to dis-BiOw(OH)x(NO3)y(CO3)z. The XRD pattern for BSN at the highest U concentration (40 ppm) is consistent with that for unk-Bi(NO3)x(OH)yOz, the unknown crystalline compound formed after exposure of BSN to CrO42−, IO3−, and TcO4− (Fig. 19(b)).
Surface sensitive XPS was performed to investigate the nature of the U species associated with BOH and BSN. The survey scans for sample D (40 ppm U) for both the BOH and BSN materials show peaks for U 4f, O 1s, Bi 4p, 4d and 4f, and C 1s (Fig. S11 and S12†). Peaks for N 1s are present in the survey scan for BSN-U-D, but not for BOH-U-D, suggesting that in the higher pH solution with BOH, the U is complexed with CO32−, and in the lower pH solution with BSN, the U is complexed with NO3−. The binding energies for the Bi 4f7/2 and Bi 4f5/2 regions show a shift to higher energies for BOH and BSN in the presence of U, compared to BOH and BSN exposed to Hanford SGW (Fig. S13 and S14†). Upon deconvolution of the high-resolution scan of the U 4f region (Fig. 20), the U 4f7/2 peak for both BOH and BSN was best fit with a single component, with binding energies of 383.7 and 383.6 eV for BOH and BSN, respectively. These binding energies suggest the presence of U(VI) species. Satellite intensities at about 4 eV and 10 eV above the main peaks are known to be characteristic features for U(VI) compounds.44 The high resolution scans confirmed the presence of significant amount of NO3− associated with the BSN sample, but no NO3− associated with the BOH sample. To determine if U underwent X-ray beam induced reduction, U 4f XPS spectra were collected for both BSN and BOH with increasing acquisition time (Fig. S19 and S20†). As observed previously for IO3−, the BOH sample showed signs of beam-induced reduction from U(VI) to U(V) (Fig. S19†). No beam-induced reduction was observed with the BSN sample (Fig. S20†). These results were also confirmed by bulk XANES spectroscopy at the U LIII-edge (Fig. S21†). For the BOH sample, the intensity of the synchrotron X-ray beam rapidly reduced U(VI) to U(IV), as shown by comparison with the derivative for UO2, but the BSN sample remained as U(VI), with the energy of the derivative shifted to a higher energy corresponding to UO3.
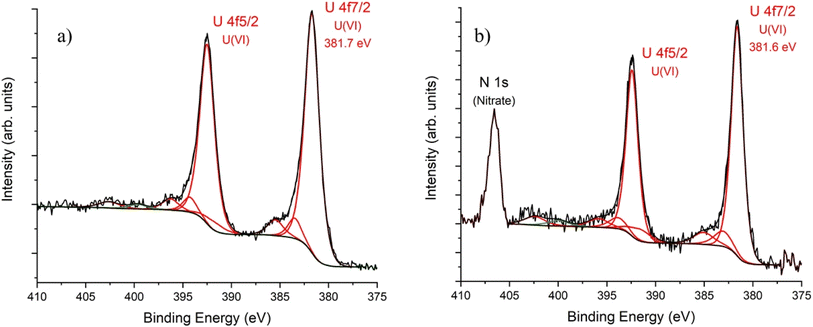 | ||
| Fig. 20 U 4f XPS spectra for (a) BOH and (b) BSN exposed to 40 ppm U (0.16 mM; sample D) in Hanford SGW for 24 hours. The small feature at 399.7 eV (in green) is assumed to be a reduced nitrogen species. Data are shown in black, fit of individual components to spectra in red (see ESI and Tables S4 and S5† for details). | ||
SEM analysis of BOH after exposure to 40 ppm U in Hanford SGW (Fig. 21) showed a morphology that resembled the ‘flower-like’ morphology for Cr (Fig. 10) and I (Fig. 15), but with much finer nano-scale structure. This nano-scale structure is very different from the morphology of BOH exposed to Hanford SGW in the absence of U (Fig. 5), suggesting specific interactions between U and the BOH material that are different from those between both Cr and I and BOH. EDS maps showed that the U was evenly distributed over the Bi particles (Fig. 21).
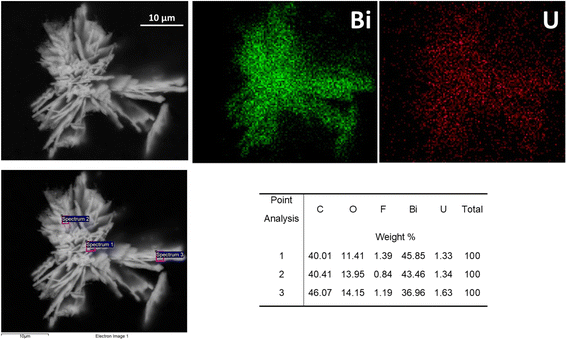 | ||
| Fig. 21 SEM images and EDS maps for BOH exposed to 40 ppm U (160 μM; sample D) in Hanford SGW for 24 hours. | ||
SEM analysis of BSN after exposure to 40 ppm U in Hanford SGW (Fig. 22) showed an irregular morphology that also had much finer nano-scale structure that was more similar to BSN with Tc (Fig. 18, bottom) than BSN with Cr (Fig. 11) or I (Fig. 16). EDS maps showed that the U was evenly distributed over the Bi particles (Fig. 22).
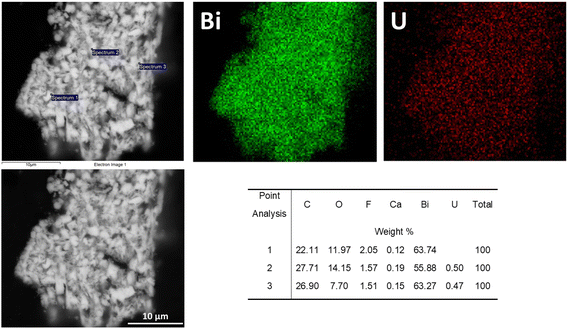 | ||
| Fig. 22 SEM images and EDS analyses for BSN exposed to 40 ppm U (160 μM; sample D) in Hanford SGW for 24 hours. | ||
In Fig. 6, the isotherms for both BOH and BSN have comparable slopes, but BOH exhibited higher efficiency for UO22+ uptake. The mechanism of UO22+ uptake by BSN involves specific interactions between Bi6O4(HO)46+ clusters and UO2(CO3)x2−2x species present in solution. The pH in solutions containing BSN is too low to retain CO32− and the U is predominantly present as neutral species, including UO2(NO3)2 and UO2SO4, consistent with the removal of 14.3 ppm of SO42− from solution in sample D (Table 9). These neutral species will have lower affinity for the layered [Bi2O2]2+-containing structure that forms upon reaction between BSN and Hanford SGW, than the negatively charged UO2(CO3)x2−2x species.
4 Conclusion
A systematic study of commercially available bismuth subnitrate (BSN) and laboratory synthesized bismuth oxyhydroxide nitrate (BOH) was conducted to evaluate structural and functional relationships between these materials and different aqueous environments, increasing in complexity from water, to aqueous solutions containing carbonate, to common groundwater constituents and contaminants.The bismuth-based starting materials undergo hydrolysis and carbonate exchange reactions upon exposure to aqueous solutions over 24 hours. Disordered BOH (dis-BiOw(OH)x(NO3)y(CO3)z) transforms into layered bismutite (lay-Bi2O2(CO3)) in both water and carbonate-containing solutions. The [Bi6O5(OH)3]5+ clusters surrounded by nitrate in BSN (clus-Bi12O10(OH)6(NO3)10·6(H2O)) transform into another clustered compound (clus-Bi6O4(OH)4(NO3)6) in water, and into layered bismutite (lay-Bi2O2(CO3)) in carbonate-containing solutions.
The mechanisms of reaction between contaminants and BOH depend on the contaminant ion and its concentration in solution. At low concentrations of CrO42− and IO3− (<200 μM), removal efficiency by BOH was high, and the mechanism involved sorption onto the (00l) plane of bismutite as it forms from BOH, limiting crystal growth in the direction perpendicular to [Bi2O2]2+ planes. At higher concentrations (>1 mM), CrO42− removal by BOH remained high, but IO3− removal decreased. The high concentrations of CrO42− and IO3− ions limited the transformation of the starting material into the layered bismutite structure, and uptake efficiency was dependent on availability of sorption sites on the BOH starting material. TcO4− removal from solution by BOH was low, with the mechanism involving non-specific adsorption and ion exchange for charge-balancing NO3−, making TcO4− susceptible to release back into solution if high concentrations of other exchangeable anions, e.g., SO42−, are present in solution. Removal of UO22+ species from solution by BOH was near quantitative at all concentrations tested, and occurred via specific interactions between UO2(CO3)x2−2x and CO32− present in the interlayer of bismutite as it formed from BOH.
Hydrolysis of BSN, composed of paired [Bi6O5(OH)3]5+ clusters, substantially reduced solution pH and resulted in the formation of several unidentified phases, including unk-Bi(NO3)x(OH)yOz. At low concentrations of CrO42− and IO3− (<20 μM), removal efficiency by BSN was high, but CrO42− and IO3− uptake decreased substantially at higher concentrations (>∼200 μM). At higher IO3− concentration, a new phase related to δ-Bi2O3 formed, with possible incorporation of IO3− into its structure. Uptake of TcO4− by the BSN transformation product, unk-Bi(NO3)x(OH)yOz, was higher than for the BOH transformation product, bismutite. However, uptake of UO22+ species by BSN was not as high as for BOH. Bismuth-based materials uptake UO22+ species by specific interactions between negatively charged UO2(CO3)x2−2x species that form in solution in the presence of CO32−, and positively charged binding sites in the bismutite interlayer as it forms from the starting material. Therefore, uptake of UO22+ species by BSN was inhibited as there was insufficient CO32− present in solution at the lower pH for UO2(CO3)x2−2x species or bismutite to form.
These results of this study demonstrate that bismuth-based materials exhibit different particle sizes and shapes, structural motifs, crystallinity and anion interactions, depending on the nature of the starting material, the pH of the solution, and the presence of other ions. The remarkable versatility of bismuth-based materials means that they are cost-effective candidates for sequestering co-located contaminants (CrO42−, IO3−, TcO4−, UO22+) in situ under a wide range of aqueous geochemical conditions. Additional work will be conducted to assess the long-term stability of these bismuth-based materials under field-relevant conditions, including the influence of changing groundwater chemistry, and the impact of sediment interactions.
Data availability
The data supporting this article have been included as part of the ESI.†Conflicts of interest
There are no conflicts to declare.Acknowledgements
This document was prepared by the Deep Vadose Zone – Applied Field Research Initiative at Pacific Northwest National Laboratory. Funding for this work was provided by the U.S. Department of Energy (DOE) Hanford Field Office. The Pacific Northwest National Laboratory (PNNL) is operated by Battelle Memorial Institute for the DOE under Contract DE-AC05-76RL01830. Solid phase characterization including XRD interpretation and SEM/EDS were performed in the Environmental Molecular Sciences Laboratory (EMSL), a national scientific user facility sponsored by the Department of Energy's Office of Biological and Environmental Research and located at PNNL. Use of the Advanced Photon Source, an Office of Science User Facility operated by Argonne National Laboratory, was supported by the U.S. DOE under Contract No. DE-AC02-06CH11357. John Fulton is kindly acknowledged for providing the XANES and EXAFS data for CrO42− in solution. The authors greatly appreciate the technical review provided by Mike Truex and Chris Johnson and technical editing provided by Matt Wilburn. The authors would like to thank those who analyzed samples, reviewed data, and helped with experimental equipment, including Keith Geiszler, Steven Baum, Ian Leavy, Megan Nims, Michelle Valenta Snyder, and Ben Williams.References
- M. Ranjan, P. K. Singh and A. L. Srivastav, A review of bismuth-based sorptive materials for the removal of major contaminants from drinking water, Environ. Sci. Pollut. Res., 2020, 27(15), 17492–17504, DOI:10.1007/s11356-019-05359-9.
- (a) T. G. Levitskaia, N. P. Qafoku, M. E. Bowden, R. M. Asmussen, E. C. Buck, V. L. Freedman and C. I. Pearce, A Review of Bismuth(III)-Based Materials for Remediation of Contaminated Sites, ACS Earth Space Chem., 2022, 6(4), 883–908, DOI:10.1021/acsearthspacechem.1c00114; (b) M. E. Leonard, Removal of Radioactive Strontium, Iodine, and Uranium From Contaminated Groundwater: Sorption Processes and Properties, Oregon State University, 2017 Search PubMed.
- C. I. Pearce, E. A. Cordova, W. L. Garcia, S. A. Saslow, K. J. Cantrell, J. W. Morad, O. Qafoku, J. Matyáš, A. E. Plymale and S. Chatterjee, et al., Evaluation of materials for iodine and technetium immobilization through sorption and redox-driven processes, Sci. Total Environ., 2020, 716, 136167, DOI:10.1016/j.scitotenv.2019.136167.
- S. V. Chekalin, A. A. Melnikov and O. V. Misochko, Ultrafast coherent lattice and incoherent carrier dynamics in bismuth: time-domain results, Laser Phys., 2014, 24(9) DOI:10.1088/1054-660x/24/9/094004.
- K. Zhang, D. Zhang, J. Liu, K. Ren, H. Luo, Y. Peng, G. Li and X. Yu, A novel nanoreactor framework of iodine-incorporated BiOCl core–shell structure: enhanced light-harvesting system for photocatalysis, CrystEngComm, 2012, 14(2), 700–707, 10.1039/c1ce05755c.
- B. Bentria, D. Benbertal, M. Bagieu-Beucher, R. Masse and A. Mosset, Crystal structure of anhydrous bismuth iodate, Bi (IO 3) 3, J. Chem. Crystallogr., 2003, 33(11), 867–873 CrossRef CAS.
- S. D. Nguyen, J. Yeon, S. H. Kim and P. S. Halasyamani, BiO(IO3): A new polar iodate that exhibits an aurivillius-type (Bi2O2)2+ layer and a large SHG response, J. Am. Chem. Soc., 2011, 133(32), 12422–12425, DOI:10.1021/ja205456b.
- F. Qin, G. Li, R. Wang, J. Wu, H. Sun and R. Chen, Template-free fabrication of Bi2O3 and (BiO)2CO3 nanotubes and their application in water treatment, Chemistry, 2012, 18(51), 16491–16497, DOI:10.1002/chem.201201989.
- (a) K.-A. Hughes, P. C. Burns and U. Kolitsch, The crystal structure and crystal chemistry of uranosphaerite, Bi(UO2)O2OH, Can. Mineral., 2003, 41(3), 677–685, DOI:10.2113/gscanmin.41.3.677; (b) J. L. Krumhansl and T. M. Nenoff, Hydrotalcite-like layered bismuth–iodine–oxides as waste forms, Appl. Geochem., 2011, 26(1), 57–64, DOI:10.1016/j.apgeochem.2010.11.003; (c) Y. Mizuguchi, Material Development and Physical Properties of BiS2-Based Layered Compounds, J. Phys. Soc. Jpn., 2019, 88(4) DOI:10.7566/jpsj.88.041001; (d) F. Qin, R. Wang, G. Li, F. Tian, H. Zhao and R. Chen, Highly efficient photocatalytic reduction of Cr(VI) by bismuth hollow nanospheres, Catal. Commun., 2013, 42, 14–19, DOI:10.1016/j.catcom.2013.07.039.
- A. R. Lawter, T. G. Levitskaia, O. Qafoku, M. E. Bowden, F. C. Colon and N. P. Qafoku, Simultaneous immobilization of aqueous co-contaminants using a bismuth layered material, J. Environ. Radioact., 2021, 237, 106711 CrossRef CAS PubMed.
- L. Wang, C. Shi, L. Wang, L. Pan, X. Zhang and J.-J. Zou, Rational design, synthesis, adsorption principles and applications of metal oxide adsorbents: a review, Nanoscale, 2020, 12(8), 4790–4815, 10.1039/C9NR09274A.
- DOE, Hanford Site Groundwater Monitoring Report for 2019, 2019 Search PubMed.
- M. Oostrom, M. J. Truex, K. Carroll and G. B. Chronister, Perched-water analysis related to deep vadose zone contaminant transport and impact to groundwater, J. Hydrol., 2013, 505, 228–239 CrossRef CAS.
- M. J. Truex, J. E. Szecsody, N. P. Qafoku, C. E. Strickland, J. J. Moran, B. D. Lee, M. Snyder, A. R. Lawter, C. T. Resch, B. Gartman, et al., Contaminant Attenuation and Transport Characterization of 200-DV-1 Operable Unit Sediment Samples; PNNL-26208, Pacific Northwest National Laboratory, Richland, 2017 Search PubMed.
- A. O. Dada, A. Olalekan, A. Olatunya, A. O. Dada and F. Langmuir, Temkin and Dubinin–Radushkevich Isotherms Studies of Equilibrium Sorption of Zn2+ Unto Phosphoric Acid Modified Rice Husk, J. Appl. Chem., 2012, 3, 38–45, DOI:10.9790/5736-0313845.
- A. Hoeher, S. Mergelsberg, O. J. Borkiewicz, P. M. Dove and F. M. Michel, A new method for in situ structural investigations of nano-sized amorphous and crystalline materials using mixed-flow reactors, Acta Crystallogr., Sect. A, 2019, 75(5), 758–765, DOI:10.1107/S2053273319008623.
- B. H. Toby and R. B. Von Dreele, GSAS-II: the genesis of a modern open-source all purpose crystallography software package, J. Appl. Crystallogr., 2013, 46(2), 544–549, DOI:10.1107/S0021889813003531.
- P. Juhas, T. Davis, C. L. Farrow and S. J. L. Billinge, PDFgetX3: a rapid and highly automatable program for processing powder diffraction data into total scattering pair distribution functions, J. Appl. Crystallogr., 2013, 46(2), 560–566, DOI:10.1107/S0021889813005190.
- C. L. Farrow, P. Juhas, J. W. Liu, D. Bryndin, E. S. Božin, J. Bloch, T. Proffen and S. J. L. Billinge, PDFfit2 and PDFgui: computer programs for studying nanostructure in crystals, J. Phys.: Condens. Matter, 2007, 19(33), 335219, DOI:10.1088/0953-8984/19/33/335219.
- T. Proffen and R. B. Neder, DISCUS, a program for diffuse scattering and defect structure simulations - update, J. Appl. Crystallogr., 1999, 32(4), 838–839, DOI:10.1107/S0021889899004860.
- B. Ravel and M. Newville, ATHENA and ARTEMIS: Interactive graphical data analysis using IFEFFIT, Phys. Scr., 2005, T115, 1007–1010 CrossRef CAS.
- E. A. Cordova, V. Garayburu-Caruso, C. I. Pearce, K. J. Cantrell, J. W. Morad, E. C. Gillispie, B. J. Riley, F. C. Colon, T. G. Levitskaia and S. A. Saslow, et al., Hybrid Sorbents for 129I Capture from Contaminated Groundwater, ACS Appl. Mater. Interfaces, 2020, 12(23), 26113–26126, DOI:10.1021/acsami.0c01527.
- F. Lazarini, The crystal structure of a bismuth basic nitrate, [Bi6O5(OH)3](NO3)5.3H2O, Acta Crystallogr., Sect. B, 1978, 34(11), 3169–3173, DOI:10.1107/S0567740878010419.
- B. Liu, W.-W. Zhou, Z.-Q. Zhou and X.-Y. Zhang, Hydrolysis to the first dumbbell-like high-nuclearity bismuth-oxo cluster [Bi12 (μ3-OH) 4 (μ2-OH) 2 (μ3-O) 8 (μ4-O) 2 (NO3) 6] 4+: Synthesis, structure and spectroscopic characterizations, Inorg. Chem. Commun., 2007, 10(10), 1145–1148 CrossRef CAS.
- B. Tooth, B. Etschmann, G. S. Pokrovski, D. Testemale, J.-L. Hazemann, P. V. Grundler and J. Brugger, Bismuth speciation in hydrothermal fluids: An X-ray absorption spectroscopy and solubility study, Geochim. Cosmochim. Acta, 2013, 101, 156–172, DOI:10.1016/j.gca.2012.10.020.
- D. M. Driscoll, R. C. Shiery, N. D'Annunzio, D. Boglaienko, M. Balasubramanian, T. G. Levitskaia, C. I. Pearce, N. Govind, D. C. Cantu and J. L. Fulton, Water Defect Stabilizes the Bi3+ Lone-Pair Electronic State Leading to an Unusual Aqueous Hydration Structure, Inorg. Chem., 2022, 61(38), 14987–14996 CrossRef CAS PubMed.
- M. Yashima and D. Ishimura, Crystal structure and disorder of the fast oxide-ion conductor cubic Bi2O3, Chem. Phys. Lett., 2003, 378(3), 395–399, DOI:10.1016/j.cplett.2003.07.014.
- D. Langmuir, Aqueous Environmental Geochemistry, Prentice Hall, 1997 Search PubMed.
- W. Stumm and J. J. Morgan, Aquatic Chemistry: Chemical Equilibria and Rates in Natural Waters, John Wiley & Sons, 2012 Search PubMed.
- N. Henry, M. Evain, P. Deniard, S. Jobic, O. Mentré and F. Abraham, [Bi6O4. 5 (OH) 3.5] 2 (NO3) 11: a new anhydrous bismuth basic nitrate. Synthesis and structure determination from twinned crystals, J. Solid State Chem., 2003, 176(1), 127–136 CrossRef CAS.
- N. Henry, M. Evain, P. Deniard, S. Jobic, F. Abraham and O. Mentré, [Bi2O2]2+ Layers in Bi2O2(OH)(NO3): Synthesis And Structure Determination, Z. Naturforsch. B Chem. Sci., 2005, 60(3), 322–327, DOI:10.1515/znb-2005-0315.
- R. Moré, M. Olah, S. E. Balaghi, P. Jäker, S. Siol, Y. Zhou and G. R. Patzke, Bi2O2CO3 Growth at Room Temperature: In Situ X-ray Diffraction Monitoring and Thermal Behavior, ACS Omega, 2017, 2(11), 8213–8221, DOI:10.1021/acsomega.7b01359.
- L. Afonina, T. I. Limasova, I. A. Vorsina and M. I. Tatarintseva, About interaction of oxo-hydroxo-bismuth nitrate with ammonia carbonate solutions, Sib. Khim. Zh., 1993, 2, 58–64 Search PubMed.
- Y. Wang, B. Wang, W. Jiang, Z. Liu, J. Zhang, L. Gao and W. Yao, Sub-2 nm ultra-thin Bi2O2CO3 nanosheets with abundant Bi-O structures toward formic acid electrosynthesis over a wide potential window, Nano Res., 2022, 15(4), 2919–2927, DOI:10.1007/s12274-021-3903-0.
- B. Markiewicz, I. Komorowicz, A. Sajnóg, M. Belter and D. Barałkiewicz, Chromium and its speciation in water samples by HPLC/ICP-MS – technique establishing metrological traceability: A review since 2000, Talanta, 2015, 132, 814–828, DOI:10.1016/j.talanta.2014.10.002.
- T. G. Levitskaia, M. J. O'Hara, S. I. Sinkov and O. B. Egorov, Direct Spectrophotometric Analysis of Cr(VI) Using a Liquid Waveguide Capillary Cell, J. Appl. Spectrosc., 2008, 62(1), 107–115 CrossRef CAS PubMed.
- Y. Marcus, Ionic radii in aqueous solutions, J. Solution Chem., 1983, 12(4), 271–275, DOI:10.1007/BF00646201.
- B. S. Brčić, D. Kolar, F. Lazarini and M. Malešič, Oxydation of bismuth with atmospheric oxygen in the presence of diluted nitric acid, Chem. Mon., 1973, 104, 365–375, DOI:10.1007/BF00903101.
- M. M. Hoffmann, J. G. Darab and J. L. Fulton, An Infrared and X-ray Absorption Study of the Equilibria and Structures of Chromate, Bichromate, and Dichromate in Ambient Aqueous Solutions, J. Phys. Chem. A, 2001, 105(10), 1772–1782, DOI:10.1021/jp0027041.
- S. Fendorf, M. J. Eick, P. Grossl and D. L. Sparks, Arsenate and chromate retention mechanisms on goethite. 1. Surface structure, Environ. Sci. Technol., 1997, 31(2), 315–320 CrossRef CAS.
- Q. Han, J. Pang, X. Wang, X. Wu and J. Zhu, Synthesis of Unique Flowerlike Bi2O2(OH)(NO3) Hierarchical Microstructures with High Surface Area and Superior Photocatalytic Performance, Chem.—Eur. J., 2017, 23(16), 3891–3897, DOI:10.1002/chem.201604085.
- K. Li, Y. Zhao, P. Zhang, C. He, J. Deng, S. Ding and W. Shi, Combined DFT and XPS investigation of iodine anions adsorption on the sulfur terminated (001) chalcopyrite surface, Appl. Surf. Sci., 2016, 390, 412–421 CrossRef CAS.
- (a) E. L. Mühr-Ebert, F. Wagner and C. Walther, Speciation of uranium: Compilation of a thermodynamic database and its experimental evaluation using different analytical techniques, Appl. Geochem., 2019, 100, 213–222, DOI:10.1016/j.apgeochem.2018.10.006; (b) E. L. Campbell, T. G. Levitskaia, M. S. Fujimoto, V. E. Holfeltz, S. D. Chatterjee and G. B. Hall, Analysis of Uranium Ion Exchange Resin from the 200 West Pump-And-Treat Facility; PNNL-28062, Pacific Northwest National Laboratory, Richland, WA, 2018 CrossRef.
- E. S. Ilton and P. S. Bagus, XPS determination of uranium oxidation states, Surf. Interface Anal., 2011, 43(13), 1549–1560, DOI:10.1002/sia.3836.
Footnote |
| † Electronic supplementary information (ESI) available. See DOI: https://doi.org/10.1039/d5ta00985e |
| This journal is © The Royal Society of Chemistry 2025 |

