
 Open Access Article
 This Open Access Article is licensed under a Creative Commons Attribution-Non Commercial 3.0 Unported Licence
Methane adsorption in an SDS–oil–cellulose compound system: an experimental and interface simulation study†
Tianle Liu ab,
Junhui Kou*ab,
Guosheng Jiangab,
Yuanhai Panab,
Guokun Yangab,
Chenghang Zhangb,
Zerang Liab and
Xiaoyang Nib
ab,
Junhui Kou*ab,
Guosheng Jiangab,
Yuanhai Panab,
Guokun Yangab,
Chenghang Zhangb,
Zerang Liab and
Xiaoyang Nib
aUnconventional Cementing and Special Reinforcement Laboratory, China University of Geosciences, Wuhan 430074, China. E-mail: cugkou@cug.edu.cn
bFaculty of Engineering, China University of Geosciences, Wuhan, 430074, China
First published on 14th May 2025
Abstract
Methane leakage presents serious environmental hazards and explosion risks, while conventional mitigation methods such as gas venting remain inefficient and environmentally unfriendly. This study presents a novel oil–water composite adsorbent system that leverages the synergistic effects of cellulose acetate propionate (CAP), plant oils, and surfactants to enhance methane adsorption efficiency. Characterization experiments and molecular dynamics simulations were conducted to investigate the interfacial properties and the mechanisms by which CAP influences interactions and adsorption capacity. Adsorption and spraying experiments were carried out to investigate the effects of different plant oils (castor, olive, linseed), surfactant-to-oil mass ratios, and CAP presence on methane adsorption capacity. Results showed a highest adsorption efficiency of 14.36% was achieved at a surfactant-to-castor oil ratio of 7.5![[thin space (1/6-em)]](https://www.rsc.org/images/entities/char_2009.gif) :1 in the solution containing CAP. CAP addition increased micelle size and improved methane adsorption. However, in spraying tests, CAP did not significantly enhance methane adsorption capacity. The highest methane adsorption concentration of 6.73% vol. was achieved at a surfactant-to-castor oil ratio of 7.5:1. Molecular dynamics simulations revealed that CAP substantially lowered interfacial tension and reduced the free energy barrier for methane diffusion. The distribution coefficient of methane in the CAP-containing system was 2.67 log units, indicating a stronger affinity for methane. Radial distribution function analysis revealed that the nitrogen-containing groups in CAP enhance interfacial interactions, thereby improving the aggregation patterns of the oil–surfactant system, facilitating methane transport within the oil–water system. These integrated experimental and computational findings provide new insights into designing efficient methane adsorbents and offer theoretical guidance for their practical application.
:1 in the solution containing CAP. CAP addition increased micelle size and improved methane adsorption. However, in spraying tests, CAP did not significantly enhance methane adsorption capacity. The highest methane adsorption concentration of 6.73% vol. was achieved at a surfactant-to-castor oil ratio of 7.5:1. Molecular dynamics simulations revealed that CAP substantially lowered interfacial tension and reduced the free energy barrier for methane diffusion. The distribution coefficient of methane in the CAP-containing system was 2.67 log units, indicating a stronger affinity for methane. Radial distribution function analysis revealed that the nitrogen-containing groups in CAP enhance interfacial interactions, thereby improving the aggregation patterns of the oil–surfactant system, facilitating methane transport within the oil–water system. These integrated experimental and computational findings provide new insights into designing efficient methane adsorbents and offer theoretical guidance for their practical application.
1. Introduction
Methane is a flammable and explosive gas.1,2 Methane leaks are sudden events that can easily cause secondary disasters,3 posing a serious threat to industrial production and the safety of urban residents.4,5 Despite extensive research by both industry and academia in recent years, gas leak incidents continue to occur.6,7 Methane is a common energy source widely used in both daily life and industry.8 Once a leak occurs, especially within confined spaces, methane is prone to quickly accumulate to explosive concentrations.9 Such leaks in confined spaces often cause serious explosions, resulting in significant casualties and property damage. Therefore, it is crucial to develop effective technologies to control methane leaks.Methane leak prevention technologies primarily focus on controlling methane concentration, preventing methane accumulation, and inhibiting methane explosions.10,11 From an intrinsic safety perspective, strictly controlling methane concentration can prevent harm from methane gas leaks at the source. Techniques for actively reducing methane concentration mainly rely on adsorption methods, including porous materials12,13 and water-based materials.14–16 Among these, water-based materials are more cost-effective and environmentally friendly,3 and they can be integrated into urban fire protection systems. However, the development of water-based adsorption materials for methane leakage remains limited, and the mechanism of methane adsorption is not yet clear.
In the field of methane leak treatment, water-based material technology has garnered significant attention from researchers.17–19 Li et al.9 investigated the effect of water on methane explosion pressure in confined spaces. Yang et al.20,21 studied the effectiveness of various water-based composite spray solutions in inhibiting methane explosions. These studies demonstrated that spraying water-based materials was effective in reducing the risk of methane explosions. However, current research on water-based composite solutions mainly focuses on explosion suppression through spraying. There is limited research on adsorption solutions that can both adsorb methane and reduce the reactivity of the explosion chain reaction. If the spray composite solution can reduce the concentration of leaked methane below the explosion limit, it can prevent explosions and better protect people and property. Therefore, developing water-based materials capable of effectively adsorbing and reducing the concentrations of leaked methane is crucial for industrial safety, especially in workplaces with confined spaces at risk of methane leakage. Numerous studies have confirmed that surfactant solutions can adsorb methane.22–24 Composite solutions containing surfactants and castor oil can effectively adsorb and dissolve methane, thereby reducing methane concentrations in the environment. Zhang et al.3 utilized the micellar solubilization effect of sodium dodecyl sulfate (SDS) and employed castor oil as an adsorption enhancer to develop a water-based material capable of adsorbing mine methane and suppressing gas explosions. Currently, there is limited research on the effectiveness of water-based composite solutions in adsorbing leaked methane. Our understanding of the specific contributions of water-based composite solutions to methane adsorption remains insufficient, particularly regarding the underlying mechanisms at the gas–liquid interfaces in multi-component systems, which require further in-depth investigation.
Molecular dynamics (MD) simulations have emerged as a powerful tool and have been widely used in recent years to study gas–liquid interface systems. MD simulations are widely used to analyse molecular diffusion characteristics and interactions within interfaces. Zhang et al.25 investigated the effects of inorganic salts on SDS foam systems, finding that inorganic salts enhance foam stability by reducing gas–liquid interfacial tension and increasing interfacial strength. Currently, research on the interaction mechanisms between methane and liquid interfaces primarily relies on MD simulations. Zhang et al.26 studied the impact of methane on oil–water interfaces, discovering that an increase in the number of methane molecules leads to greater interfacial roughness and thickness, which in turn lowers interfacial tension and enhances compatibility between the two phases. Lin et al.27 examined the migration characteristics of methane at the SDS aqueous solution interface, finding that the addition of SDS did not significantly increase methane solubility in water. Instead, it raised the free energy barrier for methane transfer across the interface, thus creating a higher mass transfer resistance for methane. Some studies suggested that surfactants may reduce interfacial tension and adhesion energy.28,29 Extensive research has been conducted on the interfacial properties of water-based composite systems, but the interaction mechanisms between methane molecules and these interfaces remain under debate. Studies on the effect of additive oil–water systems on methane adsorption in solutions are still limited. Clarifying the interaction patterns between methane molecules and gas–liquid interfaces is key to improving the performance of water-based adsorption materials.
This study aims to develop a novel cellulose-based oil–water composite solution for capturing leaked methane, while investigating its gas–liquid interfacial properties and the underlying methane adsorption mechanisms. Experiments were conducted on the newly prepared composite solution to measure methane solubility with various additive ratios and evaluate its adsorption efficacy in spray applications. MD simulations were used to clarify the diffusion characteristics of methane and interactions at various gas–liquid interfaces. The results indicated that the addition of cellulose acetate propionate (CAP) altered the aggregation patterns of the oil–surfactant system and reduced the solution's surface tension and free energy barrier, facilitating the diffusion and dissolution of methane molecules within the solution. These findings provide valuable insights for the development and design of new adsorption solutions for methane leak remediation.
2. Experimental
2.1 Materials
CAP (AR) and SDS (AR, 98%) were procured from Macklin Reagents Co., Ltd (China). Castor oil (CO; USP, 99%), olive oil (OO; AR, 98%), linseed oil (LO; USP, 99%) and ethyl acetate (EA; 99.5%) were acquired from Sinopharm Chemical Reagent Co., Ltd (China). Methane standard gas (15.9 mg m−3) was supplied by Wuhan Maotu Runda Gas Co., Ltd.2.2 Preparation of the adsorption solution
Weighted quantities of SDS at 0.20 g, 0.50 g, 1.00 g, 1.50 g, and 2.00 g were separately placed into 100 mL beakers. To each beaker, 80 mL of deionized water and 0.20 g of CO, OO, or LO was added. The mixtures were then stirred continuously for 1 hour at 500 rpm using a magnetic stirrer to ensure thorough dissolution. Subsequently, the solutions were transferred into 100 mL volumetric flasks, brought to volume and labelled. This process yielded surfactant–oil composite solutions with ratios of 1:1, 2.5:1, 5:1, 7.5:1, and 10:1. Following this, 0.20 g of CAP and 3.00 g of EA were added to each solution, and stirring was continued for another hour at 500 rpm with a magnetic stirrer to obtain the final surfactant–oil–CAP composite adsorption solution. The samples were labelled as COCAP, OOCAP, and LOCAP respectively.
2.3 Apparatus
The methane adsorption capacity of the adsorption solution was determined using a gas chromatograph (GC-950). The particle sizes of samples were determined by dynamic light scattering using a Zetasizer Nano-ZS 90 (Malvern Instruments Ltd, U.K.) at a fixed detector angle of 90°. Each sample was measured and the measurements were repeated three times. The spray adsorption test equipment was used to assess the ability of the solution samples to spray and adsorb methane. The equipment comprises a closed adsorption cavity (10 L volume), an atomization spray unit (produced by Yuyue (manufacturer), with an atomization rate of 0.2 mL min−1), and a methane filling and concentration monitoring system. The equipment tests the adsorption capacity of the spray solution samples for methane within the closed cavity under normal temperature and pressure conditions. The methane filling system and the concentration detection system are utilized to regulate the initial methane concentration in the closed cavity and monitor concentration changes over time. Detailed information regarding the equipment is available in Fig. S1.†2.4 Methane adsorption capacity measurement and spray application experiment
(A) Sample preparation: samples were collected using a headspace vial with a valve. First, 100 mL of methane standard gas (15.9 mg m−3) was collected into a 100 mL headspace vial using the displacement method. Then, 20 mL of the composite solution was drawn with a syringe and injected into the headspace vial. The valve was immediately closed and the vial was manually shaken for one minute at a frequency of 100 shakes per minute to ensure thorough adsorption of methane by the liquid. Next, a 50 mL gas sample was extracted from the headspace vial to serve as the experimental group to be tested. To ensure the accuracy of the experiment, the composite solution was replaced with deionized water and the above process was repeated. The obtained gas sample was used as the control group. Fig. 1 shows the method of sample preparation and testing process for methane concentration in the sample.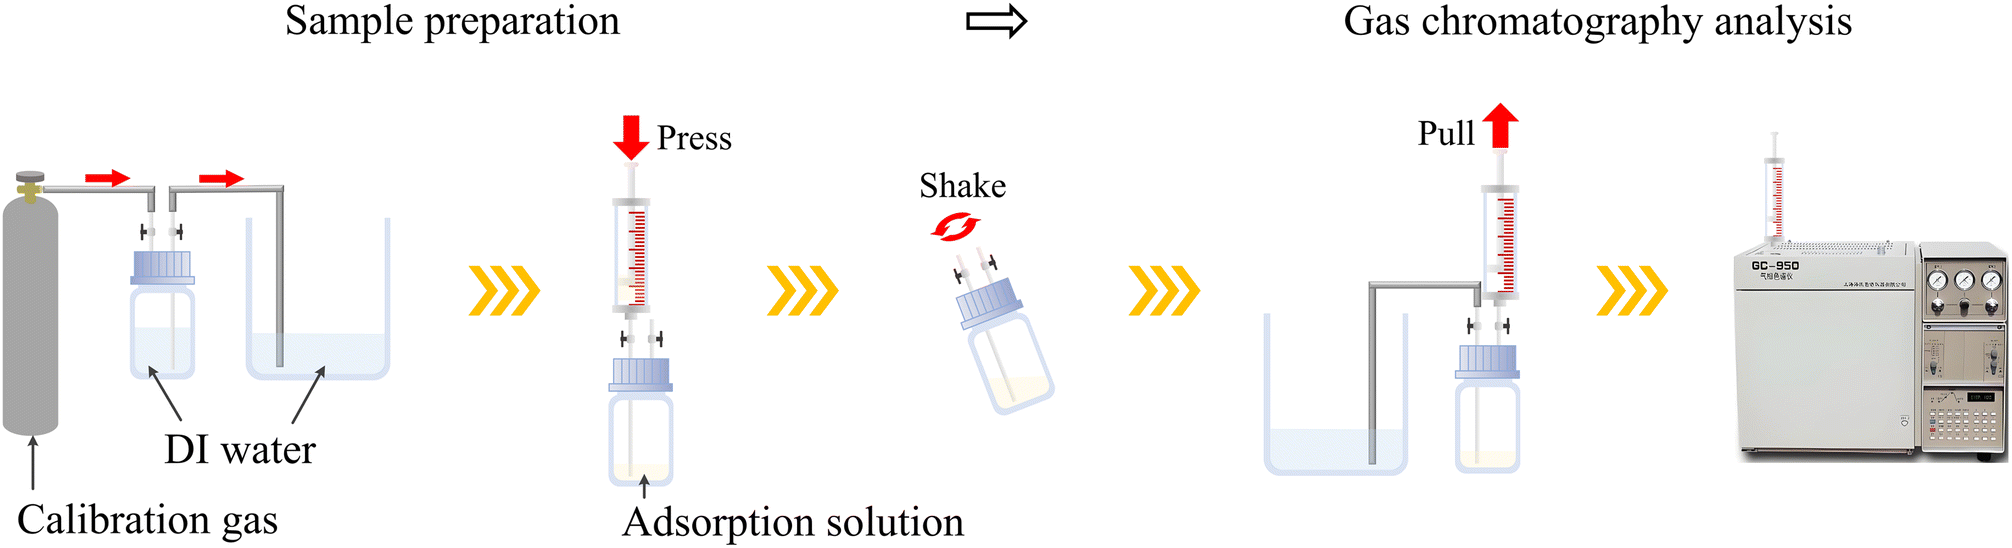 | ||
| Fig. 1 Testing process for methane concentration in samples. | ||
(B) Determination of methane concentration in samples: the gas chromatograph was set to the following operating conditions: a column temperature of 60 °C, a vaporization chamber temperature of 360 °C, and a detector temperature of 120 °C, with a gas injection volume of 50 mL. After allowing the instrument to preheat and stabilize, the methane standard gas was injected using a syringe for gas chromatography analysis to plot the standard curve. Subsequently, gas samples were injected in turn for detection. The testing method employed two parallel sample measurements.
(C) Data analysis: the methane adsorption efficiency of the adsorption solution was calculated using eqn (1).30
 | (1) |
(D) Spray application experiment: prior to the beginning of the spray experiment, methane gas was initially filled into the closed cavity. To simulate the upper explosion limit, the methane concentration within the container was regulated at 15% vol.31 The prepared solution samples were loaded into the atomization spray unit and sprayed for 30 minutes. Simultaneously, deionized water spraying was set as a control group, and it was sprayed for 30 minutes. The changes in methane concentration in the container, measured by the methane concentration meter, were recorded.
2.5 Molecular dynamics simulation
The molecular models were created using Materials Studio.27 Four MD models of solutions were constructed using a sandwich model,32,33 consisting of 2800 water molecules, 1200 methane molecules, 48 SDS molecules, 20 CO molecules, 20 CAP molecules, and 600 EA molecules. The first model WS, shown in Fig. 2(a), features a central layer of methane molecules, flanked by two layers of SDS surfactants on each side, and outer layers of water molecules. The second model OS, illustrated in Fig. 2(b), has two layers of CO on the outer sides of the methane layer and the surfactant layers. The third model WSO, depicted in Fig. 2(c), arranges the layers in the order of CO, surfactant, and water molecules on both sides of the methane layer. The fourth model WSOC, as shown in Fig. 2(d), consists of layers of CO, EA, and CAP on both sides of the methane layer, followed by surfactant and water layers. The interfacial area between the layers is 44 × 44 nm2. | ||
| Fig. 2 Configuration of the sandwich simulation system after NPT: (a) WS system: water/SDS/methane; (b) OS system: CO/SDS/methane; (c) WSO system: water/SDS/CO/methane; (d) WSOC system: water/SDS/CO + CAP + EA/methane. | ||
After constructing the simulation box, geometric optimization was performed to minimize energy, followed by density optimization within the box using the isobaric–isothermal NPT ensemble in a pressure range of 10–4 GPa.34 One MD simulation was conducted under the NVT ensemble at a temperature of 298 K for 500000 timesteps.27,35 Temperature control was achieved using the Andersen method,36,37 with the COMPASS force field employed for the simulations.38,39 The Ewald method and an atom-based approach with a cutoff of 15.5 Å were utilized to calculate electrostatic and intermolecular interactions.40 The analysis focused on the concentration profile of methane molecules, diffusion coefficients, surface tension, and the relative free energy distribution. The radial distribution function (RDF)41 was calculated to analyse the effect of CAP on the interactions within the oil–surfactant systems.
The diffusion coefficient of methane was calculated using the Einstein relation,42 as shown in eqn (2):
 | (2) |
The relative free energy of methane was calculated using eqn (3):43
 | (3) |
The RDF is defined as the ratio of the density of particle B around particle A at a distance r to the bulk density, as shown in eqn (4).
 | (4) |
3. Results and discussion
3.1 The effect of oils and CAP on methane adsorption
Table S1† presents the adsorption efficiency of adsorption solutions using different plant oils, as well as the concentrations of the standard gas after treatment with adsorption solutions of various ratios. Fig. 3 illustrates the adsorption efficiency of different plant oil composite adsorption solutions under various ratios of surfactants to plant oils. The standard gas concentrations of the control group treated only with deionized water were 14.23 and 14.35 mg m−3, respectively. The root mean square error of two parallel experiments was 0.0636, which was acceptable. | ||
| Fig. 3 Methane concentration and methane adsorption rate of composite solution samples with different SDS to oil ratios. | ||
The results indicate that the adsorption efficiency of the CO composite solution is significantly greater than that of the OO and LO composite solutions. The efficiency of OO is slightly higher than that of LO. As the proportion of the surfactant increases, the methane adsorption efficiency of the adsorption solution gradually improves. At a surfactant to plant oil ratio of 5:1, the methane adsorption rates of all three different plant oil composite solutions reach their peak. Thereafter, as the SDS ratio continues to rise, the methane adsorption rate gradually decreases. The highest methane adsorption rate is observed with the SDS–CO 5:1 composite solution, reaching 11.99%.
0.2 g of CAP was added to the surfactant–oil composite system, as shown in Fig. 3. The differences in methane adsorption rates of different plant oil composite systems were compared at different ratios, where the methane adsorption rate is expressed as the average value of two parallel samples. It can be seen that for the same plant oil complex system and the system without added CAP, the trend of methane adsorption rate is roughly the same, with an increase of 0.55–3.45% in adsorption rate. In this case, the composite solution with the highest methane adsorption rate is COCAP, with a ratio of 7.5:1, and an adsorption efficiency of 14.36%.
SDS has a hydrophilic tail and a hydrophobic head. When its concentration exceeds the critical micelle concentration, SDS molecules form micelles in the solution. The hydrophobic interior of these micelles allows non-polar gases like methane to dissolve within them. When molecules of CO and other plant oils collide with the micelle interface, they get incorporated into the micelles, forming oil-containing micelle aggregates. Studies have shown that the size of micelles in SDS composite solutions increases with rising SDS concentration.44 As the SDS concentration increases, it more effectively forms aggregates with plant oils, encapsulating the oil within the micelles. This leads to an expansion in the size of the micelle aggregates, structural changes, and an increase in specific surface area, providing more hydrophobic space for methane molecules.3 This explains why higher SDS concentration enhances methane adsorption. CAP is hydrophobic like plant oils and can be incorporated into SDS micelles, forming aggregates with a larger specific surface area, thereby increasing the contact area with methane molecules. On the other hand, the addition of cellulose can inhibit the aggregation of plant oil molecules, improving the stability of the composite solution and enhancing its methane adsorption rate.
3.2 Spray adsorption test
To further test the spray adsorption capacity of the adsorption solution for methane gas, a methane leakage scenario was simulated using spray adsorption test equipment. Fig. 4(a–e) show the changes in methane concentration within a closed cavity as different adsorption solutions are sprayed. Table 1 and Fig. 4(f) present the spray adsorption capacities of various adsorption solution samples for methane. The spray solution sample CO, with an SDS to oil mass ratio of 7.5:1, exhibited the highest methane adsorption concentration, reaching 6.73% vol. In samples containing CAP, most exhibited a slight increase in methane adsorption capacity under spray conditions (with an increase in methane concentration of 0.02–0.13%). The addition of CAP did not significantly enhance methane adsorption capacity in the spray scenario. When the mass ratio of SDS to oil was 5:1, the OOCAP and LOCAP samples showed a decrease in adsorption capacity compared to the OO and LO samples (by 0.04% and 0.13%, respectively). Similarly, the COCAP sample with a 7.5:1 ratio exhibited a 0.02% decrease compared to the CO sample.
 | ||
| Fig. 4 Changes of methane concentration in the closed cavity with spraying time and the methane concentration adsorbed by the samples for 30 min: (a–e), curves of methane concentration over time in the closed cavity after spraying samples with different SDS and oil mass ratios; (f) column chart of methane concentration adsorbed by spray samples. | ||
| Samples | Mass ratio of SDS to oil | ||||
|---|---|---|---|---|---|
| 1:1 |
2.5:1 |
5:1 |
7.5:1 |
10:1 |
|
| CO | 6.13% vol. | 6.32% vol. | 6.39% vol. | 6.73% vol. | 6.40% vol. |
| COCAP | 6.19% vol. | 6.36% vol. | 6.47% vol. | 6.49% vol. | 6.42% vol. |
| OO | 5.91% vol. | 5.98% vol. | 6.17% vol. | 6.08% vol. | 6.06% vol. |
| OOCAP | 5.93% vol. | 6.04% vol. | 6.13% vol. | 6.21% vol. | 6.17% vol. |
| LO | 5.31% vol. | 5.42% vol. | 6.01% vol. | 5.46% vol. | 5.45% vol. |
| LOCAP | 5.39% vol. | 5.44% vol. | 5.50% vol. | 5.56% vol. | 5.54% vol. |
By comparing the slopes of the curves in Fig. 4, it can be observed that the rate of methane concentration decrease varies with different samples during spraying. When spraying the CO sample, the initial rate of methane concentration decrease is the slowest. However, as spraying continues, its methane adsorption amount becomes the highest, except for the COCAP sample. Recent studies have confirmed that CO can effectively enhance methane adsorption capacity,45 and that its combination with surfactants enhances the formation of methane hydrates.46–48 Additionally, samples with CAP added show a significantly higher initial rate of methane concentration decrease compared to those without CAP. The results indicate that, consistent with previous adsorption capacity tests, the CO and COCAP samples exhibit the highest adsorption capacity under spray conditions, followed by the OO and OOCAP samples, with the LO and LOCAP samples showing the weakest adsorption capacity. Under spray conditions, the addition of CAP accelerates the rate of methane concentration decrease but does not significantly enhance the overall methane adsorption capacity of the samples.
Compared to methane adsorption tests, the enhancement of methane adsorption capacity observed with the addition of CAP in spray adsorption tests was less significant. The possible reason is that the adsorption solution was uniformly dispersed as ultra-fine water mist droplets, which increased the contact area between the dispersed methane molecules and the micelle aggregates in the composite solution system.49 This allowed methane molecules to be captured more easily by the micelle aggregates. At this point, the effect of CAP on increasing the specific surface area of the micelle aggregates was not pronounced, leading to minimal enhancement in methane solubility. Furthermore, the amount of composite solution samples used in the spray adsorption tests was relatively small (10 mL), yet as the spray amount increased, the methane concentration continued to decrease. Compared to previous studies that reported a methane adsorption rate of 2.8% within 30 minutes using surfactant composite solutions,50 this research developed the CAP-based composite solution that achieved a methane adsorption rate of 6.73%. This improvement is acceptable for practical applications in methane leak remediation.
3.3 Physical and chemical properties of the adsorption solution
The adsorption capacity tests revealed that CO and COCAP samples showed the best methane adsorption. To investigate the effect of CAP, the particle sizes of CO and COCAP samples with an SDS to CO mass ratio of 5:1 were measured. Each solution was measured three times in parallel. The average particle size of the CO sample was 43.9 nm, and the average particle size of COCAP was 212 nm. Fig. 5(a) shows the particle size distribution of CO and COCAP samples. Results indicated that both samples have nanoscale particle sizes, with the particle size of COCAP being nearly five times that of CO. The addition of CAP significantly increased the particle size of the adsorption solution. This phenomenon may be attributed to the presence of CAP influencing the interactions among oil–surfactant micelle aggregates, thereby altering the molecular aggregation patterns within the micelle interface. Such changes can lead to modifications in the aggregate structure and result in an increased particle size.51 The enlarged aggregates are likely to provide enhanced hydrophobicity suitable for non-polar methane molecules, which may explain the improved methane adsorption capacity observed in the composite solutions containing CAP. Further analysis of this hypothesis is conducted in Section 3.6 through MD simulation.
 | ||
| Fig. 5 Particle size distribution and density analysis of the samples: (a) particle size distribution; (b) density measurement. | ||
Fig. 5(b) shows the density of plant oils (CO, OO, LO) in solution systems with SDS and CAP. It is obvious that the density of the composite solution increases after adding the CAP stabilizer. This indicates that when oil and surfactants are closer together, intermolecular interactions are strengthened, resulting in an increase in density.52 The strength and cohesion of intermolecular forces within the solvent are influenced by the formation and enhancement of new forces between the oil and surfactant.53 The higher the density, the stronger the intermolecular and electrostatic interactions. Density describes the overall characteristics of a solution. As hydrophobicity increases, density also rises. This is due to the disruption of hydrogen bonds, which weakens local cohesion and enhances intermolecular interactions in the bulk phase, ultimately leading to an increase in density.54 In the composite solutions studied, both plant oils and surfactants exhibit hydrophobic molecular structures. In this solution system, the increase in density is accompanied by an increase in hydrophobicity. Our findings show that the methane adsorption rates of the three plant oil composite solutions increase with the increase in density, which to some extent reflects the law of methane adsorption capacity of plant oil–surfactant composite solutions, that is, the higher the density, the stronger the adsorption capacity. As the solution density increases, the cohesion weakens and the intermolecular hydrophobicity increases, which has a certain enhancing effect on the adsorption of methane.
3.4 Molecular dynamics simulation of methane diffusion
MD simulations were used to study the diffusion and distribution of methane in various solution systems. Fig. 6 illustrates the relative concentration of methane molecules along the principal axis in four different solution systems. It can be observed that methane molecules are primarily distributed in the centre of the system, flanked by liquid phases on both sides. | ||
| Fig. 6 Relative concentration distribution of methane molecules in different molecular models: (a) comparison of four molecular models; (b) WS system model; (c) OS system model; (d) WSO system model; (e) WSOC system model. | ||
Fig. 6(b) illustrates the relative concentration of methane molecules along the principal axis in the WS system. Two peaks in methane concentration (2.73% and 2.36%) are observed at the SDS interface, attributed to the interaction between methane and the hydrophobic chains of SDS molecules.27,55 These peaks can be defined as methane adsorption layers, indicating aggregation of methane. In the aqueous phase, the concentration of methane is zero. Fig. 6(c) shows the relative concentration of methane molecules in the OS system. Unlike the WS system, multiple peaks occur in both the SDS layer and the oil phase, indicating that methane molecules can penetrate the SDS layer and dissolve into CO. As seen in Fig. 6(a), the OS system exhibits an increased distance between the two head-group peaks, reduced peak methane concentration (2.18% and 2.06%), and greater methane solubility in the oil phase compared to the WS system. The diffusion coefficients of methane in the WS and OS systems are 5.02 × 10⁻⁴ m2 s−1 and 5.77 × 10⁻⁴ m2 s−1, respectively. Methane molecules diffuse more rapidly in the OS system compared to the WS system.
Fig. 6(d) illustrates the relative concentration of methane molecules in the WSO system. Two peaks (2.85% and 2.71%) are observed at the CO interface, with additional peaks within the oil phase and SDS layer, indicating that methane molecules can penetrate and diffuse throughout both the oil phase and SDS. The concentration of methane is zero in the aqueous phase. In the WSO system, methane predominantly distributes at the CO interface and the hydrophobic end of SDS.27 Compared to the OS system, as shown in Fig. 6(a), methane molecules in the WSO system penetrate the entire oil phase, resulting in a higher concentration within the CO layer. This occurs because, in the WSO system, the hydrophobic and hydrophilic ends of SDS interact with CO and water, respectively, forming a layered structure.56 Fig. 6(e) displays the relative concentration of methane in the WSOC system. Multiple sharp peaks at the liquid interface and interior suggest that methane can penetrate and diffuse within the liquid phase composed of CO, CAP, and EA, as well as into the SDS layer. The concentration of methane in the aqueous phase remains zero. As shown in Fig. 6(a), compared to the WSO system, the WSOC system with added CAP displays higher peak methane concentrations (3.76% and 3.46%) at the interface and greater methane adsorption. Additionally, the peak relative concentration of methane in the liquid phase composed of CO, CAP, and EA is higher than that in the WSO system containing only CO. This indicates that the WSOC system can adsorb more methane molecules, consistent with the results from methane adsorption tests. The diffusion coefficients of methane in the WSO and WSOC systems are 5.03 × 10⁻⁴ m2 s−1 and 4.82 × 10⁻⁴ m2 s−1, respectively. Methane molecules diffuse more rapidly in the WSO system than in the WSOC system.
3.5 Free energy barrier for methane migration at the interface
Fig. 7 illustrates the relative free energy distribution of methane molecules along the z-axis under standard temperature and pressure conditions. It is observed that the free energy of methane increases along the z-axis, reaching a peak at the interface between the gas and liquid phases. Significant energy barriers are present in the WSO and WSOC systems, with two peaks at z = 169 Å and z = 242 Å, corresponding to 21.17 kJ mol−1 and 20.35 kJ mol−1, respectively. The free energy barrier is reduced in the WSOC system compared to the WSO system. Additionally, there is a free energy “step” that methane molecules must overcome at the gas–liquid interface before reaching the peak energy barrier. The values of the free energy “step” at the interfaces of the WSO and WSOC systems are 15.58 kJ mol−1 and 9.34 kJ mol−1, respectively. The free energy “step” for the WSOC system is significantly lower than that of the WSO system. This indicates that in the WSOC system with CAP added, methane molecules more easily diffuse and adsorb onto the oil–surfactant interface compared to the WSO system. The difference in free energy of methane between the gas and aqueous phases is smaller in the WSOC system than in the WSO system, indicating that the addition of CAP could enhance methane solubility in the solution.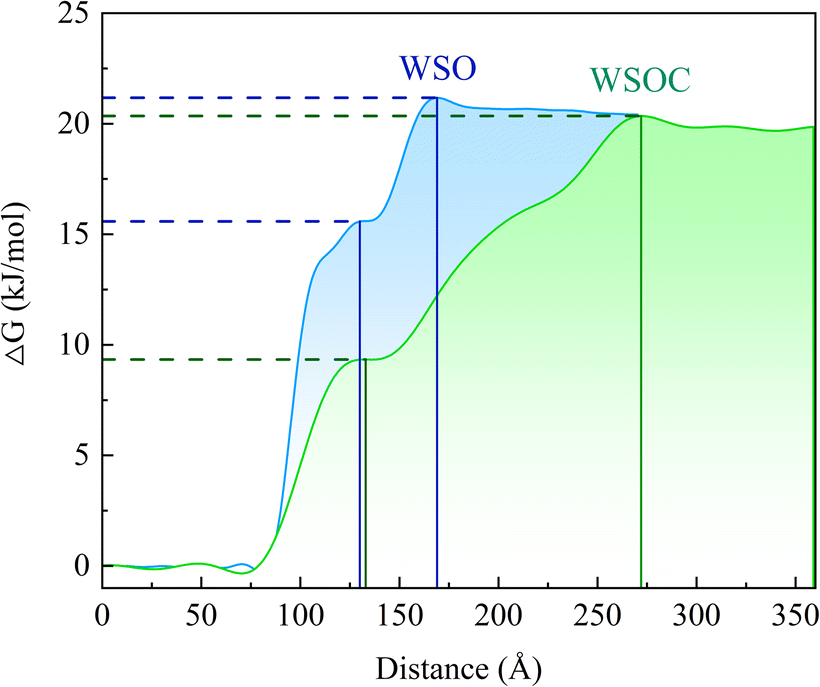 | ||
| Fig. 7 Relative free energy distribution of methane molecules along the z-axis in WSO and WSOC systems. | ||
The distribution coefficients of methane in the WSO and WSOC systems were calculated following the method in the research of Tahari et al..57 The larger the solvation free energy of methane in the solvent, the greater is the affinity of the methane in the solvent phase. The solvation-free energy of methane in the WSO system is 2.33 kcal mol−1, while the solvation-free energy of methane in the WSOC system is −1.31 kcal mol−1. This suggests that methane likes the WSOC system more than the WSO system. The result of distribution coefficient is 2.67 log units, indicating that methane molecules are more inclined to dissolve in the WSOC system.
3.6 Effect of CAP on the interactions within the oil–surfactant systems
The RDF58 was analyzed to investigate the effect of CAP on the interactions within the oil–surfactant system. Fig. 8(a) shows the RDF of CO molecules around SDS. In the WSO system, the first peak appears near 3.65 Å, with a g(r) of 0.28. After 4.15 Å, the RDF rises again. In the WSOC system, the first peak appears near 3.55 Å, with a higher peak value of 0.41. Subsequently, the RDF decreases and levels off. These results indicate that interactions occur between CO and SDS molecules at around 3.6 Å, with a stronger interaction observed in the WSOC system. This may be attributed to the addition of CAP in the WSOC system changing the aggregation patterns of castor oil molecules, resulting in a greater accumulation around SDS. In contrast, the interactions and aggregation of CO molecules with SDS at the interface in the WSO system are lower than those in the WSOC system. | ||
| Fig. 8 (a) RDF of CO molecules around SDS in the WSO and WSOC systems; (b) RDF of CO and SDS molecules around CAP in the WSOC system. | ||
Fig. 8(b) shows the RDF of CO and SDS molecules around CAP in the WSOC system. Around the N atom, the RDF of CO exhibits two obvious peaks at 3.65 Å and 5.65 Å, with g(r) values of 2.40 and 3.41, respectively. The RDF of SDS near the N atom shows a peak at 4.75 Å with a g(r) of 0.49. These findings indicate that the nitrogen-containing groups of CAP interact with CO and SDS molecules at these distances, influencing their distribution at the interface. In contrast, the RDF of CO and SDS molecules around the Cl atom show no significant peaks. This suggests that the chlorine-containing groups of CAP have weaker interactions with both CO and SDS. Overall, these results demonstrate that CAP enhances the interaction between CO and SDS molecules within the oil–surfactant system, primarily through the influence of its nitrogen-containing groups on the aggregation patterns of CO molecules.
Interfacial tensions for WSO and WSOC were further estimated using molecular modelling,59 yielding values of 32.55 mN m−1 and 13.77 mN m−1, respectively. The results indicated that both the interfacial tension and free energy barrier of the WSOC system were lower than those of the WSO system. The effects of CAP on interactions within the system and its influence on the free energy barrier suggest that CAP alters the molecular distribution at the gas–liquid interface of the composite solution. This modification optimizes the interfacial structure, reduces the thermodynamic barrier for methane molecules crossing into the composite solution, and thus facilitates methane penetration into the composite solution.
3.7 Analysis of the adsorption mechanism of the adsorption solution
Experimental and MD simulation results indicate that the addition of CAP increases the particle size and reduces the surface tension of the oil–water solution. Furthermore, the free energy barrier for methane molecules is lowered in the CAP-enhanced solution. According to the gas molecular solubilization micelle model proposed by Mukerjee,60 spherical aggregates are subjected to Laplace pressure. This compressive force can increase the chemical potential of the dissolved molecules, and the increment of free energy ΔG*m,b is shown in eqn (5).
 | (5) |
![[V with combining macron]](https://www.rsc.org/images/entities/i_char_0056_0304.gif) i is the partial molar volume of the gas molecule; γ is the tension at the micelle-water interface; and r is the radius of the micelle.
i is the partial molar volume of the gas molecule; γ is the tension at the micelle-water interface; and r is the radius of the micelle.
From eqn (5), it can be understood that the larger the micelle radius, the lower the free energy; hence there is a driving force for the adsorption process of methane to occur spontaneously. The larger micelle radius and reduced surface tension result in lower free energy, providing a spontaneous driving force for methane adsorption. The change in free energy of methane after CAP addition aligns with MD simulation results. Consequently, we conclude that adding CAP increases the micelle size and reduces the surface tension of the oil–water surfactant system. This reduction in the free energy barrier at the interface facilitates the dissolution of methane, enhancing its adsorption in the solution.
The limitations of this study should be acknowledged. The experimental results reveal an intriguing phenomenon where methane adsorption initially increases and then decreases with the changing mass ratio of surfactant to plant oil. However, the underlying cause of this pattern has not been analysed. Future research should incorporate MD simulations to further investigate the reasons behind this phenomenon. In addition, the experiments did not investigate the effects of various CAP concentrations on the physicochemical properties of the composite solutions and their methane adsorption capacities. The limited number of experimental trials was insufficient to determine the optimal additive ratio for maximizing methane adsorption. Future studies should refine the experimental groups to identify the best combination.
4. Conclusion
This study developed an efficient methane adsorption solution containing CAP and investigated the diffusion characteristics of methane within this solution using MD simulations, elucidating the mechanism by which CAP enhances methane adsorption. The main conclusions are as follows: firstly, the study examined the effects of different plant oils (CO, OO, and LO), the mass ratio of surfactant to oil, and the addition of CAP on methane adsorption. The results indicate that the solution with a 7.5:1 mass ratio of SDS to CO exhibited the highest methane adsorption capacity. The addition of CAP significantly enhanced adsorption efficiency, reaching a maximum of 14.36%. Secondly, using a spray adsorption test apparatus, various solutions were evaluated for their ability to adsorb methane from a closed cavity. The CO mixed solution demonstrated the best spray adsorption capacity, adsorbing up to 6.73% vol. of methane. The inclusion of CAP slightly improved this capacity. Thirdly, MD simulations explored the diffusion characteristics of methane in the composite solution system. The results suggested that the nitrogen-containing groups in CAP increase interactions at the interface and alter the aggregation patterns of CO molecules. CAP reduced the surface tension of the solution and increased micelle size, leading to a reduced free energy barrier. This facilitated the diffusion of methane across the gas–liquid interface and its dissolution into the solution, which may explain the enhanced methane adsorption due to CAP.
Data availability
The data supporting this article have been included as part of the ESI.†Author contributions
Tianle Liu: conceptualization, funding acquisition, writing – review & editing. Junhui Kou: methodology, software, writing – original draft. Guosheng Jiang: funding acquisition, validation. Yuanhai Pan: investigation, methodology. Guokun Yang: validation, writing – review & editing. Chenghang Zhang: data curation, investigation. Zerang Li: data curation, investigation. Xiaoyang Ni: funding acquisition, resources, validation.Conflicts of interest
The authors declare that they have no known competing financial interests or personal relationships that could have appeared to influence the work reported in this paper.Acknowledgements
This work was supported by the National Key Research and Development Program of China (2022YFC3004804).References
- N. Kumar and H. Gupta, in Hazardous Gases, Elsevier, 2021, pp. 225–238 Search PubMed.
- K. C. Lam, B. Huang and S.-Q. Shi, J. Mater. Chem. A, 2017, 5, 11131–11142 Search PubMed.
- Z. Z. Zhang, H. M. Xu and N. Gu, Mater. Sci. Forum, 2011, 685, 264–271 Search PubMed.
- P. Cai, M. Li, Z. Liu, P. Li, Y. Zhao and Y. Zhou, ACS Omega, 2022, 7, 25278–25290 Search PubMed.
- Y. Li, X. Qian, S. Zhang, J. Sheng, L. Hou and M. Yuan, Tunn. Undergr. Space Technol., 2023, 131, 104785 CrossRef.
- Q. Hu, Q. Zhang, M. Yuan, X. Qian, M. Li, H. Wu, X. Shen and Y. Liang, Eng. Failure Anal., 2022, 139, 106448 CrossRef CAS.
- Y. Xue, G. Chen, Q. Zhang, M. Xie and J. Ma, Tunn. Undergr. Space Technol., 2021, 108, 103713 CrossRef.
- H. Song, J. Jarvis, S. Meng, H. Xu, Z. Li and W. Li, in Methane Activation and Utilization in the Petrochemical and Biofuel Industries, Springer International Publishing, Cham, 2022, pp. 1–22 Search PubMed.
- X. Li, H. Zhang, S. Bai, C. Dong, X. Ye and S. Jia, J. Saudi Chem. Soc., 2021, 25, 101363 Search PubMed.
- W. Fengxiao, J. Jinzhang and T. Xiuyuan, Geomech. Geophys. Geo-Energy Geo-Resour., 2023, 9, 13 CrossRef.
- W. Song, J. Cheng, W. Wang, Y. Qin, Z. Wang, M. Borowski, Y. Wang and P. Tukkaraja, Arch. Min. Sci., 2021, 66, 297–312 Search PubMed.
- A. Memetova, I. Tyagi, R. R. Karri, V. Kumar, K. Tyagi, Suhas, N. Memetov, A. Zelenin, T. Pasko, A. Gerasimova, D. Tarov, M. H. Dehghani and K. Singh, Chem. Eng. J., 2022, 446, 137373 CrossRef CAS.
- J. Kou, Y. Pan, H. Liu, G. Yang, X. Ni, G. Jiang and T. Liu, Chem. Eng. J., 2024, 496, 153879 Search PubMed.
- A. Mohammadi, M. Manteghian and M. Mirzaei, Chem. Eng. Res. Des., 2011, 89, 421–427 Search PubMed.
- K. Yang, C. Yue, Z. Xing, H. Ji, Y. Hao, J. Wu and J. Jiang, Combust. Sci. Technol., 2022, 194, 2325–2348 Search PubMed.
- P. Zhang, Y. Zhou, X. Cao, X. Gao and M. Bi, Saf. Sci., 2014, 62, 1–7 CrossRef.
- C. Qiu, J. Wang, Y. Qin, H. Fan, X. Xu and Z. Jin, J. Agric. Food Chem., 2018, 66, 4244–4250 CrossRef CAS PubMed.
- B. Gan, B. Li, H. Jiang, M. Bi and W. Gao, J. Hazard. Mater., 2018, 351, 346–355 CrossRef CAS PubMed.
- S. K. Kundu, J. Zanganeh, D. Eschebach, Y. Badat and B. Moghtaderi, Fuel, 2018, 220, 471–480 CrossRef CAS.
- X. Cao, J. Ren, Y. Zhou, Q. Wang, X. Gao and M. Bi, J. Hazard. Mater., 2015, 285, 311–318 CrossRef CAS PubMed.
- K. Yang, G. Liu, H. Ji, Z. Xing and J. Jiang, J. Loss Prev. Process. Ind., 2023, 85, 105139 CrossRef CAS.
- K. Yang, P. Zhang, C. Yue, K. Chen, H. Ji, Z. Xing, Y. Hao and J. Jiang, J. Loss Prev. Process. Ind., 2020, 67, 104256 CrossRef CAS.
- W. Prapaitrakul and A. King, J. Colloid Interface Sci., 1985, 106, 186–193 Search PubMed.
- S. Roy, A. Mehra and D. Bhowmick, J. Colloid Interface Sci., 1997, 196, 53–61 Search PubMed.
- P. Zhang, X. Cao, X. Li, D. Guo, J. Bian and H. Dong, J. Mol. Liq., 2021, 343, 117488 CrossRef CAS.
- J. Zhang, Z. Dong, Y. Zhang, M. Wang and Y. Yan, Energy Fuels, 2017, 31, 7026–7032 CrossRef CAS.
- Z.-Y. Lin, D. T. Wu and S.-T. Lin, J. Phys. Chem. C, 2018, 122, 29259–29267 Search PubMed.
- L. E. Zerpa, J.-L. Salager, C. A. Koh, E. D. Sloan and A. K. Sum, Ind. Eng. Chem. Res., 2011, 50, 188–197 CrossRef CAS.
- C.-Y. Sun, G.-J. Chen and L.-Y. Yang, J. Chem. Eng. Data, 2004, 49, 1023–1025 CrossRef CAS.
- X. He, Z. Wu, Z. Sun, X. Wei, Z. Wu, X. Ge and G. Cravotto, J. Mol. Liq., 2018, 255, 160–167 CrossRef CAS.
- D. Wang, X. Qian, T. Ji, Q. Jing, Q. Zhang and M. Yuan, Energy, 2021, 217, 119355 Search PubMed.
- T. Lu, Z. Li, Z. Gu and L. Du, Chem. Eng. J., 2023, 464, 142636 CrossRef CAS.
- G. Wu, Q. Zhu, C. Yuan, H. Wang, C. Li, S. Sun and S. Hu, Chem. Eng. Sci., 2017, 166, 313–319 CrossRef CAS.
- D. Dhabal and V. Molinero, J. Phys. Chem. B, 2023, 127, 2847–2862 CrossRef CAS PubMed.
- Q. Zhang, X. Chen, H. Wang and C. Xu, Int. J. Coal Sci. Technol., 2021, 8, 205–216 Search PubMed.
- H. C. Andersen, J. Chem. Phys., 1980, 72, 2384–2393 Search PubMed.
- H. Tafrishi, S. Sadeghzadeh and R. Ahmadi, RSC Adv., 2022, 12, 14776–14807 Search PubMed.
- S. K. Sethi and G. Manik, Prog. Org. Coat., 2021, 151, 106092 Search PubMed.
- R. Gogoi, S. K. Sethi and G. Manik, Appl. Surf. Sci., 2021, 539, 148162 CrossRef CAS.
- J. Meng, J. Wang, L. Wang, C. Lyu, H. Chen, Y. Lyu and B. Nie, J. Mol. Struct., 2024, 1295, 136586 CrossRef CAS.
- M. Shakourian-Fard, G. Kamath, S. M. Taimoory and J. F. Trant, J. Phys. Chem. C, 2019, 123, 15885–15896 Search PubMed.
- H. Moradi, H. Azizpour, H. Bahmanyar, M. Mohammadi and M. Akbari, Heliyon, 2020, 6, e05385 Search PubMed.
- S.-T. Lin, C.-M. Hsieh, M.-T. Lee and J. Chinese Inst, Chem. Eng., 2007, 38, 467–476 Search PubMed.
- P. J. Missel, N. A. Mazer, G. B. Benedek, C. Y. Young and M. C. Carey, J. Phys. Chem., 1980, 84, 1044–1057 Search PubMed.
- U. Z. Mirzakimov, A. Farhadian, M. E. Semenov, R. S. Pavelyev, A. Heydari, Y. F. Chirkova, M. A. Varfolomeev, A. M. Aimaletdinov and L. R. Valiullin, J. Energy Storage, 2023, 73, 108802 CrossRef.
- A. Farhadian, A. S. Stoporev, M. A. Varfolomeev, Y. F. Zaripova, V. V. Yarkovoi, M. E. Semenov, A. G. Kiiamov, R. S. Pavelyev, A. M. Aimaletdinov, T. Mohammad and D. K. Nurgaliev, ACS Sustain. Chem. Eng., 2022, 10, 9921–9932 CrossRef CAS.
- Y. F. Chirkova, A. S. Stoporev, R. S. Pavelyev and M. A. Varfolomeev, Fuel, 2023, 335, 127139 CrossRef CAS.
- E. Chaturvedi, N. Prasad and A. Mandal, J. Nat. Gas Sci. Eng., 2018, 56, 246–257 CrossRef CAS.
- C.-Y. Du, Y. Yang, J. Zhai, X.-Z. Yang, Y. Tang, X.-L. Dong, Y.-J. Liu and A.-C. Huang, J. Therm. Anal. Calorim., 2024, 149, 13495–13510 CrossRef CAS.
- Z. Huang, M. Chen, J. Wang, Y. Zhang, L. Zhang, H. Wang, Y. Gao and Y. Zhou, Int. J. Min. Sci. Technol., 2020, 30, 865–873 CrossRef CAS.
- M. Qi and Y. Zhou, Mater. Chem. Front., 2019, 3, 1994–2009 Search PubMed.
- Q. Sun, N. Ding, C. Zhao, J. Ji, S. Li and S. Pang, Chem. Eng. J., 2022, 427, 130912 Search PubMed.
- C. R. Liu, J. H. Wu, K. Lu, Z. T. Zhao and Z. Huang, Appl. Acoust., 2019, 148, 1–8 CrossRef.
- N. Kumari, M. Singh, H. Om, K. M. Sachin and M. Pal, J. Mol. Liq., 2019, 288, 111043 CrossRef CAS.
- S. Mirzaeifard, P. Servio and A. D. Rey, Chem. Eng. Sci., 2019, 208, 114769 CrossRef CAS.
- S. Ghosh, A. Ray and N. Pramanik, Biophys. Chem., 2020, 265, 106429 Search PubMed.
- S. M. Tahari, A. Larki, M. Shakourian-Fard and G. Kamath, Microchem. J., 2025, 208, 112512 CrossRef CAS.
- M. Rezayani, F. Sharif and H. Makki, J. Mater. Chem. A, 2022, 10, 18295–18307 Search PubMed.
- W. Shinoda, R. DeVane and M. L. Klein, Mol. Simul., 2007, 33, 27–36 CrossRef CAS.
- P. Mukerjee, Kolloid Z. Z. Polym., 1970, 236, 76–79 CrossRef CAS.
Footnote |
| † Electronic supplementary information (ESI) available. See DOI: https://doi.org/10.1039/d5ta01764e |
| This journal is © The Royal Society of Chemistry 2025 |