
 Open Access Article
 This Open Access Article is licensed under a Creative Commons Attribution-Non Commercial 3.0 Unported Licence
Enhanced supercapacitor performance with cerium-doped polypyrrole nanofibers†
Ahmet Güngör *ab
*ab
aFaculty of Engineering and Natural Sciences, Sabancı University, Tuzla, 34956, İstanbul, Turkiye. E-mail: ahmet.gungor@sabanciuniv.edu
bCenter of Excellence for Functional Surfaces and Interfaces for Nano-Diagnostics (EFSUN), Sabancı University, Tuzla, 34956, İstanbul, Turkiye
First published on 20th May 2025
Abstract
The current study assessed the potential use of cerium (Ce)-incorporated polypyrrole (PPy) nanofibers (PPy:Ce) as electrode materials for supercapacitors. Cerium incorporation improved the electrochemical performance of PPy, especially by overcoming limitations in cycling stability and energy storage capacity. The PPy and PPy:Ce nanofibers, synthesized using chemical oxidative polymerization, have been carefully examined using various characterization techniques. Electron Paramagnetic Resonance (EPR) investigations showed that cerium doping increased the density of paramagnetic centers in the PPy structure, improving electrical conductivity and redox activity. Cyclic voltammetry (CV) tests demonstrated that PPy:Ce nanofibers displayed superior electrochemical performance, achieving a specific capacitance of 203 F g−1 and an energy density of 21.3 W h kg−1. Electron microscopy investigations showed that cerium doping increased the diameter of the nanofibers, resulting in a more uniform shape and improved surface roughness. Brunauer–Emmett–Teller (BET) analysis revealed that while cerium doping reduces surface area, it optimizes the pore structure, enhancing ion transport and electrolyte access. This optimization allows for larger pore sizes that facilitate easier ion movement, compensating for the decreased surface area. Structural and electrochemical improvements have been achieved through the homogeneous incorporation of cerium doping into the PPy framework. Cerium doping boosts the cycling stability of PPy, providing an important advantage for long-term energy storage applications. This work presents an alternate method for producing supercapacitor electrodes that demonstrate outstanding efficacy in practical applications utilizing a two-electrode setup. This study significantly contributes to the literature by demonstrating the enhanced performance values achieved by directly incorporating cerium ions into the PPy matrix.
1. Introduction
In recent years, the demand for energy storage systems has risen dramatically due to the growing use of renewable energy sources.1 This surge in demand has highlighted the critical role of electrode materials in determining the efficacy of energy storage devices.2 As a result, research efforts have increasingly focused on developing materials with high energy density, extended cycle life, and rapid charge–discharge capabilities, which are essential for advancing energy storage technology.1,2 Among various energy storage technologies, supercapacitors (SCs) have emerged as a leading option due to their high power density, extended cycle life, and eco-friendly designs.3,4 The characteristics of the electrode materials used primarily influence the performance of SCs. Therefore, advancing high-performance electrode materials is crucial for the broader application and effectiveness of SC technology.3,5Electrode materials used in SCs are often categorized into three primary groups: carbon-based materials, metal oxides, and conductive polymers.6,7 Carbon-based materials are distinguished by their high surface area and chemical stability, while metal oxides provide significant pseudocapacitance values.7 However, each of these materials possesses specific limits and drawbacks.8 Conductive polymers, including polypyrrole (PPy), polyaniline (PANI), and polythiophene (PTh), are extensively studied as electrode materials in SC systems.9,10 These polymers represent attractive materials for energy storage systems due to their low cost, ease of synthesis, and high specific capacitance values.9,10
Polypyrrole (PPy) is a widely preferred conductive polymer for SC applications, attributed to its high conductivity, chemical stability, low cost and ease of synthesis.11,12 PPy exhibits high energy and power density due to its dual contributions from double-layer and pseudocapacitance properties.11,12 The flexible structure of PPy facilitates its coating on diverse surfaces, making it ideal for many potential uses.13,14 Despite all these advantages, PPy has some drawbacks that limit its usability, especially in energy storage systems. Structural degradation during extended charge–discharge cycles and insufficient cycle stability are the primary factors constraining the performance of PPy in SCs.15 Furthermore, the low mechanical strength of PPy and its sensitivity to volumetric changes are challenges for its application in long-term energy storage systems.15 Various strategies have been proposed in the literature to enhance the cycle stability of PPy. Composites of PPy with carbon-based materials such as graphene and carbon nanotubes16,17 have effectively enhanced this material's conductivity and cycling stability. These approaches typically do not entirely prevent volumetric changes in PPy, thereby restricting its cycling life. Doping approaches, including doping transition metals18 and rare earth elements (REEs),19 have garnered attention in recent years to overcome the limitations of PPy and enhance its performance. REEs are receiving heightened focus in energy storage systems owing to their significant redox activity, ion exchange capacity, and chemical stability.20,21 These elements provide high energy density and extended cycle life as electrode materials. The redox activity of rare earth elements enhances the energy storage capacity of materials by facilitating the pseudocapacitance mechanism in SCs.20,21 These elements' chemical stability enhances electrode materials' cycle life and reduces structural degradation during prolonged charge–discharge cycles. Recent studies suggest compositing REEs in metal oxide form (e.g., CeO2, La2O3) or ionic form with conductive polymers can enhance SC performance markedly.22–24 Consequently, REEs have emerged as a significant research domain in advancing high-performance electrode materials. Incorporating cerium (Ce) into PPy enhances the material's electrical conductivity and redox activity.25,26 The chemical stability of Ce enhances the cycle stability of PPy and minimizes structural degradation during extended charge–discharge cycles.25,26 Studies in the literature reveal that composites of CeO2 and PPy exhibit high specific capacitance and excellent cycle stability.22,23,25,26
However, most of these studies focus on cerium in its oxide form and employ three-electrode systems, which may not accurately represent the material's performance in real-world applications. Additionally, there is limited research on the direct incorporation of cerium ions into the PPy matrix, leaving a gap in understanding their effects on the structural and electrochemical properties of PPy. In this study, cerium ions were directly integrated into the PPy matrix, and the resulting nanofibers were evaluated in a two-electrode system to better reflect practical applications. This approach not only addresses the limitations of previous studies but also provides a comprehensive understanding of how cerium ions influence the structural, morphological, and electrochemical properties of PPy. This study not only bridges the gap in the literature by directly incorporating cerium ions into the PPy matrix but also demonstrates the potential of cerium-doped PPy nanofibers as high-performance electrode materials for supercapacitors. The findings provide valuable insights into the design of advanced electrode materials, contributing to the development of more efficient and sustainable energy storage technologies.
2. Materials and methods
2.1. Ingredients
The ingredients employed in the synthesis of PPy were acquired from trustworthy suppliers. Pyrrole (Py, Sigma-Aldrich, reagent grade, 98%, molecular weight 67.09 g mol−1) served as the monomer, whereas iron(III) chloride hexahydrate (Sigma-Aldrich, FeCl3·6H2O, 98% purity, molecular weight 162.2 g mol−1) was employed as the initiator. Cerium(III) nitrate hexahydrate ((Ce(NO3)3·6H2O), Sigma-Aldrich, 99% trace metals base, Mw = 434.22 g mol−1) was utilized as the doping agent for REEs. A solution of sulfuric acid (Merck, 95–98 wt%, Mw = 98.074 g mol−1) served as the solvent. Additionally, methyl orange (MO, Sigma-Aldrich, ACS reagent, Dye content 85%, molecular weight 327.33 g mol−1) was used as a template.2.2. The synthesis procedure of PPy and PPy:Ce nanofibers
PPy and PPy:Ce nanofibers were synthesized via an in situ chemical oxidative polymerization technique utilizing a methyl orange (MO) template. In this method (Scheme 1), 0.3 gram of MO was initially dissolved in 200 mL of deionized water, and the solution was stirred magnetically to ensure homogeneity. Subsequently, 0.70 mL of freshly distilled Py monomer was added to the MO solution, followed by cerium(III) nitrate hexahydrate at varying concentrations to achieve molar ratios of 5%, 10%, and 30% cerium doping levels. This mixture was stirred to ensure uniform distribution. In a separate beaker, 2.7 grams of iron(III) chloride hexahydrate (FeCl3·6H2O) were dissolved in 23 mL of deionized water, and this solution was also stirred until homogeneous. The FeCl3 solution was then added dropwise to the Py and cerium-containing MO solution, initiating the polymerization process, which was allowed to proceed for 24 hours under magnetic stirring. The reaction was conducted at room temperature. Following polymerization, the resulting black precipitate was collected by filtration and washed sequentially with deionized water and ethanol to remove any residual oxidizing agent, MO, and oligomers. The washed PPy powder was dried in a vacuum oven at 60 °C for 12 hours. This method yielded both PPy and PPy:Ce nanofibers with varying cerium content. The MO template facilitated the control of PPy morphology during polymerization, while cerium ions were successfully incorporated into the PPy matrix. The cerium doping levels (5%, 10%, and 20%) mentioned in this study represent the molar ratios of cerium precursor (cerium nitrate hexahydrate) to pyrrole monomer used during the in situ polymerization process. These values do not directly correspond to the exact cerium content in the final material but rather indicate the intended doping levels during synthesis. The successful incorporation of cerium ions into the PPy matrix was confirmed through energy-dispersive X-ray spectroscopy (EDX) analysis, as shown in ESI Fig. 2.† The EDX results, combined with TEM imaging, demonstrate the homogeneous distribution of cerium ions within the PPy nanofibers. For instance, the EDX analysis of the PPy:Ce10 sample revealed a cerium content of approximately 5.30 wt%, confirming the effective integration of cerium ions into the polymer matrix. | ||
| Scheme 1 Schematic representation of the PPy and PPy:Ce nanofiber synthesis procedure. | ||
2.3. Characterization of the synthesized PPy and PPy:Ce nanofibers
The study employed various approaches for characterizing the produced PPy and PPy:Ce nanofibers. X-ray diffraction (XRD) analyses [Bruker D2 Phaser] were conducted to investigate the crystal structures of the synthesized materials. XRD analysis was performed with scans ranging from 5° to 90° at a scanning frequency of 1° per minute. The X-ray wavelength was λ = 1.540 Å, the applied voltage was 30 kV, and the current was 10 mA. Scanning electron microscopy (SEM) [Zeiss Leo Supra VP35] scans were used to analyze the produced particles' surface morphology and dimensions. Before examination, the powdered materials were coated with gold three times. A transmission electron microscope (TEM) [JEOL JEM-1400 PLUS] was used to examine the surface morphology in depth. Samples were dissolved in 1 mL of ethanol before analysis and dried by dropping onto a carbon grid after sonication. Additionally, the elemental compositions of the materials (wt%) were determined by electron dispersive X-ray spectroscopy (EDX) analysis performed during TEM analysis. Fourier transform infrared (FTIR) analysis using a Thermo Scientific iS50 was conducted to identify functional groups and chemical bonds. The Brunauer–Emmett–Teller (BET) method, utilizing a Micromeritics Tristar II apparatus, was employed to determine the materials' surface areas and pore volumes. Before the analysis, the materials undergo a degassing treatment at 120 °C overnight.27,28 Electron Paramagnetic Resonance (EPR) analysis using a Bruker Benchtop EMX Nano was employed to describe the defect structures and identify the g-factor values of PPy and the materials synthesized with different amounts of cerium. EPR spectra were collected at room temperature with a resonator operating at a microwave frequency of 9.63 GHz.The synthesized PPy and PPy:Ce nanofibers served as electrode materials in a two-electrode SC device, with electrochemical measurements of the designed symmetric configurations conducted using a BioLogic VMP 300 potentiostat. Multiple tests, such as cyclic voltammetry (CV), potentiostatic electrochemical impedance spectroscopy (PEIS), and potential limited galvanostatic cycling (GCPL), were employed to determine electrochemical properties. In the SC designs, a Whatman glass microfiber was the separator, while 1 M H2SO4 was the electrolyte. A Whatman GF/A glass microfiber filter (thickness ≈ 0.26 mm, Sigma-Aldrich, WHA1820047) was used as the separator due to its high electrolyte absorption capacity and mechanical stability. All measurements were conducted within the 0–1 V voltage range. CV plots were acquired at scan rates ranging from 1 to 200 mV s−1, and PEIS tests were performed using an AC disturbance of 10 mV over a frequency spectrum from 10 MHz to 1 MHz. GCPL curves were produced by analyzing the range of potentials from 0 to 1 V at a rate of 10 mV s−1 while applying a current density of 0.5 A g−1. The findings from the electrochemical studies were employed to determine the specific capacitance, energy density, and power density of the SC designs developed with PPy and PPy:Ce nanofibers. The formulae used for calculating specific capacitance (F g−1), energy density (W h kg−1), and power density (kW kg−1) are presented below ref. 28. The specific capacitance values derived from the CV curves were determined using eqn (1), where Cs represents specific capacitance, I (mA) denotes the applied current, dV(V) indicates the operated voltage window, v (mV s−1) refers to the applied scan rate, and m (g) is the mass of the electrode material utilized.
 | (1) |
The energy density and power density for the prepared electrode were calculated according to eqn (2) and (3), respectively.29
 | (2) |
 | (3) |
2.4. Dunn's method
A comprehensive assessment of the electrochemical characteristics of the fabricated SCs created with PPy and PPy:Ce nanofibers has been carried out using the power law.30 CV tests were performed at scan rates of 1, 5, 10, 20, and 50 mV s−1 for assessment purposes. The selected scan rate was influenced by minimal ohmic resistance, reduced inductance, and the ideal electrochemical characteristics identified in previous studies. The power law (eqn (4)) can be expressed in the following manner:31| i(v) = avb | (4) |
log(i(v)) = log(k) + b![[thin space (1/6-em)]](https://www.rsc.org/images/entities/char_2009.gif) log(v) log(v)
| (5) |
2.5. Supercapacitor fabrication
The electrochemical performance of PPy and PPy:Ce nanofibers was evaluated as electrode materials in two-electrode SC devices. Initially, a slurry is formulated to prepare the working electrode. For the slurry, the active electrode material, carbon black (N330), and polyvinylidene fluoride (PVDF) are ground up in a mortar at a weight ratio of 8:1:1 for 10 minutes. Subsequently, 2 mL of N,N-dimethylformamide (DMF) is added, and the mixture is placed under sonication for 30 minutes to achieve a homogeneous slurry. The formulation is designed to achieve a total solid mass of 100 mg. Approximately 50 μL of the generated slurry solution is applied to the surface of the stainless-steel current collector depicted in Fig. 1 for coating purposes. The working electrode is dried in a vacuum oven at 60 °C overnight. The weighing is conducted both before and after the drying procedure to determine the weight of the electrode material on the current collector. A circular glass microfiber filter is positioned between two stainless steel screws as a separator, which is then wet with approximately 30 μL of electrolyte before being fastened between the screws, which are subsequently tightened. All electrode preparation and device assembly procedures were carried out under ambient laboratory conditions (25 ± 2 °C, relative humidity ∼50%). The use of PPy-based materials and aqueous H2SO4 electrolyte ensured stability without the need for an inert atmosphere.
 | ||
| Fig. 1 Schematic representation of the two-electrode setup. | ||
Table 1 summarizes the designs for utilizing PPy and PPy:Ce composites as electrodes, produced by including cerium at three distinct ratios (5, 10, and 20 mol%) based on the molar ratio of the generated PPy and pyrrole during synthesis. Furthermore, Fig. 1 depicts the two-electrode system employed in the electrochemical investigations.
| Design code | Electrodes 1&2 | Electrolyte | Separator | Type |
|---|---|---|---|---|
| PPy | PPy | 1 M H2SO4 | Glass fiber | Symmetric |
| PPy:Ce3 | PPy:Ce3 | 1 M H2SO4 | Glass fiber | Symmetric |
| PPy:Ce5 | PPy:Ce5 | 1 M H2SO4 | Glass fiber | Symmetric |
| PPy:Ce10 | PPy:Ce10 | 1 M H2SO4 | Glass fiber | Symmetric |
| PPy:Ce20 | PPy:Ce20 | 1 M H2SO4 | Glass fiber | Symmetric |
3. Results and discussion
3.1. Synthesis mechanism of PPy and PPy:Ce nanofibers
The synthesis and formation of PPy and PPy:Ce nanofibers are conducted via chemical oxidative polymerization, starting with the oxidation of the Py monomer. As a heteroaromatic molecule, Py is rapidly oxidized during polymerization owing to its nitrogen atom with high electron density and its conjugated π–electron pair.33 This study employed FeCl3 as the oxidizing agent. FeCl3 oxidizes Py molecules and catalyzes the formation of radical cations. These radical cations interact with other Py molecules to create oligomeric structures, expanding into polymer chains via carbon–carbon (C–C) and carbon–nitrogen (C–N) bonds.34,35 The polymerization process terminates with combining radical cations or impurities that inhibit the reaction. PPy can be doped with dopant ions (e.g., Cl−) during this method, enhancing the polymer's electrical conductivity.36,37This study used MO as a template during the polymerization process. It influences the morphology and structural order of the polymer by generating electrostatic interactions with the Py monomers during the polymerization process. MO supports the systematic polymerization of the Py molecules, resulting in a more regulated structure for PPy. This method could enhance the polymer's surface area, resulting in a more porous arrangement.38,39 Furthermore, the incorporation of MO can enhance the uniformity of the polymer and reduce irregularities that may occur during the polymerization process.38,39 In the fabrication of PPy:Ce, cerium(III) nitrate hexahydrate served as the cerium source. Cerium ions influence the polymerization pathway, changing the structural characteristics and electrochemical performance of PPy. Cerium ions have two primary functions during polymerization: firstly, they promote the oxidation of pyrrole molecules by serving as an oxidizing agent when combined with FeCl3; secondly, they modify the material's characteristics by incorporating into the polymer chain or complexing on the surface.40,41 To visually represent the incorporation of cerium ions into the PPy structure, Scheme 2 illustrates two possible binding scenarios. In the first scenario, cerium ions coordinate with the nitrogen atoms in the PPy chains, forming coordination bonds that enhance the structural stability and create redox-active sites. In the second scenario, cerium ions form complexes on the surface of the polymer chains, increasing surface roughness and facilitating ion transport.42–44 These binding mechanisms align with the findings from FTIR, EPR, and TEM analyses, which confirm the successful integration of cerium ions into the PPy matrix and their impact on the material's structural and electrochemical properties. Cerium ions were directly introduced into the reaction medium prior to oxidative polymerization and successfully incorporated into the PPy matrix through coordination with nitrogen atoms or surface complexation. This in situ incorporation mechanism is supported by the structural and spectroscopic data and does not require the formation of a separate CeO2 phase. FeCl3 catalyzes the generation of radical cations by the oxidation of pyrrole molecules despite Ce3+ ions supporting the establishment of redox-active sites within the PPy structure by being involved in the polymerization process.45,46 The redox-active places improve the pseudocapacitance characteristics of the polymer and increase its energy storage capacity. Using MO as a template could affect the interaction between cerium ions and the polymer. MO could boost the uniform incorporation of cerium ions into the polymer chain during polymerization. The anionic configuration of MO may enable electrostatic interactions with cerium ions, enhancing their incorporation into the polymer matrix.47 This can enhance the structural integrity of PPy:Ce composites and regulate the polymer's surface morphology.
 | ||
| Scheme 2 Schematic representation of possible bonding scenarios in the polymerization between Ce ions and pyrrole. | ||
3.2. A detailed characterization of PPy and PPy:Ce nanofibers
The FTIR spectra of the synthesized PPy and PPy:Ce nanofibers are illustrated in Fig. 2a. A broad absorption band has been observed in the ∼3430 cm−1 region of the pure PPy spectra.48 This band is ascribed to the N–H stretching vibrations within the polymer chains and the water molecules adsorbed on the material's surface.48 The reduced peaks at about 2920 cm−1 and 2850 cm−1 represent aliphatic C–H asymmetric and symmetric stretching vibrations, respectively.49 The characteristic vibrations of the Py ring are localized within the 1550–1450 cm−1 range.50 The peak at approximately 1545 cm−1 is ascribed to the C![[double bond, length as m-dash]](https://www.rsc.org/images/entities/char_e001.gif) C stretching vibrations in the Py ring and polaronic structures. In contrast, the peak at around 1458 cm−1 denotes the C–N stretching vibrations.51,52 Furthermore, a complex peak pattern in the spectrum within the ∼1300–1000 cm−1 range relates to C–H intra-ring deformation and C–N stretching vibrations. The peak at around 1178 cm−1 can be attributed to the in-plane C–H bending vibrations of the PPy ring.51,52 In contrast, the peak at around 1043 cm−1 could come from the dopant anions (Cl− ions resulting from the oxidation of FeCl3 employed) or the C–H/N–H intra-ring deformation vibrations. The peaks detected at lower wavenumbers, approximately 962 cm−1 and 783 cm−1, are ascribed to the C–H off-ring deformation and the ring vibrations of the Py ring, respectively.49–52
C stretching vibrations in the Py ring and polaronic structures. In contrast, the peak at around 1458 cm−1 denotes the C–N stretching vibrations.51,52 Furthermore, a complex peak pattern in the spectrum within the ∼1300–1000 cm−1 range relates to C–H intra-ring deformation and C–N stretching vibrations. The peak at around 1178 cm−1 can be attributed to the in-plane C–H bending vibrations of the PPy ring.51,52 In contrast, the peak at around 1043 cm−1 could come from the dopant anions (Cl− ions resulting from the oxidation of FeCl3 employed) or the C–H/N–H intra-ring deformation vibrations. The peaks detected at lower wavenumbers, approximately 962 cm−1 and 783 cm−1, are ascribed to the C–H off-ring deformation and the ring vibrations of the Py ring, respectively.49–52
 | ||
| Fig. 2 (a) FTIR spectra and (b) XRD patterns of PPy and PPy:Ce nanofibers. | ||
Upon examination of the spectra of PPy composites doped with Ce, it can be noticed that while the peak patterns resemble those of pure PPy, important changes are evident for peaks. Specifically, in the 400–800 cm−1 region, new vibrational peaks appeared in the PPy:Ce10 and PPy:Ce20 samples. These peaks are attributed to Ce–N coordination, Ce–O related modes, and skeletal deformations caused by cerium incorporation. Their emergence indicates structural distortion and interaction effects rather than covalent reactivity between Ce ions and the PPy backbone.53,54 A considerable decrease in the intensity of the N–H stretching band (∼3430 cm−1) was observed with cerium doping. This suggests that cerium ions may have connected with the PPy polymer chains, affecting the vibrations of the N–H bonds.55 The reduced intensity of the N–H band may be attributed to the weakening of hydrogen bonds or the decrease in the number of N–H groups due to their interaction with the PPy chains of Ce ions. Slight shifts and changes in intensity are also evident in the CC and C–N vibrational peaks within the 1550–1450 cm−1 range due to Ce doping.56,57 The observed shift to a higher wave number in the CC peak with Ce doping could indicate a reduction in electron density within the pyrrole ring and an enhancement in bond strength.
As observed in FTIR analysis, the alterations induced by cerium doping in the molecular structure of PPy are consistent with the results obtained from EPR spectroscopy. EPR investigations show that cerium doping enhances the concentration of paramagnetic centers inside the PPy structure. This offers further evidence that the chemical interactions detected by FTIR also affect the material's electronic structure. The absence of significant new peaks in the spectrum demonstrates that cerium is not primarily present as cerium oxide (CeO2) within the PPy matrix.
The XRD patterns shown in Fig. 2b reveal significant details about the crystal structures of the synthesized PPy and PPy:Ce nanofibers. The analysis of the XRD pattern for the PPy sample shows important characteristics, including the absence of distinct sharp crystalline peaks and the presence of a broad diffraction band at approximately 2θ = 25°.58,59 This suggests that PPy has an amorphous or semi-crystalline structure characterized by low crystallinity. The XRD patterns of PPy:Ce nanofibers exhibit a dominant broad diffraction band, similar to the structure of PPy. The absence of new sharp crystalline peaks indicates that cerium doping does not significantly change the original amorphous structure of PPy, nor does cerium form a critical crystalline phase within the PPy matrix.60 Although XRD patterns suggest that PPy:Ce20 exhibits slightly reduced amorphousness compared to PPy:Ce5, the electrochemical behavior is influenced by a complex interplay of factors including pore structure optimization, paramagnetic center density, and accessible redox sites.61,62 Therefore, the superior ionic mobility and power density of PPy:Ce5 are attributed to its balanced structural and electrochemical properties rather than purely higher amorphous content.63,64 It is expected that XRD patterns could display distinctive sharp peaks, assuming cerium had formed a crystalline phase, like cerium oxide (CeO2).57 Cerium doping can enhance the width of the diffraction band or lead to a slight location shift. These changes could indicate that cerium ions enhance the disorder among the PPy polymer chains or change the interchain distance.65 The XRD analyses suggest that cerium does not form a distinct crystalline phase within the PPy structure, which corresponds to the results obtained from the EPR analysis. The lack of new signals specific to cerium in the EPR spectra indicates that cerium does not mainly form a crystalline phase within the PPy matrix; instead, it appears to disperse within the amorphous structure or interact with the PPy polymer chains. In the context of this study, the XRD analysis indicates a decrease in crystallinity upon cerium doping, which is consistent with the formation of a more disordered polymer matrix. This disorder can facilitate the creation of defect sites within the polymer structure. EPR analysis complements this finding by showing an increase in the density of paramagnetic centers, often associated with these defect sites. The presence of cerium ions likely contributes to forming additional redox-active sites and paramagnetic centers by interacting with the polymer chains and altering the local electronic environment. This interaction enhances the pseudocapacitive behavior of the material, as evidenced by the improved electrochemical performance. Thus, the decrease in crystallinity and the increase in paramagnetic centers are interconnected phenomena that collectively enhance the material's electrochemical properties.66,67
The absence of oxygen signals in the EDX analysis, combined with the lack of cerium oxide peaks in the XRD patterns and the increase in paramagnetic centers observed in the EPR spectra, strongly suggests that cerium is incorporated into the PPy matrix in its ionic form (Ce3+/Ce4+). This incorporation mechanism is further supported by the shifts in the FTIR spectra and the proposed binding scenarios illustrated in Scheme 2. These findings distinguish the present work from previous studies using cerium oxide (CeO2) and highlight the novelty of directly incorporating cerium ions into the PPy matrix.
Fig. 3 and ESI 1, 2† show the surface morphologies and structural characteristics of the synthesized PPy and PPy:Ce nanofibers. SEM images (Fig. 3a and ESI 1†) demonstrate that the pure PPy sample exhibits a distinct nanofiber-like morphology. This structure results from employing MO as a template in the synthesis of PPy. MO affects the morphology and structural order of the polymer through electrostatic interactions with Py monomers during polymerization, which could result in a more regular and porous structure. The observed morphology of nanofibers showed that MO promotes the formation of 1D structures by directing the growth of PPy chains. SEM images of PPy:Ce nanofibers (Fig. 3b and ESI 1†) suggest that the basic nanofiber morphology remains unchanged. Additionally, there is an increase in nanofiber diameter and changes in surface roughness, and an increase in cerium concentrations is associated with a slight broadening of nanofiber diameter and a rougher surface material. Incorporating cerium ions into polymer chains or their complexation on the surface likely influenced the growth mechanism and morphology of the nanofibers, leading to an increase in diameter and surface roughness. XRD analyses (Fig. 2b) confirmed that the incorporation of cerium reduced the crystallinity of PPy. The observed reduction in crystallinity correlates with the rougher surface morphology evident in SEM images, as diminished crystallinity may result in a more irregular arrangement of polymer chains, thereby producing a rougher surface morphology. TEM images (Fig. 3c, d and ESI 2†) reveal the nanofiber structure of PPy and PPy:Ce10 composites, further supporting the SEM scans. In particular, the high-resolution TEM (HRTEM) images in Fig. 3d and ESI 2† show that the nanofibers are approximately 50–100 nm in diameter and have no apparent crystalline structure inside. This amorphous structure is consistent with the XRD analysis results and supports the idea that PPy naturally has low crystallinity. TEM images also reveal that the nanofibers are connected to a network-like structure, forming a porous structure. The EDX analysis, as shown in ESI Fig. 2,† further confirms the successful incorporation of cerium ions into the PPy matrix. For the PPy:Ce10 sample, the EDX results indicate a cerium content of approximately 5.30 wt%, alongside carbon, nitrogen, and hydrogen. This result aligns with the intended doping level during synthesis and demonstrates the effective integration of cerium ions into the polymer structure. The incorporation of cerium ions within the nanofibers contributes to the observed changes in nanofiber morphology, including increased diameter and surface roughness. These findings are consistent with the results from XRD and EPR analyses, which suggest that cerium doping reduces crystallinity and enhances the density of paramagnetic centers, thereby improving the material's electrochemical properties.
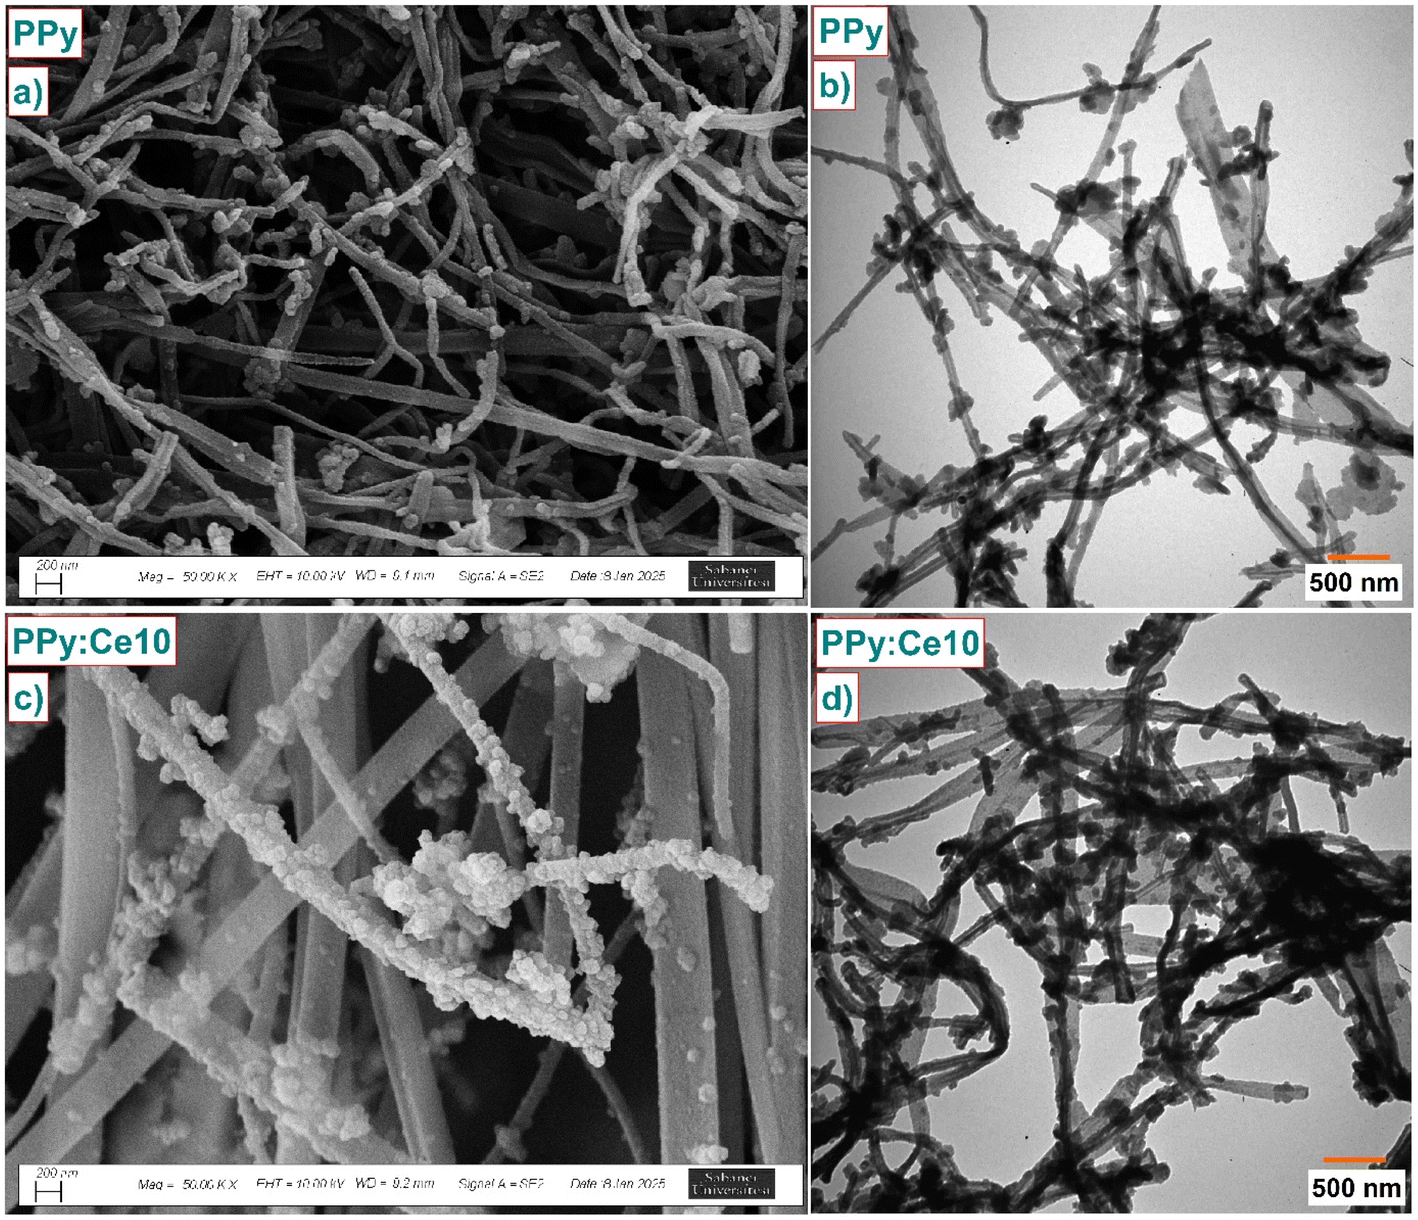 | ||
| Fig. 3 SEM and TEM scans of PPy (a and c) and PPy:Ce10 (b and c) nanofibers, respectively. | ||
BET analysis provides important information about the surface area, pore volume, and pore sizes of PPy and PPy:Ce nanofibers, as well as their morphological and structural characteristics.68 The BET isotherms illustrated in ESI Fig. 3† demonstrate that PPy and PPy:Ce nanofibers exhibit a Type IV isotherm, representing a micro- and mesoporous structure in the materials.69 Besides, the hysteresis loop of these materials has been identified as H3 type.69 This suggests that the pores are mainly flat and slit-shaped, with effective capillary condensation happening.69 These results are compatible with isotherm and hysteresis types reported in the carbon-based and conductive polymer composite literature.70–72 The Type IV isotherm and H3 hysteresis loop observed in the BET analysis indicate the presence of mesoporous structures with slit-shaped pores, which are characteristic of materials designed for enhanced ion transport and electrochemical performance.70–72
Table 2 shows a correlation between surface area and pore volume with BET isotherm and hysteresis data. The surface area of pure PPy was measured at 35.94 m2 g−1, implying a mesoporous structure. A decrease in surface area was observed with the addition of cerium. The surface area of PPy:Ce5 decreased to 22.29 m2 g−1, while that of PPy:Ce20 decreased to 16.23 m2 g−1. The observed decrease has been attributed to cerium ions affecting the arrangement of polymer chains, leading to partial pore blockage or structural irregularities. The investigation of pore sizes reveals that adding cerium causes an increase in pore diameter. The average pore size of pure PPy is 18.73 nm, which increases to 36.94 nm in PPy:Ce5 and 43.25 nm in PPy:Ce20. Cerium doping improves the pore structure and allows the development of larger pores. The BET analysis results are also compatible with those from other characterization techniques. The observed increase in nanofiber diameter and changes in surface roughness, as confirmed by SEM and TEM images, correlate with a decrease in surface area and an increase in pore size. SEM and TEM analyses demonstrate that cerium doping influences the growth mechanism of nanofibers, resulting in the formation of nanofibers with increased diameters and rougher surfaces. The irregularities in the crystal structure observed in XRD analyses can be interpreted as being consistent with the decrease in surface area and changes in pore structure. The results of the BET analysis provide important information regarding electrochemical performance. The enhancement of SC performance can be attributed to the optimized pore structure, which facilitates easier ion access to the electrode surface despite reducing surface area due to cerium ion incorporation. The surface area and pore structure are optimized at the optimum cerium doping ratio (PPy:Ce5). This is consistent with the highest specific capacitance (203 F g−1) and energy density (21.3 W h kg−1) values of PPy:Ce5. The reduction in surface area and the expansion of pore size in PPy:Ce20 correlate with the observed decrease in electrochemical performance, evidenced by a specific capacitance of 91.4 F g−1 and an energy density of 14.4 W h kg−1.
| Material | Surface area, m2 g−1 | Pore volume, cm3 g−1 | Pore size, nm |
|---|---|---|---|
| PPy | 35.94 | 0.098 | 18.73 |
| PPy:Ce5 | 22.29 | 0.052 | 36.94 |
| PPy:Ce20 | 16.23 | 0.044 | 43.25 |
EPR spectroscopy provides important knowledge about the presence of unpaired electrons in the produced PPy and PPy:Ce nanofibers and the possible influence of cerium doping on these paramagnetic centres.73,74 The EPR spectra in Fig. 4 exhibit a distinct signal near g-factor = 1.9971 in PPy and PPy:Ce composites. The g-factor value is slightly lower than that of a free electron (≈2.0023), suggesting the presence of paramagnetic centers associated with polaronic species or structural defects.75 This implies the existence of charge carriers and possible defective sites inside the materials.76 An increase in the EPR signal intensity is observed with cerium doping. This increase shows Ce ions could have improved the concentration of paramagnetic centers inside the PPy structure. Because of their varying (Ce3+/Ce4+) structure, Ce ions can enhance the concentration of unpaired electrons by forming redox-active sites inside PPy polymer chains or changing currently present defect sites. Considering the synthesis procedure, cerium ions could interact with PPy chains during polymerization, increasing polaron concentration via charge balancing or creating new defects.76 Particularly, the inset table in Fig. 4 reveals a slight decline in the g-factor value (from 1.9971 to 1.9958) with increased cerium concentration. The decrease in the g-factor could suggest a change in the unpaired electrons' environment due to cerium ions' incorporation into the PPy structure.77 The change could be attributed to the influence of cerium ions on the magnetic characteristics of unpaired electrons via spin–orbit coupling or to cerium's modification of the resonance conditions of electron spin through modification of its surrounding chemical environment.77
 | ||
| Fig. 4 EPR spectra of PPy and PPy:Ce nanofibers. | ||
3.3. Electrochemical performance of PPy and PPy:Ce nanofiber-based supercapacitors
ESI Fig. 4† presents the CV curves of the produced PPy, PPy:Ce5, PPy:Ce10, and PPy:Ce20 nanofiber electrodes obtained at different scan rates ranging from 1 mV s−1 to 200 mV s−1. At low scan rates (1–5 mV s−1), the CV curves for all designs typically display a rectangular form, indicating the dominance of EDLC behavior.78 This enables rapid and reversible adsorption and desorption of ions on the electrode surface.78 The BET analysis results are compatible with this observation, as the increased pore size in PPy:Ce5 enhances the accessibility of electrolyte ions to the electrode surface, promoting EDLC behavior. However, the reduced surface area in PPy:Ce20 could hinder ion adsorption, leading to a less pronounced EDLC contribution. The comparison CV curves acquired at 5 mV s−1 (Fig. 5a) clearly show that the PPy:Ce5 design has the largest curve area, thus demonstrating the highest charge storage capacity.79 At a scan rate of 5 mV s−1, PPy:Ce3 exhibits a smaller curve area compared to PPy:Ce5, indicating a lower charge storage capacity. This result highlights the superior performance of PPy:Ce5, which achieves the largest curve area among all designs. At a scan rate of 5 mV s−1 (Fig. 5a), PPy:Ce3 exhibited a larger CV curve area than undoped PPy, indicating improved charge storage behavior. However, its performance remained below that of PPy:Ce5, confirming the superior electrochemical characteristics at 5% doping. The CV curves of all designs deviate from the rectangular shape as the scan rate increases (20 mV s−1 and above), indicating the increasing significance of ion diffusion constraints and the internal resistance of the electrode material at higher scan rates.80,81 | ||
| Fig. 5 (a) CV curves of PPy and PPy:Ce composite-based supercapacitors at 5 mV s−1, capacitive and diffusive contribution and area of (b and d) PPy and (c and e) PPy:Ce5 based supercapacitors, respectively. | ||
Fig. 5b–e show a detailed analysis of the PPy and PPy:Ce5 design charge storage mechanisms. The Dunn method reveals that charge storage in PPy and PPy:Ce5 electrodes includes a combination of capacitive and diffusive mechanisms. As can be seen in Fig. 5b–e, there are significant differences between these two designs in terms of charge storage mechanism. In the PPy design, the diffusive contribution was determined to be 58.5%, above the capacitive contribution of 41.5% at a scan rate of 10 mV s−1, with a calculated b value of 0.83. This value suggests that capacitive behavior plays a vital role in the charge storage mechanism of PPy, while diffusion-controlled processes also contribute significantly.82 Conversely, the diffusive contribution in the PPy:Ce5 electrode increased to 81.4%, while the capacitive contribution decreased to 18.6% at 10 mV s−1. The b value of PPy:Ce5 decreased to 0.48. The value of ‘b' close to 1 (0.83 for PPy) implies relatively identical electrochemical behavior to the EDLC character.83 In this case, ions' fast and reversible adsorption/desorption on the electrode surface mainly causes charge storage. However, the value of ‘b’ near 0.5 (0.48 for PPy:Ce5) suggests a dominance of battery-like, diffusion-controlled systems. The Dunn analysis reveals that the diffusive contribution in the PPy electrode is more dominant than the capacitive contribution (58.5% vs. 41.5% at 10 mV s−1 scan rate), suggesting that both EDLC and pseudocapacitive behaviors contribute to the charge storage mechanism of PPy. On the PPy:Ce5 electrode, the increase in diffusive contribution to 81.4% and a decrease in capacitive contribution to 18.6% highlight the complexity of the charge storage mechanism. This change suggests that battery-like behavior becomes dominant, and that electrochemical behavior changes away from the EDLC character towards diffusion-controlled pseudocapacitive processes. The incorporation of cerium ions into the PPy matrix significantly enhances the electrochemical performance by introducing additional redox-active sites and optimizing the material's structural properties. The Ce3+/Ce4+ redox couple contributes to pseudocapacitive behavior, increasing the charge storage capacity and improving the cycling stability of the material. Furthermore, cerium ions facilitate the formation of paramagnetic centers, as evidenced by EPR analysis, which enhances charge carrier density and electrical conductivity. The results indicate that the optimal cerium doping ratio (PPy:Ce5) achieves a balance between structural optimization and electrochemical performance. Excessive cerium doping (e.g., PPy:Ce20) leads to a reduction in surface area and increased pore size, which negatively impacts ion transport and charge storage capacity. This highlights the importance of controlling the cerium doping ratio to maximize the material's performance.
Fig. 6a displays changes in specific capacitance values obtained from CV curves at different scan rates. An increase in the scan rate corresponds to a general decline in specific capacitance for all designs. At low scan rates, ions may efficiently access the pores and active areas of the electrode material; however, at higher speeds, this capability is limited, leading to a reduction in capacitance value. Among the designs, PPy:Ce5 exhibits the highest specific capacitance values at all scan rates, confirming its superior electrochemical performance. PPy:Ce3 also demonstrated higher capacitance values than pure PPy across all scan rates, yet consistently lower than those of PPy:Ce5, indicating a moderate performance enhancement with lower cerium content. This result highlights the importance of cerium doping in enhancing the charge storage capacity of PPy, with 5% doping achieving the optimal balance between structural and electrochemical properties. The observed trends are consistent with the CV analysis results shown in Fig. 5a, where PPy:Ce5 was identified as the design exhibiting the largest area in the CV curves. The enhanced performance of PPy:Ce5 can be attributed to its optimized pore structure and increased density of redox-active sites, as confirmed by BET and EPR analyses. In contrast, while PPy:Ce3 benefits from cerium doping, its performance is limited compared to PPy:Ce5 due to less effective optimization of pore structure and charge transfer characteristics. At higher cerium concentrations (e.g., PPy:Ce20), the specific capacitance values decrease significantly, likely due to reduced surface area and excessive pore enlargement, which hinder ion transport and charge storage efficiency.
 | ||
| Fig. 6 (a) Scan rate-vs.-specific capacitance and (b) Nyquist curves of each fabricated supercapacitor. | ||
Fig. 6b shows the Nyquist curves, which provide significant information for investigating SCs' frequency response and internal resistance characteristics.84 Nyquist curves are characterized by three basic sections: (i) the intersection point on the real axis in the high-frequency region, representing the Equivalent Series Resistance (ESR); (ii) a semicircle whose radius suggests the charge transfer resistance (Rct); and (iii) a vertical line that illustrates ideal capacitive behavior in the low-frequency region.85 Upon examination of the Nyquist curves presented in Fig. 6b, it is observed that the curves exhibit a generally similar shape for all designs; however, some significant differences are also observed. The ESR in the high-frequency region is observed to be lowest for the PPy:Ce5 design, whereas higher values are noted for PPy and PPy:Ce20. A lower ESR value suggests that PPy:Ce5 exhibits lower internal resistance and better conductivity, which could lead to improved SC performance. The results obtained from EPR spectroscopy imply that cerium doping improves the electrical conductivity of PPy, further supporting this observation. The diameter of the semicircle in the Nyquist curve reveals the charge transfer resistance (Rct). The semicircle of the PPy design depicted in Fig. 6b has the smallest diameter, showing the lowest charge transfer resistance and, thus, the most rapid and efficient charge transfer. The semicircle of the PPy:Ce20 design exhibits the largest diameter, suggesting the highest charge transfer resistance and potentially slower charge transfer.86 A lower charge transfer resistance represents enhanced charge transfer efficiency and increased electrochemical reactions at the interface of the electrode material and the electrolyte.87 These results are consistent with the BET analysis, which showed that the optimized pore structure in PPy:Ce5 facilitates efficient ion transport and reduces resistance at the electrode–electrolyte interface. In contrast, the larger pore size and reduced surface area in PPy:Ce20 may contribute to its higher resistance values. The slope of the near-vertical line in the low-frequency region reflects the ideality of capacitive behavior.88 In optimal SCs, this line should be vertical.87,88 Fig. 6b shows that the lines in the low-frequency region are nearly vertical across all designs; however, the line for PPy:Ce5 exhibits a closer approximation to linearity than the other designs, indicating superior capacitive behavior and less limitation due to ion diffusion.
Fig. 7 shows the results of the GCPL analysis for all designs performed within the voltage range of 0–1 V and a current density of 0.5 A g−1. Fig. 7a illustrates the specific capacity (mA h g−1) values of different designs, which define the charge storage capability of the electrode material per unit mass and serve as a critical metric for assessing energy storage performance. Among the designs, PPy:Ce5 achieves the highest specific capacity, confirming its superior charge storage capability. PPy:Ce3, on the other hand, achieved a specific capacity of 13.9 mA h g−1, outperforming undoped PPy (10.03 mA h g−1) but remaining below that of PPy:Ce5. The GCPL analysis of PPy:Ce3, presented in Fig. 7a, shows a specific capacity of 13.9 mA h g−1, which is higher than that of pure PPy (10.03 mA h g−1) but lower than that of PPy:Ce5 (20.3 mA h g−1). This result highlights the moderate improvements achieved with PPy:Ce3 compared to pure PPy, while also emphasizing the superior performance of PPy:Ce5. The results correlate closely with the findings from CV and EIS analyses. The observation that PPy:Ce5 demonstrates the largest curve area in CV analyses and the lowest resistance values in impedance analyses suggests its improved charge storage capacity and rapid charge transfer characteristics. Similarly, PPy:Ce3 shows better performance than pure PPy, but its charge transfer efficiency and specific capacity remain below those of PPy:Ce5.
 | ||
| Fig. 7 (a) Specific capacity (mA h g−1), (b) time-vs.-potential, and (c) capacitance retention (CR, %) graphs of each fabricated supercapacitor. | ||
Fig. 7b illustrates the duration of each charge/discharge cycle for each design, showing that the PPy:Ce5 design has the longest charge/discharge time, directly correlated with its higher charge storage capacity. Notably, the inset curve in Fig. 7b (green, PPy:Ce20) exhibits a markedly asymmetric profile with a sloped discharge curve, indicating elevated internal resistance and poor ion transport behavior. This aligns with its high charge transfer resistance observed in EIS (Fig. 6b) and reduced surface area shown in BET analysis (Table 2). PPy:Ce3 also demonstrates an extended charge/discharge time compared to pure PPy, further supporting its improved performance. Fig. 7c presents the capacitance retention (CR) values (%) of each design following 1000 cycles at a current density of 0.5 A g−1. The CR value reflects the cycling stability of the electrode material, specifically its resistance to repeated charge and discharge cycles. All designs exhibit high CR values, with PPy:Ce5 achieving the highest cycling stability, maintaining approximately 95% of its initial capacity after 1000 cycles. PPy:Ce3 demonstrates a CR value of 80.3%, which is lower than that of PPy:Ce5 but still represents a significant improvement over pure PPy (85.4%). These results confirm that PPy:Ce5 exhibits the best overall electrochemical performance, while PPy:Ce3 provides moderate enhancements in both charge storage capacity and cycling stability compared to pure PPy. PPy:Ce3 also showed enhanced stability with 80.3% capacitance retention, which is a notable improvement over pure PPy (85.4%), though still inferior to the performance of PPy:Ce5.The CR value of PPy:Ce20 is slightly lower than that of the other designs, likely due to excessive cerium doping, which negatively impacts the material's structural and electrochemical properties. These findings emphasize the importance of optimizing the cerium doping ratio to achieve the best balance between structural and electrochemical performance.
The electrochemical performance data in Table 3 highlight the efficiency of PPy and PPy:Ce nanofibers as electrode materials for supercapacitors. Among the tested designs, PPy:Ce5 exhibited the highest performance, achieving a specific capacitance of 203 F g−1 and an energy density of 21.3 W h kg−1. The data for PPy:Ce3, included in Table 3, provide a more comprehensive comparison of the electrochemical performance of PPy and PPy:Ce nanofibers. The results show that while PPy:Ce3 outperforms pure PPy, it does not reach the performance level of PPy:Ce5. Specifically, PPy:Ce3 achieves a specific capacitance of 138.9 F g−1 and an energy density of 20.2 W h kg−1, compared to 100.3 F g−1 and 8.4 W h kg−1 for pure PPy. These findings confirm that 5% cerium doping provides the optimal balance between structural and electrochemical properties. The enhanced performance of PPy:Ce5 can be attributed to its optimized structural features, as revealed by BET, SEM, and TEM analyses. BET analysis shows that cerium doping reduces the surface area while increasing pore size, facilitating ion transport and improving electrolyte accessibility. SEM and TEM images confirm that cerium doping increases nanofiber diameter and surface roughness, which further enhances ion accessibility. These structural changes directly correlate with the superior electrochemical performance of PPy:Ce5, as evidenced by its broader CV curve area, lower charge transfer resistance, and higher cycling stability.
| Design | J (A g−1) | v (mV s−1) | Cs (F g−1) | ED (W h kg−1) | PD (kW kg−1) | CR (%)@cycle | Setup |
|---|---|---|---|---|---|---|---|
| a J; current density, Cs; specific capacitance, ED and PD; energy and power density, CR; capacitance retention. | |||||||
| CeO2/AC89 | 1 | n.a. | 162 | 4.8 | 3.5 | 99@1000 | 3-Electrode |
| GO-400/CeO2/PPy90 | 1 | n.a. | 49 | 19.7 | 0.85 | 83.1@10000 |
3-Electrode |
| CeO2–SnO2/rGO91 | 0.5 | n.a. | 156 | n.a. | n.a. | n.a. | 3-Electrode |
| P-CeO2/PPy-5 (ref. 92) | n.a. | 1 | 240 | n.a. | n.a. | 90.1@500 | 3-Electrode |
| A-CeO2/PPy-5 (ref. 92) | n.a. | 1 | 145 | n.a. | n.a. | 83.5@500 | 3-Electrode |
| n-CeO2PPy93 | 1 | n.a. | 433 | n.a. | n.a. | n.a. | 3-Electrode |
| PPy (this work, tw) | 0.5 | 1 | 100.3 | 8.4 | 6.9 | 85.4@1000 | 2-Electrode |
| PPy:Ce3 (tw) | 0.5 | 1 | 138.9 | 20.2 | 9.4 | 80.3@1000 | 2-Electrode |
| PPy:Ce5 (tw) | 0.5 | 1 | 203 | 21.3 | 8.1 | 95.5@1000 | 2-Electrode |
| PPy:Ce10 (tw) | 0.5 | 1 | 163 | 19.4 | 8.4 | 88.7@1000 | 2-Electrode |
| PPy:Ce20 (tw) | 0.5 | 1 | 91.4 | 14.4 | 31.2 | 82.4@1000 | 2-Electrode |
The results in Table 3 highlight a key distinction between this study and previous works in the literature. Unlike most studies that utilize cerium in its oxide form (CeO2), this work directly incorporates cerium ions (Ce3+/Ce4+) into the polypyrrole (PPy) matrix via in situ polymerization. This approach eliminates the need for additional synthesis steps to prepare cerium oxide, simplifies the fabrication process, and enhances the structural and electrochemical properties of the material. For instance, the PPy:Ce5 design achieves a specific capacitance of 203 F g−1 and an energy density of 21.3 W h kg−1 in a two-electrode system, outperforming many CeO2-based systems reported in the literature, which often rely on three-electrode setups. These findings demonstrate the potential of directly incorporating cerium ions to optimize the material's performance for practical supercapacitor applications.
The comparison between 3-electrode and 2-electrode setups is critical for understanding the practical relevance of the results presented in Table 3. While 3-electrode systems are commonly used in laboratory studies to evaluate the intrinsic properties of electrode materials, they often overestimate performance metrics such as specific capacitance and energy density.94 This is because the 3-electrode setup isolates the working electrode, minimizing the influence of other components such as the counter electrode and separator.94,95 In contrast, the 2-electrode system used in this study better represents real-world supercapacitor devices, as it includes two identical electrodes, a separator, and an electrolyte. The performance metrics obtained in the 2-electrode system account for the combined contributions of all components, providing a more realistic assessment of the material's potential for practical applications.95,96
The results in Table 3 demonstrate that the PPy:Ce5 design achieves high-performance metrics, including a specific capacitance of 203 F g−1 and an energy density of 21.3 W h kg−1, even in a 2-electrode system. This is a significant advantage over many studies in the literature, which report higher values using 3-electrode systems that may not accurately reflect real-world performance. The use of a 2-electrode system in this study highlights the practical applicability of the PPy:Ce5 design and underscores its potential for commercial supercapacitor applications. However, it is important to note that the 2-electrode system introduces certain limitations, such as increased internal resistance and reduced specific capacitance compared to the 3-electrode system.97 These limitations are inherent to the 2-electrode configuration and must be considered when comparing results across different studies. Despite these challenges, the consistency of our findings across multiple characterization techniques (e.g., BET, SEM, TEM, EPR) and electrochemical analyses (e.g., CV, EIS, GCPL) supports the reliability of the reported performance metrics.
In contrast, excessive cerium doping, as in PPy:Ce20, leads to a reduction in surface area and excessive pore enlargement, which negatively impacts ion transport and charge storage capacity. This highlights the importance of controlling the cerium doping ratio to achieve optimal performance.
4. Conclusion
This work thoroughly examined the potential of cerium ion-doped PPy nanofibers for SC applications. Our research significantly improves the development of high-performance supercapacitor electrodes utilizing a two-electrode method. BET analysis showed that cerium doping improved ion transport by optimizing the nanofibers' surface area and pore structure. The changes in structure considerably affect the electrochemical performance. TEM and SEM investigations demonstrated that cerium doping increased the diameter of the nanofibers, resulting in a more uniform morphology. These structural changes enabled better ion accessibility to the electrode surface and elevated electrochemical performance. Electrochemical investigations clearly highlight how structural modifications, induced by cerium doping, enhance the charge storage capacity, cycling stability, and overall performance of the material. CV tests revealed that PPy:Ce5 exhibited a wider curve area, implying a higher charge storage capability. Impedance tests suggested that PPy:Ce5 had the lowest charge transfer resistance and optimal ion transport. These results suggest that cerium doping enhances electrical conductivity, diminishes internal resistance and optimizes charge transfer kinetics. EPR studies demonstrated that cerium doping increases paramagnetic centers' density, charge carrier density, and electrical conductivity. These results explain the lower internal resistance and faster charge transfer kinetics of PPy:Ce5. GCPL tests confirmed the high charge storage capacity and excellent cycling stability of PPy:Ce5. PPy:Ce5 demonstrated exceptional cycling stability, maintaining 95% of its initial capacity after 1000 cycles. Our research shows that cerium doping at optimal ratios affects structural and electrochemical properties, significantly contributing to the existing literature. Future research might strengthen understanding in this domain by examining the impacts of various additives and synthesis parameters.Data availability
The data supporting this article are not publicly available due to institutional confidentiality and legal restrictions. Therefore, the datasets cannot be shared.Conflicts of interest
There are no conflicts to declare.Acknowledgements
This study was supported by The Scientific and Technological Research Council of Türkiye (TUBITAK) (grant no. 224M211 – TUBITAK 3501 Project). Ahmet GÜNGÖR thanks TUBITAK for financial support.References
- H. Ibrahim, A. Ilinca and J. Perron, Renewable Sustainable Energy Rev., 2008, 12, 1221–1250 CrossRef CAS.
- C. Liu, F. Li, M. Lai-Peng and H. M. Cheng, Adv. Mater., 2010, 22, E28–E62 CAS.
- A. Dutta, S. Mitra, M. Basak and T. Banerjee, Energy Storage, 2023, 5, e339 CrossRef CAS.
- M. I. A. Abdel Maksoud, R. A. Fahim, A. E. Shalan, M. Abd Elkodous, S. O. Olojede, A. I. Osman, C. Farrell, A. H. Al-Muhtaseb, A. S. Awed, A. H. Ashour and D. W. Rooney, Environ. Chem. Lett., 2020, 19(1), 375–439 CrossRef.
- A. Muzaffar, M. B. Ahamed and C. M. Hussain, Renewable Sustainable Energy Rev., 2024, 195, 114324 CrossRef CAS.
- M. A. A. Mohd Abdah, N. H. N. Azman, S. Kulandaivalu and Y. Sulaiman, Mater. Des., 2020, 186, 108199 CrossRef CAS.
- Y. Wang, L. Zhang, H. Hou, W. Xu, G. Duan, S. He, K. Liu and S. Jiang, J. Mater. Sci., 2020, 56(1), 173–200 CrossRef CAS.
- G. Centi and S. Perathoner, Catal. Today, 2010, 150, 151–162 CrossRef CAS.
- Z. Roohi, F. Mighri and Z. Zhang, Materials, 2024, 17, 4126 CrossRef CAS.
- G. A. Snook, P. Kao and A. S. Best, J. Power Sources, 2011, 196, 1–12 CrossRef CAS.
- R. B. Choudhary, S. Ansari and B. Purty, J. Energy Storage, 2020, 29, 101302 CrossRef.
- A. Afzal, F. A. Abuilaiwi, A. Habib, M. Awais, S. B. Waje and M. A. Atieh, J. Power Sources, 2017, 352, 174–186 CrossRef CAS.
- A. Ramanaviciene and A. Ramanavicius, Crit. Rev. Anal. Chem., 2002, 32, 245–252 CrossRef CAS.
- L. Hao, C. Dong, L. Zhang, K. Zhu and D. Yu, Polymers, 2022, 14, 5139 CrossRef CAS.
- O. B. Abdillah, Y. Bin Rus, M. Ulfa, Dedi and F. Iskandar, J. Energy Storage, 2023, 74, 109300 CrossRef.
- A. Afzal, F. A. Abuilaiwi, A. Habib, M. Awais, S. B. Waje and M. A. Atieh, J. Power Sources, 2017, 352, 174–186 CrossRef CAS.
- S. K. Kandasamy and K. Kandasamy, J. Inorg. Organomet. Polym. Mater., 2018, 28(3), 559–584 CrossRef CAS.
- Y. Xie and P. Account, Chem. Rec., 2019, 19, 2370–2384 CrossRef CAS.
- H. Huang and J. J. Zhu, Analyst, 2019, 144, 6789–6811 RSC.
- H. Huang and J. J. Zhu, Analyst, 2019, 144, 6789–6811 RSC.
- R. Kırkgeçit, H. Özlü Torun, F. Kılıç Dokan and E. Öztürk, J. Rare Earths, 2022, 40, 1619–1627 CrossRef.
- X. Wang, T. Wang, D. Liu, J. Guo and P. Liu, Ind. Eng. Chem. Res., 2016, 55, 866–874 CrossRef CAS.
- M. Vinitha, G. Velraj, K. Anandan, G. K. Meenatchi and M. Shellaiah, Int. J. Polym. Anal. Charact., 2025, 30, 122–132 CrossRef CAS.
- U. Amara, K. Mahmood, M. Khan and M. H. Nawaz, Microchem. J., 2023, 185, 108254 CrossRef CAS.
- X. Chen, M. Zhang, J. Zhu, J. Wang, Z. Jiao and Y. Li, J. Alloys Compd., 2022, 901, 163649 CrossRef CAS.
- A. Husain, S. A. Al-Zahrani, A. Al Otaibi, I. Khan, M. M. A. Khan, A. M. Alosaimi, A. Khan, M. A. Hussein, A. M. Asiri and M. Jawaid, Polymers, 2021, 13, 1829 CrossRef CAS.
- T. Shahnaz, V. C. Padmanaban, S. Mohamed Madhar Fazil and S. Narayanasamy, Int. J. Biol. Macromol., 2020, 151, 322–332 CrossRef CAS.
- Q. Zhang, Y. Li, J. Zhu, L. Lan, C. Li, J. Mao, F. Wang, Z. Zhang and L. Wang, Chem. Eng. J., 2021, 420, 129712 CrossRef CAS.
- A. Güngör, S. G. Çolak, M. Ö. Alaş Çolak, R. Genç and E. Erdem, Electrochim. Acta, 2024, 480, 143924 CrossRef.
- K. M. Albalawi, M. Al-Dossari, A. M. Saeedi, R. H. Althomali, G. F. B. Solre, M. Sadiq and S. U. Asif, J. Energy Storage, 2024, 104, 114576 CrossRef.
- M. Z. Iqbal, M. M. Faisal, M. Sulman, S. R. Ali, A. M. Afzal, M. A. Kamran and T. Alharbi, J. Energy Storage, 2020, 29, 101324 CrossRef.
- A. Allagui, T. J. Freeborn, A. S. Elwakil and B. J. Maundy, Sci. Rep., 2016, 6(1), 1–8 CrossRef PubMed.
- Z. Weng and X. Ni, J. Appl. Polym. Sci., 2008, 110, 109–116 CrossRef CAS.
- A. S. Saraç, B. Ustamehmetoǧlu, M. I. Mustafaev, C. Erbil and G. Uzelli, J. Polym. Sci., Part A: Polym. Chem., 1995, 33, 1581–1587 CrossRef.
- R. E. Myers, J. Electron. Mater., 1986, 15, 61–69 CrossRef CAS.
- H. C. Kang and K. E. Geckeler, Polymer, 2000, 41, 6931–6934 CrossRef CAS.
- L. Guyard, P. Hapiot and P. Neta, J. Phys. Chem. B, 1997, 101, 5698–5706 CrossRef CAS.
- Y. Li, P. Bober, M. Trchová and J. Stejskal, J. Mater. Chem. C, 2017, 5, 4236–4245 RSC.
- D. Kopecký, M. Varga, J. Prokeš, M. Vrňata, M. Trchová, J. Kopecká and M. Václavík, Synth. Met., 2017, 230, 89–96 CrossRef.
- B. Köksel, A. Cihaner, M. Kaya, M. Volkan and A. M. Önal, J. Appl. Polym. Sci., 2008, 108, 2707–2711 CrossRef.
- C. C. Quitmann and K. Müller-Buschbaum, Z. Anorg. Allg. Chem., 2004, 630, 2422–2430 CrossRef CAS.
- S. Sadki, P. Schottland, N. Brodie and G. Sabouraud, Chem. Soc. Rev., 2000, 29, 283–293 RSC.
- Y. Tan and K. Ghandi, Synth. Met., 2013, 175, 183–191 CrossRef CAS.
- C. Z. Brusamarello, L. M. Santos, A. P. Romio, M. Di Domenico, A. F. Santos, P. H. H. de Araújo and C. Sayer, Mater. Today Commun., 2021, 26, 101740 CrossRef CAS.
- X. Y. Yuan, C. C. Wang and B. Yu, Chin. Chem. Lett., 2024, 35, 109517 CrossRef CAS.
- Y. O. Mezhuev, I. V. Plyushchii, Y. V. Korshak, M. I. Shtil’man and I. A. Gritskova, Russ. J. Gen. Chem., 2019, 89, 1477–1484 CrossRef CAS.
- D. Chen, J. Chen, X. Luan, H. Ji and Z. Xia, Chem. Eng. J., 2011, 171, 1150–1158 CrossRef CAS.
- Z. Shahryari, K. Gheisari, M. Yeganeh and B. Ramezanzadeh, Corros. Sci., 2021, 193, 109894 CrossRef CAS.
- J. Tabačiarová, M. Mičušík, P. Fedorko and M. Omastová, Polym. Degrad. Stab., 2015, 120, 392–401 CrossRef.
- I. Rodríguez, B. R. Scharifker and J. Mostany, J. Electroanal. Chem., 2000, 491, 117–125 CrossRef.
- P. Novák, B. Rasch and W. Vielstich, J. Electrochem. Soc., 1991, 138, 3300–3304 CrossRef.
- M. E. Nicho and H. Hu, Sol. Energy Mater. Sol. Cells, 2000, 63, 423–435 CrossRef CAS.
- C. Ding, J. Yuan, X. Wang, T. Huang, Y. Wang and J. Sun, Mater. Adv., 2023, 4, 2162–2173 RSC.
- K. Tashiro, Structural Science of Crystalline Polymers, 2022, pp. 399–660 Search PubMed.
- M. Vinitha, G. Velraj, K. Anandan, G. K. Meenatchi and M. Shellaiah, Int. J. Polym. Anal. Charact., 2025, 30, 122–132 CrossRef CAS.
- S. Khokher and S. Lata, J. Mol. Struct., 2024, 1312, 138525 CrossRef CAS.
- A. L. Khan, Dhanjai and R. Jain, J. Appl. Electrochem., 2020, 50, 655–672 CrossRef CAS.
- E. A. Sanches, S. F. Alves, J. C. Soares, A. M. Da Silva, C. G. Da Silva, S. M. De Souza and H. O. Da Frota, J. Nanomater., 2015, 2015, 129678 CrossRef.
- S. Bose, T. Kuila, M. E. Uddin, N. H. Kim, A. K. T. Lau and J. H. Lee, Polymer, 2010, 51, 5921–5928 CrossRef CAS.
- M. Vinitha, G. Velraj, K. Anandan, G. K. Meenatchi and M. Shellaiah, Int. J. Polym. Anal. Charact., 2025, 30(2), 122–132 CrossRef CAS.
- T. Guo, P. Hu, L. Li, Z. Wang and L. Guo, Chem, 2023, 9, 1080–1093 CAS.
- C. Choi, D. S. Ashby, D. M. Butts, R. H. DeBlock, Q. Wei, J. Lau and B. Dunn, Nat. Rev. Mater., 2020, 5, 5–19 CrossRef.
- H. Zhang, Y. Wang, D. Song, L. Wang, Y. Zhang, Y. Wang, H. Zhang, Y. Wang, D. Song, L. Wang, Y. Zhang and Y. Wang, Nanomaterials, 2023, 13, 1921 CrossRef CAS PubMed.
- M. Johnsi and S. Austin Suthanthiraraj, Ionics, 2016, 22, 1075–1083 CrossRef CAS.
- R. Yousefi, A. K. Zak and F. Jamali-Sheini, Mater. Sci. Semicond. Process., 2013, 16, 771–777 CrossRef CAS.
- D. L. Leslie-Pelecky and R. D. Rieke, Chem. Mater., 1996, 8, 1770–1783 CrossRef CAS.
- V. I. Krinichnyi, A. L. Konkin and A. P. Monkman, Synth. Met., 2012, 162, 1147–1155 CrossRef CAS.
- N. Gibson, P. Kuchenbecker, K. Rasmussen, V. D. Hodoroaba and H. Rauscher, Characterization of Nanoparticles: Measurement Processes for Nanoparticles, 2020, pp. 265–294 Search PubMed.
- T. Manimekala, R. Sivasubramanian, M. A. Dar and G. Dharmalingam, RSC Adv., 2025, 15, 2490–2522 RSC.
- M. Thommes, K. Kaneko, A. V. Neimark, J. P. Olivier, F. Rodriguez-Reinoso, J. Rouquerol and K. S. W. Sing, Pure Appl. Chem., 2015, 87, 1051–1069 CrossRef CAS.
- S. S. Shah, E. Cevik, M. A. Aziz, T. F. Qahtan, A. Bozkurt and Z. H. Yamani, Synth. Met., 2021, 277, 116765 CrossRef CAS.
- S. Ghosh, S. Lobanov and V. K. Lo, Environ. Sci. Pollut. Res., 2019, 26, 19063–19077 CrossRef CAS PubMed.
- M. G. Bakker, B. Fowler, M. K. Bowman and G. S. Patience, Can. J. Chem. Eng., 2020, 98, 1668–1681 CrossRef CAS.
- N. Pathak, Defect-Induced Magnetism in Oxide Semiconductors, 2023, pp. 453–477 Search PubMed.
- M. M. Roessler and E. Salvadori, Chem. Soc. Rev., 2018, 47, 2534–2553 RSC.
- K. U. R. Naveed, L. Wang, H. Yu, R. S. Ullah, M. Haroon, S. Fahad, J. Li, T. Elshaarani, R. U. Khan and A. Nazir, Polym. Chem., 2018, 9, 3306–3335 RSC.
- A. Güngör, F. Bakan-Misirlioglu, R. Genç Alturk and E. Erdem, J. Energy Storage, 2024, 76, 110143 CrossRef.
- A. Daraghmeh, S. Hussain, A. U. Haq, I. Saadeddin, L. Servera and J. M. Ruiz, J. Energy Storage, 2020, 32, 101798 CrossRef.
- M. Kong, Z. Wang, W. Wang, M. Ma, D. Liu, S. Hao, R. Kong, G. Du, A. M. Asiri, Y. Yao and X. Sun, Chem.–Eur. J., 2017, 23, 4435–4441 CrossRef CAS.
- H. Wang, D. Zhang, T. Yan, X. Wen, J. Zhang, L. Shi and Q. Zhong, J. Mater. Chem. A, 2013, 1, 11778–11789 RSC.
- C. Zheng, Z. Guo, B. Jian, Z. Chen, J. Zhong, N. Li and S. Huang, Chem. Eng. J., 2023, 475, 146408 CrossRef CAS.
- T. Schoetz, L. W. Gordon, S. Ivanov, A. Bund, D. Mandler and R. J. Messinger, Electrochim. Acta, 2022, 412, 140072 CrossRef CAS.
- J. H. Jeong, D. W. Jung, E. W. Shin and E. S. Oh, J. Alloys Compd., 2014, 604, 226–232 CrossRef CAS.
- R. Srinivasan and F. Fasmin, An introduction to electrochemical impedance spectroscopy, CRC Press, 2021 Search PubMed.
- V. Vivier and M. E. Orazem, Chem. Rev., 2022, 122, 11131–11168 CrossRef CAS PubMed.
- D. A. Harrington and P. Van Den Driessche, Electrochim. Acta, 2011, 56, 8005–8013 CrossRef CAS.
- Y. Pang, J. Pan, J. Yang, S. Zheng and C. Wang, Electrochem. Energy Rev., 2021, 4(2), 169–193 CrossRef.
- P. R. Bandaru, H. Yamada, R. Narayanan and M. Hoefer, Mater. Sci. Eng., R, 2015, 96, 1–69 CrossRef.
- L. S. Aravinda, K. Udaya Bhat and B. Ramachandra Bhat, Mater. Lett., 2013, 112, 158–161 CrossRef CAS.
- T. Kavinkumar, T. R. Naveenkumar and B. Neppolian, Inorg. Chem. Commun., 2024, 165, 112561 CrossRef CAS.
- G. S. Kumar, S. A. Reddy, H. Maseed and N. R. Reddy, Funct. Mater. Lett., 2020, 13(02), 2051005 CrossRef CAS.
- X. Wang, T. Wang, D. Liu, J. Guo and P. Liu, Ind. Eng. Chem. Res., 2016, 55, 866–874 CrossRef CAS.
- M. Vinitha, G. Velraj, K. Anandan, G. K. Meenatchi and M. Shellaiah, Int. J. Polym. Anal. Charact., 2025, 30, 122–132 CrossRef CAS.
- M. Bakhshi, A. Sivasengaran, J. Landesfeind, R. A. H. Niessen, P. H. L. Notten, S. Hu, Y. Lai and P. A. Valdes-Sosa, J. Electrochem. Soc., 2016, 164, A80 Search PubMed.
- L. Ianeselli, G. Grenci, C. Callegari, M. Tormen and L. Casalis, Biosens. Bioelectron., 2014, 55, 1–6 CrossRef CAS PubMed.
- M. R. Hasan, P. Sharma, S. Shaikh, S. Singh, R. Pilloton and J. Narang, Biosensors, 2023, 13, 1 CrossRef CAS PubMed.
- G. Nagasubramanian, J. Power Sources, 2000, 87, 226–229 CrossRef CAS.
Footnote |
| † Electronic supplementary information (ESI) available. See DOI: https://doi.org/10.1039/d5ta02164b |
| This journal is © The Royal Society of Chemistry 2025 |