 Open Access Article
Creative Commons Attribution 3.0 Unported Licence
Synthesis and characterization of poly(ester amide)-based materials for 3D printing of tissue engineering scaffolds†
Patrícia
dos Santos
ab,
Beatriz
Alves
 a,
Sara
Inocêncio
a,
Pedro
Nunes
a,
Stephen M.
Richardson
a,
Sara
Inocêncio
a,
Pedro
Nunes
a,
Stephen M.
Richardson
 c,
Antonio
Gloria
d,
Arménio
Serra
 a,
Ana Clotilde
Fonseca‡
*a and
Marco
Domingos‡
 *b
*b
aCEMMPRE, ARISE, Department of Chemical Engineering, University of Coimbra, Rua Sílvio Lima-Polo II, 3030-790, Coimbra, Portugal. E-mail: p.santos0495@gmail.com; biadalves77@gmail.com; sara.i.r.inocencio@gmail.com; pedroecn@hotmail.com; armenio.serra@gmail.com; anafs@eq.uc.pt
bDepartment of Mechanical and Aerospace Engineering, School of Engineering, Faculty of Science and Engineering & Henry Royce Institute, The University of Manchester, M13 9PL, Manchester, UK. E-mail: marco.domingos@manchester.ac.uk
cManchester Cell-Matrix Centre, Division of Cell Matrix Biology and Regenerative Medicine, School of Biological Sciences, Faculty of Biology, Medicine and Health, Manchester Academic Health Sciences Centre, The University of Manchester, M13 9PL, Manchester, UK. E-mail: s.richardson@manchester.ac.uk
dDepartment of Industrial Engineering, University of Naples Federico II, P.le Tecchio 80, 80125, Naples, Italy. E-mail: angloria@unina.it
First published on 28th January 2025
Abstract
The fabrication of three-dimensional (3D) scaffolds with imprinted physical, chemical and topographical cues is instrumental in tissue engineering strategies to instruct cell function and guide the regeneration of tissues. α-Amino acids based poly(ester amide)s (AAA-PEAs), combining the biocompatibility and biodegradability of polyesters with the superior mechanical properties of polyamides, have emerged as promising scaffolding materials. However, their processing via extrusion-based 3D printing remains challenging due to the lack of polymeric structures with suitable molecular weight and thermal stability. Here, we develop a new library of high molecular weight AAA-PEAs based on L-alanine (PEA-ala), L-alanine/glycine (PEA-ala–gly (75![[thin space (1/6-em)]](https://www.rsc.org/images/entities/char_2009.gif) :
:![[thin space (1/6-em)]](https://www.rsc.org/images/entities/char_2009.gif) 25)) and L-alanine/glycine/jeffamine (PEA-ala–gly–jeff (50
25)) and L-alanine/glycine/jeffamine (PEA-ala–gly–jeff (50![[thin space (1/6-em)]](https://www.rsc.org/images/entities/char_2009.gif) :
:![[thin space (1/6-em)]](https://www.rsc.org/images/entities/char_2009.gif) 25
25![[thin space (1/6-em)]](https://www.rsc.org/images/entities/char_2009.gif) :
:![[thin space (1/6-em)]](https://www.rsc.org/images/entities/char_2009.gif) 25)) and investigate their performance as polymeric materials for 3D printing against commercially available poly(ε-caprolactone) (PCL). Thermogravimetric analysis reveals the stability of AAA-PEAs at high temperatures, enabling their processing via melt-extrusion printing. Despite differences in complex viscosity between PCL and AAA-PEAs, highlighted by oscillatory rheology measurements, the printability of AAA-PEAs does not seem to be compromised, resulting in 3D scaffolds with good shape-fidelity. Additional physicochemical characterisation of synthesised materials also confirm the possibility of fabricating two-dimensional (2D) films and 3D scaffolds with different mechanical properties, wettability and degradation profiles, depending on the AAA-PEA used. Biological tests carried out in vitro confirm the ability of synthesised materials to support the adhesion and function of metabolically active human bone marrow derived mesenchymal stem cells (hBM-MSCs). The newly synthesised AAA-PEAs expand the range of processable materials via melt-extrusion and contribute to the fabrication of scaffolds with tuneable physicochemical properties for improved tissue regeneration.
25)) and investigate their performance as polymeric materials for 3D printing against commercially available poly(ε-caprolactone) (PCL). Thermogravimetric analysis reveals the stability of AAA-PEAs at high temperatures, enabling their processing via melt-extrusion printing. Despite differences in complex viscosity between PCL and AAA-PEAs, highlighted by oscillatory rheology measurements, the printability of AAA-PEAs does not seem to be compromised, resulting in 3D scaffolds with good shape-fidelity. Additional physicochemical characterisation of synthesised materials also confirm the possibility of fabricating two-dimensional (2D) films and 3D scaffolds with different mechanical properties, wettability and degradation profiles, depending on the AAA-PEA used. Biological tests carried out in vitro confirm the ability of synthesised materials to support the adhesion and function of metabolically active human bone marrow derived mesenchymal stem cells (hBM-MSCs). The newly synthesised AAA-PEAs expand the range of processable materials via melt-extrusion and contribute to the fabrication of scaffolds with tuneable physicochemical properties for improved tissue regeneration.
1. Introduction
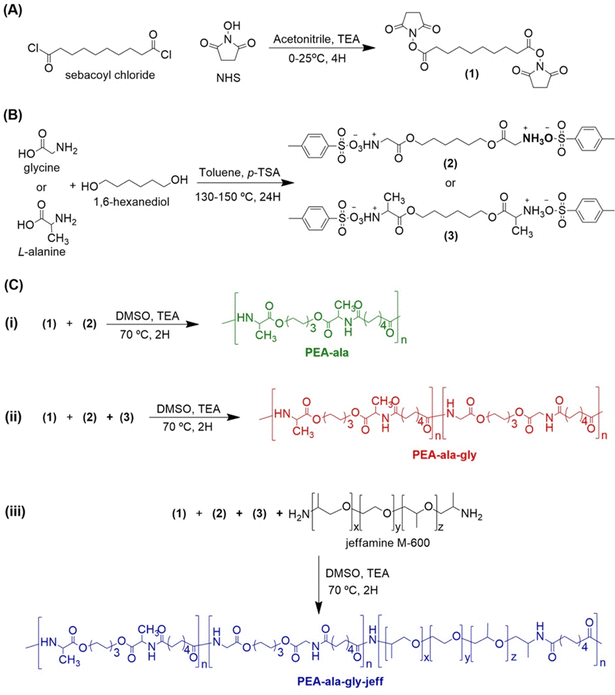
Scaffold-guided tissue regeneration strategies have shown great promise in restoring the structure and function of human tissues damaged by trauma or disease. However, the regeneration process is complex and very much dependent on the synergistic integration of cells, biomolecules and biomaterial scaffolds.1–3 The latter play a crucial role in supporting cell adhesion, cell proliferation, and inducing cell differentiation through different chemical and physical cues.1,3,4 Biocompatibility and biodegradability are essential properties but to successfully promote new tissue ingrowth and maturation, scaffolds must also comply with other numerous requirements including mechanical, topographical and biological.4–6 In terms of scaffold fabrication, additive manufacturing (AM) also known as three-dimensional (3D) printing, offers unique advantages over “conventional” techniques such as electrospinning, freeze-drying, thermally induced phase separation (TIPS), solvent casting, and gas foaming.7,8 Operating in a layer-by-layer manner, 3D printing allows for the computer-controlled deposition of multiple materials to generate scaffolds with tailored internal/external architectures to accommodate different cell types, induce specific cellular responses and ultimately guide the regeneration of the targeted tissue.9,10 3D printing is an umbrella term for a vast selection of AM technologies typically used in the fabrication of scaffolds for tissue engineering (TE). Depending on the scaffolding material and tissue application, it is possible to choose between extrusion-based, vat photopolymerization, powder bed fusion and material jetting systems.2 Extrusion-based printing is undoubtedly the most used technique due to the flexibility offered in terms of the number and type of processable materials, cost and ease of operation.11,12 In terms of processable biomaterials, aliphatic polyesters, such as poly(ε-caprolactone) (PCL), poly(L-lactic acid) (PLA) and poly(D,L-lactic-co-glycolic acid) (PLGA) are among the most popular used in extrusion-based printing. These polymers offer good thermal processability and stability but tend to display poor bioactivity and trigger immunological reactions when implanted in vivo.13–15 Significant efforts have been made in recent years to address some of these challenges and improve cell–material interactions, typically through post-printing functionalization16 or blending with other materials.16–19 However, these methods can be time-consuming and result in unwanted changes to the scaffold's properties. α-Amino acid-based poly(ester amide)s (AAA-PEAs), combining the biodegradability of ester bonds (–COO–) with the excellent thermal and mechanical properties of amide bonds (–NHCO–), are increasingly recognised as alternative materials for 3D printing.20–22The versatility of their polymeric structures allows for the fabrication of scaffolds with tuneable physicochemical, biological and mechanical properties, a critical aspect when attempting to replicate the structural and functional organization of native human tissues. The presence of α-amino acids enhance cell–matrix interactions23,24 and enables in vivo degradation. The latter generates both acidic and basic products, thus avoiding the significant pH drop commonly observed in the degradation of polyesters.20 Interestingly, few studies on 3D printing of AAA-PEAs exist in the literature.24,25 We have previously reported the formulation of PCL and PEA blends for melt-extrusion printing and demonstrated that the addition of PEA strongly enhanced hydrophilicity, mechanical response and cellular function of PCL scaffolds.25 More recently, Ansari et al. used a similar fabrication technique to investigate the application of glycine-based PEA as polymeric materials for AM and TE.24 Despite relatively high processing temperatures (approx. 200 °C) and significant number of crystalline domains, which could negatively impact their biodegradation behavior, the authors reported the successful fabrication and osteogenic potential of PEA-based scaffolds for bone tissue regeneration. Building on the work of Ansari et al. we propose a new and expanded library AAA-PEAs with tuneable physical and chemical properties for 3D printing of scaffolds for guided tissue regeneration. The synthesis of AAA-PEAs was carried out via active solution polycondensation, and AAA-PEAs with three distinct structures were prepared, viz.L-alanine based PEA (PEA-ala), L-alanine and glycine based PEA (PEA-ala–gly) and a L-alanine, glycine and jeffamine based PEA (PEA-ala–gly–jeff). The presence of the α-amino acids aimed primarily at improving the overall biodegradability and biocompatibility of the PEAs. Jeffamine, a polyether-based diamine, was selected to further increase the hydrophilicity of PEAs, since this is a characteristic often desired for TE scaffolds. The successful synthesis of AAA-PEAs with different structures was confirmed by nuclear magnetic resonance (NMR) and Fourier transform infrared (FTIR) spectroscopies. Differential scanning calorimetry (DSC) and thermogravimetric analysis (TGA) were employed to study the thermal properties of synthesised materials. The processability of AAA-PEAs was evaluated using dynamic mechanical thermal analysis (DMTA) and complemented by oscillatory rheology, measuring viscosity changes as a function of temperature. Two-dimensional films obtained via hot pressing were also used to study the degradation, wettability and mechanical properties of the different AAA-PEAs. 3D printed scaffolds obtained via melt-extrusion were morphologically characterised with scanning electronic microscopy (SEM) and micro-computed tomography (micro-CT) and their mechanical behaviour assessed under static compression. In vitro biological performance of PEA-based films was studied using human bone marrow derived mesenchymal stem cells (hBM-MSCs) and compared against commercially available PCL.
2. Materials and methods
2.1 Materials
Poly(ε-caprolactone) (PCL, CAPA™ 6500, Mw = 50![[thin space (1/6-em)]](https://www.rsc.org/images/entities/char_2009.gif) 000) in the form of 3 mm pellets was obtained from Perstorp Caprolactones (Cheshire, UK) and used as received. Glycine (≥99%), L-alanine (≥99%), N-hydroxysuccinimide (NHS) (≥98%), 1,6-hexanediol (≥97%), sebacoyl chloride (≥95%), triethylamine (TEA) (≥99%), p-toluenesulfonic acid monohydrate (p-TSA) (≥98%) were purchased from Tokyo Chemical Industry (Tokyo, Japan). O-(2-Aminopropyl)-O-(2-methoxyethyl) polypropylene glycol (Jeffamine® M-600) (jeff) was purchased from Sigma-Aldrich (St. Louis, MO, USA). Toluene (≥99%), ethanol (96%), chloroform (≥99%) and propan-2-ol (≥99%) were supplied by José Manuel Gomes dos Santos Lda (Odivelas, Portugal). Acetonitrile (HPLC-grade) was purchased from CHEM-LAB (Zedelgem, Belgium). Dimethyl sulfoxide (≥99.9%) was purchased from Fisher Scientific (Waltham, Massachusetts, US) and was dried over calcium chloride and distilled prior use. Deuterated dimethyl sulfoxide (DMSO-d6) and deuterated chloroform (CDCl3) were purchased from Eurisotop (Saint-Aubin, France). Minimum essential medium Eagle and L-ascorbic acid 2-phosphate were purchased from Sigma-Aldrich (St. Gallen SG, Switzerland), TrypLE Express from Gibco (Grand Island, USA), LIVE/DEAD™ Viability Kit and PrestoBlue™ cell viability reagent from Invitrogen™ (Waltham, USA).
000) in the form of 3 mm pellets was obtained from Perstorp Caprolactones (Cheshire, UK) and used as received. Glycine (≥99%), L-alanine (≥99%), N-hydroxysuccinimide (NHS) (≥98%), 1,6-hexanediol (≥97%), sebacoyl chloride (≥95%), triethylamine (TEA) (≥99%), p-toluenesulfonic acid monohydrate (p-TSA) (≥98%) were purchased from Tokyo Chemical Industry (Tokyo, Japan). O-(2-Aminopropyl)-O-(2-methoxyethyl) polypropylene glycol (Jeffamine® M-600) (jeff) was purchased from Sigma-Aldrich (St. Louis, MO, USA). Toluene (≥99%), ethanol (96%), chloroform (≥99%) and propan-2-ol (≥99%) were supplied by José Manuel Gomes dos Santos Lda (Odivelas, Portugal). Acetonitrile (HPLC-grade) was purchased from CHEM-LAB (Zedelgem, Belgium). Dimethyl sulfoxide (≥99.9%) was purchased from Fisher Scientific (Waltham, Massachusetts, US) and was dried over calcium chloride and distilled prior use. Deuterated dimethyl sulfoxide (DMSO-d6) and deuterated chloroform (CDCl3) were purchased from Eurisotop (Saint-Aubin, France). Minimum essential medium Eagle and L-ascorbic acid 2-phosphate were purchased from Sigma-Aldrich (St. Gallen SG, Switzerland), TrypLE Express from Gibco (Grand Island, USA), LIVE/DEAD™ Viability Kit and PrestoBlue™ cell viability reagent from Invitrogen™ (Waltham, USA).
2.2 Synthesis of PEAs
White powder. Yield: 80%; 1H NMR (400 MHz, DMSO-d6 in ppm): 1.30–1.38 (–COO–CH2–CH2–C![[H with combining low line]](https://www.rsc.org/images/entities/char_0048_0332.gif)
![[2 with combining low line]](https://www.rsc.org/images/entities/char_0032_0332.gif) –C
–C![[H with combining low line]](https://www.rsc.org/images/entities/char_0048_0332.gif)
![[2 with combining low line]](https://www.rsc.org/images/entities/char_0032_0332.gif) – signals d and e) 1.63 (–COO–CH2–C
– signals d and e) 1.63 (–COO–CH2–C![[H with combining low line]](https://www.rsc.org/images/entities/char_0048_0332.gif)
![[2 with combining low line]](https://www.rsc.org/images/entities/char_0032_0332.gif) – c) 2.66 (–COO–C
– c) 2.66 (–COO–C![[H with combining low line]](https://www.rsc.org/images/entities/char_0048_0332.gif)
![[2 with combining low line]](https://www.rsc.org/images/entities/char_0032_0332.gif) – signal d) 2.81 (–C
– signal d) 2.81 (–C![[H with combining low line]](https://www.rsc.org/images/entities/char_0048_0332.gif)
![[2 with combining low line]](https://www.rsc.org/images/entities/char_0032_0332.gif) of NHS, signal a); 13C NMR (400 MHz, DMSO-d6 in ppm): 24.69 (–COO–CH2–CH2–CH2–
of NHS, signal a); 13C NMR (400 MHz, DMSO-d6 in ppm): 24.69 (–COO–CH2–CH2–CH2–![[C with combining low line]](https://www.rsc.org/images/entities/char_0043_0332.gif) H2– signal g) 25.90 (–
H2– signal g) 25.90 (–![[C with combining low line]](https://www.rsc.org/images/entities/char_0043_0332.gif) H2 of NHS, signal a) 28.35 (–COO–CH2–CH2–
H2 of NHS, signal a) 28.35 (–COO–CH2–CH2–![[C with combining low line]](https://www.rsc.org/images/entities/char_0043_0332.gif) H
H![[2 with combining low line]](https://www.rsc.org/images/entities/char_0032_0332.gif) signal f) 28.71 (–COO–CH2–
signal f) 28.71 (–COO–CH2–![[C with combining low line]](https://www.rsc.org/images/entities/char_0043_0332.gif) H
H![[2 with combining low line]](https://www.rsc.org/images/entities/char_0032_0332.gif) – signal e) 30.64 (–COO–
– signal e) 30.64 (–COO–![[C with combining low line]](https://www.rsc.org/images/entities/char_0043_0332.gif) H2– signal d) 169.44 (–
H2– signal d) 169.44 (–![[C with combining low line]](https://www.rsc.org/images/entities/char_0043_0332.gif) OO– signal c) 170.71 (
OO– signal c) 170.71 (![[C with combining low line]](https://www.rsc.org/images/entities/char_0043_0332.gif)
![[double bond, length as m-dash]](https://www.rsc.org/images/entities/char_e001.gif) O of NHS signal b). FTIR (ATR in cm−1): 2911/2835 (C–H stretch), 1829/1776/1760 (COO–N), 1751 (C
O of NHS signal b). FTIR (ATR in cm−1): 2911/2835 (C–H stretch), 1829/1776/1760 (COO–N), 1751 (C![[double bond, length as m-dash]](https://www.rsc.org/images/entities/char_e001.gif) O stretch), 1356 (N–O stretch), 1214 (C–O stretch). Fig. S1 (ESI†) for 1H NMR spectrum, Fig. S2 (ESI†) for 13C NMR spectrum and Fig. S3 (ESI†) for FTIR spectrum.
O stretch), 1356 (N–O stretch), 1214 (C–O stretch). Fig. S1 (ESI†) for 1H NMR spectrum, Fig. S2 (ESI†) for 13C NMR spectrum and Fig. S3 (ESI†) for FTIR spectrum.
BAAD-gly. White powder. Yield: 70%; 1H NMR (400 MHz, DMSO-d6 in ppm): 1.31 (–COO–CH2–CH2–C
![[H with combining low line]](https://www.rsc.org/images/entities/char_0048_0332.gif)
![[2 with combining low line]](https://www.rsc.org/images/entities/char_0032_0332.gif) – signal i), 1.58 (–COO–CH2–C
– signal i), 1.58 (–COO–CH2–C![[H with combining low line]](https://www.rsc.org/images/entities/char_0048_0332.gif)
![[2 with combining low line]](https://www.rsc.org/images/entities/char_0032_0332.gif) – signal g), 2.30 (–C
– signal g), 2.30 (–C![[H with combining low line]](https://www.rsc.org/images/entities/char_0048_0332.gif)
![[3 with combining low line]](https://www.rsc.org/images/entities/char_0033_0332.gif) of benzene, signal a), 3.81 (–C
of benzene, signal a), 3.81 (–C![[H with combining low line]](https://www.rsc.org/images/entities/char_0048_0332.gif)
![[2 with combining low line]](https://www.rsc.org/images/entities/char_0032_0332.gif) –NH3– signal e), 4.12 (–C
–NH3– signal e), 4.12 (–C![[H with combining low line]](https://www.rsc.org/images/entities/char_0048_0332.gif)
![[2 with combining low line]](https://www.rsc.org/images/entities/char_0032_0332.gif) –COO– signal h), 7.14 (–C
–COO– signal h), 7.14 (–C![[H with combining low line]](https://www.rsc.org/images/entities/char_0048_0332.gif) of benzene, signal b), 7.53 (–C
of benzene, signal b), 7.53 (–C![[H with combining low line]](https://www.rsc.org/images/entities/char_0048_0332.gif) of benzene, signal b) 8.27 (–N
of benzene, signal b) 8.27 (–N![[H with combining low line]](https://www.rsc.org/images/entities/char_0048_0332.gif) 3 signal c); 13C NMR (400 MHz, DMSO-d6 in ppm): 21.25 (–
3 signal c); 13C NMR (400 MHz, DMSO-d6 in ppm): 21.25 (–![[C with combining low line]](https://www.rsc.org/images/entities/char_0043_0332.gif) H3 of benzene, signal a), 25.25 (–COO–CH2–CH2–
H3 of benzene, signal a), 25.25 (–COO–CH2–CH2–![[C with combining low line]](https://www.rsc.org/images/entities/char_0043_0332.gif) H2– signal i), 28.27 (–COO–CH2–
H2– signal i), 28.27 (–COO–CH2–![[C with combining low line]](https://www.rsc.org/images/entities/char_0043_0332.gif) H2– signal g), 39.87 (–
H2– signal g), 39.87 (–![[C with combining low line]](https://www.rsc.org/images/entities/char_0043_0332.gif) H2–NH3– signal e), 65.80 (–
H2–NH3– signal e), 65.80 (–![[C with combining low line]](https://www.rsc.org/images/entities/char_0043_0332.gif) H2–COO– signal h), 125.98 (–
H2–COO– signal h), 125.98 (–![[C with combining low line]](https://www.rsc.org/images/entities/char_0043_0332.gif) H of benzene signal b), 128,69 (–
H of benzene signal b), 128,69 (–![[C with combining low line]](https://www.rsc.org/images/entities/char_0043_0332.gif) H of benzene signal b), 138.70 (–
H of benzene signal b), 138.70 (–![[C with combining low line]](https://www.rsc.org/images/entities/char_0043_0332.gif) H of benzene signal b), 145.22 (–
H of benzene signal b), 145.22 (–![[C with combining low line]](https://www.rsc.org/images/entities/char_0043_0332.gif) H of benzene signal b), 168.01 (–
H of benzene signal b), 168.01 (–![[C with combining low line]](https://www.rsc.org/images/entities/char_0043_0332.gif) OO). FTIR (ATR in cm−1): 3065 (N–H stretch, primary amine salt), 2934 (C–H stretch, aliphatic), 1736 (C
OO). FTIR (ATR in cm−1): 3065 (N–H stretch, primary amine salt), 2934 (C–H stretch, aliphatic), 1736 (C![[double bond, length as m-dash]](https://www.rsc.org/images/entities/char_e001.gif) O stretch, ester), 1605 (C–N stretch, primary amine salt), 1509 (C–N stretch, primary amine salt), 1188 (S
O stretch, ester), 1605 (C–N stretch, primary amine salt), 1509 (C–N stretch, primary amine salt), 1188 (S![[double bond, length as m-dash]](https://www.rsc.org/images/entities/char_e001.gif) O stretch, salt), 1006 (C–O stretch, ester). Fig. S4 (ESI†) for 1H NMR spectrum, Fig. S5 (ESI†) for 13C NMR spectrum and Fig. S6 (ESI†) for FTIR spectrum.
O stretch, salt), 1006 (C–O stretch, ester). Fig. S4 (ESI†) for 1H NMR spectrum, Fig. S5 (ESI†) for 13C NMR spectrum and Fig. S6 (ESI†) for FTIR spectrum.
BAAD-ala. White powder. Yield: 80%; 1H NMR (400 MHz, DMSO-d6 in ppm): 1.32–1.61 (–COO–CH2–C
![[H with combining low line]](https://www.rsc.org/images/entities/char_0048_0332.gif)
![[2 with combining low line]](https://www.rsc.org/images/entities/char_0032_0332.gif) –C
–C![[H with combining low line]](https://www.rsc.org/images/entities/char_0048_0332.gif)
![[2 with combining low line]](https://www.rsc.org/images/entities/char_0032_0332.gif) – signals g and i and –NH3–CH–C
– signals g and i and –NH3–CH–C![[H with combining low line]](https://www.rsc.org/images/entities/char_0048_0332.gif)
![[3 with combining low line]](https://www.rsc.org/images/entities/char_0033_0332.gif) signal d), 2.30 (–C
signal d), 2.30 (–C![[H with combining low line]](https://www.rsc.org/images/entities/char_0048_0332.gif)
![[3 with combining low line]](https://www.rsc.org/images/entities/char_0033_0332.gif) of benzene, signal a), 4.14 (–C
of benzene, signal a), 4.14 (–C![[H with combining low line]](https://www.rsc.org/images/entities/char_0048_0332.gif) –NH3– signal e and –C
–NH3– signal e and –C![[H with combining low line]](https://www.rsc.org/images/entities/char_0048_0332.gif)
![[2 with combining low line]](https://www.rsc.org/images/entities/char_0032_0332.gif) –COO– signal h), 7.16 (–C
–COO– signal h), 7.16 (–C![[H with combining low line]](https://www.rsc.org/images/entities/char_0048_0332.gif) of benzene, signal b), 7.52 (–C
of benzene, signal b), 7.52 (–C![[H with combining low line]](https://www.rsc.org/images/entities/char_0048_0332.gif) of benzene, signal b), 8.36 (–N
of benzene, signal b), 8.36 (–N![[H with combining low line]](https://www.rsc.org/images/entities/char_0048_0332.gif)
![[3 with combining low line]](https://www.rsc.org/images/entities/char_0033_0332.gif) signal c); 13C NMR (400 MHz, DMSO-d6 in ppm): 16.19 (–NH3–CH–
signal c); 13C NMR (400 MHz, DMSO-d6 in ppm): 16.19 (–NH3–CH–![[C with combining low line]](https://www.rsc.org/images/entities/char_0043_0332.gif) H3 signal d), 21.26 (–
H3 signal d), 21.26 (–![[C with combining low line]](https://www.rsc.org/images/entities/char_0043_0332.gif) H3 of benzene, signal a), 25.21 (–COO–CH2–CH2–
H3 of benzene, signal a), 25.21 (–COO–CH2–CH2–![[C with combining low line]](https://www.rsc.org/images/entities/char_0043_0332.gif) H2– signal i), 28.25 (–COO–
H2– signal i), 28.25 (–COO–![[C with combining low line]](https://www.rsc.org/images/entities/char_0043_0332.gif) H2– signal g), 38.34 (–
H2– signal g), 38.34 (–![[C with combining low line]](https://www.rsc.org/images/entities/char_0043_0332.gif) H–NH3– signal e), 65.97 (–
H–NH3– signal e), 65.97 (–![[C with combining low line]](https://www.rsc.org/images/entities/char_0043_0332.gif) H2–COO– signal h), 125.95 (–
H2–COO– signal h), 125.95 (–![[C with combining low line]](https://www.rsc.org/images/entities/char_0043_0332.gif) H of benzene signal b), 128.64 (–
H of benzene signal b), 128.64 (–![[C with combining low line]](https://www.rsc.org/images/entities/char_0043_0332.gif) H of benzene signal b), 138.49 (–
H of benzene signal b), 138.49 (–![[C with combining low line]](https://www.rsc.org/images/entities/char_0043_0332.gif) H of benzene signal b), 145.54 (–
H of benzene signal b), 145.54 (–![[C with combining low line]](https://www.rsc.org/images/entities/char_0043_0332.gif) H of benzene signal b), 168.00 (–
H of benzene signal b), 168.00 (–![[C with combining low line]](https://www.rsc.org/images/entities/char_0043_0332.gif) OO). FTIR (ATR in cm−1): 3065 (N–H stretch, primary amine salt), 2934 (C–H stretch, aliphatic), 1736 (C
OO). FTIR (ATR in cm−1): 3065 (N–H stretch, primary amine salt), 2934 (C–H stretch, aliphatic), 1736 (C![[double bond, length as m-dash]](https://www.rsc.org/images/entities/char_e001.gif) O stretch, ester), 1605 (C–N stretch, primary amine salt), 1509 (C–N stretch, primary amine salt), 1188 (S
O stretch, ester), 1605 (C–N stretch, primary amine salt), 1509 (C–N stretch, primary amine salt), 1188 (S![[double bond, length as m-dash]](https://www.rsc.org/images/entities/char_e001.gif) O stretch, salt), 1006 (C–O stretch, ester). Fig. S4 (ESI†) for 1H NMR spectrum, Fig. S5 (ESI†) for 13C NMR spectrum Fig. S6 (ESI†) for FTIR spectrum.
O stretch, salt), 1006 (C–O stretch, ester). Fig. S4 (ESI†) for 1H NMR spectrum, Fig. S5 (ESI†) for 13C NMR spectrum Fig. S6 (ESI†) for FTIR spectrum.
2.3 Characterization of activated diester, BAADs and AAA-PEAs
2.4 Preparation and characterization AAA-PEA films
The AAA-PEAs and PCL films were prepared by hot pressing in a laboratory hydraulic press (CARVER®), at 100 °C, and 0.1 metric tons for 15 min. Afterwards, the films were allowed to cool down at room temperature until complete solidification. Cardboard molds were used to ensure the fabrication of films with homogeneous and constant thickness (≈0.3 mm).![[thin space (1/6-em)]](https://www.rsc.org/images/entities/char_2009.gif) δ vs. T curve, at 1 Hz.
δ vs. T curve, at 1 Hz.
| H = Pmax/Ac | (1) |
 | (2) |
2.5 In vitro biological tests
![[thin space (1/6-em)]](https://www.rsc.org/images/entities/char_2009.gif) 000 cells per cm2 and 40
000 cells per cm2 and 40![[thin space (1/6-em)]](https://www.rsc.org/images/entities/char_2009.gif) 000 cells per cm2 were seeded on top of polymeric films for cell viability and cell morphology studies, respectively, and incubated at 37 °C and 5% CO2 for a maximum of 28 days. The culture medium was refreshed every 2–3 days.
000 cells per cm2 were seeded on top of polymeric films for cell viability and cell morphology studies, respectively, and incubated at 37 °C and 5% CO2 for a maximum of 28 days. The culture medium was refreshed every 2–3 days.
Direct contact tests were performed at day 1, 3, 7, 14, 21 and 28 post-seeding with hBM-MSCs. AAA-PEAs and PCL films were washed twice with PBS and incubated with 10% (v/v) of PrestoBlue™ solution for 4 hours at 37 °C and 5% CO2. Absorbance was recorded at 590 nm using a Spark® Multimode Microplate Reader (Tecan, Switzerland) in triplicate (3 films per material and time point).
For indirect contact tests, sterilized AAA-PEAs and PCL films were placed in a 24-well culture plate and incubated at 37 °C and 5% CO2 with 1 mL of hBM-MSCs CCM for 24 hours. hBM-MSCs were seeded at 60![[thin space (1/6-em)]](https://www.rsc.org/images/entities/char_2009.gif) 000 cells per cm2 in a separate 24 well plate with 1 mL of hBM-MSCs CCM. After 24 h the cell culture media of hBM-MSCs was removed and replaced with the eluate from PCL and AAA-PEA films and incubated for 48 h at 37 °C and 5% CO2. PrestoBlue™ assay was then performed in triplicate (3 films per material and time point) using the same protocol reported for the indirect contact test.
000 cells per cm2 in a separate 24 well plate with 1 mL of hBM-MSCs CCM. After 24 h the cell culture media of hBM-MSCs was removed and replaced with the eluate from PCL and AAA-PEA films and incubated for 48 h at 37 °C and 5% CO2. PrestoBlue™ assay was then performed in triplicate (3 films per material and time point) using the same protocol reported for the indirect contact test.
2.6 Scaffold fabrication and characterization
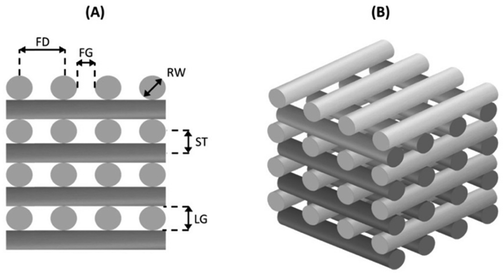
An extrusion-based 3D printing system (3D Discovery, regenHU, Switzerland) equipped with a screw-driven printing head and a 330 μm nozzle was employed in the fabrication of both PCL and AAA-PEAs scaffolds. Rectangular prisms measuring 30 mm (length) × 30 mm (width) × 2 mm (height) were initially designed (Fig. 1) using BioCAD software (regenHU, Switzerland) and subsequently printed employing an optimized set of parameters (Table S2, ESI†). A regular internal pore geometry (quadrangular) was selected to investigate the shape fidelity of printed constructs. This geometry was defined by keeping a constant filament distance (FD) of 730 μm and alternating the deposition angle between 0° and 90° in adjacent layers (Fig. 2). These parameters were defined based on our group's previous work on screw-assisted printing of PCL scaffolds,29 with minor adjustments to the deposition velocity (DV) and liquefier temperature (LT) to ensure the extrusion of continuous filaments with RW values comparable to the internal diameter of the nozzle used (i.e., 330 μm). Scaffolds with 30 mm (length) × 30 mm (width) × 4 mm (height) were also printed for mechanical testing. The obtained scaffolds were then cut into smaller specimens and used for further analyses.Considering the measured force (F) and the initial cross-sectional area of the specimen (A0 = l0·w0), the engineering stress (σ) was calculated as follows eqn (3):
| σ = F/A0 | (3) |
| ε = Δh/h0 | (4) |
2.7 Statistical analysis
Statistical analyses were performed using one-way analysis (ANOVA) followed by Tukey's multiple comparison tests; statistical differences were set for p < 0.0001, p < 0.001, p < 0.01, and p < 0.1.3. Results and discussion
3.1 Synthesis and characterization of AAA-PEAs
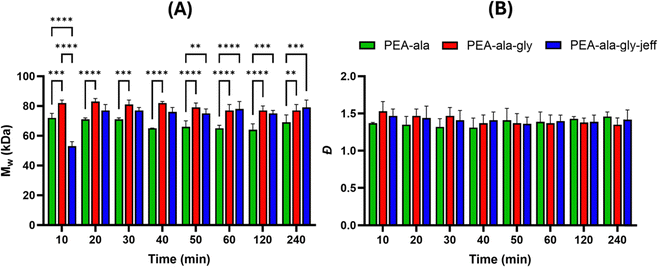
High molecular weight is a desirable feature in polymeric materials for melt-extrusion 3D printing, and various groups have previously reported the successful formulation of AAA-PEAs with Mw in the range of 30 kDa to 60 kDa.31–35 However, only recently Ansari et al.24 managed to synthesize glycine-based PEAs via active solution polycondensation with suitable Mw (50 kDa) under 2 hours (50 minutes) of reaction time. Like Ansari et al. we have decided to start investigating the molecular weight evolution of our reactions over time to determine the feasibility of our approach to generate high molecular weight PEAs with short reaction times. The results (Fig. 3) show that the PEA-ala reached the maximum molecular weight of 72 kDa, after 10 minutes, while the PEA-ala–gly and PEA-ala–gly–jeff attained the maximum molecular weight of 82 kDa and 77 kDa, respectively, after 20 minutes of reaction. The polydispersity (Đ) values of were between 1.3 and 1.5.
Regarding Mw, a statistically significant difference was observed between PEA-ala and the other AAA-PEAs at the plateau. The molecular weight variations may stem from using SEC with conventional calibration, as this method estimates Mw based on the comparison of the hydrodynamic volume of the polymers with polymer standards (in this case, PMMA standards), and structural differences among the AAA-PEAs could affect the results. Additionally, the step-growth polymerization process is sensitive to reactant stoichiometry, and minor reactant weighing discrepancies might have caused fluctuations in Mw. Regarding Đ, no statistically significant differences were noted among the PEAs at different time points.
The FTIR spectra (Fig. S7, ESI†) present the main bands corresponding to the ester and amide bonds of AAA-PEAs. At 1734 cm−1, the band associated with the stretching vibration of the –C![[double bond, length as m-dash]](https://www.rsc.org/images/entities/char_e001.gif) Oester is observed. It is also possible to identify the bands corresponding to the stretching vibration of –NHamide and –C
Oester is observed. It is also possible to identify the bands corresponding to the stretching vibration of –NHamide and –C![[double bond, length as m-dash]](https://www.rsc.org/images/entities/char_e001.gif) Oamide, at ca. 3310 cm−1 and 1638 cm−1, respectively. The bands between 1520–1540 cm−1 are assigned to the bending vibration and stretching vibration of the –NHamide and C–Namide.
Oamide, at ca. 3310 cm−1 and 1638 cm−1, respectively. The bands between 1520–1540 cm−1 are assigned to the bending vibration and stretching vibration of the –NHamide and C–Namide.
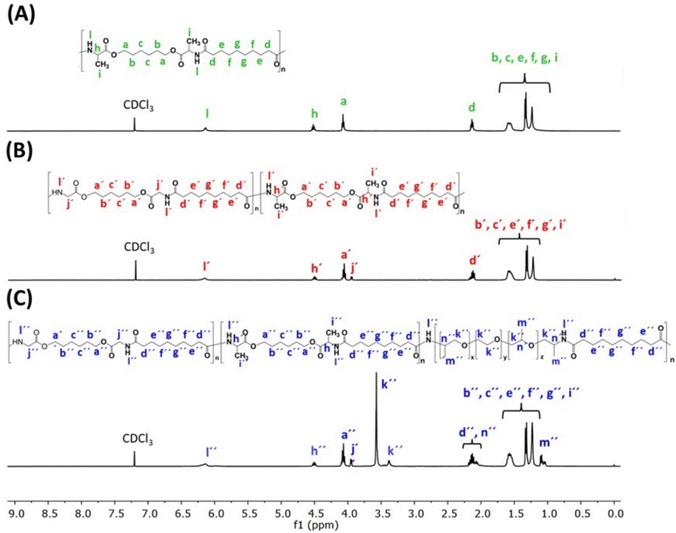
Fig. 4 shows the 1H NMR spectra of the AAA-PEAs. In all spectra, it is possible to see the resonances of the –CH2 protons next to the amide linkage and ester linkage at 2.1 ppm (d) and 4.1 ppm (a), respectively. Between 1.2 and 1.6 ppm, resonate the protons belonging to the central –CH2 protons (b, c, e, f, g and respective ′ and ′′) of both sebacate and 1,6-hexanediol units, and also the protons ascribed to the –CH3 groups (i) of L-alanine. The resonance of the amide proton (l) is clearly visible at 6.2 ppm for all AAA-PEAs. Additionally, in the AAA-PEAs containing glycine, it is possible to identify its –CH2 protons (j′ and j′′) at 3.9 ppm. In AAA-PEAs containing jeff units, it is possible to see the signals at 3.2–3.8 ppm (k′′) assigned to the –CH and –CH2 protons and the signals at 1.0–1.2 ppm (m′′) corresponding to the –CH3 protons of jeff.
The molar ratio of each monomer (BAAD-ala; BAAD-gly and jeff) in the copolymers of PEA-gly-ala and PEA-ala–gly–jeff was calculated from the integration areas of the 1H NMR peaks corresponding to the protons of glycine, L-alanine and jeff. For the L-alanine block, the integration areas of the “(h′ or h′′)” protons were considered while for the glycine groups, the peak of the “(j′ or j′′)” protons was selected for integration. The same was done to calculate the molar fraction of jeff, where the area of “(m′′)” protons was considered. The in feed and the actual molar ratios of the different monomers in the copolymers are presented in Table S3 (ESI†). For both copolymers, the molar ratios of the individual monomers were within the expected values, indicating that all monomers had similar reactivities with the activated diester of sebacoyl chloride. Further insights into the chemical structure of AAA-PEAs were provided by 13C NMR spectroscopy (Fig. S8, ESI†). The data provided by FTIR and 1H NMR and 13C NMR spectroscopies are in full agreement with the proposed chemical structure of the AAA-PEAs, suggesting a successful synthesis of the polymers.
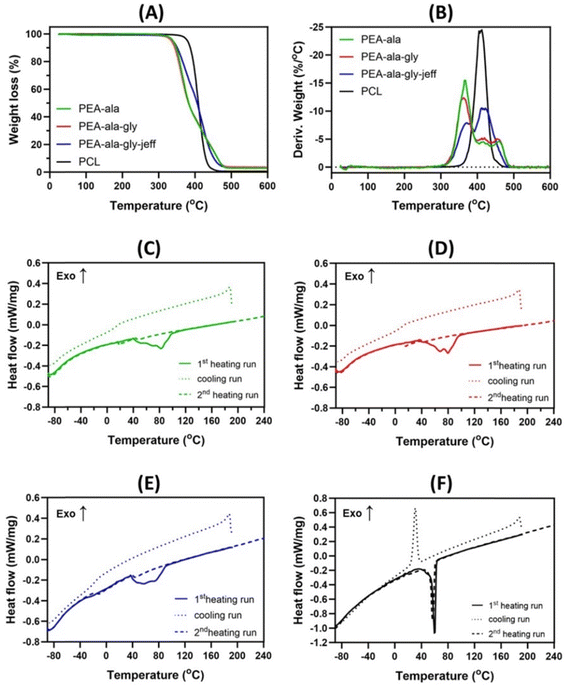
Thermogravimetric analyses (Fig. 5(A) and (B)) show clear differences in terms of stability and thermal degradation profile between AAA-PEAs and PCL. As evidenced by DTG curves, AAA-PEAs degrade in two or three stages, commonly attributed to the degradation of the ester (Tp1 = 369.3–371.8 °C) and amide linkages (Tp2 = 412.4–421.4 °C and Tp3 = 458.8–420.0 °C). PCL instead present a single stage related to the degradation of its ester linkages at 407.9 ± 1.6 °C.25,36,37 The T5% (Table S4, ESI†), which is the temperature at which the samples lose 5% of their initial weight, is similar for all the AAA-PEAs (between 335 °C to 340 °C), indicating a similar thermal stability profile, while PCL showed slightly higher value of T5% (375 °C). A non-volatile char residue is observed for the AAA-PEAs (Table S4, ESI†), which can be attributed to the occurrence of crosslinking and/or cyclization reactions during the thermal degradation of these polymers.25
The thermal properties of AAA-PEAs and PCL, below the degradation temperature, were evaluated by DSC (Fig. 5(C)–(F)). In the first heating run, the AAA-PEAs show an endothermal event that is consistent with a melting, indicating that after synthesis and purification, the polymers present a semi-crystalline nature. The melting transition is broad, suggesting the presence of crystalline structures with different organizations within the samples. In the cooling run and in the subsequent heating run, the only thermal event that is observed is a glass transition, indicating that the AAA-PEAs are not able to crystallize from the melt, under the conditions used in the analysis. This result may be a consequence of the presence of the methyl side groups of L-alanine, preventing a close chain packing and crystallization.37 The glass transition temperature (Tg) of PEA-ala–gly–jeff was much lower (Tg = −13 °C) compared to the other AAA-PEAs (12 °C < Tg < 18 °C). This result can be ascribed to the presence of flexible ether linkages in the jeffamine which facilitate free rotation. Our data agrees with literature, where Tg values for L-alanine and glycine-based PEAs have been reported in the range of 0–25 °C.24,36 PCL shows a different behavior compared to AAA-PEA but in line with previous studies.25 In both the first and second heating runs, a single endothermic peak is visible at about 56 °C, corresponding to the melting of the polymer and indicating a semi-crystalline behavior. During cooling, a well-defined exothermic peak is observed at about 30 °C, corresponding to a crystallization process.
3.2 Characterization of AAA-PEA films
![[thin space (1/6-em)]](https://www.rsc.org/images/entities/char_2009.gif) E′ and tan
E′ and tan![[thin space (1/6-em)]](https://www.rsc.org/images/entities/char_2009.gif) δ curves of the films at the frequency of 1 Hz. The Tg of the films was determined from the maximum of tan
δ curves of the films at the frequency of 1 Hz. The Tg of the films was determined from the maximum of tan![[thin space (1/6-em)]](https://www.rsc.org/images/entities/char_2009.gif) δ, at 1 Hz. The tan
δ, at 1 Hz. The tan![[thin space (1/6-em)]](https://www.rsc.org/images/entities/char_2009.gif) δ curves of the films in multifrequency mode are presented in ESI† (Fig. S9).
δ curves of the films in multifrequency mode are presented in ESI† (Fig. S9).
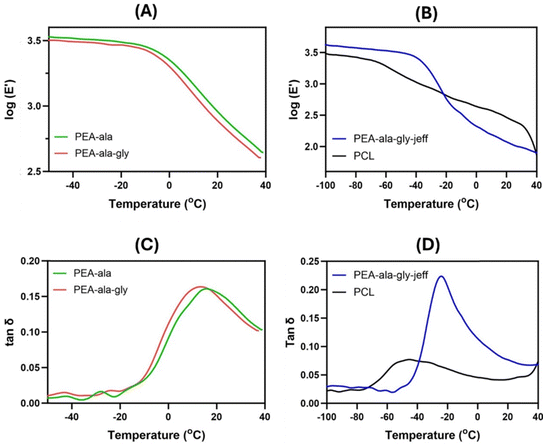 | ||
Fig. 6 DMTA traces of the AAA-PEAs and PCL films log(E′) vs. temperature (A) and (B), and tan![[thin space (1/6-em)]](https://www.rsc.org/images/entities/char_2009.gif) δ vs. temperature (C) and (D). δ vs. temperature (C) and (D). | ||
In the E′ profile (Fig. 6(A) and (B)), for the AAA-PEAs films, two regions can be distinguished: (1) the glassy region from −100 °C to ca. −45 °C for the PEA-ala–gly–jeff films, and from −50 °C to −10 °C for the PEA-ala and PEA-ala–gly films, in which the materials behave as stiff materials; (2) the glass transition zone, in which a decrease in the E′ values can be observed. In comparison, this decrease takes place in a narrower temperature range for the AAA-PEA films suggesting a lower degree of crystallinity, which corroborates the DSC results.
In Fig. 6(C) and (D) it is possible to observe that AAA-PEAs films have a narrower tan![[thin space (1/6-em)]](https://www.rsc.org/images/entities/char_2009.gif) δ profile compared to the PCL films. This result could also be due to the higher crystallinity of the PCL films. As previously reported,25 in materials with higher crystallinity, the amorphous domains have more difficulty starting their motion due to their confinement in the crystalline domains, resulting in wider tan
δ profile compared to the PCL films. This result could also be due to the higher crystallinity of the PCL films. As previously reported,25 in materials with higher crystallinity, the amorphous domains have more difficulty starting their motion due to their confinement in the crystalline domains, resulting in wider tan![[thin space (1/6-em)]](https://www.rsc.org/images/entities/char_2009.gif) δ peaks. AAA-PEAs, in particular those with jeffamine, exhibit higher tan
δ peaks. AAA-PEAs, in particular those with jeffamine, exhibit higher tan![[thin space (1/6-em)]](https://www.rsc.org/images/entities/char_2009.gif) δ peaks denoting a better capacity to absorb and dissipate energy (damping effect) compared to PCL materials. Table S5 (ESI†) summarizes the values of E′, at 37 °C, and the Tg values of the films.
δ peaks denoting a better capacity to absorb and dissipate energy (damping effect) compared to PCL materials. Table S5 (ESI†) summarizes the values of E′, at 37 °C, and the Tg values of the films.
The results show a higher E′ value for PEA-ala and PEA-ala–gly films compared to PEA-ala–gly–jeff films, indicating a higher polymeric chain mobility and lower stiffness associated with the presence of ether linkages in the structure of the latter. Differences in mechanical properties, particularly substrate stiffness, have been extensively studied for their ability to direct cell behavior by activating various mechanotransduction pathways.38–40 These pathways, which include mechano-regulated ion channels41 and focal adhesion complexes in the plasma membrane, influence transcriptional and proteomic regulation, morphology and lineage commitment. Although the biological results did not reveal significant differences in cellular morphology (see Section 3.2.4), formulating AAA-PEAs with varying degrees of stiffness remains relevant and warrants further investigation to explore their impact on other cellular processes, such as stem cell differentiation. E′ values for PCL at 37 °C are not reported due to the initial melting of the polymer as confirmed by an abrupt change in the E′ profile just after the glass transition zone. No significant changes were detected between pristine and processed AAA-PEAs (i.e. films) in terms of Tg suggesting that hot pressing does not affect the intrinsic thermal properties of the AAA-PEAs.
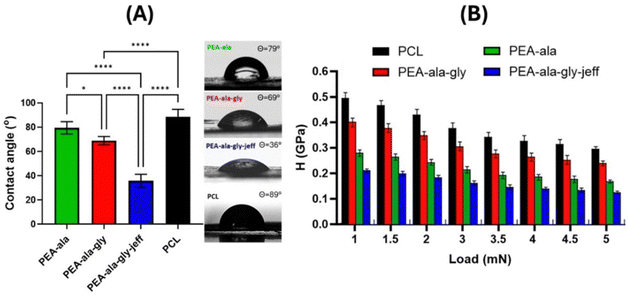
Nanoindentation measurements were carried out to map the surface mechanical properties and evaluate the microstructural characteristics of the bulk materials that may influence cell–matrix interactions and determine cell adhesion, proliferation, differentiation, and even phenotype.44–46Fig. 7(B) shows the results of nanoindentation tests on PEA-ala, PEA-ala–gly, PEA-ala–gly–jeff, and PCL films in terms of hardness as a function of applied load.
The measurements on the PCL films showed hardness values between 0.49 GPa and 0.29 GPa in the tested load range. These values were higher than those determined for PEA-ala (from 0.28 GPa to 0.16 GPa), PEA-ala–gly (from 0.39 GPa to 0.24 GPa), and PEA-ala–gly–jeff (from 0.21 GPa to 0.12 GPa) films. The lowest hardness values were obtained for PEA-ala–gly–jeff films, and the differences observed between the different groups were statistically significant at each load point. These differences in hardness between the films prepared from the different AAA-PEAs indicate that their mechanical properties can be easily altered by changing the chemical structure of the PEAs. PEA-ala–gly–jeff leads to films with a lower hardness due to the presence of ether groups in its structure, which allow a higher mobility of the polymer chains. The films made from PEA-ala–gly have a higher hardness than those made from PEA-ala, possibly due to the greater compaction of the polymer chains in PEA-ala–gly, which is due to the absence of a side group in glycine.
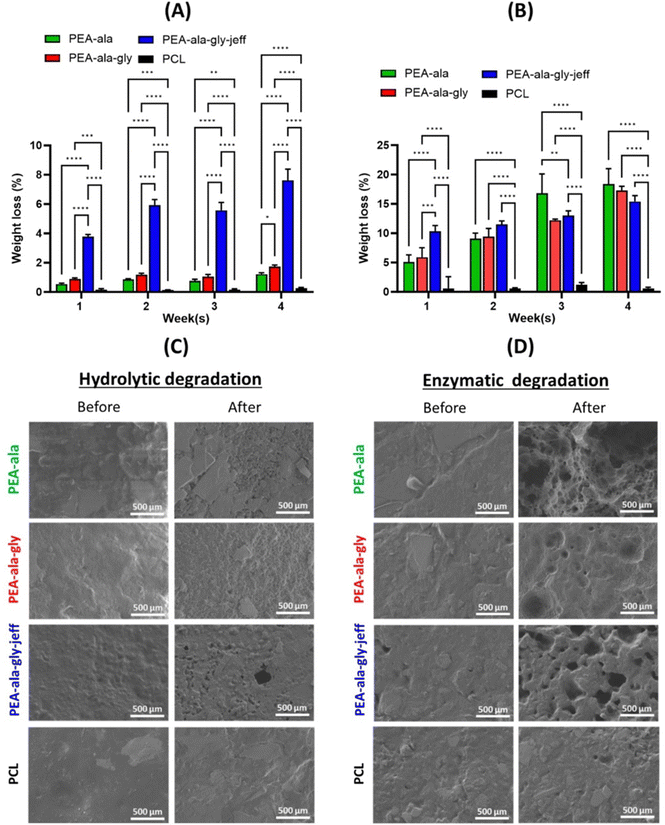
Weight loss of polymeric films in PBS (pH = 7.4) containing α-chymotrypsin is depicted in Fig. 8(B). In the presence of α-chymotrypsin, an enzyme usually involved in the inflammatory process of damaged tissues,47 all AAA-PEAs show a gradual increase in weight loss over time with no statistical differences between the different formulations except for week 1. Compared to hydrolytic degradation, the weight loss of AAA-PEAs films in week 1 is accelerated under enzymatic conditions (15–18%), with PEA-ala–gly–jeff presenting the highest value (ca. 10.3%) followed PEA-ala–gly (ca. 5.9%) and PEA-ala (ca. 5.1%). In a first stage (week 1), the more hydrophilic nature of PEA-ala–gly–jeff seems to favour its interaction with the enzymatic solution, accelerating its degradation compared to other AAA-PEAs. But as time progresses this trend is inverted and the differences completely attenuated by week 4. In turn, degradation kinetics of PCL films does not seem to be affected by the presence of the enzyme, displaying a profile similar to the hydrolytic one above. This phenomenon can be justified by the substrate specificity of the chosen enzyme (i.e. α-chymotrypsin) a protease that preferentially cleaves peptide amide bonds, present in the chemical structure of AAA-PEAs but not in PCL.
The surface morphology of the AAA-PEA and PCL films before and after in vitro hydrolytic and enzymatic degradation was analysed by SEM. Micrographs reported in Fig. 8(C) and (D) show a slight increase in surface roughness for all AAA-PEAs films after 4 weeks of incubation, suggesting their hydrolytic degradation via surface erosion. This effect is more evident in AAA-PEAs films containing jeff, likely due to their higher hydrophilicity. No significant surface alterations were detected in PCL films independently of the degradation media.
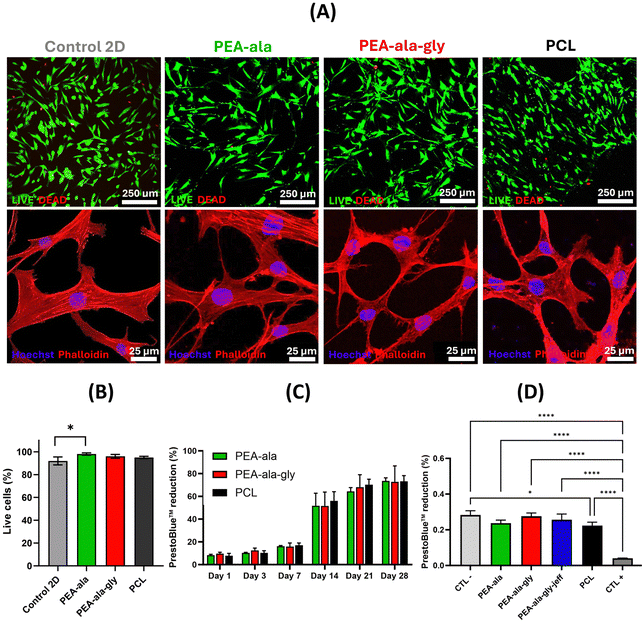
Unfortunately, we were not able to detect the presence of cells on the surface of PEA-ala–gly–jeff films. This may have been caused by the pronounced changes in its surface features (see Fig. 8) compared to PEA-ala and PEA-ala–gly, resulting in cell detachment and subsequent loss during the washing phases required for the preparation of the films for biological tests.
Results obtained from direct contact test (Fig. 9(C)) showed an increased metabolic activity of hBM-MSCs over a period of 28 days, with comparable percentages of PrestoBlue™ reduction between AAA-PEA and PCL films. Through indirect contact it was not possible to detect significant differences in metabolic activity between cells seeded on PEA-ala–gly–jeff, PCL and other AAA-PEAs films, suggesting the absence of any cytotoxic compounds released from the films (Fig. 9(D)). These results agree with cell viability data and further confirm the suitability of all AAA-PEAs films to support the function of hBM-MSCs.
3.3 Fabrication and characterization of AAA-PEA scaffolds
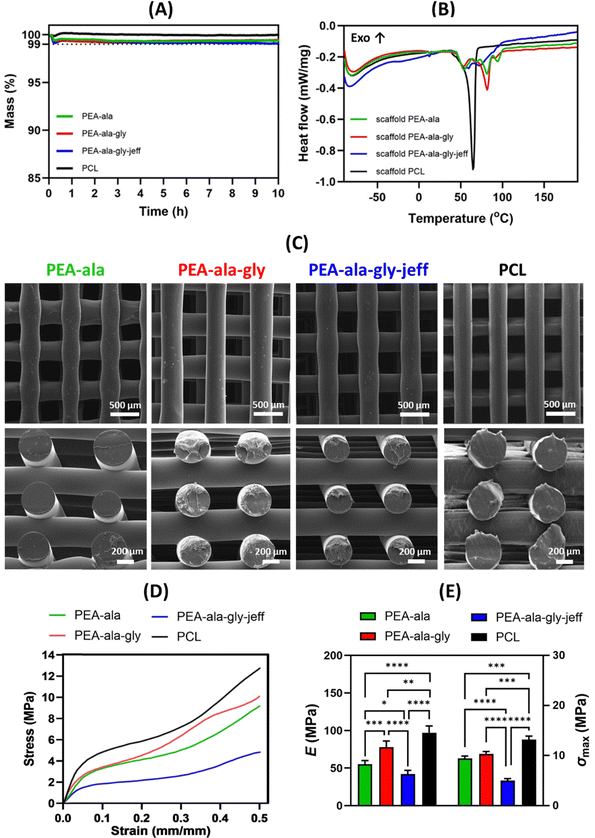
To evaluate whether the printing process induced changes in the materials’ thermal properties, a DSC analysis was performed on the fabricated scaffolds. The heat flow curve from the first heating run is presented in Fig. 10(B). The melting temperatures of the AAA-PEA scaffolds fall within the same range as those of the pristine materials before processing (50–100 °C, as shown in Section 3.1.2). In the case of the scaffolds, the melting peaks are better defined compared to the AAA-PEAs (Fig. 5), indicating a more organized crystalline structure.
The ΔH of the melting transition was determined for the scaffolds and compared to that of the AAA-PEAs after synthesis and purification (Table S8, ESI†). The values are very similar, indicating that the crystallinity of the scaffolds and pristine AAA-PEAs does not differ significantly. Similarly, for PCL, the melting temperature of the printed scaffold is comparable to that of unprocessed PCL, confirming that no significant thermal changes occurred as a result of melt-extrusion processing.
The values of compressive modulus and maximum stress for PCL scaffolds were 97 ± 9 MPa and 13.2 ± 0.7 MPa, respectively. However, the values for PEA-ala (55 ± 5 MPa and 9.4 ± 0.5 MPa), PEA-ala–gly (78 ± 8 MPa and 10.3 ± 0.5 MPa), and PEA-ala–gly-jeff scaffolds (42 ± 5 MPa and 5.0 ± 0.4 MPa) were significantly lower than those obtained for PCL scaffolds. In terms of compressive modulus and maximum stress, the observed differences were statistically significant. It is worth noting that the lowest value of the compressive modulus was found for PEA-ala–gly-jeff. This is likely to be related with the presence of ether linkages in its structure, causing an increase in the flexibility of the chains. The difference between the compressive Young's modulus of PEA-ala and PEA-ala–gly scaffolds, may be related to the presence of glycine, which is an α-amino acid with a smaller lateral group than L-alanine, which can allow a greater packing of the chains, increasing the rigidity of the chains, and consequently the rigidity of the scaffold. The results from the compression tests showed that it is possible to change the mechanical behaviour of the 3D printed scaffolds, by changing the composition of AAA-PEAs.
Control of the process–structure–property relationship of a material plays a pivotal role in designing and developing 3D scaffolds with desired mechanical, biological, and functional properties. While this was outside the scope of the present work, it has been reported in detail in some of our previous studies.17,18,25,29,48 In those studies, we demonstrated the role of material composition and material-design combinations, particularly the effects of pore size and geometry (and consequently porosity), on the compressive mechanical performance and in vitro cell behavior through a systematic analysis of 3D scaffolds fabricated via extrusion-based additive manufacturing. The findings were supported by morphological analyses using SEM, micro-CT, and confocal laser scanning microscopy, which provided additional insights into the effects on functional features and cell morphology.
4. Conclusions
This study reports the synthesis and characterization of a new library of high molecular weight AAA-PEAs with tuneable physical, chemical and mechanical properties for scaffold-guided tissue regeneration. Despite their amorphous nature, AAA-PEAs demonstrated good thermal stability and suitable rheological properties for extrusion-based printing of 3D scaffolds with good shape fidelity and reproducibility. Changes in the chemical structure of the AAA-PEAs enabled the fabrication of 2D and 3D substrates with higher wettability, lower stiffness and faster degradation rates compared to PCL. However, these features did not seem to affect the behaviour of hBM-MSCs, which displayed similar levels of viability and metabolic activity independently of the substrate material. In summary, our study contributes to expand the range of processable materials via 3D printing and hints at the possibility of manipulating the structure of the AAA-PEAs to adjust the properties of engineered scaffolds to those of different tissues in the human body.Abbreviations
| 2D | Two-dimensional |
| 3D | Three-dimensional |
| AAA-PEAs | α-Amino acids based poly(ester amide)s |
| AM | Additive manufacturing |
| BAAD | Bis-α-(L-amino acid)-α,ω-alkylene diester |
| CDCl3 | Deuterated chloroform |
| DMF | N,N-Dimethylformamide |
| DMSO | Dimethyl sulfoxide |
| DMSO-d6 | Deuterated dimethy lsulfoxide |
| DMTA | Dynamic mechanical thermal analysis |
| DSC | Differential scanning calorimetry |
| FTIR | Fourier transform infrared spectroscopy |
| hBM-MSC | Human bone marrow mesenchymal stem cells |
| Jeff | Jeffamine |
| micro-CT | Micro-computed tomography |
| NHS | N-Hydroxysuccinimide |
| NMR | Nuclear magnetic resonance |
| PBS | Phosphate buffered saline |
| PCL | Poly(ε-caprolactone) |
| PEA | Poly(ester amide) |
| PEA-ala | L-Alanine based PEA |
| PEA-ala–gly | L-Alanine and glycine based PEA |
| PEA-ala–gly-jeff | L-Alanine, glycine and jeffamine based PEA |
| PLA | Poly(L-lactic acid) |
| PLGA | Poly(D,L-lactic-co-glycolic acid) |
| p-TSA | p-toluenesulfonic acid monohydrate |
| SE | Standard deviation of the mean |
| SEM | Scanning electronic microscopy |
| TE | Tissue engineering |
| TEA | Triethylamine |
| T g | Glass transition temperature |
| TGA | Thermogravimetric analysis |
| TIPS | Thermally induced phase separation |
| WCA | Water contact angle |
Author contributions
Patricia dos Santos: writing – original draft, visualization, software, methodology, investigation, formal analysis, data curation, conceptualization. Beatriz Alves: software, methodology, investigation, formal analysis. Sara Inocêncio: visualization, methodology, investigation, formal analysis. Pedro Nunes: visualization, methodology, investigation, formal analysis. Stephen M. Richardson: writing – review & editing, visualization, methodology, investigation, resources. Antonio Gloria: writing – review & editing, visualization, methodology, investigation, formal analysis. Arménio Serra: writing – review & editing, supervision, methodology, investigation, formal analysis. Ana Fonseca: writing – review & editing, validation, supervision, resources, project administration, methodology, investigation, funding acquisition, formal analysis, data curation, conceptualization. Marco Domingos: writing – review & editing, validation, supervision, resources, project administration, methodology, investigation, funding acquisition, formal analysis, data curation, conceptualization.Data availability
Data will be made available on reasonable request to the corresponding authors.Conflicts of interest
The authors declare that they have no known competing financial interests or personal relationships that could have appeared to influence the work reported in this paper.Acknowledgements
Funding for Patricia dos Santos studentship was received from the Portuguese National Science Foundation through the FCT scholarship 2021.05900.BD. The authors would also like to thank the Henry Royce Institute EPSRC grants EP/R00661X/1, EP/S019367/1, EP/P025021/1 and EP/P025498/1. NMR data was obtained at the Nuclear Magnetic Resonance Laboratory of the Coimbra Chemistry Centre, facility which is supported in part by FEDER – European Regional Development Fund through the COMPETE Programme (Operational Programme for Competitiveness) and by National Funds through FCT through grants REEQ/481/QUI/2006, RECI/QEQ-QFI/0168/2012, CENTRO-07-CT62-FEDER-002012, and Rede Nacional de Ressonância Magnética Nuclear (RNRMN). This research is sponsored by FEDER funds through the program COMPETE – Programa Operacional Factores de Competitividade – and by national funds through FCT under the project UID/EMS/00285/2020 and LA/P/0112/2020. The authors would like to thank Dr Jen Adcott, Dr Pauline Baird and Dr Miley Li from the University of Manchester for the technical support provided during 3D printing, cell culture and bioimaging activities.References
- H. S. Kim, S. G. Kumbar and S. P. Nukavarapu, Curr. Opin. Biomed. Eng., 2021, 17, 100260 CrossRef CAS PubMed.
- A. C. Fonseca, F. P. W. Melchels, M. J. S. Ferreira, S. R. Moxon, G. Potjewyd, T. R. Dargaville, S. J. Kimber and M. Domingos, Chem. Rev., 2020, 120, 11093–11139 CrossRef CAS PubMed.
- M. Vahidi, A. S. Rizkalla and K. Mequanint, Adv. Healthcare Mater., 2024, 13, e2401218 CrossRef PubMed.
- S. Wang, S. Hashemi, S. Stratton and T. L. Arinzeh, Adv. Healthcare Mater., 2021, 10, e2001244 CrossRef PubMed.
- J. Chi, M. Wang, J. Chen, L. Hu, Z. Chen, L. J. Backman and W. Zhang, Biomimetics, 2022, 7, 131 CrossRef CAS PubMed.
- M. Krishani, W. Y. Shin, H. Suhaimi and N. S. Sambudi, Gels, 2023, 9, 100 CrossRef CAS PubMed.
- I. M. Adel, M. F. ElMeligy and N. A. Elkasabgy, Pharmaceutics, 2022, 14, 306 CrossRef CAS PubMed.
- A. Kumar and A. Jacob, J. Appl. Biol. Biotechnol., 2022, 10, 163–176 CrossRef CAS.
- G. H. Wu and S. H. Hsu, J. Med. Biol. Eng., 2015, 35, 285–292 CrossRef PubMed.
- L. G. Bracaglia, B. T. Smith, E. Watson, N. Arumugasaamy, A. G. Mikos and J. P. Fisher, Acta Biomater., 2017, 56, 3–13 CrossRef CAS PubMed.
- J. K. Placone and A. J. Engler, Adv. Healthcare Mater., 2018, 7, e1701161 CrossRef PubMed.
- S. Tian, H. Zhao and N. Lewinski, Bioprinting, 2021, 23, e00156 CrossRef.
- T. T. Brink, F. Damanik, J. I. Rotmans and L. Moroni, Adv. Healthcare Mater., 2024, 13, e2301939 CrossRef PubMed.
- S. Vach Agocsova, M. Culenova, I. Birova, L. Omanikova, B. Moncmanova, L. Danisovic, S. Ziaran, D. Bakos and P. Alexy, Materials, 2023, 16, 4267 CrossRef CAS PubMed.
- S. Castañeda-Rodríguez, M. González-Torres, R. M. Ribas-Aparicio, M. L. Del Prado-Audelo, G. Leyva-Gómez, E. S. Gürer, J. Sharifi-Rad, S. Castañeda-Rodríguez, M. González-Torres, R. M. Ribas-Aparicio, M. L. Del Prado-Audelo, G. Leyva-Gómez, E. S. Gürer and J. Sharifi-Rad, J. Biol. Eng., 2023, 17, 21 CrossRef PubMed.
- M. Domingos, F. Intranuovo, A. Gloria, R. Gristina, L. Ambrosio, P. J. Bartolo and P. Favia, Acta Biomater., 2013, 9, 5997–6005 CrossRef CAS PubMed.
- M. Domingos, A. Gloria, J. Coelho, P. Bartolo and J. Ciurana, Proc. Inst. Mech. Eng., Part H, 2017, 231, 555–564 CrossRef PubMed.
- S. Cometa, M. A. Bonifacio, E. Tranquillo, A. Gloria, M. Domingos and E. De Giglio, Polymers, 2021, 13, 150 CrossRef CAS PubMed.
- H. Wang, M. Domingos and F. Scenini, Rapid Prototyp. J., 2018, 24, 731–738 CrossRef.
- A. C. Fonseca, M. H. Gil and P. N. Simões, Prog. Polym. Sci., 2014, 39, 1291–1311 CrossRef CAS.
- K. Ghosal, M. S. Latha and S. Thomas, Eur. Polym. J., 2014, 60, 58–68 CrossRef CAS.
- A. Rodriguez-Galan, L. Franco, J. Puiggali, A. Rodriguez-Galan, L. Franco and J. Puiggali, Polymers, 2010, 3, 65–99 CrossRef.
- S. R. Moxon, M. J. S. Ferreira, P. d Santos, B. Popa, A. Gloria, R. Katsarava, D. Tugushi, A. C. Serra, N. M. Hooper, S. J. Kimber, A. C. Fonseca, M. A. N. Domingos, S. R. Moxon, M. J. S. Ferreira, P. d Santos, B. Popa, A. Gloria, R. Katsarava, D. Tugushi, A. C. Serra, N. M. Hooper, S. J. Kimber, A. C. Fonseca and M. A. N. Domingos, Polymers, 2020, 12, 1478 CrossRef CAS PubMed.
- V. Ansari, A. Calore, J. Zonderland, J. A. W. Harings, L. Moroni and K. V. Bernaerts, Biomacromolecules, 2022, 23, 1083–1100 CrossRef CAS PubMed.
- A. Gloria, B. Frydman, M. L. Lamas, A. C. Serra, M. Martorelli, J. F. J. Coelho, A. C. Fonseca and M. Domingos, Mater. Sci. Eng., C, 2019, 98, 994–1004 CrossRef CAS PubMed.
- E. Chkhaidze, D. Tugushi, D. Kharadze, Z. Gomurashvili, C.-C. Chu and R. Katsarava, J. Macromol. Sci., Part A: Pure Appl. Chem., 2011, 48, 7064–7123 Search PubMed.
- G. Tsitlanadze, T. Kviria, R. Katsarava and C. C. Chu, J. Mater. Sci.: Mater. Med., 2004, 15, 185–190 CrossRef CAS PubMed.
- S. Strassburg, S. M. Richardson, A. J. Freemont and J. A. Hoyland, Regener. Med., 2010, 5, 701–711 CrossRef CAS PubMed.
- M. Domingos, F. Intranuovo, T. Russo, R. D. Santis, A. Gloria, L. Ambrosio, J. Ciurana and P. Bartolo, Biofabrication, 2013, 5, 045004 CrossRef CAS PubMed.
- V. Andrés-Guerrero, M. Zong, E. Ramsay, B. Rojas, S. Sarkhel, B. Gallego, R. d Hoz, A. I. Ramírez, J. J. Salazar, A. Triviño, J. M. Ramírez, E. M. d Amo, N. Cameron, B. de-las-Heras, A. Urtti, G. Mihov, A. Dias and R. Herrero-Vanrell, J. Controlled Release, 2015, 211, 105–117 CrossRef PubMed.
- H. Sun, R. Cheng, C. Deng, F. Meng, A. A. Dias, M. Hendriks, J. Feijen and Z. Zhong, Biomacromolecules, 2015, 16, 597–605 CrossRef CAS PubMed.
- C. Boyer, J. Liu, L. Wong, M. Tippett, V. Bulmus and T. P. Davis, J. Polym. Sci., Part A: Polym. Chem., 2008, 46, 7207–7224 CrossRef CAS.
- Y. Fan, M. Kobayashi and H. Kise, J. Polym. Sci., Part A: Polym. Chem., 2001, 39, 1318–1328 CrossRef CAS.
- M. Deng, J. Wu, C. A. Reinhart-King and C.-C. Chu, Biomacromolecules, 2009, 10, 3037–3047 CrossRef CAS PubMed.
- P. Ranganathan, C.-W. Chen, S.-P. Rwei, Y.-H. Lee and S. K. Ramaraj, Polym. Degrad. Stab., 2020, 181, 109323 CrossRef CAS.
- A. Soleimani, S. Drappel, R. Carlini, A. Goredema and E. R. Gillies, Ind. Eng. Chem. Res., 2014, 53, 1452–1460 CrossRef CAS.
- M. L. Lamas, M. S. Lima, A. C. Pinho, D. Tugushi, R. Katsarava, E. C. Costa, I. J. Correia, A. C. Serra, J. F. J. Coelho and A. C. Fonseca, Polymer, 2018, 150, 343–359 CrossRef CAS.
- A. Galarza Torre, J. E. Shaw, A. Wood, H. T. J. Gilbert, O. Dobre, P. Genever, K. Brennan, S. M. Richardson, J. Swift, A. Galarza Torre, J. E. Shaw, A. Wood, H. T. J. Gilbert, O. Dobre, P. Genever, K. Brennan, S. M. Richardson and J. Swift, Sci. Rep., 2018, 8, 8981 CrossRef PubMed.
- S. Cho, J. Irianto and D. E. Discher, J. Cell Biol., 2017, 216, 305–315 CrossRef CAS PubMed.
- A. Athirasala, N. Hirsch and A. Buxboim, Curr. Opin. Cell Biol., 2017, 46, 119–127 CrossRef CAS PubMed.
- B. D. Matthews, C. K. Thodeti, J. D. Tytell, A. Mammoto, D. R. Overby and D. E. Ingber, Integr. Biol., 2010, 2, 435–442 CrossRef CAS PubMed.
- Y. Lu, D. Cheng, B. Niu, X. Wang, X. Wu and A. Wang, Pharmaceuticals, 2023, 16, 454 CrossRef CAS PubMed.
- L. Bacakova, E. Filova, M. Parizek, T. Ruml and V. Svorcik, Biotechnol. Adv., 2011, 29, 739–767 CrossRef CAS PubMed.
- W. Xie, X. Wei, H. Kang, H. Jiang, Z. Chu, Y. Lin, Y. Hou and Q. Wei, Adv. Sci., 2023, 10, 2204594 CrossRef CAS PubMed.
- Q. Wei, S. Wang, F. Han, H. Wang, W. Zhang, Q. Yu, C. Liu, L. Ding, J. Wang, L. Yu, C. Zhu and B. Li, Biomater. Transl. Med., 2021, 2, 323–342 Search PubMed.
- S. Nellinger and P. J. Kluger, Int. J. Mol. Sci., 2023, 24, 3551 CrossRef CAS PubMed.
- D. Shah, K. Mital, D. Shah and K. Mital, Adv. Ther., 2017, 35, 31–42 CrossRef PubMed.
- J. Ferreira, A. Gloria, S. Cometa, J. F. Coelho and M. Domingos, J. Appl. Biomater. Biomech., 2017, 15, 185–195 Search PubMed.
Footnotes |
| † Electronic supplementary information (ESI) available. See DOI: https://doi.org/10.1039/d4tb02220c |
| ‡ These authors contributed equally as last authors. |
| This journal is © The Royal Society of Chemistry 2025 |

