DOI:
10.1039/D5TB00794A
(Paper)
J. Mater. Chem. B, 2025,
13, 8705-8714
Design of a nonlinear metastructure for temperature detection and biosensing based on the second harmonic generation in theory†
Received
7th April 2025
, Accepted 12th May 2025
First published on 13th May 2025
Abstract
When the second harmonic generation (SHG) occurs in temperature-controlled ferroelectric crystals, it serves as an effective method for detecting temperature and changes in the refractive index (RI). A one-dimensional nonlinear metastructure (NM) composed of periodically poled lithium niobate crystals is designed precisely to exhibit significant SHG enhancement in the visible to near-infrared spectral range. When a tunable fundamental electromagnetic wave is incident at a frequency (f) near 241.067 THz, the NM achieves frequency conversion and enables wide-range temperature detection (25–105 °C) at the second harmonic wave (SHW) scale 2f with a sensitivity of S = 0.32% per °C. By altering the filling material of the sample layer, it is possible to distinguish between three types of healthy or cancerous liver tissues using RI biosensing with a fundamental wave around 273 THz. The sensing range is from 1.3463 to 1.3655, with an S value of 14.75 THz per RIU. The proposed NM integrates the SHW effect with optical detection and sensing, offering new insights for SHW applications and biomedical fields.
1. Introduction
SHG is a key nonlinear effect,1–3 where a fundamental electromagnetic wave (FW)4 interacts with a NM, typically a ferroelectric crystal, generating second or higher-order polarizations and emitting second or third harmonics.5 The spontaneous polarization of ferroelectric crystals allows phase matching of SHW by precisely designing the NM.6,7 Phase compensation is achieved by introducing periodic polarization reversals in the NM. A novel quasi-phase matching (QPM) condition,8,9 derived numerically to account for strong electromagnetic wave scattering, differs from traditional analytical approaches.10 It is typically applied to ferroelectric crystals like lithium niobate and lithium tantalate crystals (LNC),11 which feature spontaneous polarization and high second-order nonlinear coefficients (χ2 = 47 pm V−1).12 The output intensity of SHW depends on materials with high nonlinear coefficients and strong incident light intensity. Luo et al.13 reported achieving a nonlinear conversion efficiency of 4.7% W−1 by utilizing strong thermo-optic birefringence in an 8 mm LNC nanophotonic waveguide. Recently, Chen et al.14 further experimentally fabricated a periodically poled LNC and achieved an average SHW output intensity of nearly 40% W−1 over a wide range of 0.9 nm to 1.5 nm using a FW optical intensity of 0.5 GW cm−2 based on the QPM method. A NM can strongly enhance the local electromagnetic field, enabling small variations in temperature or refractive index to induce significant changes in the field distribution. This effect greatly improves sensing sensitivity and offers clear benefits for high-precision sensor applications.15
Jundt et al.16 further extended the Sellmeier equation16 applicable to LNC materials equation to encompass wavelengths ranging from 0.4 nm to 5.2 μm, elucidating the impact of temperature variations (25–250 °C) on the LNC's dispersion characteristics. The broad temperature-dependent dispersion properties render LNC particularly promising for temperature-sensing applications.17 As global climate change becomes increasingly severe, temperature monitoring finds widespread applications in ecological environmental protection, electronic device cooling, high-temperature industries, heat treatment, and other fields.18 Bartnick et al.19 demonstrated the SHW effect in fiber-coupled, periodically poled titanium-diffused LNC waveguides, operating from 4.4 K to room temperature, by combining nonlinear optics with cryogenically working components. They also refined the Sellmeier equation over this temperature range. Consequently, the study of the temperature dependence of SHW in LNC has become well-established. As the modulation of SHW output intensity matures, its high sensitivity to physical quantities gradually reveals its significant research15 value in the fields of optical detection and sensing.
Cancer cell detection based on refractive index (RI) differences has gained significant attention.20 Since cancer cells, typically micrometer-sized, cannot be directly integrated into the nanosensing layer of NM, distinguishing them from normal cells via cytoplasmic RI is a practical alternative.21 Cytoplasm extraction and RI measurement can be performed using standard centrifugation and vacuum pipetting techniques.22 Sui et al.23 detected RI variations in three cancer cell types using the photonic spin Hall effect, while Sharma et al.24 proposed a fiber laser for RI biosensing of liver tissues. However, these methods face challenges, such as low sensitivity and neglect of dispersion, highlighting the urgent need for devices with broader detection ranges and higher sensitivity.
This letter introduces a novel NM constructed using a layered topology of LNC, serving dual functions in temperature monitoring and biosensing. The implementation of photonic band gap (PBG)2 boundary conditions allows the FW to exhibit extremely high density of states and strong electric field modes within the layered structure, which are key to enhancing the output intensity of SHW. Equipped with dual detection functions, the NM's performance is detailed in Table 1. Notably, variations in environmental temperature alter the dispersion curve of LNC when the sample layer is filled with air, resulting in continuous shifting of the SHW function and facilitating wide-range temperature monitoring from 25 °C to 105 °C. At a constant ambient temperature of 25 °C, the NM can detect and differentiate between three states of liver tissue: non-cancerous (N), primary liver tumor (HCC), and metastatic (MET). The refractive index ranges from 1.3463 to 1.3655 on the FW scale. How to fabricate it can be seen Section 1 of the ESI,† and innovative design combines second harmonic generation with optical detection, highlighting the NM's significant potential across the visible to near-infrared spectral range.
Table 1 The performance of the given NM
|
|
Temperature detecting |
Biosensing |
| Range |
25–105 °C |
1.3463–1.3655 |
|
S
|
0.32% per °C |
14.75 THz per RIU |
2. Design and discussion
2.1. Theoretical model
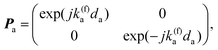
As shown in Fig. 1, arrows pointing in opposite directions indicate the change in the polarization direction over the period. The proposed NM structure comprises alternating layers of air (C) and LNC (A and B) with opposite polarization orientations, with the analysis layer (T) inserted between them. The ambient temperature is maintained at 25 °C when temperature measurements are not being conducted. As both the air layers and the analysis layer are filled with air, their RI is set to 1 (nc = nt = 1), and their second-order nonlinear coefficients (χc = χt = 0). Considering the opposite polarization orientations, the nonlinear coefficients of layers A and B are denoted as χa = −χb = 47 pm V−1.12 Layers A and B have identical RI and follow the thermally tunable LNC dispersion formula proposed by Jundt et al.:16| |  | (1) |
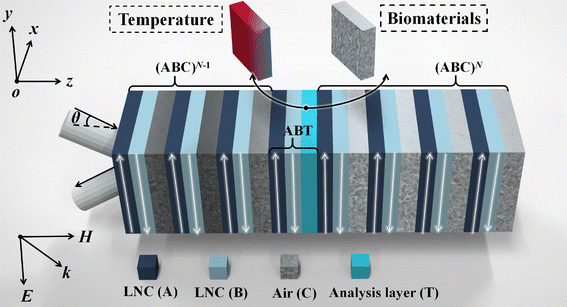 |
| | Fig. 1 Topological diagram of the NM layered structure. Dielectrics filled with different colors represent the overall structure, denoted as (ABC)N−1ABT(ABC)N, where N signifies the period. The thicknesses of dielectrics A, B, T, and C are respectively designated as da = db = dt = 3.4 μm, θ = 0°, and dc = 3.9 μm. | |
In this context, f = (Tl − T0) (Tl + T0 + 546.32), where a1 to a6 and b1 to b4 represent specific numerical values referenced from the literature,16 with the reference temperature T0 set at 24.5 °C. The RI of LNC is temperature dependent. The symbol λ denotes the wavelength of the incident wave, and under the influence of the dispersion formula, it can be deduced that the RI of LNC is not the same under the FW and SHW (nf is not equal to ns). This contrasts with the RI of the C and T layers, which remain unaffected by the wavelength of the incident wave. The generation of the SHW within the NM encompasses three distinct processes. Initially, the FW impinges normally on the NM structure, exhibiting an amplitude distribution within each layer of the medium. Subsequently, nonlinear interactions between the FW and the LNC crystal result in SHW generation. Finally, the SHW propagates through the structure and exits the NM as SHW. To address this challenge, determining the electric field magnitude distribution Eif of the FW within the NM layers is crucial, alongside quantifying the transmitted and reflected electric field magnitudes.
In this letter, as the SHW calculation is based on the transfer matrix method,12 validated expressions EsT and Es0 are used to represent the output and reflected electric field intensities of the SHW, respectively. Here, we provide a detailed description. It should be clarified that the generation of the SHW involves three steps: The FW is incident on the NM, establishing a specific electric field distribution within the structure, which causes the medium to polarize and generate macroscopic polarization. The second-order nonlinear polarization Pnl,14 induced by the nonlinear medium, radiates the SHW field. The SHW is generated within the medium and is emitted as an SHW signal from the medium.
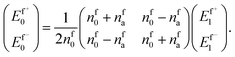
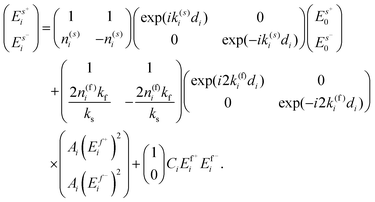
The first step is to determine the electric field amplitude distribution of the FW in the medium. Taking the transition from the air layer to medium layer A as an example, let the FW propagate along the Z-axis. By using the continuity conditions of the E-field and H-field at the boundary, the relationship of the E-field amplitude between the air medium and medium layer A can be derived:3,9
| |  | (2) |
In eqn (2), Ef0 represents the initial incident electric field, and Ef1 represents the electric field in the first layer of the medium (Layer A). The “+” and “−” signs indicate the transmission and reflection of the electromagnetic wave, respectively. nf0 and nfa denote the refractive indices of the air layer and Layer A medium in the FW state, respectively. For simplification, the following expressions are defined:
therefore,
eqn (2) can be rewritten as
| |  | (3) |
Eqn (3) takes into account the changes at the boundary of the two media. Additionally, the phase and amplitude changes caused by the propagation of the FW through the thickness da of the uniform layer A need to be included as follows:
| |  | (4) |
where,
kfa is the wave vector in Layer A for the FW. Specifically,
k(f)i =
n(f)ikf,
kf =
ω/
c,
c is the speed of light in a vacuum,
ω is the frequency of the FW, and
da is the thickness of Layer A. Now, extending the above expressions to describe the propagation of electromagnetic waves throughout the entire structure and expanding
eqn (4) to layers B, C, T, and 0, the definitions are as follows:
| |  | (5) |
| |  | (6) |
where
i = 0, a, b, c, t represents the respective layers of the medium: air background, layers A, B, C, and the T layer. Starting with a simple approach, let's first understand the propagation of the FW within the first ABC period:
| |  | (7) |
In eqn (7), Ef4 represents the amplitude of the FW after one period, reaching the second period. Further expanding this to the entire NM structure, we obtain the propagation matrix for the FW across the entire structure as follows:
| |  | (8) |
Define,
Mf =
DcPcDc−1DbPbDb−1![[thin space (1/6-em)]](https://www.rsc.org/images/entities/char_2009.gif) DaPaDa−1
DaPaDa−1, the overall matrix can be represented as
| |  | (9) |
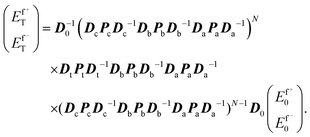
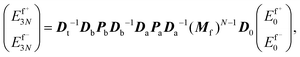
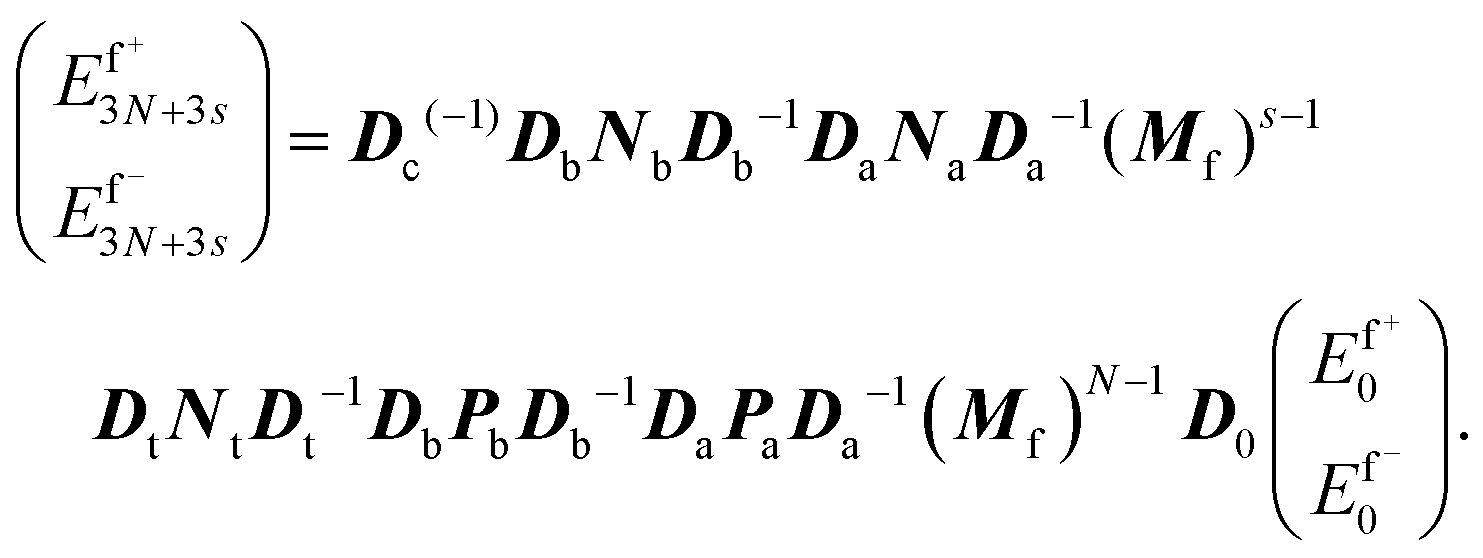
In eqn (9), EfT represents the amplitude of the FW after traversing the entire structure. Tf is the total structure matrix. Given the FW total matrix Tf, reflection and transmission coefficients can be determined by solving for them. Considering a total of 6N layers of dielectric, the amplitude representation of the electric field for each layer under FW is as follows:
| |  | (10a) |
| |  | (10b) |
| |  | (10c) |
| |  | (10d) |
| |  | (10e) |
| |  | (10f) |
| |  | (10g) |
| |  | (10h) |
| |  | (10i) |
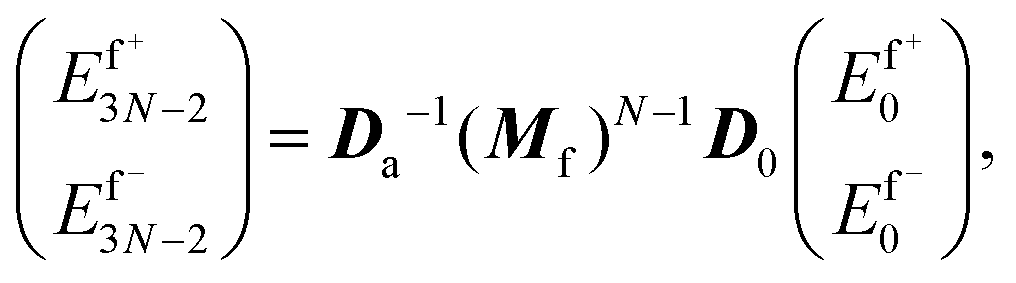
In the equations above, eqn (10a)–(10c) represent the formulas for solving the electric field of the first (ABC)N−1, totaling 3N − 3 layers of medium, where s = 1, 2, 3, …, N − 1. Eqn (10d)–(10f) represent the electric field in the three layers of medium (ABT) at the center of the NM. Finally, eqn (10g)–(10i) provide the formulas for the electric field amplitude of the last (ABC)N, totaling 3N layers of medium, where s = 1, 2, 3, …, N.
For instance, when the structure period is N, the term eqn (10f) represents the FW electric field distribution of the layer to be measured (T-layer) in the 3N-th layer, which is related to the transmission matrix of the FW electric field from the incident FW in layer 0.
Now, onto the second step: the computation of SHW generation. In the previous section, the field distribution of the FW within the NM was obtained. This implies that the SHWs generated from the nonlinear interaction between the FW and each layer of the medium are independent. The objective is to calculate the specific numerical values of the SHW electric field generated by each individual layer. Specifically, similar to the FW, the propagation equation for SHWs within the structure is as follows:
| |  | (11) |
here, it differs from
eqn (9) in that there are no
E−T and
E+0 terms, and they equal 0. This can be easily explained: a SHW does not have an incident wave. It is excited from the FW and generated within the NM, propagating towards both ends.
Ts determines the free-wave regulation of SHW propagation within the NM. Another difference from
eqn (9) is the additional term (
GG1,
GG2,
GG3). This is because, in
eqn (9), the initial amplitude of FW
E+0 is adjustable and determined by the incident laser. However, here SHW is excited by FW, and its initial value is determined by multiple factors, including the distribution of FW field within the medium, the second-order nonlinearities of the medium, and the interference caused by FW continuously reflecting within the NM, as well as the mutual cancellation between FW transmission and reflection. It serves as a crucial link in establishing the relationship between SHW and FW. The main objective of the study is to determine its expression.
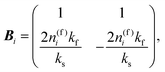
Firstly, Ts is determined using the same method as for the transmission matrix of FW, with the only difference being the change in refractive index of the material in the SHW segment. This is achieved by considering the continuity conditions at the boundary and the changes in amplitude and phase as the wave propagates through the uniform medium. It is defined as follows:
| |  | (12) |
| |  | (13) |
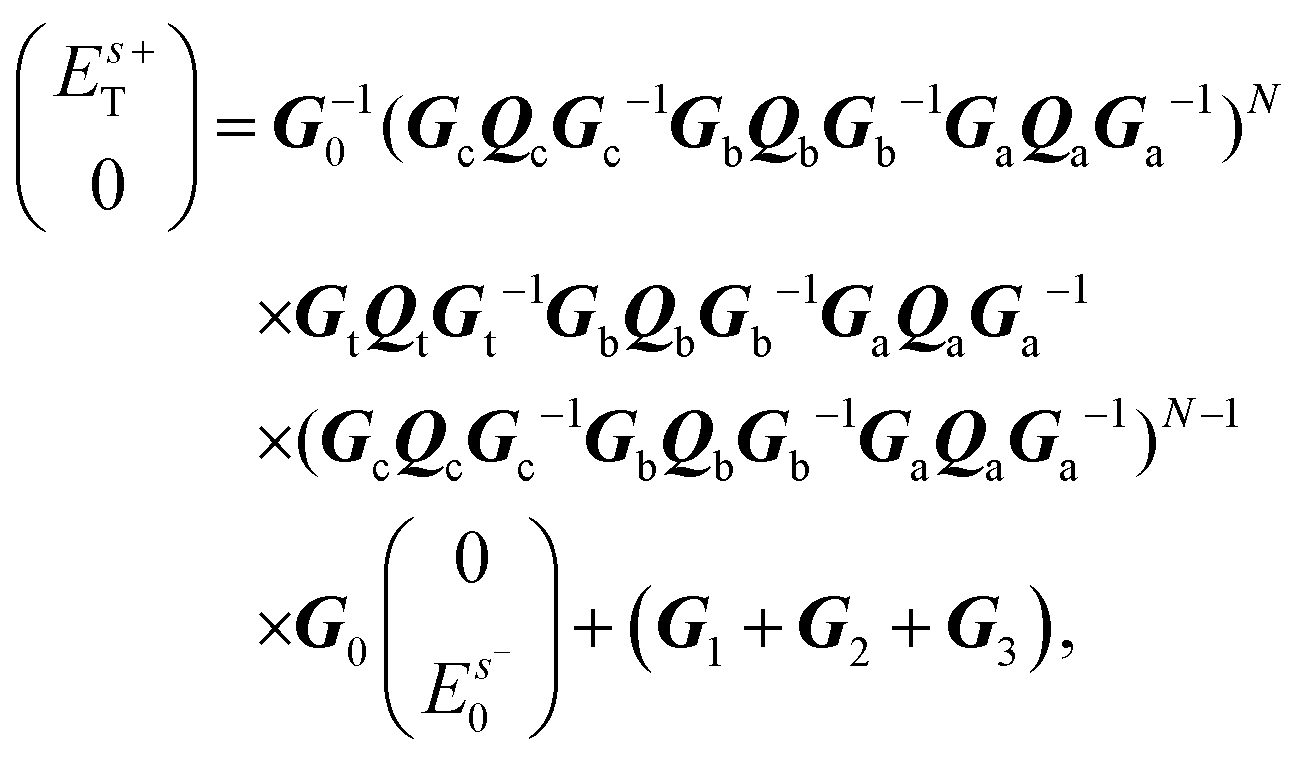
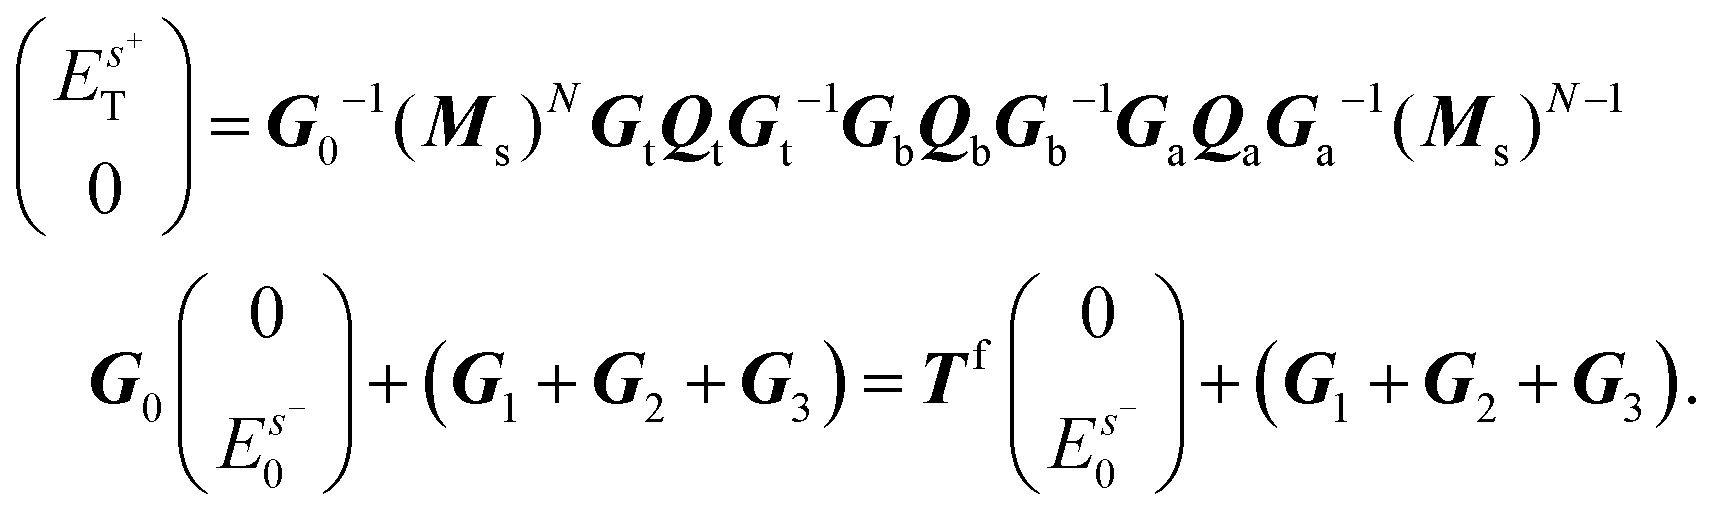
Similarly, nsi represents the refractive indices of various media at the second harmonic frequency. The wave vectors in each layer of the medium are defined as k(s)i = n(s)iks, where ks = 2ω/c, c is the speed of light in a vacuum, 2ω is the second harmonic frequency. As with the FW, we will not delve into the specifics of individual periods but directly extend to the entire NM structure to obtain the total SHW matrix:
| |  | (14) |
define,
Ms =
GcQcGc−1GbQbGb−1GaQaGa−1, the overall matrix can be represented as
| |  | (15) |
The representation of the free-wave amplitude of SHW within NM is completed. Now, we need to determine the confined wave amplitudes of SHW fields just generated by forward and backward FW in each layer, and the interference of SHW fields between forward and backward FW. Let's start with a single-layer medium as an example. Firstly, we need to determine the solution of the SHW field propagation equation, retaining all second-order spatial derivatives, and ensuring that the results are not influenced by the usual slow amplitude approximation:3
| | 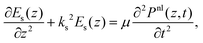 | (16) |
where
Pnl is the nonlinear polarization induced by FW within a single layer, directly related to the FW electric field:
| | | Pinl(z,t) = ε0χis[Efi(z)]2exp(−i2ωt). | (17) |
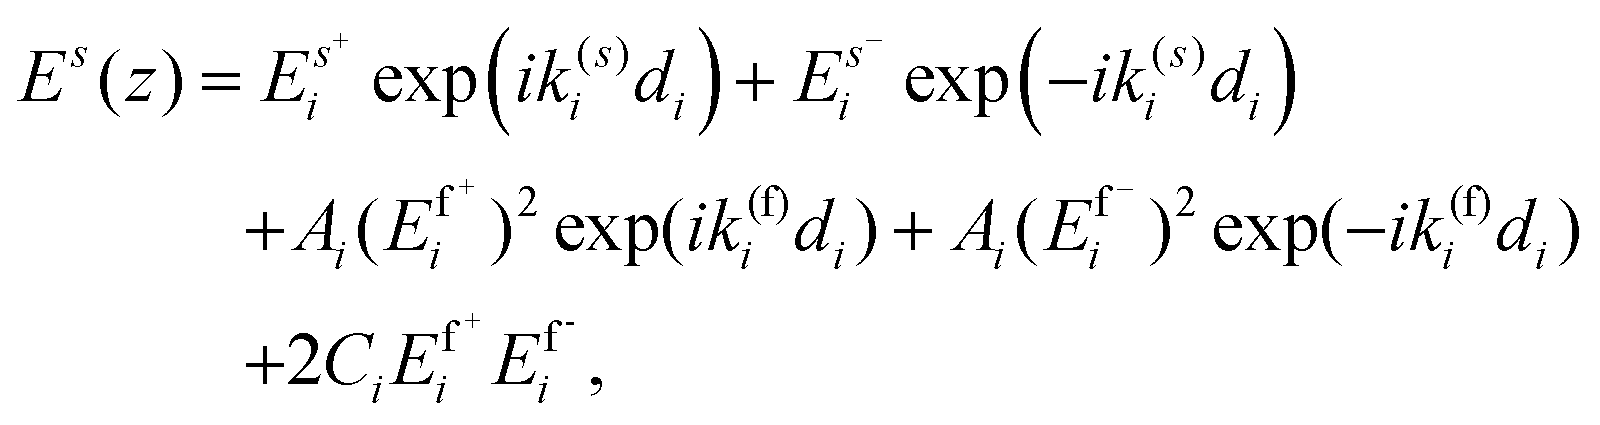
By simultaneously solving eqn (16) and (17), we can obtain the electric field distribution of SHW. Within the i-th layer, it can be expressed as
| |  | (18) |
where

and

represent the forward and backward SHW, respectively.
Ai and
Ci act on the confined wave term and the interference term, respectively, specifically:
8Ai = (−
ks2χi)/(
k(s)i·
k(s)i − 4
kf2), and
Ci = (−
kf·
χi)/(
k(s)ik(s)i), where
χi represents the second-order nonlinear coefficients of different media. They are directly obtained from solving the equations. Other parameters in
eqn (18) have been explained in the previous derivations. Next, combined with Maxwell's equation group, the matrix form of the propagation equations in a single-layer medium can be obtained as follows:
| |  | (19) |
The matrix on the right-hand side of eqn (19), the first term, is defined as Gi and Qi, belonging to the free-wave amplitude portion, as explained in detail earlier. For simplicity, let's define the matrix of the last two terms as follows:
| |  | (20) |
| |  | (21) |
Moving forward, starting from a single-layer medium, let's first examine the simple scenario of one period (ABC). Considering the continuity conditions of the electric fields at different layers, the relationship of the SHW fields from the first layer to the fourth layer is as follows:
| |  | (22) |
here,
S1 =
GcQcGc−1GbQbGb−1,
S2 =
GcQcGc−1. It can be observed that
eqn (22) does not include the influence of the
Ef3 term in the FW electric field on the SHW. This is because the presence of the air layer only affects the propagation of SHW but does not generate SHW. Specifically, the
χi for the air layer is 0, leading to
Ac and
Cc terms being 0. These terms directly act on
Ef3 in the matrix, thus not stimulating SHW generation. The last two terms represent the confined wave amplitudes of SHW just generated by the forward and backward FW, and the interference between the forward and backward FW.
As a recursive equation, eqn (22) serves as the unit transmission matrix for the first period. Starting from this equation, the overall transmission matrix of SHW can be obtained. Considering the periodicity of the structure and the complexity of the last two terms, as shown in eqn (10), we divide it into three main excitation parts. We consider dividing the NM structure into three parts: GG1 represents the (ABC)N−1 region, which is the excitation from the first layer to the 3N − 3th layer. GG2 represents the middle ABT region, which is the excitation from the 3N − 2th layer to the 3Nth layer. GG3 represents the (ABC)N region, which is the excitation from the 3N + 1th layer to the 6Nth layer. The specific expressions are as follows:
| | 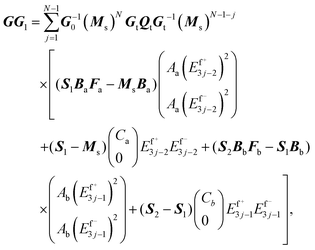 | (23) |
| |  | (24) |
| |  | (25) |
Similarly, in the GG1 term, j can range from 1 to N − 1. In the GG2 term, j can range from 1 to N. It is noteworthy that since the air layer and the test layer do not contribute to the SHW, the subterms containing Ac, At, Cc, and Ct are not included in the above three equations. Now, the excitation of SHW by FW in each layer of nonlinear medium has been determined. From the perspective of the total matrix, this is equivalent to having an initial value of SHW, which is determined by the complex nonlinear reactions and mutual interference of FW within the medium, provided by the GG1 and GG3 terms. Once the initial value of SHW is determined, the electric field amplitudes of the transmitted and reflected waves of SHW can be calculated, and further, the SHW conversion efficiency of the NM can be obtained. Additionally, it should be noted that the main approximation in this theory is that the nonlinear process is considered weak, meaning the FW is not affected by the nonlinear process. However, in the calculation of the given formulas, we have not made any other approximations except for the pump wave approximation.
Conversion efficiency is commonly used as a metric to characterize the intensity of SHW. The output intensity of the SHW is denoted as η = I/I0, where I0 represents the incident light intensity, and the output light intensity is given by12,14
| |  | (26) |
Here, n0 represents the RI of air, ε0 is the vacuum permittivity. The last two terms correspond to the square of the amplitude of the transmitted wave and the reflected wave of SHWs, respectively.
2.2. Analysis and discussion
The PBG effect describes the formation of a PBG, where light in a specific frequency range is prohibited from propagating due to periodic structural arrangements. Boundary modes are localized optical states that emerge at defects or structural boundaries.
The discussion focuses on enhancing SHW output intensity via the PBG effect. To maximize SHW output, optimization yields a structural period of N = 10, with other parameters detailed in the previous section. Notably, the thickness of each medium layer is determined through direct numerical simulation. Unlike traditional QPM conditions, the optimal QPM here is defined by achieving the maximum SHW output intensity. As shown in Fig. 2, under the conditions of fixed indoor temperature at 25 °C and incident light intensity I0 = 8.71 MW cm−2, the SHW output reaches its maximum value of 36.7% W−1 at the FW frequency f = 241.067 THz. In comparison with the findings of Li et al.,14 who require optical intensities as high as 0.5 GW cm−2 for significant conversion efficiency, the output intensity in this letter demonstrates higher efficiency and lower energy consumption. Furthermore, to validate the high dependence of SHW on PBG boundary conditions, Fig. 2(a) and (b) respectively illustrate the transmission spectra of FW and SHW, contrasted using the η function. Results indicate that the PBG boundary (The solid black arrows in Fig. 2(c)) enhances SHW even more significantly than defects within the PBG (the dashed black arrows in Fig. 2(b)). Since both contribute to enhancing local fields, leading to high-density states and strong electric field modes, higher η values suggest that SHW output intensity relies more on the PBG boundary of the SHW transmission curve than on the defect of the FW transmission function.
 |
| | Fig. 2 Enhancement of SHW output intensity in boundary mode. (a) The plot of the SHW output intensity η function curve. (b) Transmission curve of FW. (c) Transmission curve of SHW. (d) Zoom figure of defect mode in (b). | |
For a more intuitive demonstration of this result, Fig. 3 presents the distribution of electric fields in the NM at the frequency of f = 241.067 THz and twice the incident frequency 2f. The enhancement effect of field modes caused by defects in the sample layer is not as pronounced, whereas enhancement at the boundaries for both FW and SHW is significant, reaching up to 1.1 × 10⁴ V m−1 and 246 V m−1, respectively. This observation indirectly suggests that the SHW intensity in the NM is more dependent on boundary modes.
 |
| | Fig. 3 (a) Electric field distribution on the positive scale, (a) FW electric field distribution at f = 241.067 THz, (b) 2f = 482.134 THz. | |
From eqn (1), it can be inferred that the RI of LNC is influenced by the environmental temperature Tl, highlighting the potential of utilizing NM in the field of environmental temperature detection. Therefore, in Fig. 4, we comprehensively assess the capability of NM for temperature detection. In Fig. 4(a), the three-dimensional representation illustrates the continuous variation of the η1 function within the frequency range of 240.2 THz to 241.2 THz, corresponding to a temperature range of 20 °C to 140 °C, with the highest output intensity reaching 38% W−1. Fig. 4(b) provides a top–down view of Fig. 4(a), where the dashed region delineates the linear portion, indicating a temperature detection range of 25 °C to 105 °C. Fig. 4(c) presents the η1 function curves for five equally spaced temperature points. The lowest and highest output intensities are η = 12.6% W−1 and 37.5% W−1, respectively, with a difference of 24.9% W−1, demonstrating the sensitivity of NM to temperature changes. Additionally, the linear fitting (LFT) equation22 for the sampled points is provided in Fig. 4(c). The equation relating the output intensity η to the temperature Tl is η = −0.003202Tl + 0.475% W−1, with a sensitivity of S = 0.32% per °C, indicating a decrease in output light intensity at the kilowatt level per degree Celsius change in temperature, thus reflecting high sensitivity. R2 is used to assess the quality of LFT, with values closer to 1 indicating higher linearity. An R2 value of 0.9966 confirms the reliability of the LFT.22
 |
| | Fig. 4 Schematic diagrams of temperature detection. (a) Continuous variation of the η1 peak. (b) Top view of the η1 peak. (c) η1 values corresponding to different temperature detection points. (d) Linear fit of the output intensity η and Tl. | |
The liver tissue RI dispersion model proposed by Sharma et al.24 operates within the range of 450 –1551 nm. Specifically, the refractive index (nt) of the T-layer medium during biosensing can be expressed as
| |  | (27) |
where
λ is measured in μm.
Table 2 provides the corresponding RI coefficients for three different types of liver tissues.
Table 2 The RI parameters for three types of liver tissues24
| Tissue |
N
|
HCC |
MET |
|
A
r
|
1.35910 |
1.34127 |
1.34348 |
|
B
r (μm2) |
0.00827 |
0.00634 |
0.00998 |
|
C
r (μm4) |
−0.000576 |
−0.000324 |
−0.000793 |
|
a
|
196 |
780 |
145 |
|
b
|
1.27 |
1.41 |
1.14 |
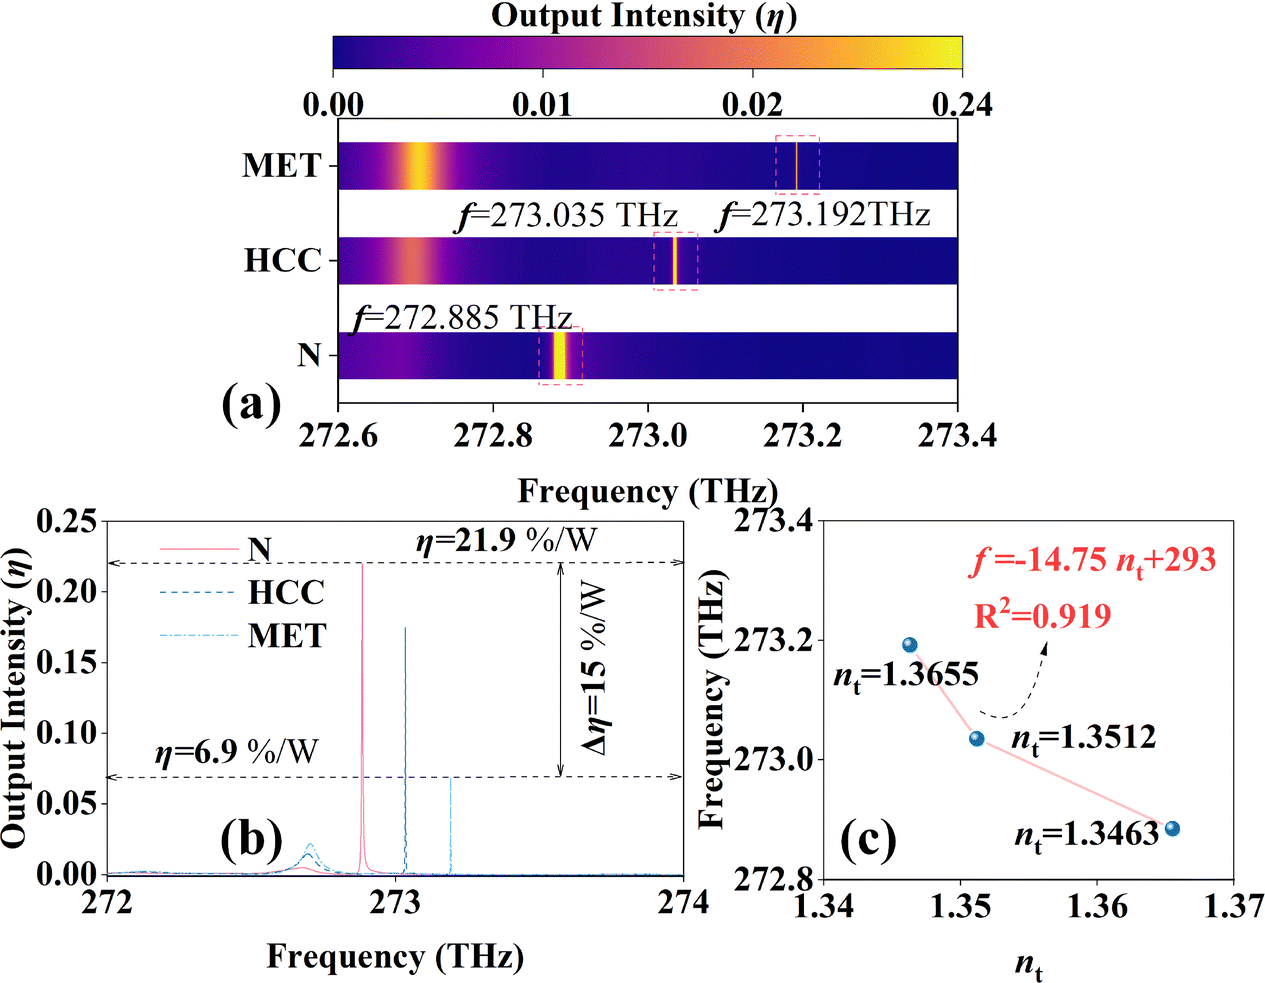
In contrast to the previous section, the T layer is no longer filled with air but with the addition of the analysis substance, hence nt is not equal to 1. Additionally, as indicated by eqn (9), the introduction of biological materials entails certain losses. Therefore, in biological detection, I0 is increased to 19.12 MW cm−2. In Fig. 5(a), the peak frequency points of the SHW for the three refractive indices (nt) are as follows: for N-type liver tissue, it is 272.885 THz; for HCC-type, it is 273.035 THz; and for MET-type, it is 273.192 THz. Additionally, Fig. 5(b) displays the corresponding η2 curves for the three types, where the peak differences reach up to 15% W−1. Fig. 5(c) provides a LFT equation for the shift in η2 peak value caused by changes in cancer cell RI within the frequency range: f = −14.75 nt + 293 THz, with a sensitivity of S = 14.76 THz per RIU. This indicates that the RI sensing response is amplified to the THz level, enabling effective monitoring.23 It is worth noting that the three sampled points of nt in Fig. 5c are obtained by substituting the peak frequency points into eqn (27). For ease of comparison with other studies, we only consider the real part of nt.
 |
| | Fig. 5 Schematic diagram of biological RI sensing. (a) The peak frequencies of three liver tissue η2 functions correspond to FW frequency points. (b) The SHW output intensity of the three types of liver tissues η2. (c). LFT of the frequency shift f and equidistantly sampled RI points. | |
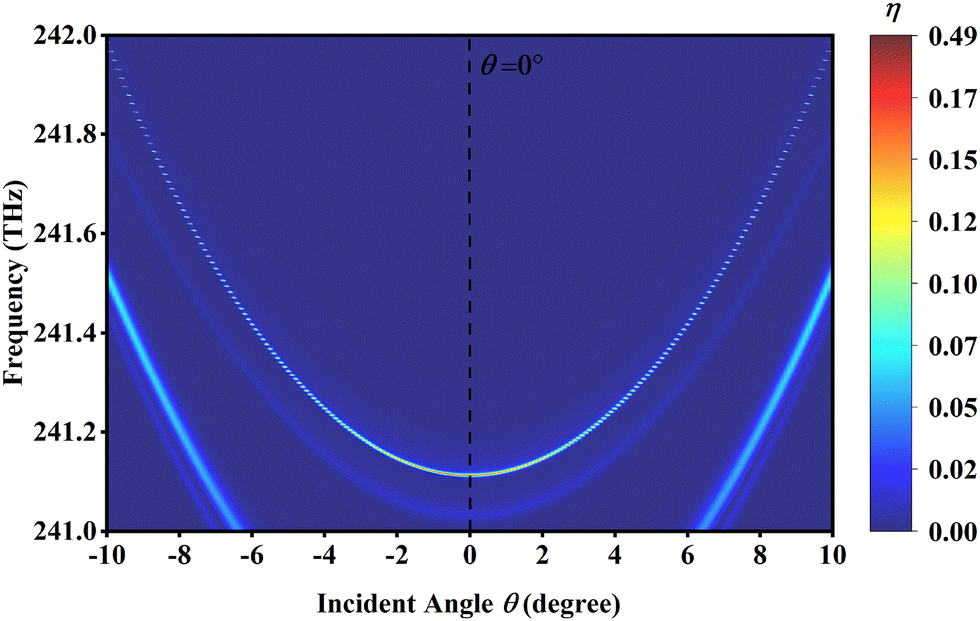
Due to the strong dependence of SHW on the phase matching condition of the device, future research could achieve a broader refractive index sensing range by sacrificing some incident light intensity. Similarly, since the FW incident angle is a critical factor in phase matching, it is necessary to investigate its influence. In Fig. 6, by varying the initial FW incident angle θ within a range of −10° to 10°, the SHW output intensity is observed to shift between 241 THz and 242 THz. Notably, the output intensity is nearly symmetric about the black dashed line at θ = 0°. This indicates that angle variation disrupts phase matching, forcing the SHW to readjust its phase-matching conditions, thereby causing the η peak to shift continuously across the spectrum. In future studies, this phenomenon could potentially be exploited as a novel method for angle sensing.
 |
| | Fig. 6 The SHW output peak η exhibits a clear angular dependence on the incident angle θ, with its spectral position shifting continuously as θ varies. | |
Compared to previous research, the SHW-based NM demonstrates superior performance in sensitivity and detection range. To visually demonstrate the advantages of the proposed NM system, Table 3 lists previously reported detectors with excellent performance for comparison with NM. It can be observed that the NM designed in this study shows advantages in utilizing SHW and performing multiple sensing tasks. For temperature sensing, this study demonstrates strong sensitivity and a wide detection range. For biological sensing, although the normalized sensitivity is relatively limited, the work still exhibits an innovative advantage in employing SHW for biosensing applications. Therefore, the NM detection structure proposed in this study showcases advancement and value.
Table 3 The published reports compared with the proposed NM in terms of performance
| Ref. |
SHW |
Multitasking |
Detection physical quantities |
Detection performance |
| Range |
S
|
|
25
|
× |
× |
Temperature detection |
28–30 °C |
10.02 GHz per °C |
|
26
|
× |
× |
Temperature detection |
38–43 °C |
5.37 cm−1 per °C |
|
27
|
× |
× |
Temperature detection |
24.85–59.85 °C |
0.21% per °C |
|
28
|
× |
× |
Temperature detection |
24.85–249.85 °C |
0.29% per °C |
|
29
|
√ |
√ |
Temperature detection |
18.25–34.75 °C |
— |
|
30
|
× |
× |
RI detection |
1.0–1.39 |
300 GHz per RIU |
|
31
|
× |
× |
RI detection |
1.0–1.06 |
1.94 THz per RIU |
|
32
|
× |
× |
RI detection |
1.0–1.04 |
1.01 THz per RIU |
|
33
|
× |
√ |
Biosensing |
1.35–1.39 |
1.87 THz per RIU |
|
34
|
× |
× |
RI detection |
1.0–2.0 |
4.72 THz per RIU |
| This article |
√ |
√ |
Temperature detection |
25–105 °C |
0.32% per°C |
|
|
|
Biosensing |
1.3463–1.3655 |
14.76 THz per RIU |
3. Conclusions
In summary, a layered NM consisting of LNC and air layers is proposed in this letter. Inserting the analysis layer (T-layer) as a defect results in lower SHW output intensity compared with the enhancement of SHW electric field modes under PBG boundary conditions. By evaluating the temperature detection and biosensing capabilities of the NM using output light intensity and frequency shift, wide-range detection from 25 to 105 °C and 1.3463 to 1.3655 RIU (the FW scale), with sensitivities of 0.32% per °C and 14.76 THz per RIU respectively, were achieved. The introduction of NM capable of various optical detection tasks serves as a guiding principle for the application of LNC and the expansion of SHW research.
Author contributions
C. Y. conceived the project. H. F. Z. and X. L. supervised the overall research plan. C. Y. and Y. X. W. performed the formula derivations. Y. X. W. and H. J. L. conducted the code implementation and computational studies. C. Y. and H. J. L. wrote the paper. X. L. and H. F. Z. reviewed the paper. All authors approved the final version of the manuscript.
Data availability
The data that support the findings of this study are available from the corresponding author upon reasonable request.
Conflicts of interest
There are no conflicts to declare.
Notes and references
- M.-C. Hsieh, C.-H. Chien, C.-C. Chang and T.-C. Chang, J. Mater. Chem. B, 2013, 1, 2350–2357 RSC.
- J. Su, J. Zhang, X. Tian, M. Zhao, T. Song, J. Yu, Y. Cui, G. Qian, H. Zhong and L. Luo, J. Mater. Chem. B, 2017, 5, 5458–5463 RSC.
- C. Yang, C.-M. Guo, J. Xu and H.-F. Zhang, IEEE Trans. Micro. Theory Tech., 2024, 72, 4174–4182 Search PubMed.
- G. Piccirillo, M. V. Ditaranto, N. F. Feuerer, D. A. C. Berrio, E. M. Brauchle, A. Pepe, B. Bochicchio, K. Schenke-Layland and S. Hinderer, J. Mater. Chem. B, 2018, 6, 6399–6412 RSC.
- J. Martorell, R. Vilaseca and R. Corbalán, Appl. Phys. Lett., 1997, 70, 702–704 CrossRef CAS.
- W. Li, S. Cheng, Z. Yi, H. Zhang, Q. Song, Z. Hao, T. Sun, P. Wu, Q. Zeng and R. Raza, Appl. Phys. Lett., 2025, 126 Search PubMed.
- Z. Ai, H. Liu, S. Cheng, H. Zhang, Z. Yi, Q. Zeng, P. Wu, J. Zhang, C. Tang and Z. Hao, J. Phys. D:Appl. Phys., 2025, 58, 185305 CrossRef CAS.
- J.-J. Li, Z.-Y. Li and D.-Z. Zhang, Phys. Rev. E:Stat., Nonlinear, Soft Matter Phys., 2007, 75, 056606 CrossRef PubMed.
- M. Arbore, O. Marco and M. Fejer, Opt. Lett., 1997, 22, 865–867 CrossRef CAS PubMed.
- Z. Li, S. Cheng, H. Zhang, W. Yang, Z. Yi, Y. Yi, J. Wang, S. Ahmad and R. Raza, Phys. Lett. A, 2025, 534, 130262 CrossRef CAS.
- K. Liu, J. Shi and X. Chen, Appl. Phys. Lett., 2009, 94, 0573 Search PubMed.
- J. Li, Z. Li, Y. Sheng and D. Zhang, Appl. Phys. Lett., 2007, 91 Search PubMed.
- R. Luo, Y. He, H. Liang, M. Li and Q. Lin, Optica, 2018, 5, 1006–1011 CrossRef CAS.
- B.-Q. Chen, M.-L. Ren, R.-J. Liu, C. Zhang, Y. Sheng, B.-Q. Ma and Z.-Y. Li, Light:Sci. Appl., 2014, 3, e189 CrossRef CAS.
- Z. Chen, D. Zhao, R. Ma, X. Zhang, J. Rao, Y. Yin, X. Wang and F. Yi, J. Mater. Chem. B, 2021, 9, 1941–1964 RSC.
- D. H. Jundt, Opt. Lett., 1997, 22, 1553–1555 CrossRef CAS PubMed.
- V. Adepu, V. Mattela and P. Sahatiya, J. Mater. Chem. B, 2021, 9, 4523–4534 RSC.
- E. Snider, N. Dasenbrock-Gammon, R. McBride, M. Debessai, H. Vindana, K. Vencatasamy, K. V. Lawler, A. Salamat and R. P. Dias, Nature, 2020, 586, 373–377 CrossRef CAS PubMed.
- M. Bartnick, M. Santandrea, J. P. Höpker, F. Thiele, R. Ricken, V. Quiring, C. Eigner, H. Herrmann, C. Silberhorn and T. J. Bartley, Phys. Rev. Appl., 2021, 15, 024028 CrossRef CAS.
- H. Wang, T. Wu, M. Li and Y. Tao, J. Mater. Chem. B, 2021, 9, 921–938 RSC.
- L. Zhao, L. Pan, K. Zhang, S. Guo, W. Liu, Y. Wang, Y. Chen, X. Zhao and H. Chan, Lab Chip, 2009, 9, 2981–2986 RSC.
- J.-Y. Sui, J.-H. Zou, S.-Y. Liao, B.-X. Li and H.-F. Zhang, Appl. Phys. Lett., 2023, 122 Search PubMed.
- J.-Y. Sui, S.-Y. Liao, B. Li and H.-F. Zhang, Opt. Lett., 2022, 47, 6065–6068 CrossRef CAS PubMed.
- A. K. Sharma, J. Gupta and R. Basu, Opt. Laser Technol., 2018, 98, 291–297 CrossRef.
- M. A. Ismail, N. Tamchek, M. R. A. Hassan, K. D. Dambul, J. Selvaraj, N. A. Rahim, R. Sandoghchi and F. R. M. Adikan, Sensors, 2011, 11, 8665–8673 CrossRef CAS PubMed.
- T. Zhou, W. Fang, G. Lu, M. Yang, F. Liu, X. Yin, W. Qiu, H. Guan, H. Lu and H. Zheng, Opt. Laser Technol., 2023, 161, 109206 CrossRef CAS.
- I. Kolesnikov, E. Golyeva, A. Kalinichev, M. Kurochkin, E. Lähderanta and M. Mikhailov, Sens. Actuators, B, 2017, 243, 338–345 CrossRef CAS.
- K. Zheng, Z. Liu, C. Lv and W. Qin, J. Mater. Chem. C, 2013, 1, 5502–5507 RSC.
- X. Li, C. Yang, C. Guo, Q. Li, C. Peng and H. Zhang, Sensors, 2024, 24, 3065 CrossRef PubMed.
- A. S. Saadeldin, M. F. O. Hameed, E. M. Elkaramany and S. S. Obayya, IEEE Sens. J., 2019, 19, 7993–7999 CAS.
- D. Hu, T. Meng, H. Wang, Y. Ma and Q. Zhu, Results Phys., 2020, 19, 103567 CrossRef.
- J. Hu, M. Li, Z. Wang, Z. Hu, J. Wang, S. Khakhomov and I. Semchenko, J. Opt. Soc. Am. B, 2021, 38, 2543–2550 CrossRef.
- S. Anwar and M. Khan, Eur. Phys. J. E, 2023, 46, 19 CrossRef CAS PubMed.
- M. Karthikeyan, P. Jayabala, S. Ramachandran, S. S. Dhanabalan, T. Sivanesan and M. Ponnusamy, Nanomaterials, 2022, 12, 2693 CrossRef CAS PubMed.
|
| This journal is © The Royal Society of Chemistry 2025 |
Click here to see how this site uses Cookies. View our privacy policy here. 
 *
*


 and
and  represent the forward and backward SHW, respectively. Ai and Ci act on the confined wave term and the interference term, respectively, specifically:8Ai = (−ks2χi)/(k(s)i·k(s)i − 4kf2), and Ci = (−kf·χi)/(k(s)ik(s)i), where χi represents the second-order nonlinear coefficients of different media. They are directly obtained from solving the equations. Other parameters in eqn (18) have been explained in the previous derivations. Next, combined with Maxwell's equation group, the matrix form of the propagation equations in a single-layer medium can be obtained as follows: