 Open Access Article
Self-healing of defects in uniaxially aligned semiconducting polymer crystals via molecular doping: insights into crystallization from transient vs. settled amorphous phases†
Hokyeong
Jeong‡
a,
Sangwon
Eom‡
a,
Sanghoon
Cho
a,
Thanh Van
Vu
a,
Jae Hyun
Sim
b,
Jinwoo
Choi
a,
Seungjoo
Park
a,
Sangho
Kim
a,
Sangeun
Baek
a,
Hyunmin
Lee
a,
Hoeil
Chung
 ab and
Youngjong
Kang
 *abcd
*abcd
aDepartment of Chemistry, Hanyang University, 222 Wangsimni-ro, Seongdong-gu, Seoul, 04763, South Korea. E-mail: youngjkang@hanyang.ac.kr
bResearch Institute for Convergence of Basic Science, Hanyang University, 222 Wangsimni-ro, Seongdong-gu, Seoul, 04763, South Korea
cInstitute of Nano Science and Technology, Hanyang University, 222 Wangsimni-ro, Seongdong-gu, Seoul, 04763, South Korea
dResearch Institute for Natural Sciences, Hanyang University, 222 Wangsimni-ro, Seongdong-gu, Seoul, 04763, South Korea
First published on 14th February 2025
Abstract
We present the self-healing of defects and enhanced crystallinity in uniaxially aligned poly(3-hexylthiophene) (P3HT) crystals via molecular doping with F4TCNQ. Using eutectic friction transfer (EFT), highly aligned P3HT films (P3HTEFT) were fabricated, exhibiting superior alignment and planarity compared to spin-cast P3HT (P3HTSC). Upon doping, the self-healing of defects in P3HTEFT films led to a significant increase in the charged-ordered phase from 5.4% to 80.3%, transforming transient amorphous phases into well-ordered crystalline domains. In contrast, the conventional P3HTSC films formed settled amorphous phases, and exhibited no self-healing behavior. Structural analysis using polarized UV-VIS, FT-IR, Raman spectroscopy, and GIWAXS confirmed significant improvements in crystalline order and charge carrier mobility. This led to a dramatic increase in electrical conductivity, with doped P3HTEFT (d-P3HTEFT) films exhibiting four orders of magnitude higher conductivity compared to their spin-cast counterparts (d-P3HTSC). These findings highlight the distinct crystallization behaviors of transient versus settled amorphous phases, emphasizing the critical role of uniaxial alignment in realizing highly crystalline semiconducting polymers for organic electronic applications.
Introduction
With the rapid advancement of wearable and implantable electronics, semiconducting polymers have become a focal point in research as active materials for organic devices, including organic field-effect transistors (OFETs), organic light-emitting diodes (OLEDs), organic photovoltaics (OPVs), and organic thermoelectric generators (OTEGs).1–6 This interest largely stems from their cost-effectiveness, processability, and mechanical flexibility.7–9 Additionally, the electrical and optical properties of semiconducting polymers can be extensively tuned through various methods, such as chemical structure modification, crystallization, molecular arrangement, and doping. Optimizing electrical conductivity in semiconducting polymers, in particular, often relies on strategies like chain alignment and charge-transfer (CT) doping. Unlike their inorganic counterparts, semiconducting polymers do not typically follow the Widemann–Franz law, and the correlation between σ and κ is weak.10–12 This weak correlation allows semiconducting polymers to avoid the usual trade-offs between electrical and thermal performance when employing CT doping. Studies have shown that the conductivity of n- or p-type semiconducting polymers can be significantly enhanced by several orders of magnitude through the introduction of a specific quantity of electron- or hole-donating CT dopants.13–16 However, despite these improvements in conductivity, it is important to note that incorporating dopants into long semiconducting polymer chains can lead to structural distortions. These distortions disrupt the ordered microstructure, complicating the understanding of the CT mechanism in these materials.17,18 Moreover, the effect of pre-formed polymer microstructures on doping efficiency and conductivity remains unclear.19 The anisotropic microstructure of semiconducting polymers across various length scales can significantly influence doping efficiency and charge transport. This underscores the need for further investigation into the impact of doping on the structure–function relationship in these materials, particularly considering the structural challenges posed by CT doping.The electronic coupling in conducting polymers is highly sensitive to the conformation and packing characteristics of individual chains. Depending on their intrachain order, the optical spectra can exhibit either H-type or J-type behavior. In H-type aggregates, the 0–0 transition is forbidden, whereas in J-type aggregates, the 0–0 transition is allowed.20–29 Due to defects such as bends or kinks in the conjugation that hinder intrachain transport, J-type packing rarely occurs because it requires a high degree of intrachain order. To address this challenge, uniaxial alignment in conjugated polymers has been employed to enhance their conjugation length and planarity-characteristics associated with J-type packing. These structural improvements contribute to enhanced electrical properties by facilitating charge transport along extended π orbitals in the planar polymer backbone. This configuration minimizes the reliance on slow and energetically demanding interchain hopping events.
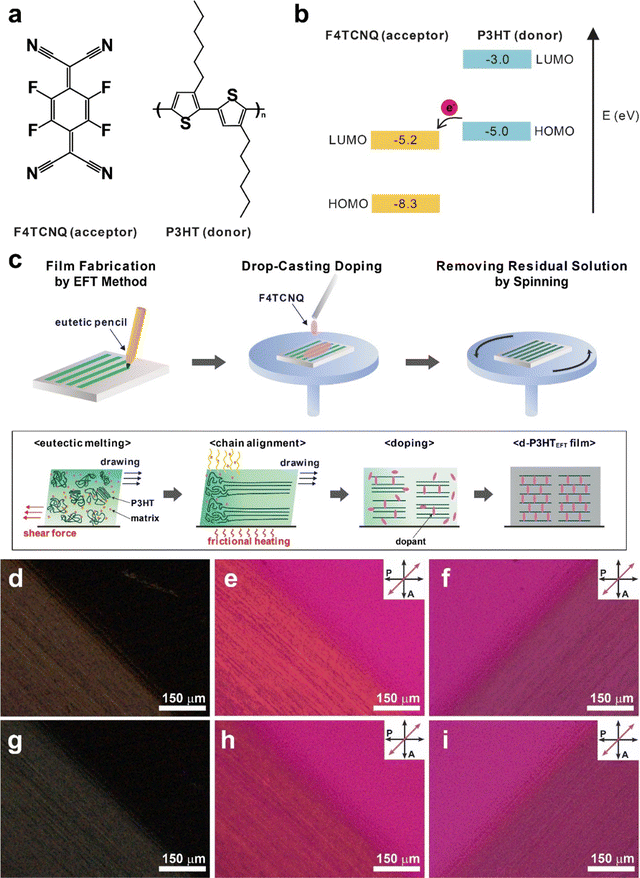
In this study, we present the spontaneous removal of defects in uniaxially aligned poly(3-hexylthiophene) (P3HT) films prepared via the eutectic friction transfer (EFT) method during p-doping with 2,3,5,6-tetrafluoro-7,7,8,8-tetracyanoquinodimethane (F4TCNQ) (Fig. 1a and b). To achieve uniaxial alignment in semiconducting polymer films, our group previously demonstrated that the EFT method can be effectively employed.30 Highly crystalline films were obtained by simply rubbing pellets composed of semiconducting polymers and small-molecule matrix materials that form eutectic mixtures. We intentionally chose matrix materials that can be easily removed through sublimation. P3HT films prepared either by EFT method (P3HTEFT) or by conventional spin casting method (P3HTSC) were analyzed using polarized UV-VIS, FT-IR, and Raman spectroscopy. Compared to P3HTSC, P3HTEFT exhibited highly anisotropic characteristics in polarized spectra. Deconvolution of the Raman spectra provided insights into the fraction of neutral-disordered, charged-disordered, neutral-ordered, and charged-ordered domains within the films. Before doping with F4TCNQ, both P3HTSC and P3HTEFT exhibited similar fractions of neutral-disordered (24.7% vs. 24.0%), charged-disordered (1.0% vs. 0.9%), neutral-ordered (66.6% vs. 69.5%), and charged-ordered (7.7% vs. 5.4%) phases. After doping, the total disordered fraction (charged and neutral) in P3HTEFT significantly decreased from 24.9% to 2.7%, accompanied by a dramatic increase in the charged-ordered fraction from 5.4% to 80.3%. In contrast, P3HTSC showed minimal change in the total disordered fraction, remaining relatively constant at 24.7% compared to its initial value of 25.7%. These results suggest that F4TCNQ molecules effectively and uniformly interact with P3HT in the uniaxially aligned films, reorganizing torsional defects in the polymer chains.24–26
Results and discussions
Uniaxially aligned P3HT films were prepared using the EFT method (P3HTEFT), with slight modifications as described in a previous report.30 Briefly, P3HT and the matrix material, 1,3,5-trichlorobenzene (1,3,5-TCB), were mixed in a 1![[thin space (1/6-em)]](https://www.rsc.org/images/entities/char_2009.gif) :
:![[thin space (1/6-em)]](https://www.rsc.org/images/entities/char_2009.gif) 1 weight ratio and completely dissolved in chloroform. The solution was filtered through a syringe filter (PTFE, 0.2 μm pore) and then dried at room temperature for 4 h. After drying, the resulting powder was ground again and compressed under a pressure of ∼600 MPa to form a pellet, which was subsequently cut and inserted into a pencil as the lead for EFT writing. The P3HTEFT films were prepared by simply rubbing the pellets in one direction onto silicon substrates heated to 55 °C (Fig. 1c). Frictional heat generated during the rubbing process caused eutectic melting of P3HT and 1,3,5-TCB, facilitating easy transfer under mild pressure conditions (<0.1 MPa). Although 1,3,5-TCB was spontaneously removed by sublimation during the rubbing process due to its high vapor pressure, additional sublimation was performed by placing the samples in a vacuum oven at 50 °C for 24 h. The prepared P3HTEFT films were then doped with F4TCNQ by applying F4TCNQ solutions dissolved in acetonitrile (c = 0.1–3.0 mg mL−1) for 10 s, followed by removing excess solution by spinning at 3000 rpm (Fig. 1c). The resulting F4TCNQ-doped P3HTEFT (d-P3HTEFT) showed a slightly dark color.
1 weight ratio and completely dissolved in chloroform. The solution was filtered through a syringe filter (PTFE, 0.2 μm pore) and then dried at room temperature for 4 h. After drying, the resulting powder was ground again and compressed under a pressure of ∼600 MPa to form a pellet, which was subsequently cut and inserted into a pencil as the lead for EFT writing. The P3HTEFT films were prepared by simply rubbing the pellets in one direction onto silicon substrates heated to 55 °C (Fig. 1c). Frictional heat generated during the rubbing process caused eutectic melting of P3HT and 1,3,5-TCB, facilitating easy transfer under mild pressure conditions (<0.1 MPa). Although 1,3,5-TCB was spontaneously removed by sublimation during the rubbing process due to its high vapor pressure, additional sublimation was performed by placing the samples in a vacuum oven at 50 °C for 24 h. The prepared P3HTEFT films were then doped with F4TCNQ by applying F4TCNQ solutions dissolved in acetonitrile (c = 0.1–3.0 mg mL−1) for 10 s, followed by removing excess solution by spinning at 3000 rpm (Fig. 1c). The resulting F4TCNQ-doped P3HTEFT (d-P3HTEFT) showed a slightly dark color.
Fig. 1d–i display the polarized optical microscopy (POM) micrographs of the P3HTEFT and the d-P3HTEFT films. Both P3HTEFT and d-P3HTEFT exhibited strong birefringence responses under cross-polarizers when the drawing direction was aligned at 45° to the polarizer, while no response was observed when it was parallel to the polarizer (Fig. 1d and g). In contrast, the P3HT films prepared by spin casting (P3HTSC) show no birefringence response at any angle on POM (Fig. S1, ESI†). When a retarder was inserted, P3HTEFT and d-P3HTEFT films presented two different colors depending on their orientation: a yellow color when the drawing direction was perpendicular to the retarder (Fig. 1e and h) and a blue color when the drawing direction was parallel to the retarder (Fig. 1f and i). Considering that P3HT crystals exhibit negative birefringence and that their optical axis corresponds to the direction of π–π staking between the thiophene rings, these results suggest that the polymer backbone of P3HT is uniaxially aligned along the drawing direction in the P3HTEFT films.
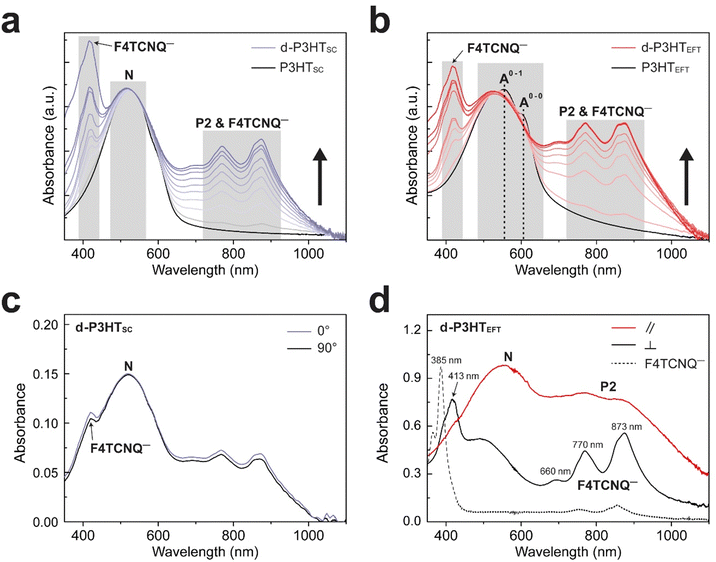
Fig. 2a and b display the UV-VIS absorption spectra of the d-P3HTSC and d-P3HTEFT with varying doping concentrations from 0 to 3.0 mg mL−1. The P3HTEFT film exhibited a broad absorption peak at λpeak = 558 nm with a small shoulder at λpeak = 605 nm, which are assigned as 0–1 and 0–0 electronic transitions, respectively. In contrast, no such vibronic features were observed in the P3HTSC film. Depending on their intrachain order, the optical spectra can exhibit either H-type or J-type behavior.20–29 The ratio of I0–0A/I0–1A = 0.83, which is less than unity, indicates that the P3HTEFT film mainly exhibits H-type packing with some contribution from the allowed 0–0 transition.20,31 Upon doping with F4TCNQ, several new peaks appeared in both d-P3HTSC and d-P3HTEFT, with intensities increasing alongside the concentration of F4TCNQ (c = 0–3.0 mg mL−1). The peaks observed at λpeak = 450–530 nm and λpeak = 758 nm correspond to the polaron absorption bands assigned to neutral peak (N) and P2, respectively.32,33 Noticeably, the d-P3HTEFT showed two distinct features upon doping with F4TCNQ: first, the position of the 0–1 absorption peak shifted toward a lower wavelength region; second, the intensity of the 0–0 absorption peak nearly disappeared. In contrast, the d-P3HTSC showed no significant changes in these peaks. These observations suggest that H-packing was further enhanced in the d-P3HTEFT film through F4TCNQ doping. Especially, the disappearance of the 0–0 transition indicates that F4TCNQ doping induces almost purely H-type packing while suppressing any J-type characteristics.
The generation of new vibronic states by polarons and a weakening of interchain interactions, potentially due to the intercalation of F4TCNQ molecules within the thiophene units. As the concentration of F4TCNQ increased, the intensity of the P2 polaron peak (λP2 = 758 nm), and the F4TCNQ anion peaks (λF4TCNQ− = 416 nm and 770, 873 nm) gradually increased and eventually saturated in both d-P3HTEFT and d-P3HTSC (Fig. 2a and b). The P2 polaron and the F4TCNQ anion peaks overlap at 700–1000 nm.34
The charge orientation of the d-P3HTEFT film was analyzed using polarized UV-VIS spectroscopy. When the incident polarized light was aligned parallel to the polymer chain direction, the P2 (λP2 = 758 nm) polaron peak was prominently observed with minimal contribution from the F4TCNQ anion peaks. Additionally, a P2 polaron around 900 nm overlapped with the F4TCNQ anion peak at 873 nm. In contrast, when the incident polarized light was perpendicular to the polymer chain direction, distinct F4TCNQ anion peaks appeared at λF4TCNQ− = 413 nm, 660 nm, 770 nm, and 873 nm (Fig. 2d) This suggests that the orientation of the charged species in the d-P3HTEFT film is highly anisotropic, with the P2 polaron transitions aligning along the polymer backbone and the F4TCNQ anion transitions oriented perpendicular to it. The full UV-VIS absorption spectra are represented in Fig. S2 (ESI†). In contrast, no anisotropy in UV-VIS spectra was observed in d-P3HTSC (Fig. 2c). The anisotropic properties of d-P3HTEFT film originate from its highly aligned charge orientation. The P3HT polarons formed along the uniaxially aligned backbone, while the F4TCNQ anions are situated between the polymer side chains, oriented perpendicular to the backbone direction. The measurement of neutral F4TCNQ, shown as the dotted line in Fig. 2d, displays a neutral peak at 385 nm and minor charged peaks at 770 nm, and 873 nm due to exposure to air. Notably, the d-P3HTEFT film does not exhibit the neutral F4TCNQ peaks, indicating that all F4TCNQ molecules were completely doped without the neutral residue.
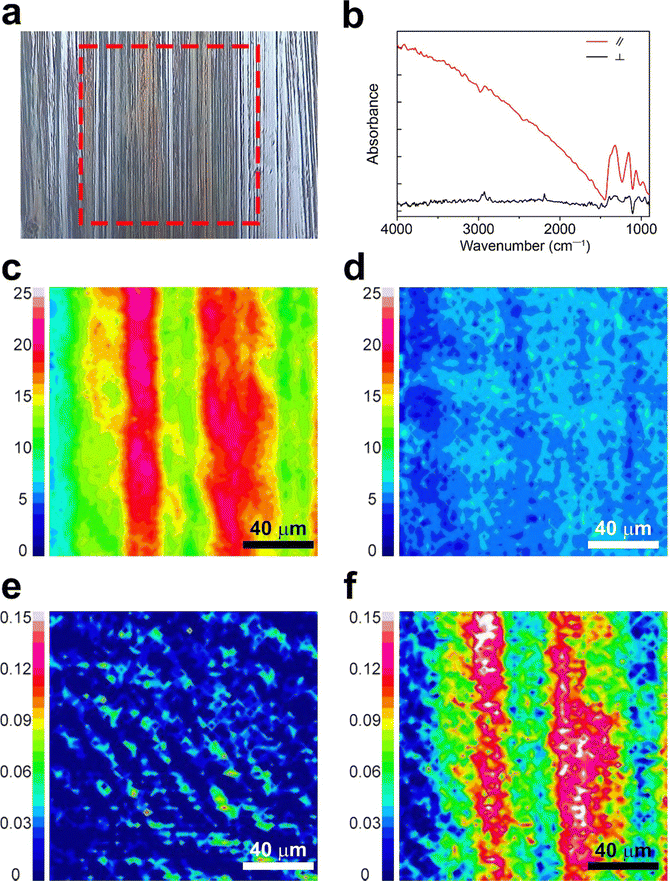
Characterization via polarized FT-IR spectroscopy provided detailed insights into charge orientation by investigating the C![[triple bond, length as m-dash]](https://www.rsc.org/images/entities/char_e002.gif) N stretching of F4TCNQ anions (ṽ = 2188–2180 cm−1) and doping-induced modes of P3HT (ṽ = 1350–1000 cm−1).16,33,35,36 The scan area for the polarized FT-IR mapping (highlighted with a red dotted square) is depicted in Fig. 3a, with the corresponding spectra of the d-P3HTEFT film presented in Fig. 3b. Fig. 3c and d represent polarized FT-IR mapping images calibrated to the doping-induced mode of P3HT (ṽ = 1350–1000 cm−1), revealing a uniform distribution with high intensity when the polarized light was parallel to the backbone direction (Fig. 3c). In contrast, lower intensity was observed when the polarized light was perpendicular to the backbone direction (Fig. 3d). These results impart that the doping-induced modes of P3HT were notably activated when the polarized light was aligned parallel to the backbone direction. In contrast, the C
N stretching of F4TCNQ anions (ṽ = 2188–2180 cm−1) and doping-induced modes of P3HT (ṽ = 1350–1000 cm−1).16,33,35,36 The scan area for the polarized FT-IR mapping (highlighted with a red dotted square) is depicted in Fig. 3a, with the corresponding spectra of the d-P3HTEFT film presented in Fig. 3b. Fig. 3c and d represent polarized FT-IR mapping images calibrated to the doping-induced mode of P3HT (ṽ = 1350–1000 cm−1), revealing a uniform distribution with high intensity when the polarized light was parallel to the backbone direction (Fig. 3c). In contrast, lower intensity was observed when the polarized light was perpendicular to the backbone direction (Fig. 3d). These results impart that the doping-induced modes of P3HT were notably activated when the polarized light was aligned parallel to the backbone direction. In contrast, the C![[triple bond, length as m-dash]](https://www.rsc.org/images/entities/char_e002.gif) N stretching peak of F4TCNQ anions was prominently activated when the polarized light was perpendicular to the backbone direction. Fig. 3e and f present polarized FT-IR mapping images calibrated to the C
N stretching peak of F4TCNQ anions was prominently activated when the polarized light was perpendicular to the backbone direction. Fig. 3e and f present polarized FT-IR mapping images calibrated to the C![[triple bond, length as m-dash]](https://www.rsc.org/images/entities/char_e002.gif) N stretching of F4TCNQ anions (ṽ = 2188–2180 cm−1). These images revealed high intensity with perpendicular light and low intensity with parallel light, indicating the perpendicular arrangement of F4TCNQ anions relative to the backbone direction. Consistent with the polarized UV-VIS data, these results indicate that P3HT polarons are uniaxially aligned along the polymer backbone, while the F4TCNQ anions are oriented perpendicularly to the polymer chains. However, the d-P3HTSC film did not show anisotropic properties (Fig. S3, ESI†).
N stretching of F4TCNQ anions (ṽ = 2188–2180 cm−1). These images revealed high intensity with perpendicular light and low intensity with parallel light, indicating the perpendicular arrangement of F4TCNQ anions relative to the backbone direction. Consistent with the polarized UV-VIS data, these results indicate that P3HT polarons are uniaxially aligned along the polymer backbone, while the F4TCNQ anions are oriented perpendicularly to the polymer chains. However, the d-P3HTSC film did not show anisotropic properties (Fig. S3, ESI†).
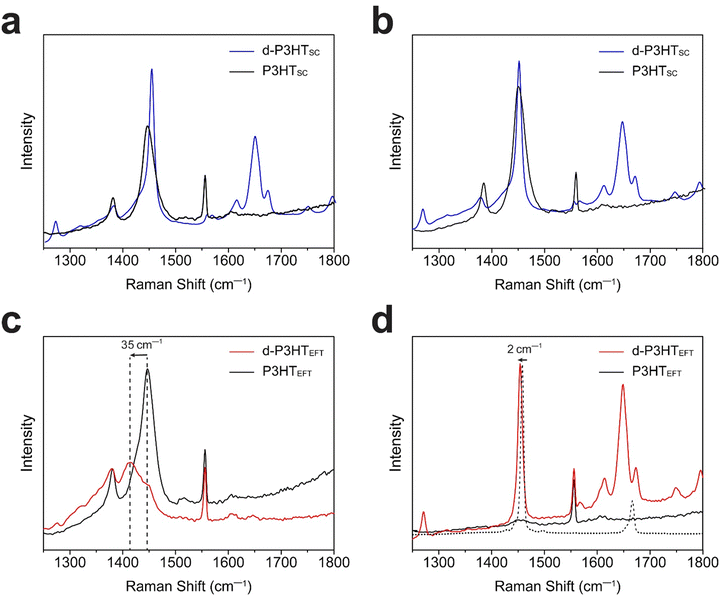
Subsequently, P3HT films were characterized using polarized Raman spectroscopy (Fig. 4). A 785 nm laser was employed for excitation due to its effective interaction with polarons. We note that our chosen laser wavelength biases to the the ordered fraction in the films.27 Under polarized laser irradiation parallel to the backbone direction, the P3HTEFT film exhibited strong C–C (1380 cm−1) and C![[double bond, length as m-dash]](https://www.rsc.org/images/entities/char_e001.gif) C (1452 cm−1) peaks. Conversely, these peaks were significantly diminished when the polarized laser was oriented perpendicular to the backbone direction (Fig. 4c and d). The d-P3HTEFT film also exhibited highly anisotropic Raman spectra, depending on the laser irradiation direction. Under the parallel laser excitation, the d-P3HTEFT film revealed distinct polaron peaks corresponding to the charged-ordered (1421 cm−1) and charged-disordered (1397 cm−1) components. Additionally, the C
C (1452 cm−1) peaks. Conversely, these peaks were significantly diminished when the polarized laser was oriented perpendicular to the backbone direction (Fig. 4c and d). The d-P3HTEFT film also exhibited highly anisotropic Raman spectra, depending on the laser irradiation direction. Under the parallel laser excitation, the d-P3HTEFT film revealed distinct polaron peaks corresponding to the charged-ordered (1421 cm−1) and charged-disordered (1397 cm−1) components. Additionally, the C![[double bond, length as m-dash]](https://www.rsc.org/images/entities/char_e001.gif) C peak showed a redshift of 35 cm−1, with a high IC–C/IC
C peak showed a redshift of 35 cm−1, with a high IC–C/IC![[double bond, length as m-dash]](https://www.rsc.org/images/entities/char_e001.gif) C ratio, indicating a high degree of planarity in the polymer backbone (Fig. 4c).37,38 Peaks corresponding to F4TCNQ anions at 1452 cm−1 and 1700–1600 cm−1 range were observed under perpendicular laser orientation relative to the backbone. The neutral F4TCNQ peak, indicated by the dotted line, displayed a 2 cm−1 shift upon charge formation (Fig. 4d). On the other hand, both P3HTSC and d-P3HTSC films showed isotropic properties without the peak shift (Fig. 4a and b).
C ratio, indicating a high degree of planarity in the polymer backbone (Fig. 4c).37,38 Peaks corresponding to F4TCNQ anions at 1452 cm−1 and 1700–1600 cm−1 range were observed under perpendicular laser orientation relative to the backbone. The neutral F4TCNQ peak, indicated by the dotted line, displayed a 2 cm−1 shift upon charge formation (Fig. 4d). On the other hand, both P3HTSC and d-P3HTSC films showed isotropic properties without the peak shift (Fig. 4a and b).
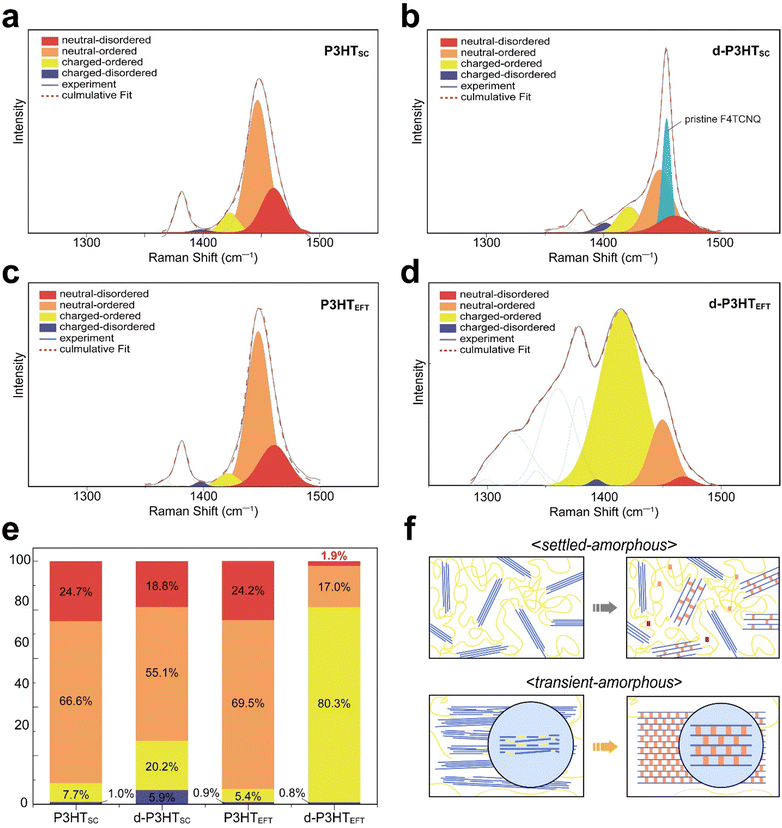
During the process of F4TCNQ doping, the presence of positively charged polarons impacts the distribution of delocalized electron charges along the polymer backbone. In the crystalline regions of the polymer, characterized by a stiff, planar backbone, the Coulomb force exerted by the delocalized charge is relatively weak. Consequently, the formation of polarons does not significantly alter bond lengths in these regions. However, in the amorphous regions, where the Coulomb force is stronger and interacts with localized charges, the creation of polarons results in noticeable changes in bond lengths. By extracting only the peaks corresponding to P3HT and its polaron-excluding the F4TCNQ anion peak-it becomes possible to differentiate between polarons formed on an ordered (crystalline) backbone, termed ordered-polarons, and those on a disordered (amorphous) backbone, referred to as disordered-polarons.37,38 The polarized Raman spectra of the uniaxially oriented d-P3HTEFT film satisfy this criterion, allowing for such a distinction. To ascertain the specific phase composition of the films, the C![[double bond, length as m-dash]](https://www.rsc.org/images/entities/char_e001.gif) C double bond region (1500–1300 cm−1) was subjected to deconvolution (Fig. 5a–d). The C–C vibration modes shown in Fig. 5 (noted as green dotted lines) were excluded for the composition calculations, since only the the C
C double bond region (1500–1300 cm−1) was subjected to deconvolution (Fig. 5a–d). The C–C vibration modes shown in Fig. 5 (noted as green dotted lines) were excluded for the composition calculations, since only the the C![[double bond, length as m-dash]](https://www.rsc.org/images/entities/char_e001.gif) C intra-ring vibration modes contribute to the charging of the conjugated thiophene backone.37–39 From the deconvolution data, the P3HTEFT film was composed of 24.0% neutral-disordered phase (1467 cm−1), 69.5% neutral-ordered phase (1444 cm−1), 5.4% charged-ordered phase (1421 cm−1), and 0.9% charged-disordered phase (1397 cm−1) (Fig. 5e). In the P3HTSC film, the phase distribution was 24.7% neutral-disordered phase, 66.6% neutral-ordered phase, 7.7% charged-ordered phase, and 1.0% charged-disordered phase, which is comparable to that of the P3HTEFT film. A trace amount of polaron was formed by oxidation from atmospheric oxygen prior to doping. After F4TCNQ doping, the composition of the d-P3HTEFT film altered to 1.9% neutral-disordered (1477 cm−1), 17% neutral-ordered (1443 cm−1), 80.3% charged-ordered (1412 cm−1), and 0.8% charged-disordered phase (1376 cm−1) (Fig. 5e). For the d-P3HTSC, the composition changed to 18.8% neutral-disordered, 55.1% neutral-ordered, 20.2% charged-ordered, and 5.9% of charged-disordered.
C intra-ring vibration modes contribute to the charging of the conjugated thiophene backone.37–39 From the deconvolution data, the P3HTEFT film was composed of 24.0% neutral-disordered phase (1467 cm−1), 69.5% neutral-ordered phase (1444 cm−1), 5.4% charged-ordered phase (1421 cm−1), and 0.9% charged-disordered phase (1397 cm−1) (Fig. 5e). In the P3HTSC film, the phase distribution was 24.7% neutral-disordered phase, 66.6% neutral-ordered phase, 7.7% charged-ordered phase, and 1.0% charged-disordered phase, which is comparable to that of the P3HTEFT film. A trace amount of polaron was formed by oxidation from atmospheric oxygen prior to doping. After F4TCNQ doping, the composition of the d-P3HTEFT film altered to 1.9% neutral-disordered (1477 cm−1), 17% neutral-ordered (1443 cm−1), 80.3% charged-ordered (1412 cm−1), and 0.8% charged-disordered phase (1376 cm−1) (Fig. 5e). For the d-P3HTSC, the composition changed to 18.8% neutral-disordered, 55.1% neutral-ordered, 20.2% charged-ordered, and 5.9% of charged-disordered.
The analysis indicates that the P3HTEFT film underwent a significant transformation from the disordered phase to the ordered phase after F4TCNQ doping. The disordered phase, which originally comprised 25.1% of the total content in the P3HTEFT, was reduced to only 2.7% in the d-P3HTEFT (Fig. 5e). This substantial decrease highlights the pronounced ordering effect induced by the doping process. In contrast, such an ordering effect was not observed in the P3HTSC film. The disordered phase, which originally comprised 25.7% of the total in the P3HTSC, remained virtually unchanged at 24.7% in the d-P3HTSC (Fig. 5e). This disparity suggests that the disordered amorphous phase can be categorized into two types, referred to as the transient-amorphous and settled-amorphous phases.
As previously discussed, the P3HTEFT forms a highly aligned structure while maintaining planarity of both thiophene and alkyl-side groups. However, there may be points where planarity is disrupted due to slightly rotated moieties or dislocation of polymer chains, contributing to the formation of the amorphous phase. These chains, however, can be readily ordered through the formation of polaron–anion pairs, which induce electrostatic interactions. In contrast, the polymer chains in the P3HTSC are randomly distributed and entangled, making it difficult to induce phase transition. Hence, the P3HTEFT predominantly forms the transient-amorphous phase, which can transform into the ordered crystalline phase through the doping process, while the P3HTSC mainly creates the settled-amorphous phase. This difference in the nature of the amorphous domains also leads to a significant difference in doping efficiency. As shown in Fig. 5e, the charged-ordered phase in the d-P3HTEFT dramatically increased from 5.4% to 80.3%, derived both directly from the neutral-ordered domain and from transformation of the disordered phase. In contrast, the d-P3HTSC only exhibited 20.2% of the charged-ordered phase, which is 4 times less than that of the d-P3HTEFT.
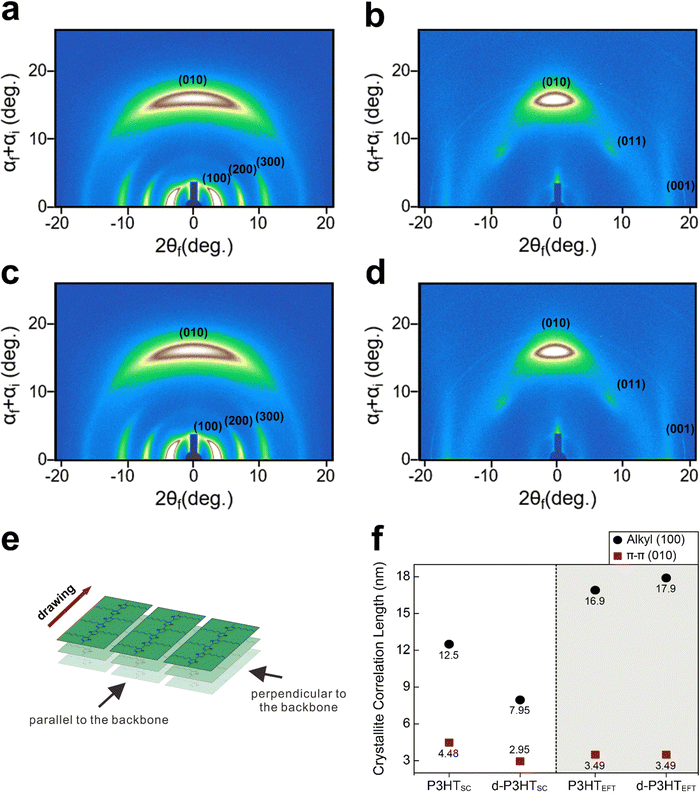
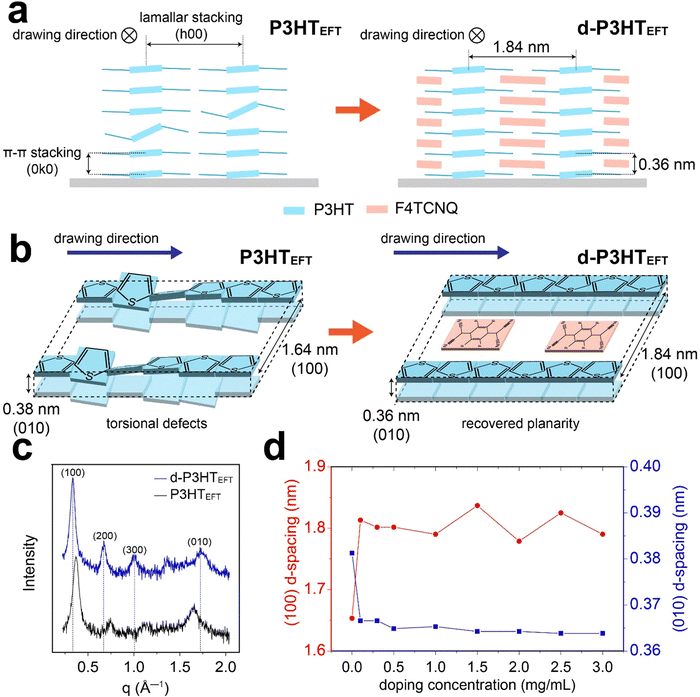
To better understand the P3HTEFT film, grazing-incidence wide-angle X-ray scattering (GIWAXS) experiments were conducted (Fig. 6). When the incident X-ray was parallel to the polymer backbone, high-order peaks, specifically the (100), (200), and (300) peaks, emerged in the in-plane region, while the (010) peak became prominent in the out-of-plane region (Fig. 6a–d). The d-spacing corresponding to the (100) and (010) peaks were 1.64 nm and 0.38 nm, respectively, which is consistent with the lamellar stacking distance and π–π stacking distance of P3HT.40,41 When the incident X-ray was perpendicular to the backbone, the diffraction pattern revealed the presence of the (010), (001), and (011) peaks (Fig. 6b and d). These observations suggest that the P3HTEFT film is uniaxially well-aligned with a face-on arrangement (Fig. 7a and b). Upon doping, the d-P3HTEFT film exhibited slight changes in the d-spacing: the lamellar stacking distance, represented by the (100) peak, expanded from 1.64 nm to 1.84 nm, while the π–π stacking distance, represented the (010) peak, contracted from 0.38 nm to 0.36 nm, all while preserving the crystal structure (Fig. 6a–d and 7c, d). In contrast, the P3HTSC film displayed isotropic characteristics with a broad amorphous band (Fig. S4, ESI†). Similar to the d-P3HTEFT film, the d-spacing of the (100) plane also increased from 1.6 nm to 1.8 nm, and the (010) plane decreased from 0.38 nm to 0.36 nm for the d-P3HTSC film. The crystallite correlation lengths for the lamellar and the π–π stacking distance were calculated using the Scherrer equation based on the (100) and (010) peaks, respectively (Fig. 6f and Fig. S5, ESI†). After doping, the correlation length for the lamellar stacking increased from 16.9 nm to 17.9 nm for the P3HTEFT film, while the correlation length for the π–π stacking remained unchanged. This suggests that the lateral ordering of the P3HTEFT was improved by doping. In contrast, the doping process hampered both the lateral and vertical ordering of the P3HTSC, as indicated by a decrease in the correlation length from 12.95 nm to 7.95 nm for lamellar stacking and from 4.48 nm to 2.95 nm for π–π stacking (Fig. 6f and Fig. S5, ESI†). Previous UV-VIS data revealed that the P3HTEFT film primarily consists of H-type packing but with a minor contribution from J-type packing. As depicted in Fig. 7a and b, this minor contribution of J-type packing may be attributed to torsional defects in the P3HTEFT structure. Upon F4TCNQ dopping, these torsional defects were corrected, leading to the conversion of J-type packing into H-type packing in the d-P3HTEFT film. These results indicate that defects in uniaxially aligned P3HTEFT polymer chains can be spontaneously removed during the doping process, leading to a significant increase in the crystallinity of d-P3HTEFT. Due to this improvement, the electrical conductivity of d-P3HTEFT was four orders of magnitude higher than that of d-P3HTSC (Fig. S6, ESI†).
Conclusion
In summary, we demonstrated the significant impact of eutectic friction transfer (EFT) and subsequent F4TCNQ doping on the structural ordering and electrical performance of uniaxially aligned P3HT films. The EFT method allowed for the creation of highly aligned P3HT films (P3HTEFT) with superior planarity compared to conventional spin-cast P3HT (P3HTSC). Upon p-doping with F4TCNQ, the P3HTEFT films exhibited a dramatic increase in the charged-ordered domain from 5.4% to 80.3%, facilitated by the spontaneous removal of defects. Characterization through polarized UV-VIS, FT-IR, Raman spectroscopy, and GIWAXS showed that the uniaxially aligned structure of P3HTEFT contributed to enhanced charge carrier mobility and crystallinity. The d-P3HTEFT films exhibited four orders of magnitude higher electrical conductivity compared to d-P3HTSC films, underscoring the benefits of anisotropic alignment for charge transport. In contrast, P3HTSC films retained a largely disordered phase after doping, highlighting the limitations of spin-cast films. Overall, the combination of uniaxial alignment via EFT and effective molecular p-doping proves to be a promising approach for enhancing the crystallinity and electrical performance of semiconducting polymer films, providing a valuable pathway for the development of organic electronic devices.Data availability
Further experimental details and supplementary figures are described in the ESI.†Author contributions
H. J. and S. E. designed and conducted experiments including sample preparation and most of measurements. S. C. assisted for the Raman measurements. T. V. V., J. H. S., J. C., S. P., S. K., S. B., and H. L. assisted with X-ray, FT-IR, POM, UV-VIS measurements. H. C. helped to analyze the data and revise the manuscript. Y. K. conceived and supervised the project.Conflicts of interest
There authors declare no competing financial interest.Acknowledgements
This research was supported by the National Research Foundation of Korea (NRF) and Korea Basic Science Institute (National Research Facilities and Equipment Center) grant funded by the Korea government (MEST) (No. 2020R1A2C2100802, RS-2024-00414824, 2022R1A6C101A779). X-ray experiments were conducted at 9A and 12D beamlines at Pohang Accelerator Laboratory (PAL), Korea. All other measurements were using instruments located at the Center for Polymers and Composite Materials (CPCM), Hanyang University, Korea.References
- K. Walzer, B. Maennig, M. Pfeiffer and K. Leo, Chem. Rev., 2007, 107, 1233–1271 CrossRef CAS PubMed
.
- X. Zhou, J. Blochwitz, M. Pfeiffer, A. Nollau, T. Fritz and K. Leo, Adv. Funct. Mater., 2001, 11, 310–314 CrossRef CAS
.
- M. Pfeiffer, A. Beyer, B. Plönnigs, A. Nollau, T. Fritz, K. Leo, D. Schlettwein, S. Hiller and D. Wöhrle, Sol. Energy Mater. Sol. Cells, 2000, 63, 83–99 CrossRef CAS
.
- S. Hwang, W. J. Potscavage, R. Nakamichi and C. Adachi, Org. Electron., 2016, 31, 31–40 CrossRef CAS
.
- A. Pron, P. Gawrys, M. Zagorska, D. Djurado and R. Demadrille, Chem. Soc. Rev., 2010, 39, 2577–2632 RSC
.
- X. Zhao and X. Zhan, Chem. Soc. Rev., 2011, 40, 3728–3743 RSC
.
- Y. H. Kang, S.-J. Ko, M.-H. Lee, Y. K. Lee, B. J. Kim and S. Y. Cho, Nano Energy, 2021, 82, 105681 CrossRef CAS
.
- E. H. Suh, Y. J. Jeong, J. G. Oh, K. Lee, J. Jung, Y. S. Kang and J. Jang, Nano Energy, 2019, 58, 585–595 CrossRef CAS
.
- B. Russ, A. Glaudell, J. J. Urban, M. L. Chabinyc and R. A. Segalman, Nat. Rev. Mater., 2016, 1, 1–14 Search PubMed
.
- R. Franz and G. Wiedemann, Ann. Phys., 1853, 165, 497–531 CrossRef
.
-
C. Kittel, Introduction to Solid State Physics, Jhon Wiley & Sons, 1996 Search PubMed
.
- A. Weathers, Z. U. Khan, R. Brooke, D. Evans, M. T. Pettes, J. W. Andreasen, X. Crispin and L. Shi, Adv. Mater., 2015, 27, 2101–2106 CrossRef CAS PubMed
.
- W. Shi, T. Zhao, J. Xi, D. Wang and Z. Shuai, J. Am. Chem. Soc., 2015, 137, 12929–12938 CrossRef CAS PubMed
.
- L. W. Shacklette, R. R. Chance, D. M. Ivory, G. G. Miller and R. H. Baughman, Synth. Met., 1980, 1, 307–320 CrossRef CAS
.
- C.-Y. Yang, W.-L. Jin, J. Wang, Y.-F. Ding, S. Nong, K. Shi, Y. Lu, Y.-Z. Dai, F.-D. Zhuang, T. Lei, C.-A. Di, D. Zhu, J.-Y. Wang and J. Pei, Adv. Mater., 2018, 30, 1802850 CrossRef PubMed
.
- A. M. Glaudell, J. E. Cochran, S. N. Patel and M. L. Chabinyc, Adv. Energy Mater., 2015, 5, 1401072 CrossRef
.
- D. T. Scholes, S. A. Hawks, P. Y. Yee, H. Wu, J. R. Lindemuth, S. H. Tolbert and B. J. Schwartz, J. Phys. Chem. Lett., 2015, 6, 4786–4793 CrossRef CAS PubMed
.
- A. Jha, H.-G. Duan, V. Tiwari, M. Thorwart and R. D. Miller, Chem. Sci., 2018, 9, 4468–4476 RSC
.
- M. Statz, D. Venkateshvaran, X. Jiao, S. Schott, C. McNeill, D. Emin, H. Sirringhaus and R. Di Pietro, Commun. Phys., 2018, 1, 1–10 CrossRef CAS
.
- J. Gao, A. Kamps, S.-J. Park and J. K. Grey, Langmuir, 2012, 28, 16401–16407 CrossRef CAS PubMed
.
- E. T. Niles, J. D. Roehling, H. Yamagata, A. J. Wise, F. C. Spano, A. J. Moulé and J. K. Grey, J. Phys. Chem. Lett., 2012, 3, 259–263 CrossRef CAS
.
- M. E. Ziffer, S. B. Jo, Y. Liu, H. Zhong, J. C. Mohammed, J. S. Harrison, A. K.-Y. Jen and D. S. Ginger, J. Phys. Chem. C, 2018, 122, 18860–18869 CrossRef CAS
.
- F. C. Spano and C. Silva, Annu. Rev. Phys. Chem., 2014, 65, 477–500 CrossRef CAS PubMed
.
- T. Degousée, V. Untilova, V. Vijayakumar, X. Xu, Y. Sun, M. Palma, M. Brinkmann, L. Biniek and O. Fenwick, J. Mater. Chem. A, 2021, 9, 16065–16075 RSC
.
- I. E. Jacobs, E. W. Aasen, J. L. Oliveira, T. N. Fonseca, J. D. Roehling, J. Li, G. Zhang, M. P. Augustine, M. Mascal and A. J. Moulé, J. Mater. Chem. C, 2016, 4, 3454–3466 RSC
.
- J. Gao, B. W. Stein, A. K. Thomas, J. A. Garcia, J. Yang, M. L. Kirk and J. K. Grey, J. Phys. Chem. C, 2015, 119, 16396–16402 CrossRef CAS
.
- J. Gao, E. T. Niles and J. K. Grey, J. Phys. Chem. Lett., 2013, 4, 2953–2957 CrossRef CAS PubMed
.
- T. P. Martin, A. J. Wise, E. Busby, J. Gao, J. D. Roehling, M. J. Ford, D. S. Larsen, A. J. Moulé and J. K. Grey, J. Phys. Chem. B, 2013, 117, 4478–4487 CrossRef CAS PubMed
.
- J. Gao, J. D. Roehling, Y. Li, H. Guo, A. J. Moulé and J. K. Grey, J. Mater. Chem. C, 2013, 1, 5638–5646 RSC
.
- S. Eom, J. H. Sim, J. Kim, N. B. Tran, M. M. Sung and Y. Kang, Nanoscale, 2020, 12, 23514–23520 RSC
.
- N. J. Hestand and F. C. Spano, Chem. Rev., 2018, 118, 7069–7163 CrossRef CAS PubMed
.
- V. Untilova, T. Biskup, L. Biniek, V. Vijayakumar and M. Brinkmann, Macromolecules, 2020, 53, 2441–2453 CrossRef CAS
.
- S. Nagamatsu and S. S. Pandey, Sci. Rep., 2020, 10, 20020 CrossRef CAS PubMed
.
- P. Pingel and D. Neher, Phys. Rev. B: Condens. Matter Mater. Phys., 2013, 87, 115209 CrossRef
.
- P. Hu, H. Li, Y. Li, H. Jiang and C. Kloc, CrystEngComm, 2017, 19, 618–624 RSC
.
- K. E. Watts, B. Neelamraju, E. L. Ratcliff and J. E. Pemberton, Chem. Mater., 2019, 31, 6986–6994 CrossRef CAS
.
- W. C. Tsoi, D. T. James, J. S. Kim, P. G. Nicholson, C. E. Murphy, D. D. C. Bradley, J. Nelson and J.-S. Kim, J. Am. Chem. Soc., 2011, 133, 9834–9843 CrossRef CAS PubMed
.
- B. Sainbileg, Y.-B. Lan, J.-K. Wang and M. Hayashi, J. Phys. Chem. C, 2018, 122, 4224–4231 CrossRef CAS
.
- J. Nightingale, J. Wade, D. Moia, J. Nelson and J.-S. Kim, J. Phys. Chem. C, 2018, 122, 29129–29140 CrossRef CAS
.
- H. Méndez, G. Heimel, S. Winkler, J. Frisch, A. Opitz, K. Sauer, B. Wegner, M. Oehzelt, C. Röthel, S. Duhm, D. Többens, N. Koch and I. Salzmann, Nat. Commun., 2015, 6, 8560 CrossRef PubMed
.
- E. Lim, K. A. Peterson, G. M. Su and M. L. Chabinyc, Chem. Mater., 2018, 30, 998–1010 CrossRef CAS
.
Footnotes |
| † Electronic supplementary information (ESI) available. See DOI: https://doi.org/10.1039/d4tc04913f |
| ‡ These authors contributed equally to this work. |
| This journal is © The Royal Society of Chemistry 2025 |

