
 Open Access Article
 This Open Access Article is licensed under a
 Creative Commons Attribution 3.0 Unported Licence
Heliconical smectic phases with transversal polar order†
Mohamed
Alaasar
 *ab,
Marko
Prehm
a,
Maria-Gabriela
Tamba
c,
Nerea
Sebastian
c,
Alexey
Eremin
*c,
Yuri P.
Panarin
d,
Jagdish K.
Vij
d and
Carsten
Tschierske
*a
*ab,
Marko
Prehm
a,
Maria-Gabriela
Tamba
c,
Nerea
Sebastian
c,
Alexey
Eremin
*c,
Yuri P.
Panarin
d,
Jagdish K.
Vij
d and
Carsten
Tschierske
*a
aDepartment of Chemistry, Martin-Luther University Halle-Wittenberg, Kurt Mothes Str. 2, 06120 Halle, Saale, Germany. E-mail: mohamed.alaasar@chemie.uni-halle.de; carsten.tschierske@chemie.uni-halle.de
bDepartment of Chemistry, Faculty of Science, Cairo University, 12613 Giza, Egypt. E-mail: malaasar@sci.cu.edu.eg
cDepartment of Nonlinear Phenomena, Institute for Physics Otto von Guericke University Magdeburg, Magdeburg, Germany. E-mail: alexey.eremin@ovgu.de
dDepartment of Electronic and Electrical Engineering, Trinity College, Dublin, The University of Dublin, Dublin 2, Ireland
First published on 14th May 2025
Abstract
Liquid crystalline (LC) materials integrating polar order and mirror symmetry-broken helical superstructures are of growing interest for advanced applications. We report a new series of achiral bent-core LCs based on 4-cyanoresorcinol bis-terephthalate cores with end-chains ranging from OC2H5 to OC20H23. For chains ≥OC6H13, all compounds form smectic phases which exhibit a paraelectric-to-(anti)ferroelectric transition with Curie–Weiss type divergence, accompanied by an onset of molecular tilt leading to a SmA–SmC phase transition. Increasing chain length induces a tilt correlation crossover from anticlinic (alternating, SmCa) to synclinic (uniform, SmCs) ordering. Notably, a stable heliconical smectic phase with a helical axis perpendicular to the polar layers (Sm(CP)hel) emerges near this crossover. Application of an alternating electric field further expands the Sm(CP)hel stability range, replacing the SmCs phase and vanishing near SmCa. The helical superstructure – spanning C10 to C20 chains and a temperature range up to 80 K – is attributed to synergistic effects of the polar cyano apex, weak molecular bending, and transient helicity. These transversely polarized heliconical phases complement the recently reported longitudinally polarized analogues, offering new pathways for designing chiral LCs from achiral molecules.
1. Introduction
Liquid crystalline (LC) materials1–3 are omnipresent in numerous technological applications as for example in optical, electrooptical, chiroptical and nonlinear optical devices,4,5 for biomedical sensing,1a,6 as photoconductive and charge carrier mobility materials,1d and many others.7,8 Prof. H. Ringsdorf contributed in different fields to the development of LC research, including polymeric LCs,1b photoconducting discotic LCs,1d amphotropic LCs,1a and donor–acceptor systems.1c Especially his landmark review from 19881a provided a broader view on this field as a state of matter combining order and chaos, leading to their capability to respond to external stimuli and being of basic importance for new materials as well as for the functionality of biologically relevant structures. Besides their switchability due to the unique combination of long-range order with molecular mobility,1a the capability of formation of helical superstructures,5,9–13 and the development of long-range polar order (ferroelectricity and antiferroelectricity) are of special contemporary relevance for their applications.2,14Bent-core LCs (BCLCs, banana-shaped LC, Fig. 1a, middle) were the first materials showing polar order due to the restriction of molecular rotation around their long axes (steric induced polar order).9,15–17 For these compounds the polarization direction is transversal to the layer normal (Fig. 2a).
 | ||
| Fig. 1 (a) Modes of polar order in achiral rod-like and bent-core liquid crystals and (b) structure of the 4-cyanoresorcinol derived LCs under discussion. | ||
 | ||
| Fig. 2 (a) Notations of the polar tilted smectic (SmC type) LC phases of bent core molecules; SmCS = synclinic tilt (identical tilt direction) and SmCa = anticlinic tilt (alternating tilt direction);16b dots and crosses indicate the polar direction being oriented into or out of the plane, respectively; (b) and (c) schematic sketches of the heliconical organizations (b) of bent-core mesogens in a heliconical phase with transversal polarization and (c) of polar rod-like molecules (black arrows) in a heliconical phase with longitudinal polarization; note that the heliconical pitch is not drawn in scale; while the helix in (b) is actually shorter, in (c) it is much longer; moreover only one sign of helicity is shown. | ||
In recent years polar LC phases with longitudinal polarization, i.e. along the molecular long axis, were surprisingly also found for achiral rod-like molecules without any bend, where the spontaneous parallel alignment of the molecular dipoles18 leads to ferroelectric versions of the apolar lamellar (SmA, SmC)19–21 and nematic (N) phases (see Fig. 1a, left).22–25 These fluid longitudinal ferroelectric LCs,26 formed by molecules with highly polar end-groups like NO2 or multiple fluorines, show polarization values exceeding any other ferroelectric LC, reaching and even exceeding the values of related inorganic solid-state materials.27
However, in soft matter systems the electrostatic energy of polar ordered states often induces a polarization splay leading to a helical twist, which then gives rise to a helical organization and spontaneous mirror symmetry breaking.9 Thus, for these polar phases helical superstructures (Fig. 2b and c) can often be found. The helix sense is uniform for chiral molecules,14 while for achiral molecules both signs of helicity coexist (ambidextrous chirality).28–31 The developing helix can distort and modulate the layers, leading to isotropic mesophases.9,32 However, if the helix axis is parallel to the layer normal, then flat layers are retained in the resulting heliconical smectic phases. The first heliconical smectic phase formed by achiral molecules was discovered for 4-cyanoresorcinol based bent-core molecules 1/n with two n-alkyl end-chains, shown in Fig. 1b and abbreviated as Sm(CP)hel (also SmCsPhelF or SmCPα were used previously).33–38 For these compounds with a polar CN group at the apex, the polar direction of the layers rotates transversal to the layer normal (=transversal polarization, see Fig. 2b). In the meanwhile, also a nonpolar version of this heliconical phase was reported for achiral bent mesogenic dimers (SmCTB).39 More recently, longitudinal polar versions with the polar axis rotating on a cone around the layer normal (SmChelF, SmCHP, see Fig. 2c)29 were also reported for achiral polar rod-like molecules. Table 1 summarizes the (to the best of our knowledge) presently known mirror-symmetry broken, nematic40,41 smectic32,42–44 and isotropic45 mesophases of achiral rod-like and bent molecules with their abbreviations and main characteristics.
| LC phase | Molecule type | Polarization | Layers | Tilt | Year | Ref. |
|---|---|---|---|---|---|---|
| a Only fluid mesophases without fixed positions of individual molecules and without in-plane periodicity are considered, soft crystalline (B4, HNF, HNC, etc.)9d,f,11–13 and columnar phases are not included. Abbreviations: N = nematic, SmC = tilted smectic LC phase; for the abbreviations of polar phases of bent molecules, see Fig. 2a. [*] and DC (“dark conglomerate”) = chiral conglomerates in isotropic or low birefringent mesophases, observable by POM; hel, H, HC = helical/heliconical superstructures; TB = twist-bend phases; molecule types: BC = bent-core; BD = bent dimesogen; PR = polar rod; polarization modes: L = longitudinal and T = transversal direction of polarization. b folded and twisted layers leading to an amorphous and isotropic sponge-like structure. | ||||||
| DC[*] | BC | T | √b | √ | 2000 | 32 |
| N[*] | BC | — | — | — | 2002 | 40 |
| NTB (NPT, NX) | BD, BC | — | — | — | 2010 | 41 |
| Iso[*] | Polycatenar | — | — | — | 2014 | 45 |
| Sm(CP) hel (SmC S P helF , SmCP α ) | BC | T | √ | √ | 2016 | 33 |
| SmCTB | BD | — | √ | √ | 2018 | 39 |
| NF[*] | PR | L | — | — | 2023 | 31 |
| NhelF (HCNF, NTBF) | PR | L | — | — | 2024 | 28 |
| SmChelF (SmCHP) | PR | L | √ | √ | 2024 | 29 |
As noted above, the heliconical smectic phase with transversal polarization (Sm(CP)hel) was discovered for the n-alkyl substituted bent-core compounds 1/n (Fig. 1b), suggesting that the polar CN group at the apex plays a critical role in formation of this phase. Notably, no other BCLC lacking the 4-cyanoresorcinol core has exhibited such phase. However, the two previously known compounds 1/O8 and 1/O12 with alkyloxy instead of alkyl chains (Fig. 1b) were reported to form only nonpolar and polar orthogonal smectic phases (SmA and SmAPA),46,47 This discrepancy prompted us to reinvestigate these two compounds and to complete this series (1/On, n = 2 to 20) to elucidate the chain-length dependence of the Sm(CP)hel phase formation, and the effect of the ether oxygens on Sm(CP)hel formation.
Here we demonstrate that indeed compounds 1/On (including 1/O12) can exhibit stable heliconical Sm(CP)hel phases, while those of the series 1/n are only metastable. Furthermore, treatment with an alternating electric field substantially enhances the thermal stability range of the Sm(CP)hel phase by suppressing competing phases, including 3D modulated phases (M1/M2) and non-helical synclinic SmCsPA phases. This leads to remarkably broad chain length and temperature ranges for the Sm(CP)hel phases, significantly wider than those observed in the series 1/n. Interestingly, the transition to the anticlinic SmCaPA phase removes Sm(CP)hel, it even cannot be field induced in this phase range. The formation of this helical superstructure is attributed to synergistic effects of the polar and electron withdrawing CN apex,48 weak molecular bending,49 and transient molecular helicity.12a,50 The complete 1/On series is discussed in relation to related molecules. Based on the investigations, general conditions for the heliconical phase formation are proposed.
2. Materials and methods
2.1 Synthesis
Compounds 1/On with n = 2, 4, 10, 11, 12 and 16–20 were synthesized according to Scheme 1 by acylation of 4-cyanoresorcinol C49 with 4-[4-n-alkyloxyphenoxycarbonyl]benzoic acids A/n, which were obtained by acylation of 4-alkyoxyphenols with 4-formylbenzoic acid followed by oxidation of CHO to COOH.51 The detailed synthetic procedures and analytical data are reported in the ESI.† Compounds 1/O8 and 1/O12 have been reported previously by Weissflog et al.46 and their phase sequences have been reinvestigated, corrected and updated. The homologs 1/O652 and 1/O1453 have been reported in previous communications and are included here for comparison, but not discussed in more detail. | ||
| Scheme 1 Synthetic route to the bent-core mesogens 1/On. | ||
2.2. Investigation methods
The self-assembly of compounds 1/On was studied by polarizing optical microscopy (POM), differential scanning calorimetry (DSC), X-ray scattering (XRS, small-angle scattering and wide-angle scattering, SAXS and WAXS), electro-optical investigations and some of them by dielectric studies, second harmonic generation (SHG) and in free-standing films by the methods and the equipment described in the ESI.†3. Results and discussion
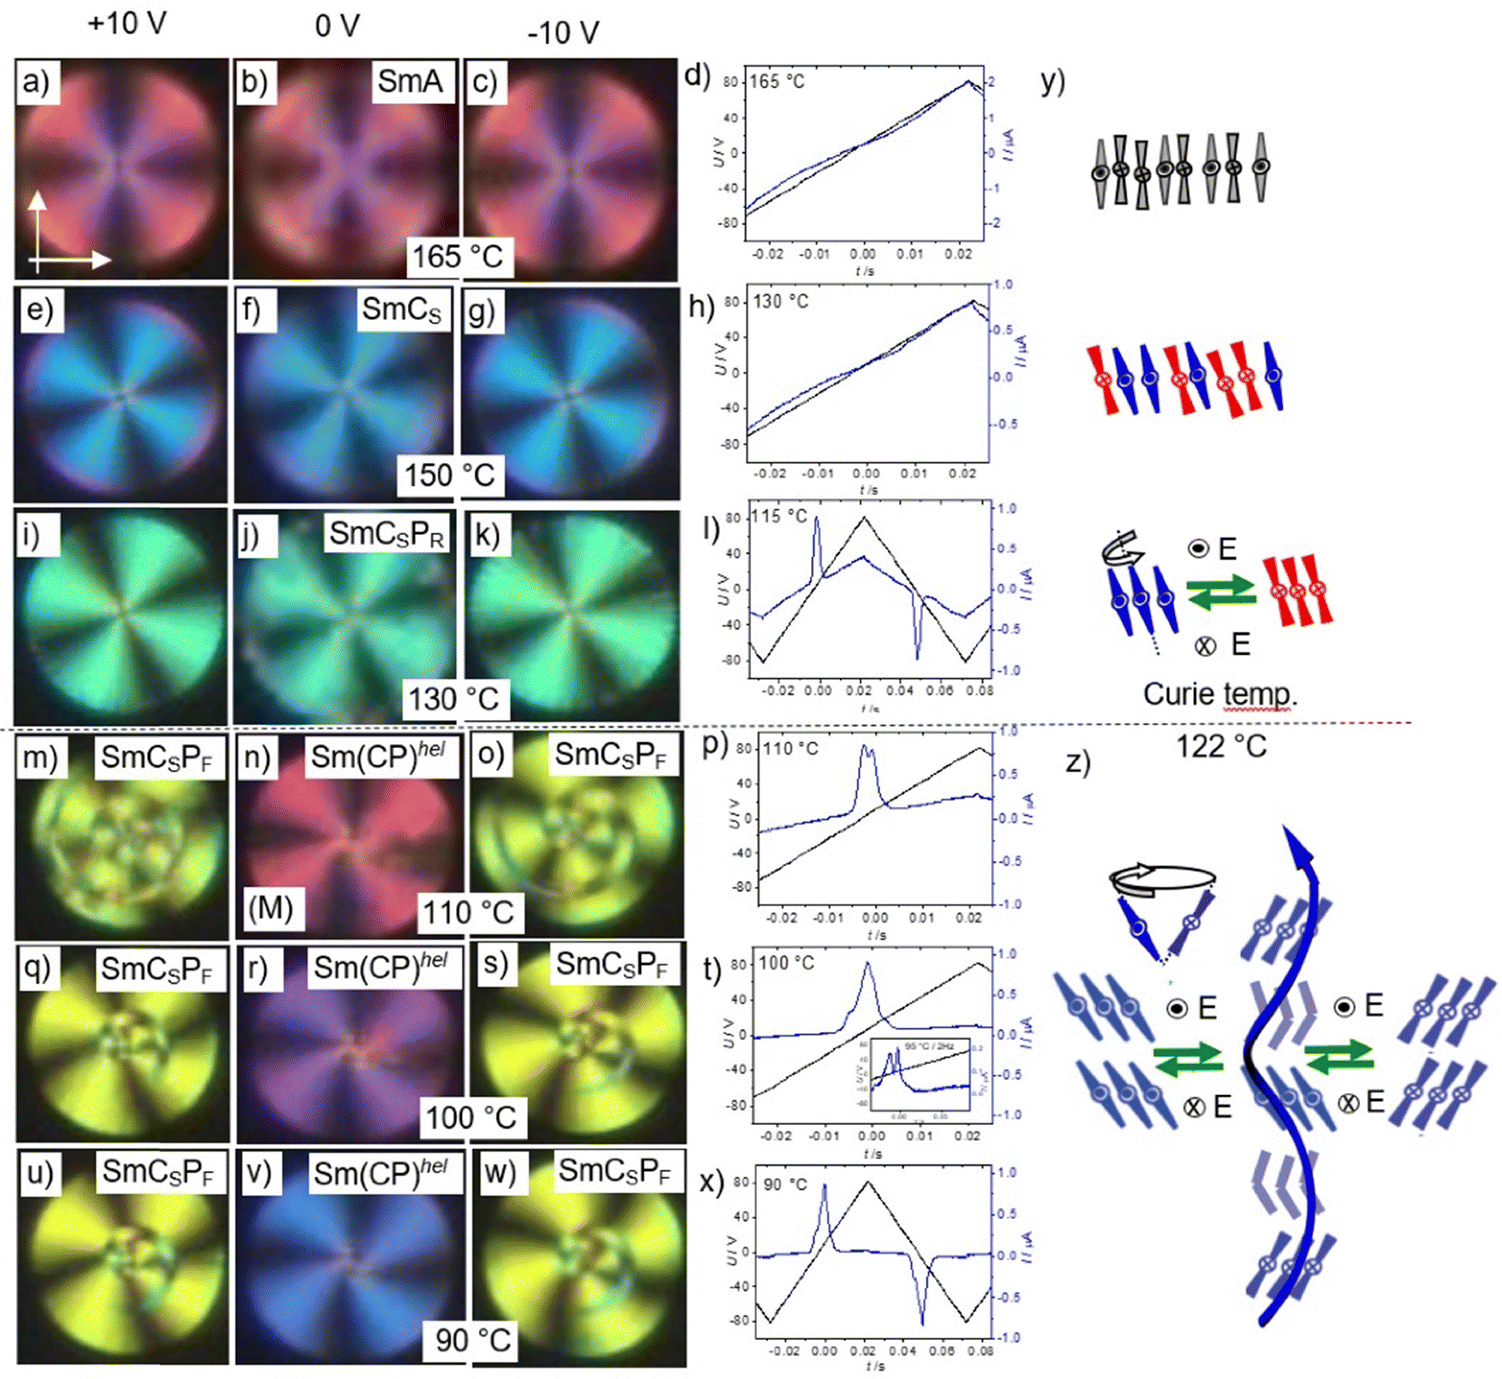
The transition temperatures and the associated enthalpies for the 1/On compounds are summarized in Table 2 and the data on cooling are shown graphically in Fig. 3. In principle the compounds can be divided into three groups, the short-chain compounds 1/O2–1/O8 forming nematic (N) and smectic phases with emerging anticlinic tilt and polar order (SmA, SmAPR, SmCaPA). The second group of medium chain compounds 1/O10–1/O14 is characterized by a transition to synclinic tilt (SmCSPA) and emergence of heliconical phases (Sm(CP)hel), while for the long chain compounds 1/O16–1/O20 the synclinic tilt becomes more dominant at higher temperature and is replaced by anticlinic tilt at lower temperature (SmCaPA), and the heliconical phases can only be field-induced. For the two latter groups, additional 3D modulated mesophases M1/M2 can be observed (Fig. 3). In the following the development of soft self-assembly across these three groups will be discussed step-by-step.| Comp. | T (°C) [ΔH (kJ mol−1)] |
|---|---|
| a Peak temperatures from second DSC heating/cooling scans (10 K min−1). Curie temperatures are in bold. Arrows indicate heating (→) and cooling (←), E = phase sequence observed upon cooling after application of few cycles of an alternating E-field (on–off switching of a DC field). Transitions without enthalpy were determined by POM or other investigations; abbreviations: Cr = crystalline solid, Iso = isotropic liquid, NCybA = nematic phase with cybotactic clusters of the SmA-type, SmA = uniaxial lamellar phase; SmAPR = high permittivity paraelectric SmA phase range showing ferroelectric-like switching with only one broad polarization current peak per half-period of an applied E-field; SmAPAR = high permittivity paraelectric SmA phase showing two broad polarization current peaks; SmCaPR = high permittivity paraelectric SmCa phase showing ferroelectric-like switching; Sm(CP)hel = heliconical polar smectic phase; SmCsPA = antiferroelectric switching polar synclinic tilted SmC phase; SmCaPA = antiferroelectric switching polar anticlinic tilted SmC phase; M1 = birefringent and highly viscous mesophase with mosaic texture and unknown structure; M2 = modulated lamellar phase with low birefringence, high viscosity and still unknown precise structure; the M1/M2 ranges were determined by POM investigation of homeotropic samples. The Curie temperatures and heliconical phases are indicated in bold. b First heating scan. c SmCaPA is observed in planar cells and M1 in homeotropic alignment and in free-standing films. d This compound was investigated previously, for details see ref. 52. e This compound was reported in ref. 46 and the original sample was reinvestigated herein, the previously reported SmAPA range turned out to represent SmCaPA and SmAPAR phases; the small differences in transition temeratures result from using DSC data instead of optical. f This compound was reported in ref. 46 and was resynthesized; the DSC transitions are close to those reported previously, while the phase sequence turned out to be different due to the presence of Sm(CP)hel and weakly tilted smectic phases which were previously interpreted as nontilted phases. g This compound was reported in ref. 53, the initially proposed SmCaPA range below 110 °C tuned out to represent SmCsPA; the pristine Sm(CP)hel phase was named SmCPα, but the field induced Sm(CP)hel phase was previously not recognized and this has lead to the initial interpretation as an anticlinic tilted phase. For DSC traces, see Fig. S9 (ESI), for XRD data, see Fig. S10–S25 and Tables S1–S13 (ESI). | |
| 1/O2 | → Cr 154[32.3] NCybA 194[0.8] Iso → |
| ← Cr 86[14.9] NCybA 192[0.8] Iso ← | |
| 1/O4 | → Cr 126[28.8] SmCa 129[1.5] SmA 165[1.2] NCybA 170[0.8] Iso → |
| ← Cr 85[18.9] SmCa 127[1.7] SmA 164[1.3] NCybA 168[1.0] Iso ← | |
| 1/O6 | → Cr 103[18.6] SmCaPA144[1.6] SmAPAR 150[−] SmAPR → SmA 179[6.2] Iso → |
| ← Cr 74[13.8] SmCaPA142[1.5] SmAPAR 148[−] SmAPR ← SmA 177[6.2] Iso ← | |
| 1/O8 | → Cr 112[32.0]b SmCaPA141[0.9] SmAPR→ SmA 189[8.2] Iso → |
| ← Cr 65[13.0] SmCaPA139[1.0] SmAPR ← SmA 186[8.2] Iso ← | |
| 1/O10 | → Cr 96[19.3] SmCSPA 122[−] SmCaPA ∼134 SmCaPA/M1c139[0.7] SmCaPR ∼145[−] SmAPR → SmA 189[9.0] Iso → |
| ← Cr 65[13.7] SmCSPA 110[−] SmCaPA ∼130 SmCaPA/M1c138[0.8] SmCaPR ∼143[−] SmAPR ← SmA 186[9.2] Iso ← | |
| E: Cr 65 Sm(CP)hel ∼ 95 SmCaPA138 SmCaPR ← SmAPR ← SmA 186 Iso ← | |
| 1/O11 | → Cr 93[18.7] SmCSPA 134[−] Sm(CP)hel136[1.0] SmCaPR 139[−] SmAPR → SmA 189[9.3] Iso → |
| ← Cr 61[12.9] SmCSPA 126[−] Sm(CP)hel 131[−] M1 135[1.0] SmCaPR 138[−] SmAPR ← SmA 187[9.6] Iso ← | |
| E: Cr 61 Sm(CP)hel135 SmCaPR ←SmAPR ← SmA 187 Iso ← | |
| 1/O12 | → Cr 111[36.8] SmCSPA136[1.2] SmCaPR 143[−] SmAPR → SmA 191[9.3] Iso → |
| ← Cr 60 [26.2] SmCSPA 106 [−] Sm(CP)hel133[1.2] SmCaPR 143[−] SmAPR ← SmA 190 [9.7]Iso ← | |
| E: Cr 60 Sm(CP)hel133 SmCaPR 143 SmAPR ← SmA 190 Iso ← | |
| 1/O14 | → Cr 104[36.6] SmCSPA (125[−] Sm(CP)hel/M1) 136[1.7] SmCPR 146[−] SmA 192[9.3] Iso → |
| ← Cr 65[29.7] SmCSPA (115[−] Sm(CP)hel/M1) 133[1.7] SmCPR 145[−] SmA 190[9.7] Iso ← | |
| E: Cr 65 Sm(CP)hel133 SmCPR 145 SmA 190 Iso ← | |
| 1/O16 | → Cr 91[41.7] SmCaPA ∼ 90[−] SmCSPA 117 M2 129[1.4] SmCSPR154[−] SmA 185[8.7] Iso → |
| ← Cr 68[35.4] SmCaPA ∼ 90[−] SmCSPA 115 M2 127[1.3] SmCSPR 152[−] SmA 183[8.8] Iso ← | |
| E: Cr 68 Sm(CP)hel127 SmCSPR 152 SmA 183 Iso ← | |
| 1/O18 | → Cr 98[60.5] SmCSPA/M2 128[1.3] SmCSPR → SmCS 158[−] SmA 183[8.3] Iso → |
| ← Cr 79[49.7] SmCaPA ∼ 85[−] SmCSPA/M2 126[1.4] SmCSPR ← SmCS 156 [−] SmA 180[8.2] Iso ← | |
| E: Cr 79 SmCaPA ∼ 85 Sm(CP)hel126 SmCSPR ← SmCs 156 SmA 180 Iso ← | |
| 1/O20 | → Cr 102[81.0] SmCSPA/M2 124[1.4] SmCSPR → SmCS 155[−] SmA 181 [7.2] Iso → |
| ← Cr 87[53.6] SmCaPA 90–100[−] SmCSPA/M2 122[1.4] SmCSPR ← SmCS 153[−] SmA 178[7.1] Iso ← | |
| E: Cr 87 SmCaPA ∼90 Sm(CP)hel122 SmCSPR ← SmCS 153 SmA 178 Iso ← | |
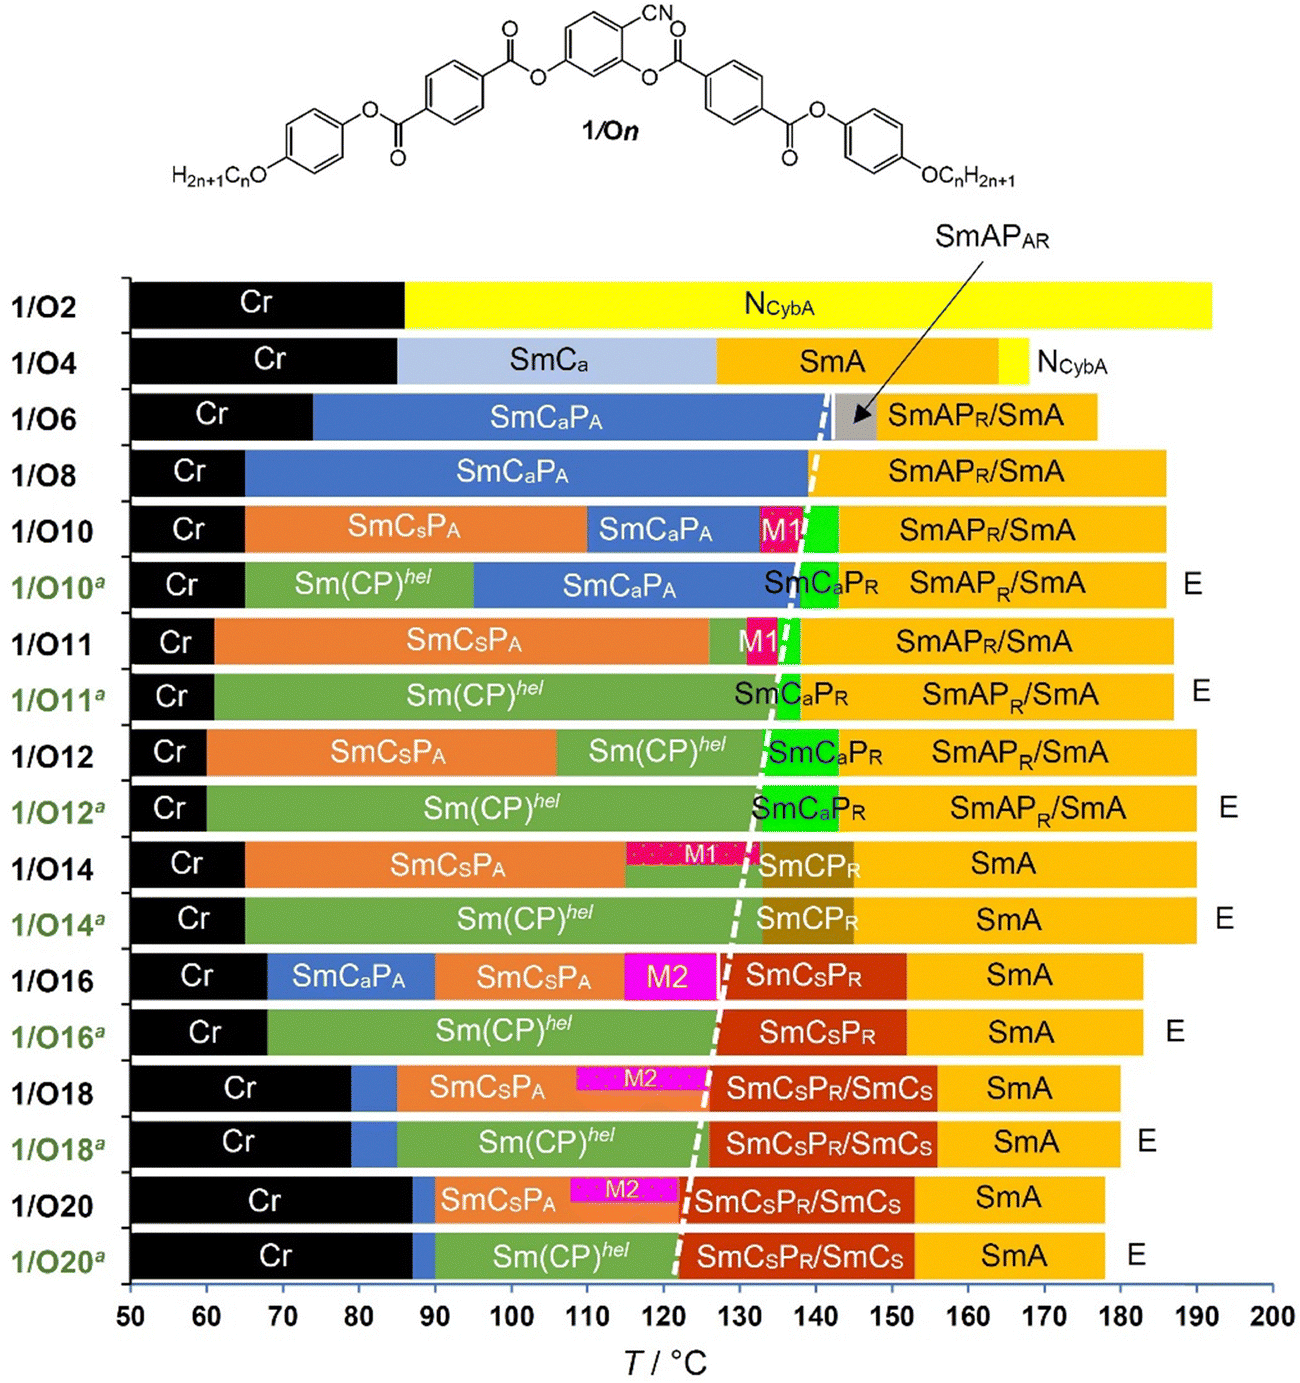 | ||
| Fig. 3 Bar diagram of compounds 1/On showing the development of the LC phases on cooling and depending on chain length (see Table 2 for abbreviations and numerical values). aE indicates transitions after treatment with few cycles of an alternating electric field; the dashed white line indicates the approximate chain-length dependence of the Curie temperatures of the paraelectric–ferroelectric transition. | ||
3.1. Compounds 1/O2–1/O8 – cybotactic nematic phases and transition to smectic phases
Compounds 1/O2 and 1/O4 (Fig. 3) with the shortest terminal chains form an enantiotropic nematic phase upon cooling from the isotropic liquid state (Fig. 4c). The XRD pattern of a magnetically oriented sample (B ≈ 1 T, see Fig. 4a and b) of the nematic phase of 1/O4 shows a diffuse WAXS with a maximum at d = 0.48 nm located on the equator and a diffuse SAXS with a single maximum at d = 3.58 nm on the meridian, being comparable with the molecular length Lmol = 4.0 nm (determined for a Λ-shaped conformation with 120° bending angle and stretched alkyl chains). This diffraction pattern, indicates a nematic phase composed of cybotactic SmA clusters (NCybA).44a,54 It is noted that this type of nematic phase is rare as most nematic phases of bent-core LCs are composed of tilted cybotactic SmC clusters (NCybC).55,56 | ||
| Fig. 4 Data of compound 1/O4 upon cooling. Left and middle column: XRD patterns of a magnetically aligned sample (B = 1 T); (a), (d), (g) and (j) show the complete patterns after subtraction of the scattering in the isotropic liquid state at 172 °C; (b), (e), (h) and (k) show the small angle patterns; (c), (f), (i) and (l) show the POM textures between two non-treated glass plates in the different LC phases at the indicated temperatures; in (c) optically isotropic areas are homeotropic aligned areas, homeotropic alignment is retained in (f), (i) and (l); white arrows in (a) show the direction of the applied magnetic field (B) and in (f) the directions of polarizer (P) and analyzer (A); for textures in planar cells and polarization current curves, see Fig. S27 (ESI†), for textures of 1/O2, see Fig: S26 (ESI†). | ||
Upon cooling, the nematic phase of 1/O4 the diffuse SAXS condenses into a sharp layer reflection with d = 3.66 nm and its second order on the meridian (Fig. 4e) indicating the transition to a smectic phase. The layer reflection remains perpendicular to the maximum of the diffuse WAXS on the equator (Fig. 4d), as typical for a non-tilted SmA phase. However, the layer reflections are elongated parallel to the equator, indicating some orientational order distribution in this SmA phase. Optical investigations under a polarizing microscope confirm the nematic phase which easily aligns completely homeotropic (Fig. 4c). The optically isotropic (black) appearance in the homeotropic alignment is retained across the N-SmA transition (Fig. 4f) and at the next transition at T = 127 °C a birefringent schlieren texture emerges which increases in birefringence on further cooling (Fig. 4i and l). This indicates the onset of phase biaxiality at the transition at 127 °C, due to a transition from random to uniform tilt in the layers. A slight decrease of the layer spacing can be observed at this transition (Fig. S12, ESI†), suggesting a small increase of a molecular tilt in the layers. The striped texture (Fig. 4i) of the homeotropic sample and the horizontally (parallel to the equator) expanded layer reflection (Fig. 4h and k) are in line with an anticlinic tilted SmCa phase with a small tilt angle.57 There is no visible response upon application of an electric field in the SmA as well in the SmCa range; therefore, we consider both phases as apolar or weakly paraelectric (Fig. S27, please note that the small broad peak is already observed in the Iso phase and could be due to a dielectric response or a conductivity, ESI†).
3.2. Compounds 1/O6 and 1/O8 – emergence of polar order
For the following compounds 1/On with n = 6–20 the nematic phase is removed, and exclusively lamellar phases can be observed (Fig. 3). For example, upon cooling compound 1/O8,46 an optical uniaxial smectic phase (SmA) is formed at 189 °C (Fig. 5a, b and Fig. S28a, ESI†) which shows a broad single current peak in each half period of an applied triangular electric wave field (Fig. 5c). Close to the Iso-SmA transition it is very weak and grows on cooling, meaning that the SmA phase is paraelectric and small ferroelectric grains grow in size with lowering temperature (Fig. S28a, ESI†), thus leading to a high permittivity (“superparaelectric”) range of the SmA phase (below ∼150 °C), designated as SmAPR.58 On further cooling the texture of the homeotropic sample becomes birefringent at the phase transition around 139 °C (Fig. 5f and Fig. S9c, ESI†), indicating emerging phase biaxiality due to the onset of an anticlinic tilt. Simultaneously, the broad polarization current peak vanishes, and two sharp current peaks appear (Fig. 5g), indicating the transition to an antiferroelectric switching anticlinic tilted smectic phase (SmCaPA). The spontaneous polarization is about 500–700 nC cm−2, representing typical values for bent-core mesogens. The switching in this SmCaPA phase takes place by rotation of the molecules around their long axis (SmCaPA ↔ SmCaPF),59 as typically observed for the weakly bent 4-cyanoresorcinol based mesogens.37,49 Therefore, the switching process cannot be detected optically by a rotation of the dark extinction crosses, but only by slight textural and birefringence colour changes (Fig. 5d, e and Fig. S28c, ESI†).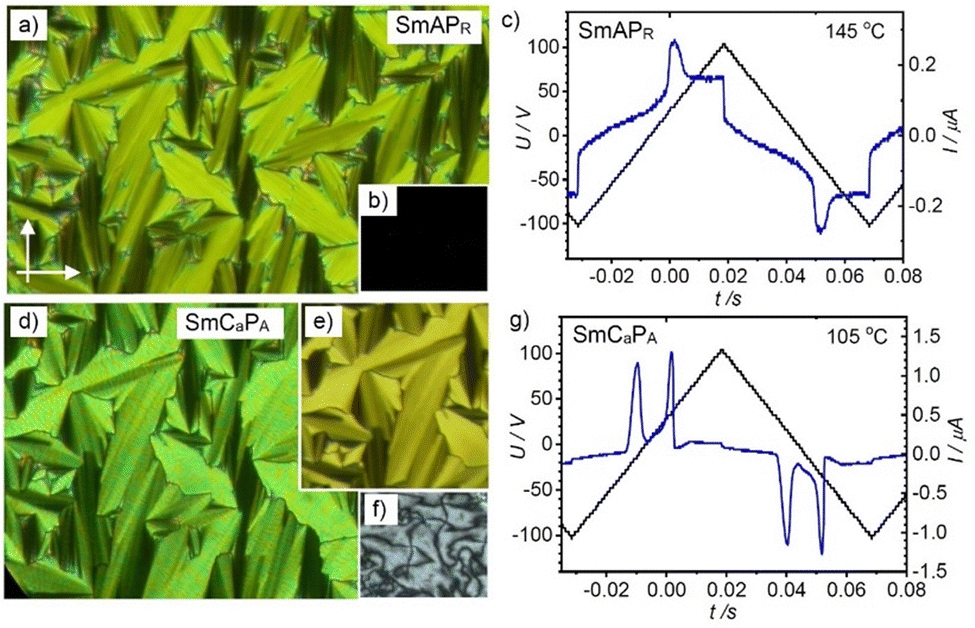 | ||
| Fig. 5 POM textures (left) and polarization current response curves (right) of compound 1/O8: (a)–(c) in the SmAPR phase at 145 °C and (d)–(g) in the SmCaPA phase at 105 °C, (a) and (d) showing planar textures (PI coated ITO cell 6 μm) in (a) and (d) without applied field and in (e) under an applied field of +10 V μm−1; (b) and (f) show the homeotropic textures without applied field, for additional data, see Fig. S28 (ESI†). | ||
The development of polar order was previously studied in detail for compound 1/O6.52 For this compound an additional high permittivity SmAPAR range, appears between SmAPR at higher and SmCaPA at lower temperature. In the SmAPAR range the broad single polarization current peak of SmAPR splits into two broad peaks,60 leading to the phase sequence SmA → SmAPR → SmAPAR → SmCaPA (Fig. 3 and Table 2). While in SmAPAR the correlation between ferroelectric grains is antipolar, in SmAPR it is synpolar (ferroelectric).52 This means that upon lowering temperature only for 1/O6 antipolar correlation sets in already before macroscopic polar order evolves, while for 1/O8 it coincides with this transition. The removal of SmAPAR at the transition from 1/O6 to 1/O8 indicates an increasing tendency towards synpolar correlation with growing chain length. For both compounds the anticlinic tilt develops together with the onset of macroscopic polarization at the transition from the high permittivity paraelectric phase to SmCaPA.
Compounds 1/O6 and 1/O8 and all following homologues show similar DSC curves having only one lambda-shaped peak with a relatively small enthalpy around ΔH ∼ 1 kJ mol−1 in the whole LC temperature range (see Fig. 6a and Fig. S9, ESI†). In all cases this peak is associated with the onset of macroscopic polar order at the paraelectric–(anti)ferroelectric transition, as confirmed by the dielectric investigations described further below.
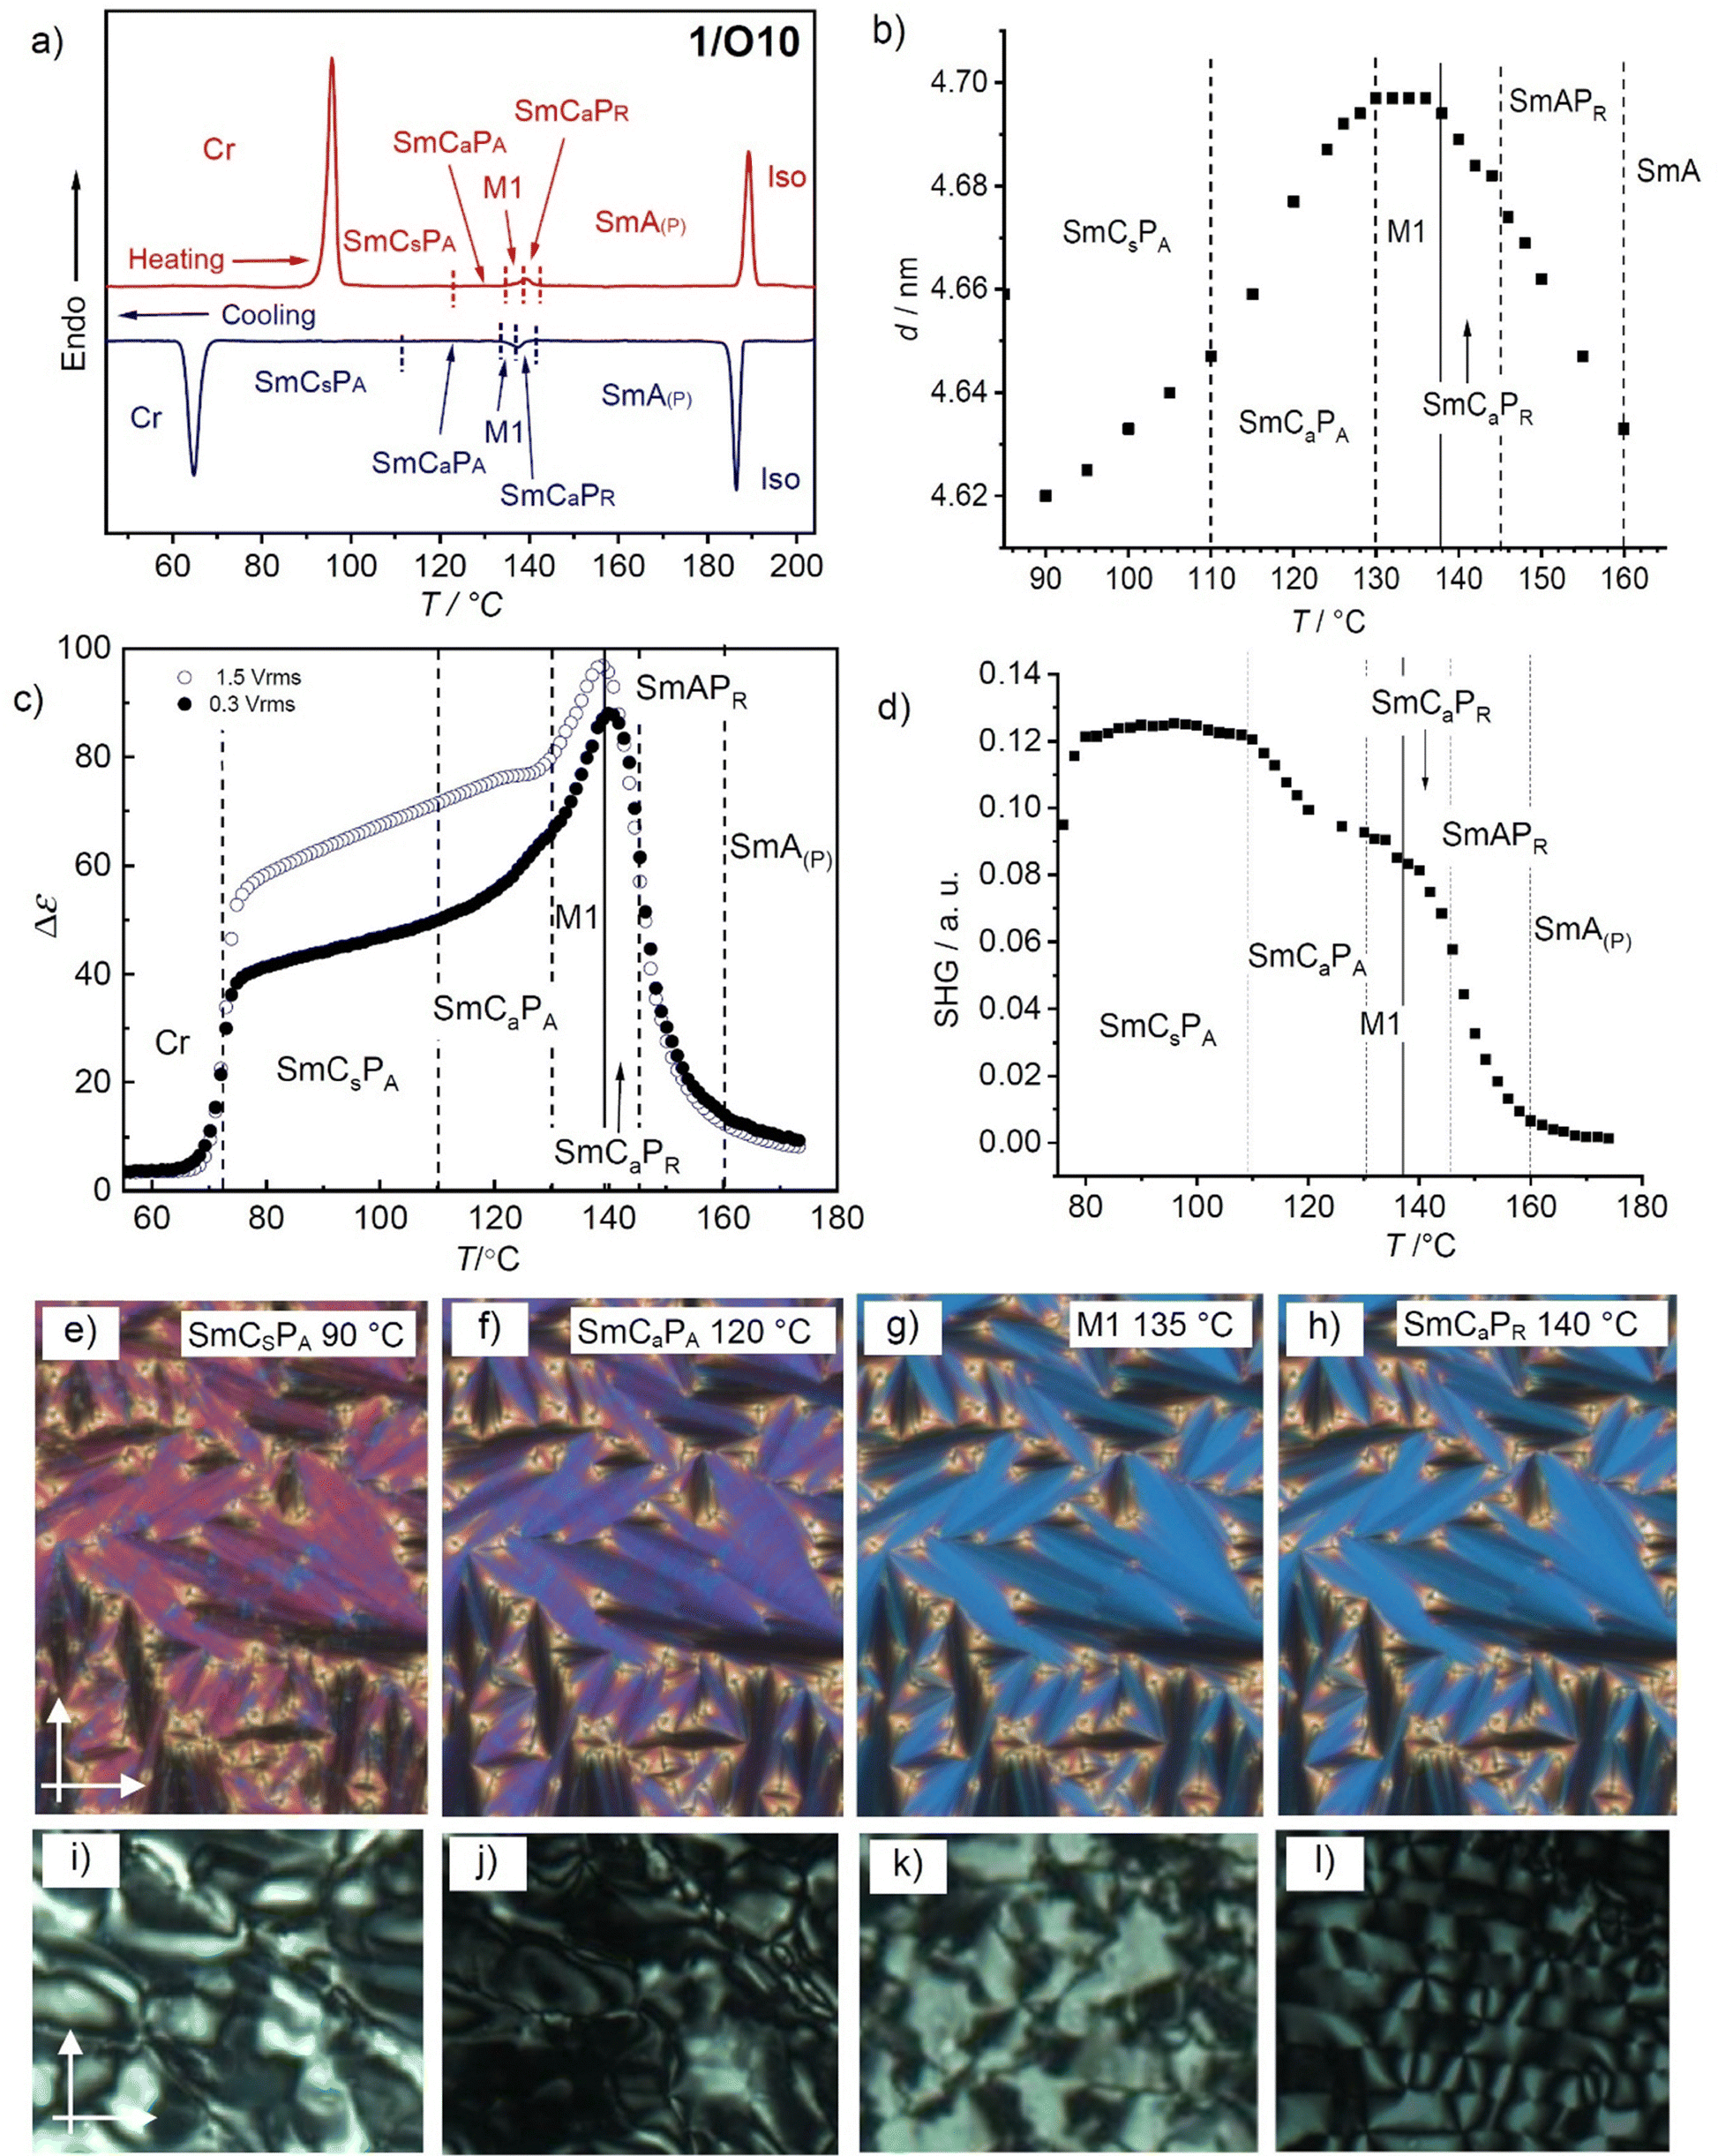 | ||
| Fig. 6 Data of compound 1/O10. (a) DSC heating and cooling traces at 10 K min−1; (b) temperature dependence of the layer spacing, (c) plot of the dielectric relaxation strength (Δε) as a function of temperature; (d) temperature dependence of the SHG activity in a 6 μm ITO cell under an applied field of 12.5 V μm−1 (for field dependence, see Fig. S29, ESI†); (e)–(h) show the fan-like POM textures (planar alignment) and (i)–(l) the POM textures in homeotropic alignment in the different phases at the indicated temperatures; for additional textures, see Fig. S30 (ESI†). | ||
3.3. Compound 1/O10 – development of synclinic tilt, leading to layer modulation and field-induced heliconical twist
 | ||
| Fig. 7 Optical micrographs of the POM textures observed for the different LC phases of compound 1/O10 in a PI coated 6 μm ITO cell in planar alignment, (a), (d) and (g) without applied electric field, (b), (e) and (h) after application of 6 V DC field, and (c), (f) and (i) polarization current response curves in the same cell at the indicated temperatures; in (c) C indicates the conductivity peak; all data were recorded on cooling. | ||
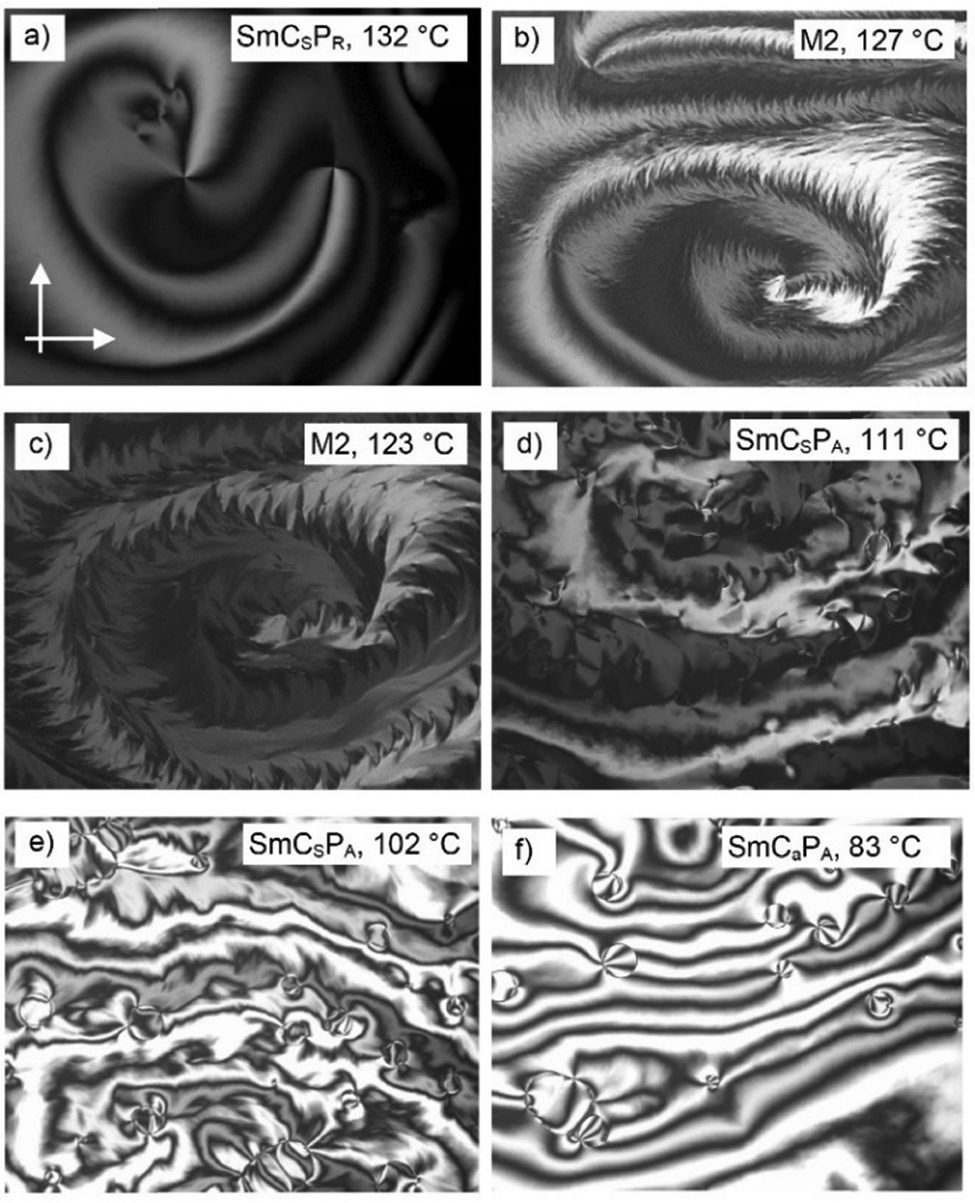
At the phase transition at T = 138 °C the texture in the homeotropic cell becomes mosaic-like, consisting of birefringent platelets and the viscosity of the LC phase increases significantly, indicating the transition to a modulated LC phase (M1 phase, Fig. 6k). On further cooling the homeotropic sample to about 130 °C restores a fluid schlieren texture, though without the stripe pattern (Fig. 6j) and with gradually increasing birefringence on further cooling (Fig. 6i). However, in the planar fan texture no change takes place in the M1 phase region (Fig. 6h and g). This means that either a layer modulation develops only in homeotropic alignment where the molecules are organized with the layer planes parallel to the interfaces, while in planar alignment with the molecules parallel to the surfaces this modulation is suppressed, or the layer modulation has for any reason no effect on the planar texture. Under a triangular wave field two sharp polarization peaks per half period can be observed (Fig. 7f). This double peak confirms an antiferroelectric switching below 138 °C, in the range of the M1 phase as well as in the SmCaPA range. Because no change of the orientation of the extinctions is observed this switching takes place by rotation around the long axis between SmCaPA and SmCaPF, (Fig. 7d and e).
At 110–100 °C the birefringence of the hometropic sample increases (Fig. 6i), while in the planar fan texture the dark extinction parallel to the polarizers become gradually birefringent due to a transition from anticlinic to synclinic tilt correlation between the layers (Fig. 6f and e). In the synclinic phase below 100 °C there are still two polarization current peaks (Fig. 7i), so that this low temperature phase is SmCSPA. Under the applied electric field a stripe pattern develops on the fans, as typical for field induced SmCsPF states with opposite tilt (Fig. 7h). However, after switching off the applied field the extinctions parallel to polarizer and analyser become completely dark (Fig. 7g), indicating a smectic phase with the optical axis perpendicular to the layers (Fig. 7g). This observation is explained further below for compound 1/O11 as example.
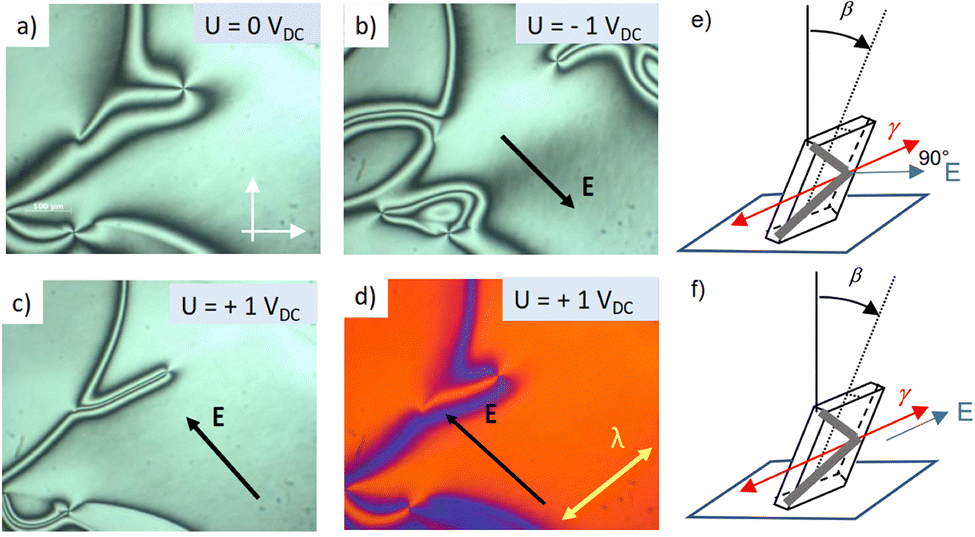 | ||
| Fig. 8 (a)–(d) POM textures of a 1.9 μm thick freely suspended film in the SmCaPR phase of 1/O10 at T = 145 °C, (a) in the field-free state, (b) and (c) under an electric field of opposite polarity; (d) image with the λ-wave-plate; the width of the images is 700 μm. (e) and (f) The sketches demonstrate (e) negative dielectric anisotropy: the slow axis (γ, red arrows) is aligning perpendicular to the applied electric field direction (E) and (f) positive dielectric anisotropy where γ and E are parallel; see also Fig. S50 (ESI†). | ||
However, under a DC field the situation is different. The slow axis aligns parallel to the field (Fig. 8f) and the response has a clear polar character suggesting the presence of the spontaneous polarisation in the film. This is particularly well seen in the presence of the topological defects of the topological strength +1 as shown in Fig. 8a–d. The polar director forms tangential loops around the defect core. In Fig. 8b, an electric field favours the director orientation in the bottom left quarter, while in Fig. 8c, the opposite polarity favours the top right quarter. The spontaneous polarisation could be estimated from the field dependence of the widths ξ of the inversion walls and accounts for approx. 140 nC cm−2. The inversion wall is proportional to E−1/2 in concord with the polar (vs. dielectric) coupling (Fig. S49, ESI†). The static DC field obviously supports the growth and fusion of the ferroelectric grains to larger polar domains.
The transition from SmCaPR to M1 phase is accompanied by “freezing” of the Schlieren texture and its transformation into a mosaic-type polymorphic texture composed of small stripe-like domains with typical widths of about 5–10 μm (Fig. 9a). This texture shows no response on an electric field (1 V mm−1). A drastic textural transformation occurs on rapid heating from the SmCaPA phase below the M1 phase, when a finger-like structures nucleates, which elongates and bifurcates resulting in quasi-1D periodic striped texture (Fig. 9b–d). This indicates the emergence of a layer modulation force at this temperature, which is likely to be caused by the increasing polar coherence length.
 | ||
| Fig. 9 (a) Growth of the labyrinthine texture (a) at the transition from the SmCaPR phase on cooling and (b)–(d) at the transition from the SmCaPA to the M1 phase upon rapid heating; (a)–(c) as observed between crossed polariser and (d) with a full-wave plate in a freely suspended film of 1/O10; (e) and (f) show the transition from the (e) SmCaPA phase at 128 °C to (f) the SmCsPA phase at 104 °C. The film thickness is 740 nm in (a)–(d) and >1000 nm in (e) and (f). | ||
There are two additional tilted phases occurring below the modulated M1 phase. On cooling, the labyrinth texture melts into the Schlieren pattern containing a large number of concentric inversion walls which slowly relax with time. This texture suggests a tilted SmC-type phase without spontaneous polarization (Fig. 9e). Examining the film under oblique incidence, we found no asymmetry in the transmission change on the tilting, confirming that the phase is of anticlinic structure (SmCaPA). The inversion walls represent alternating regions of splay and bend deformations of the c-director.
At T = 114 °C another transition takes place, but the texture remains SmC-type Schlieren (Fig. 9f). The transition is marked by nucleation of circular domains enclosed by dislocation lines. The analysis of the optical transmittance under oblique incidence confirms that the structure of the phase is synclinic. Bend and splay inversion walls appear to be of the same width suggesting that Ks ≈ Kb (Fig. S49, ESI†). This transition corresponds to the SmCaPA–SmCsPA transition occurring in the bulk sample at ∼110–100 °C on cooling and 122 °C on heating. Thus, thin film investigations fully confirm the proposed phase sequence of 1/O10.
3.4. Compounds 1/O11–1/O14 – emergence of the heliconical Sm(CP)hel phase
 | ||
| Fig. 10 Optical micrographs of the textures observed for the different LC phases of compound 1/O11. (a)–(e) In a homeotropic cell, the insets show the planar alignment in PI coated 6 μm ITO cell before applying any field; (k)–(o) under an applied DC field and (f)–(j) after switching off the electric field, recorded at the indicated temperatures; (p)–(t) show the corresponding polarization current response curves at the indicated temperatures; for related data of 1/O12–1/O18, see Fig. S33–S41 (ESI†). | ||
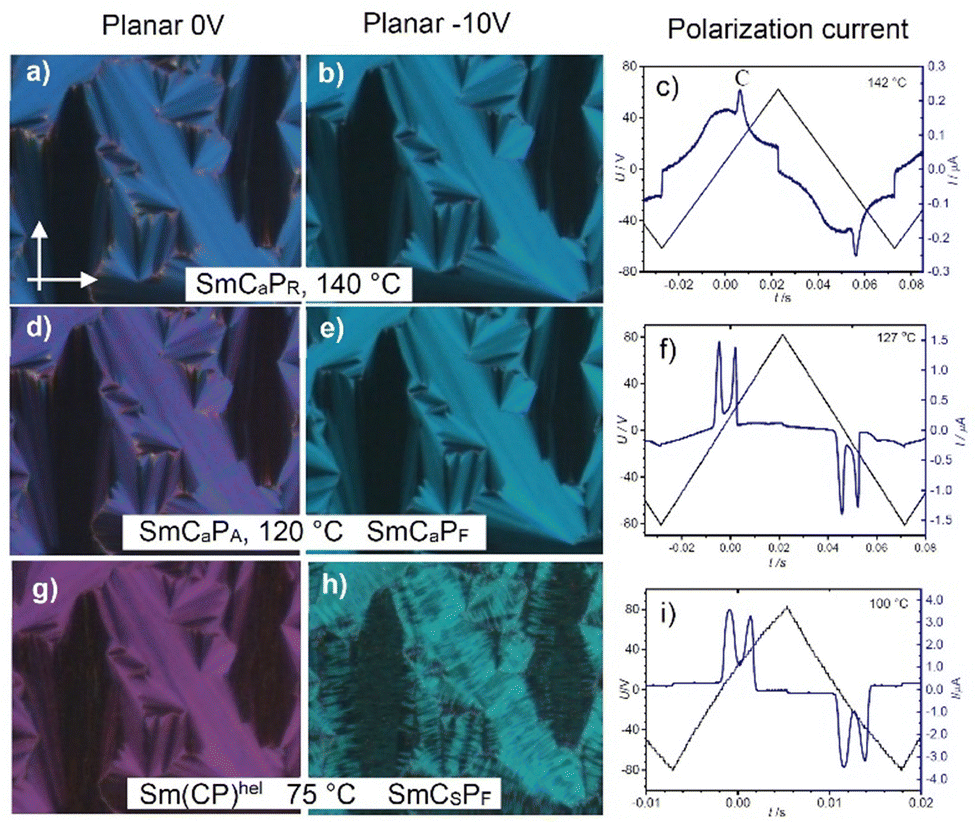
The field induced textures (Fig. 10h–j and m–o) and the shape of the polarization current curves do not change on further cooling down to crystallization, (Fig. 10r–t), meaning that the Sm(CP)hel phase is retained once an electric field has been applied. However, in the pristine sample, before application of an electric field there is a change of the fan texture at 126 °C where the dark extinctions become birefringent (insets in Fig. 10c–e), due to the transition from Sm(CP)hel to a synclinic tilted phase (SmCsPA) at this temperature. In addition, the uniaxial homeotropic sample becomes birefringent, confirming the transition to a biaxial SmCSPA phase (Fig. 10c–e). This means that in the pristine material before any field treatment there is the sequence SmA – SmAPR – SmCaPR – M1 – SmCsPhelF – SmCSPA on cooling. Upon heating the SmCSPA range is expanded up to 134 °C, replacing the M1 phase completely and reducing SmCsPhelF to a small range between 134 and 136 °C (Table 2). However, after treatment under an electric field the M1 phase as well as the SmCSPA phase are completely suppressed and only the heliconical phase is observed between the crystalline state and the Curie temperature, i.e. there is a direct transition between Sm(CP)hel and SmCaPR, leading to the field-induced sequence SmA – SmAPR – SmCaPR – SmCsPhelF (Table 2 and Fig. 3). The field induced transition from SmCSPA to Sm(CP)hel is also found in the SmCSPA range of the shorter homologue 1/O10 (see previous section), and it is observed in the SmCSPA ranges of all following homologs with n ≥ 10 (Fig. 3).
For this compound the induction of a heliconical superstructure was additionally confirmed in homeotropic alignment by application of an in-plane field (Fig. 11). The relatively small birefringence of the SmCSPA phase suggests that some distortion (due to splay director modulation or twist) is already involved in the ground state (Fig. 11a). Upon application of the in-plane field in the SmCSPA range at 105 °C (Fig. 11a–d) the birefringence first increases between the electrodes by alignment of the molecules and removal or reduction of the above-mentioned distortions (Fig. 11a and b) and transformation of the SmCSPA phase into a structure with a larger contribution of synpolar aligned layers (see (b and f) in Fig. 11i). At a certain threshold field strength, the area between the electrodes becomes isotropic (i.e. the phase becomes uniaxial) due to the induction of a short pitch helix (Fig. 11b and c). On further increasing field strength the helix is unwound to give the birefringent field-induced polar SmCSPF state (Fig. 11d).
 | ||
| Fig. 11 (a)–(h) POM textures of 1/O12 in an 8 μm homeotropic cell at the indicated temperatures under the given applied in-plane fields; (a)–(d) in the SmCaPA temperature range and (e)–(h) in the Sm(CP)hel range; the gap between the electrodes is 180 μm. (i) Shows the schematic energy profile and schematics of the molecular reorganization during the field induced transitions; see Fig. S35 (ESI†) for relaxation experiments and for related data of 1/O10 and 1/O18, see Fig. S29 and S41 (ESI†). | ||
Interestingly, in the temperature range of the Sm(CP)hel phase (at 127 °C, see Fig. 11e–h) the birefringence is first induced under the field before it disappears again. This means that the helix is first partly unwounded or deformed before an optical uniaxial field induced state is formed at higher field strength (Fig. 11e–g). This field induced uniaxial state can represent a 90° twisted 4-layer state related to the α-phase62 or any short-pitch heliconical state which might be slightly different from the Sm(CP)hel ground state structure, for example by different pitch lengths or degree of commensurability with the layer periodicity. In the temperature range of the SmCsPA phase the field-induced Sm(CP)hel state (which again might be identical or slightly different from the initial ground state) appears to be metastable (at least in homeotropic cells), as it slowly relaxes (within several minutes to hours) back to a birefringent texture (see Fig. S35, ESI†).
3.5. Compounds 1/O16–1/O20 – dominance of synclinic tilt
 | ||
| Fig. 12 Textures of pristine compound 1/O20, (a)–(e) in homeotropic alignment and (f)–(j) in planar alignment in the LC phases at the indicated temperatures. for DSC-traces, see Fig. S9h (ESI†). | ||
Remarkably, there is a low birefringent, but not completely dark state for the homeotropic texture below the Curie temperature at 122 °C (Fig. 12b–e) showing the absence of the uniaxial Sm(CP)hel and the highly birefrngent M1 phases. The reorientation of the extinction crosses in a circular domain in Fig. 13 clearly shows the switching mechanisms in the distinct LC phases, together with the field induced structures. There is no change of the orientation of the extinction crosses under the applied E-field in the non-polar and paralelectric SmA (Fig. 13a–c) and SmC ranges (Fig. 13e–g), while only a slight increase of birefringence can be identified for the field-induced texture in the SmCSPR range (bluish green vs. green, see Fig. 13i–k), as typical for Langevin type paraelectric reorganization of polar clusters by rotation of the molecules around their long axes (Fig. 13y, bottom). Below the Curie temperature the extinctions become aligned parallel to the polarizers at 0 V, in line with the induction of a heliconical Sm(CP)hel state by the applied alternating E-field (Fig. 13n). Under an applied positive or negative electric field, the extinctions rotate to the left or right (Fig. 13m and o), due to the removal of the helix by transition to the field induced SmCSPF states with opposite tilt direction. Because of insetting crystallization, we were unable to study the SmCaPA phase below 90 °C.
 | ||
| Fig. 13 (a)–(x) Switching in the smectic phases of compound 1/O20 (6 μm non-coated ITO cell). The three left columns show circular domain as observed by POM upon cooling, from left to right at +10 V, after switching off the applied voltage, and at −10 V; the right column show the corresponding polarization current curves (160 Vpp, 10 Hz); (y) and (z) show sketches of molecular reorganization for the distinct switching processes. | ||
The polarization current response curves show the absence of polar switching in SmA and SmCs (Fig. 13d and h), a ferroelectric-like relatively broad single peak in SmCSPR and a broad feature in SmCSPA (Fig. 13p and t). Applying a lower frequency (2 Hz) leads to a splitting into a broad and a sharper peak, as typical for the ferrielectric-like switching in the field induced Sm(CP)hel state (Fig. 13t, inset). They merge to a single peak on further cooling (Fig. 13x), which is interpreted as a result of slowing down of the switching due to the increasing sample viscosity and the insetting partial crystallization.
 | ||
| Fig. 14 (a–f) POM textures of a freely suspended film (2.6 μm) of 1/O16 as observed at the indicated temperature on cooling; the image width is 700 μm. | ||
Upon further cooling, the texture “melts” into a nematic-like Schlieren texture, indicating the dissolution of the periodic structure and the re-establishment of the nematic-like in-plane order of the c-director (Fig. 14e). In case of oblique incidence, the films appear to have regions with two distinct tilt states confirming the synclinic character of the SmC phase (SmCSPA). The regions of opposite tilt are marked by the circular domains. The contrast between the domains of opposite tilt diminishes upon the next phase transition. This results from the anticlinic order of the tilt in the SmCaPA phase at lowest temperature. Here circular domains with the phase mismatch of the alternating tilt are separated by the domain walls (Fig. 14f). Thus, the investigation of thin films confirms the phase sequence deduced from the other investigations (see Table 2 and Fig. 3; for thin films investigations of 1/O20, see Fig. S51 and S52, ESI†).
3.6 Discussion of structure–property relations
 | ||
| Fig. 15 Bar diagram of compounds 1/n showing the development of the LC phases on cooling and depending on chain length;37a Phase transitions before applying an external electric field and b after application of a few cycles of an AC field (E); the dashed white line indicates the approximate chain-length dependence of the Curie temperatures starting with 1/8. Note that also for 1/8 there is a short SmAPAR range between SmCaPA and SmA. Reproduced with permission from ref. 37, copyright 2020, Wiely. | ||
A major difference between these two series is the stronger tendency of series 1/On to assume synclinic instead of anticlinic tilt. Therefore, in this series the SmCaPA–SmCSPA transition already takes place for n = 10, while n = 18 is required for series 1/n. Though the region of Sm(CP)hel phase formation in the ground state is comparable in both series (n = 12–16 for 1/On and n = 11–14 for 1/n), the field-induced Sm(CP)hel phase is much more prominent in series 1/On and can be found already for n = 10 while n = 18 is required for compounds 1/n (Fig. 3 and 15). Moreover, the layer modulated M1/M2 phases are missing in the series 1/n, which might indicate a stronger helical twisting power provided by compounds 1/On.
Though there is no measurable difference of the optical tilt between compounds 1/n and 1/On with the same chain length (ca. 20° in SmCR and ca. 30° in SmCPA), the synclinic tilt appears to be more robust in the series 1/On. This might be an effect of introduction of the two ether linkages providing slightly different molecular conformations and conformational mobilities (different rotational barriers around the Ph-CH2CH2- and Ph-OCH2- bonds),63 thus modifying the molecular helicity12a,50 and the interlayer end-to-end interactions between the molecules.64 It appears that in the pristine samples of compounds 1/On the Sm(CP)hel formation is disfavourd in the anticlinic SmCaPA range and favoured in the synclinic SmCSPA range, while in the series 1/n it is just the other way around (Fig. 3 and 15). Consequently, in the series 1/n the pristine Sm(CP)hel phase is derived from the SmCaPA phase just before transition to SmCSPA while in series 1/On it is derived from SmCSPA and removed upon SmCaPA phase formation. However, in both series the field induced Sm(CP)hel phase can only be obtained in the SmCSPA phase range (Fig. 16, right), while in SmCaPA the switching takes place by rotation around the long axis between SmCaPA and SmCaPF (Fig. 16, left). For compounds 1/On the Sm(CP)hel phase is field induced in the complete SmCSPA ranges, while for most of the compounds of series 1/n, with exception of 1/18, it is only formed in a small part of the SmCSPA phase (compare Fig. 3 and 15). In addition, different low temperature phases can be observed in the two series; for compounds 1/n there is a re-entrance of an SmA phase, in this case showing ferroelectric switching (SmA′PF) for n = 16–20,37,65 partly or completely replacing the SmCaPA phase of compounds 1/On with the same chain length.
 | ||
| Fig. 16 Switching modes in the tilted smectic LC phases of the series 1/n and 1/On; the dotted lines indicate spontaneous reorganizations without applied field. | ||
There are also differences in the switching process (Fig. 16). In both series application of an electric field to the Sm(CP)hel phase unwinds the helix and leads to a field induced SmCSPF state, which then relaxes back to Sm(CP)hel after releasing the field (Fig. 11i and 16, right side). In the SmCSPA phase range of both series at first Sm(CP)hel, and then the SmCSPF state is induced under an increasing applied field. However, in the SmCaPA phase of compounds 1/On no helix can be induced and the switching takes place by collective rotation around the long axis, leading to the field-induced SmCaPF state which in the same way relaxes back to SmCaPA after switching off the applied field (Fig. 16, left side). Hence, no Sm(CP)hel phase can be induced as soon as the SmCSPA phase is replaced by SmCaPA (compounds 1/O6–1/O10 and 1/O18–1/O20, see for example Fig. S29, ESI†). Therefore, we observe for compound 1/O10 the induced Sm(CP)hel phase not directly below the Curie temperature, as found in all other cases, but at much lower temperature after the transition from SmCaPA to SmCSPA.
For compounds 1/On there is also a slightly larger tendency towards synpolar (“ferroelectric”) layer correlation above the Curie temperature, i.e. there is only one compound with an antipolar SmCaPAR phase (1/O6) compared to two for the series 1/n (n = 6, 8), and the SmCSPAR phase of 1/20 is missing for 1/O20. On the other hand, in the series 1/n a non-tilted ferroelectric SmA′PF is observed for n = 16–2065 which is replaced by an anticlinic and antiferroelectric SmCaPA phase for the same chain length in the series 1/On. Nevertheless, dielectric investigations show for these long chain compounds of series 1/On an increase of δε in the low temperature range of the SmCsPA phases of compounds 1/O16–1/O20 (Fig. S43b–d, ESI†) which could be interpreted as a growing tendency towards ferroelectric polar order. This is supported by the temperature dependence of the d-spacing in the SAXS patterns (Fig. 17). While for compounds 1/O10–1/O11 there is a continuous decrease of the d-spacing below the Curie temperature due to the growing tilt (see also Fig. 6b and Fig. S17b, ESI†), for 1/O12 and 1/O14 an increase of the d-value starts within the SmCsPA range (see also Fig. S18 and S19, ESI†) while for the long chain compounds 1/O16–1/O20 there is a continuous increase of the layer spacing (despite of the tilt) with lowering temperature in the whole LC range (see also Fig. S20b, S22c and S24c, ESI†). This means that increasing packing density, coupled with an alkyl chain stretching, becomes dominating for the layer spacing. Because crystallization sets in around the SmCSPA–SmCaPA transition we cannot state with certainty if any ferroelectric phase is formed in the monotropic phase range of compounds 1/O16–1/O20.
 | ||
| Fig. 17 Comparison of the d = f(T) curves of the layer spacing of compounds 1/O4–1/O20 (see Fig. S25 for more explanations, the individual curves are shown in Section S4 of the ESI†). | ||
|
|
||||
|---|---|---|---|---|
| Comp. | X | Y | Phase sequence (T/°C) | Ref. |
| Abbreviations: T = terephthalate based wing; B = benzoyloxybenzoate wing. | ||||
| 1/O12 | OOC (T) | COO (T) | → Cr 111 SmCSPA136 SmCaPR 143 SmAPR → SmA 191 Iso | |
| ← Cr 60 SmCSPA 106 Sm(CP)hel133 SmCaPR 143 SmAPR ← SmA 190 Iso | ||||
| 2/O12 | COO (B) | COO (T) | → Cr 119 SmAPR → SmA 163 Iso | 36 |
| ← Cr 103 SmAPR ← SmA 162 Iso | ||||
| 3/O12 | OOC (T) | OOC (B) | → Cr 114 (SmCSPA106) SmCsPAR 116 SmCSPR[*] 148 Iso | 36 |
| ← Cr <20 SmCSPA104 SmCsPAR 115 SmCSPR[*] 147 Iso | ||||
| 4/O12 | COO (B) | OOC (B) | → Cr 103 (SmCSPA94) SmC 109 NcybC 129 Iso | 46 |

In contrast, compound 4/O12 with two electron-rich phenylbenzoate wings (B, B) has the lowest LC phase stability, it is the only compound in Table 3 forming a nematic phase and all LC phases have a strong synclinic tilt (35–45°).46,56 The looser packing between the electron rich wings requires a stronger tilt to achieve layer formation and polar order. In this case no heliconical smectic phase is found.
The two compounds 2/O12 and 3/O12 with mixed terephthalate and benzoate wings (B, T and T, B), and thus intermediate average electron density of the wings, show LC phase stabilities being intermediate between the two symmetric compounds.36 The comparison between these two compounds shows the influence of the direction of the COO group Y with respect to the direction of the CN group. The tilt is removed (2/O12) or reduced (1/O12) if the terephthalate wing is at the side of the CN group (Y = COO), while the benzoate wings (Y = OOC) at this side induces an especially strong preference for tilted organization (3/O12 and 4/O12). The phenyl benzoate wing at the opposite side to the CN group (X = COO) reduces the polar order, while a terephthalate wing at this side apparently supports the formation of helical phases (SmCSPR[*] for 3/O12 and Sm(CP)hel for 1/O12). Overall, compound 1/O12 represents the best compound in this series with respect to mesophase stability and with the highest tendency towards formation of heliconical phases. It appears that 1/O12 provides the strongest transient molecular helicity (conformational chirality)50 caused by the twisting of the properly arranged COO groups.9b The distinct contributions of electrostatic effects and molecular conformations to heliconical self-assembly require DFT calculations being planned for future work.
4. Conclusions
A series of 4-cyanoresorcinol bisterephthalates 1/On terminated with alkoxy chains having variable lengths ranging from 2 to 20 was synthesized, and their LC self-assembly was investigated in detail. The main observations are summarized schematically in Fig. 18. | ||
| Fig. 18 Sketch of the development of tilt, polar order and helicity in the smectic LC phases of the bent-core molecules 1/On depending on temperature and alkyl chain length (n = 8–20): (a) in the pristine material and (b) after applying a short AC sequence; Hel = heliconical Sm(CP)hel phase, for other abbreviations, see Table 2. | ||
All compounds with n ≥ 6 show a transition with Curie Weiss type divergence from nonpolar via paraelectric and high permittivity paraelectric (superparaelectric, polarization radomized, PR) to polar smectic phases (PF/PA) accompanied by an onset of a relatively small tilt (Fig. 18). While for the short chain compounds (n = 6–10) the anticlinic tilt correlation is dominating (SmCaPA) it becomes synclinic (SmCSPA) at the transition to n = 11 and around this cross-over modulated (M1, M2) and heliconical smectic phases (Sm(CP)hel) with helical twist between polar SmCPF layers occur below the Curie temperature (Fig. 18). Induction of the heliconical phase is geneally observed in the synclinic SmCsPA range of these compounds and this leads to wide ranges of the field-induced Sm(CP)hel phases (n = 10–20). The highly polar and electron withdrawing lateral CN group is considered to play a crucial role for the development of polar order, emergence of helical twist and distinct tilt modes.
Recent advances in highly polar rod-like LCs have achieved large polarization values in phases with longitudinal polarization (Fig. 1a, left; Table 1), where heliconical phases (though with larger pitch) also emerge. This report provides fundamental insights into the synergistic roles of electrostatic energy, transient molecular helicity, and phase structure in controlling heliconical twist formation – advancing both the design of functional soft materials and the understanding of complexity and symmetry breaking in condensed matter systems.
To enhance transversal polarization, strategic molecular design – such as the introduction of lateral polar groups via targeted fluorination21b – could yield “facial polar” bent-core mesogens (Fig. 1a, right). Although these systems may exhibit shorter conjugation pathways, their directed cooperative bend alignment could enable transversal polarizations approaching those of longitudinal ferroelectrics. Such high-polarization transversal ferroelectrics would offer distinct advantages over their longitudinal counterparts, particularly for fast-switching optical and chiroptical devices.68–70
Data availability
The data supporting this article have been included as part of the ESI.†Conflicts of interest
There are no conflicts to declare.Acknowledgements
This work was supported by the Deutsche Forschungsgemeinschaft (424355983 – AL2378/1-2, 436494874 – RTG 2670). We thank Prof. W. Weissflog (Martin Luther University Halle-Wittenberg) for providing samples of 1/O8 and 1/O12.References
- (a) H. Ringsdorf, B. Schlarb and J. Venzmer, Angew. Chem., Int. Ed. Engl., 1988, 27, 113 CrossRef; (b) H. Finkelmann, H. Ringsdorf and J. H. Wendorff, Makromol. Chem., 1978, 179, 273 CrossRef CAS; (c) H. Bengs, O. Karthaus and H. Ringsdorf, Liq. Cryst., 1991, 10, 161 CrossRef CAS; (d) D. Adam, P. Schuhmacher, J. Simmerer, L. Häussling, K. Siemensmeyer, K. H. Etzbach, H. Ringsdorf and D. Haarer, Nature, 1994, 371, 141 CrossRef CAS.
- Handbook of Liquid Crystals, ed. J. W. Goodby, J. P. Collings, T. Kato, C. Tschierske, H. F. Gleeson and P. Raynes, Wiley-VCH, Weinheim, 2nd edn, 2014 Search PubMed.
- C. Tschierske, Angew. Chem., Int. Ed., 2013, 52, 8828 CrossRef CAS PubMed.
- J. Uchida, B. Soberats, M. Gupta and T. Kato, Adv. Mater., 2022, 34, 2109063 CrossRef CAS.
- H. K. Bisoyi and Q. Li, Chem. Rev., 2022, 122, 4887 CrossRef CAS.
- Y.-K. Kim, X. Wang, P. Mondkar, E. Bukusoglu and N. L. Abbott, Nature, 2018, 557, 539 CrossRef CAS PubMed.
- E.-K. Fleischmann and R. Zentel, Angew. Chem., Int. Ed., 2013, 52, 8810 CrossRef CAS PubMed.
- S. Sergeyev, W. Pisula and Y. H. Geerts, Chem. Soc. Rev., 2007, 36, 1902 RSC.
- (a) R. A. Reddy and C. Tschierske, J. Mater. Chem., 2006, 16, 907 RSC; (b) H. Takezoe, Top. Curr. Chem., 2012, 318, 303 CrossRef CAS PubMed; (c) M. Nagaraj, Liq. Cryst., 2016, 43, 2244 CrossRef CAS; (d) K. V. Le, H. Takezoe and F. Araoka, Adv. Mater., 2017, 1602737 CrossRef; (e) C. Tschierske, Liq. Cryst., 2018, 45, 2221 CrossRef CAS; (f) A. Yoshizawa, Crystals, 2024, 14, 97 CrossRef CAS.
- T. Buhse, J.-M. Cruz, M. E. Noble-Teran, D. Hochberg, J. M. Ribo, J. Crusats and J.-C. Micheau, Chem. Rev., 2021, 121, 2147 CrossRef CAS.
- T. Sekine, T. Niori, J. Watanabe, T. Furukawa, S.-W. Choi and H. Takezoe, J. Mater. Chem., 1997, 7, 1307 RSC.
- (a) M. Alaasar, M. Prehm, M. Brautzsch and C. Tschierske, Soft Matter, 2014, 10, 7285 RSC; (b) M. Alaasar, M. Prehm and C. Tschierske, Chem. – Eur. J., 2016, 22, 6583 CrossRef CAS PubMed; (c) M. Alaasar, A. F. Darweesh, Y. Cao, K. Iakoubovskii and M. Yoshio, J. Mater. Chem. C, 2024, 12, 1523 RSC.
- A. Gowda, S. Kumar Pathak, G. A. R. Rohaley, G. Acharjee, A. Oprandi, R. Williams, M. E. Prevot and T. Hegmann, Mater. Horiz., 2024, 11, 316 RSC.
- (a) S. T. Lagerwall, Ferroelectrics, 2004, 301, 15 CrossRef CAS; (b) A. Fukuda, Y. Takanishi, T. Isozaki, K. Ishikawa and H. Takezoe, J. Mater. Chem., 1994, 4, 997 RSC; (c) A. Yoshizawa, Crystals, 2024, 14, 350 CrossRef CAS.
- (a) T. Niori, T. Sekine, J. Watanabe, T. Furukawa and H. Takezoe, J. Mater. Chem., 1996, 6, 1231 RSC; (b) D. R. Link, G. Natale, R. Shao, J. E. Maclennan, N. A. Clark, E. Korblova and D. M. Walba, Science, 1997, 278, 1924 CrossRef CAS; (c) D. M. Walba, E. Korblova, R. Shao, J. E. Maclennan, M. A. Glaser and N. A. Clark, Science, 2000, 288, 2181 CrossRef CAS.
- (a) G. Pelz, S. Diele and W. Weissflog, Adv. Mater., 1999, 11, 707 CrossRef; (b) A. Eremin and A. Jákli, Soft Matter, 2013, 9, 615 RSC; (c) M. Alaasar, Liq. Cryst., 2016, 43, 2208 CrossRef CAS; (d) H. Takezoe and A. Eremin, Bent-shaped Liquid Crystals, Taylor and Francis, Boca Rotan FL, 2017 CrossRef.
- R. A. Reddy, C. Zhu, R. Shao, E. Korblova, T. Gong, Y. Shen, E. Garcia, M. A. Glaser, J. E. Maclennan and D. M. Walba, Science, 2011, 332, 72 CrossRef CAS PubMed.
- M. Born, Sitzungsber. K. Preuss. Akad. Wiss., 1916, 30, 614 Search PubMed.
- (a) Y. Song, M. Deng, Z. Wang, J. Li, H. Lei, Z. Wan, R. Xia, S. Aya and M. Huang, J. Phys. Chem. Lett., 2022, 13, 9983 CrossRef CAS PubMed; (b) H. Kikuchi, H. Matsukizono, K. Iwamatsu, S. Endo, S. Anan and Y. Okumura, Adv. Sci., 2022, 9, 2202048 CrossRef PubMed; (c) X. Chen, V. Martinez, P. Nacke, E. Korblova, A. Manabe, M. Klasen-Memmer, G. Freychet, M. Zhernenkov, M. A. Glaser, L. Radzihovsky, J. E. Maclennan, D. M. Walba, M. Bremer, F. Giesselmann and N. A. Clark, Proc. Natl. Acad. Sci. U. S. A., 2022, 119, e2210062119 CrossRef CAS.
- (a) J. Hobbs, C. J. Gibb, D. Pociecha, J. Szydłowska, E. Górecka and R. J. Mandle, Angew. Chem., Int. Ed., 2025, 64, e202416545 CrossRef CAS; (b) H. Kikuchi, H. Nishikawa, H. Matsukizono, S. Iino, T. Sugiyama, T. Ishioka and Y. Okumura, Adv. Sci., 2024, 11, 2409827 CrossRef CAS.
- (a) G. J. Strachan, E. Gorecka, J. Szydlowska, A. Makal and D. Pociecha, Adv. Sci., 2025, 12, 2409754 CrossRef CAS; (b) G. J. Strachan, E. Górecka, J. Hobbs and D. Pociecha, J. Am. Chem. Soc., 2025, 147, 6058 CrossRef CAS.
- (a) R. J. Mandle, S. J. Cowling and J. W. Goodby, Phys. Chem. Chem. Phys., 2017, 19, 11429 RSC; (b) R. J. Mandle, S. J. Cowling and J. W. Goodby, Chem. – Eur. J., 2017, 23, 14554 CrossRef CAS.
- H. Nishikawa, K. Shiroshita, H. Higuchi, Y. Okumura, Y. Haseba, S. Yamamoto, K. Sago and H. A. Kikuchi, Adv. Mater., 2017, 29, 1702354 CrossRef.
- X. Chen, E. Korblova, D. Dong, X. Wei, R. Shao, L. Radzihovsky, M. A. Glaser, J. E. Maclennan, D. Bedrov, D. M. Walba and N. A. Clark, Proc. Natl. Acad. Sci. U. S. A., 2020, 117, 14021 CrossRef CAS.
- S. Brown, E. Cruickshank, J. M. D. Storey, C. T. Imrie, D. Pociecha, M. Majewska, A. Makal and E. Gorecka, ChemPhysChem, 2021, 22, 2506 CrossRef CAS.
- First attempts towards longitudinal ferroelectrics: F. Tournilhac, L. M. Blinov, J. Simon and S. V. Yablonsky, Nature, 1992, 359, 621 CrossRef CAS.
- Y. Song, S. Aya and M. Huang, Giant, 2024, 19, 100318 CrossRef CAS.
- (a) P. Kumari, B. Basnet, M. O. Lavrentovich and O. D. Lavrentovich, Science, 2024, 383, 1364 CrossRef CAS PubMed; (b) J. Karcz, J. Herman, N. Rychłowicz, P. Kula, E. Gorecka, J. Szydlowska, P. W. Majewski and D. Pociecha, Science, 2024, 384, 1096 CrossRef CAS; (c) H. Nishikawa, D. Okada, D. Kwaria, A. Nihonyanagi, M. Kuwayama, M. Hoshino and F. Araoka, Adv. Sci., 2024, 11, 2405718 CrossRef CAS.
- C. J. Gibb, J. Hobbs, D. I. Nikolova, T. Raistrick, S. R. Berrow, A. Mertelj, N. Osterman, N. Sebastián, H. F. Gleeson and R. J. Mandle, Nat. Commun., 2024, 15, 5845 CrossRef CAS PubMed.
- J. Hobbs, C. J. Gibb and R. J. Mandle, Small Sci, 2024, 4, 2400189 CrossRef CAS PubMed.
- N. Yadav, Y. P. Panarin, W. Jiang, G. H. Mehl and J. K. Vij, Phys. Chem. Chem. Phys., 2023, 25, 9083 RSC.
- (a) J. Thisayukta, Y. Nakayama, S. Kawauchi, H. Takezoe and J. Watanabe, J. Am. Chem. Soc., 2000, 122, 7441 CrossRef CAS; (b) G. Dantlgraber, A. Eremin, S. Diele, A. Hauser, H. Kresse, G. Pelzl and C. Tschierske, Angew. Chem., Int. Ed., 2002, 41, 2408 CrossRef CAS.
- S. P. Sreenilayam, Y. P. Panarin, J. K. Vij, V. P. Panov, A. Lehmann, M. Poppe, M. Prehm and C. Tschierske, Nat. Commun., 2016, 7, 11369 CrossRef CAS.
- A. A. S. Green, M. R. Tuchband, R. Shao, Y. Shen, R. Visvanathan, A. E. Duncan, A. Lehmann, C. Tschierske, E. D. Carlson, E. Guzman, M. Kolber, D. M. Walba, C. S. Park, M. A. Glaser, J. E. Maclennan and N. A. Clark, Phys. Rev. Lett., 2019, 122, 107801 CrossRef CAS PubMed.
- (a) J. K. Vij, Y. P. Panarin, S. Sreenilayam, M. Alaasar and C. Tschierske, Phys. Rev. Mater., 2019, 3, 045603 CrossRef CAS; (b) S. Sreenilayam, Y. P. Panarin, J. K. Vij, A. Lehmann, M. Poppe and C. Tschierske, Phys. Rev. Mater., 2017, 1, 045603 Search PubMed.
- M. Poppe, M. Alaasar, A. Lehman, S. Poppe, M.-G. Tamba, M. Kurachkina, A. Eremin, M. Nagaraj, J. K. Vij, X. Cai, F. Liu and C. Tschierske, J. Mater. Chem. C, 2020, 8, 3316 RSC.
- A. Lehmann, M. Alaasar, M. Poppe, S. Poppe, M. Prehm, M. Nagaraj, S. P. Sreenilayam, Y. P. Panarin, J. K. Vij and C. Tschierske, Chem. – Eur. J., 2020, 26, 4714 CrossRef CAS.
- C. Tschierske, Liq. Cryst., 2022, 49, 1043 CrossRef CAS.
- J. P. Abberley, R. Killah, R. Walker, J. M. D. Storey, C. T. Imrie, M. Salamończyk, C. Zhu, E. Gorecka and D. Pociecha, Nat. Commun., 2018, 9, 228 CrossRef.
- G. Pelzl, A. Eremin, S. Diele, H. Kresse and W. Weissflog, J. Mater. Chem., 2002, 12, 2591 RSC.
- (a) V. P. Panov, M. Nagaraj, J. K. Vij, Y. P. Panarin, A. Kohlmeier, M. G. Tamba, R. A. Lewis and G. H. Mehl, Phys. Rev. Lett., 2010, 105, 167801 CrossRef CAS PubMed; (b) M. Cestari, S. Diez-Berart, D. A. Dunmur, M. R. Ferrarini, M. R. de la Fuente, D. J. B. Jackson, D. O. Lopez, G. R. Luckhurst, M. A. Perez-Jubindo and R. M. Richardson, Phys. Rev. E: Stat., Nonlinear, Soft Matter Phys., 2011, 84, 031704 CrossRef CAS.
- R. A. Reddy and B. K. Sadashiva, J. Mater. Chem., 2002, 12, 2627 RSC.
- (a) M. Alaasar, M. Prehm, M. Nagaraj, J. K. Vij and C. Tschierske, Adv. Mater., 2013, 25, 2186 CrossRef CAS PubMed; (b) M. Alaasar, M. Prehm, K. May, A. Eremin and C. Tschierske, Adv. Funct. Mater., 2014, 24, 1703 CrossRef CAS.
- (a) M. Alaasar, M. Prehm, S. Poppe and C. Tschierske, Chem. – Eur. J., 2017, 23, 5541 CrossRef CAS PubMed; (b) M. Alaasar, M. Prehm, M.-G. Tamba, N. Sebastian, A. Eremin and C. Tschierske, ChemPhysChem, 2016, 17, 278 CrossRef CAS; (c) M. Alaasar, M. Prehm, S. Belau, N. Sebastián, M. Kurachkina, A. Eremin, C. Chen, F. Liu and C. Tschierske, Chem. – Eur. J., 2019, 25, 6362 CrossRef CAS.
- C. Dressel, T. Reppe, M. Prehm, M. Brautzsch and C. Tschierske, Nat. Chem., 2014, 6, 971 CrossRef CAS PubMed.
- L. Kovalenko, M. W. Schröder, R. A. Reddy, S. Diele, G. Pelzl and W. Weissflog, Liq. Cryst., 2005, 32, 857 CrossRef CAS.
- A. Eremin, S. Diele, G. Pelzl, H. Nádasi, W. Weissflog, J. Salfetnikova and H. Kresse, Phys. Rev. E: Stat., Nonlinear, Soft Matter Phys., 2001, 64, 051707 CrossRef CAS.
- G. W. C. Kayne and T. H. Laby, Tables of Physical & Chemical Constants, 16th edn, 1995 Search PubMed.
- I. Wirth, S. Diele, A. Eremin, G. Pelzl, S. Grande, L. Kovalenko, N. Pancenko and W. Weissflog, J. Mater. Chem., 2001, 11, 1642 RSC.
- C. Tschierske and G. Ungar, ChemPhysChem, 2016, 17, 9 CrossRef CAS.
- G. S. Lee, Y.-J. Lee, S. Y. Choi, Y. S. Park and K. B. Yoon, J. Am. Chem. Soc., 2000, 122, 12151 CrossRef CAS.
- N. Sebastian, S. Belau, A. Eremin, M. Alaasar, M. Prehm and C. Tschierske, Phys. Chem. Chem. Phys., 2017, 19, 5895 RSC.
- M. Alaasar, M. Prehm, M. Poppe, M. Nagaraj, J. K. Vij and C. Tschierske, Soft Matter, 2014, 10, 5003 RSC.
- (a) M. Majumdar, P. Salamon, A. Jákli, J. T. Gleeson and S. Sprunt, Phys. Rev. E: Stat., Nonlinear, Soft Matter Phys., 2011, 83, 031701 CrossRef CAS PubMed; (b) G. Shanker, M. Prehm, M. Nagaraj, J. K. Vij and C. Tschierske, J. Mater. Chem., 2011, 21, 18711 RSC; (c) S. Kumar and A. N. Gowda, Liq. Cryst. Rev., 2015, 3, 99 CrossRef CAS.
- (a) O. Francescangeli, F. Vita, C. Ferrero, T. Dingemans and E. T. Samulski, Soft Matter, 2011, 7, 895 RSC; (b) M. Alaasar, M. Prehm and C. Tschierske, Liq. Cryst., 2014, 41, 126 CrossRef CAS; (c) M. Alaasar, S. Poppe and C. Tschierske, Liq. Cryst., 2017, 44, 729 CrossRef CAS.
- (a) C. Keith, A. Lehmann, U. Baumeister, M. Prehm and C. Tschierske, Soft Matter, 2010, 6, 1704 RSC; (b) M. Alaasar, S. Poppe, C. Kerzig, C. Klopp, A. Eremin and C. Tschierske, J. Mater. Chem. C, 2017, 5, 8454 RSC.
- (a) T. Hegmann, J. Kain, S. Diele, G. Pelzl and C. Tschierske, Angew. Chem., Int. Ed., 2001, 40, 887 CrossRef CAS; (b) C. V. Yelamaggad, I. S. Shashikala, V. P. Tamilenthi, D. S. Shanker Rao, G. G. Nair and S. K. Prasad, J. Mater. Chem., 2008, 18, 2096 RSC; (c) R. Pratibha, N. V. Madhusudana and B. K. Sadashiva, Europhys. Lett, 2007, 80, 46001 CrossRef.
- (a) D. Pociecha, M. Cepic, E. Gorecka and J. Mieczkowski, Phys. Rev. Lett., 2003, 91, 185501 CrossRef; (b) Y. Shimbo, E. Gorecka, D. Pociecha, F. Araoka, M. Goto, Y. Tankanishi, K. Ishikawa, J. Mieczkowski, K. Gomola and H. Takezoe, Phys. Rev. Lett., 2006, 97, 113901 CrossRef.
- M. Nakata, R.-F. Shao, J. E. Maclennan, W. Weissflog and N. A. Clark, Phys. Rev. Lett., 2006, 96, 067802 CrossRef CAS PubMed.
- K. Gomola, L. Guo, D. Pociecha, F. Araoka, K. Ishikawa and H. Takezoe, J. Mater. Chem., 2010, 20, 7944 RSC.
- (a) A. Eremin, H. Nadasi, G. Pelzl, S. Diele, H. Kresse, W. Weissflog and S. Grande, Phys. Chem. Chem. Phys., 2004, 6, 1290 RSC; (b) D. Pociecha, E. Gorecka, M. Cepic, N. Vaupotic, K. Gomola and J. Mieczkowski, Phys. Rev. E: Stat., Nonlinear, Soft Matter Phys., 2005, 72, 060701(R) CrossRef PubMed; (c) D. Pociecha, E. Gorecka, M. Cepic, N. Vaupotic and W. Weissflog, Phys. Rev. E: Stat., Nonlinear, Soft Matter Phys., 2006, 74, 021702 CrossRef.
- (a) Y. P. Panarin, M. Nagaraj, S. Sreenilayam, J. K. Vij, A. Lehmann and C. Tschierske, Phys. Rev. Lett., 2011, 107, 247801 CrossRef CAS; (b) S. Sreenilayam, M. Nagaraj, Y. P. Panarin, J. K. Vij, A. Lehmann and C. Tschierske, Mol. Cryst. Liq. Cryst, 2012, 553, 140 CrossRef CAS.
- J. L. Hobbs, C. J. Gibb, E. Cruickshank, R. Walker and R. J. Mandle, Liq. Cryst., 2024, 51, 1022 CrossRef CAS.
- K. Kumazawa, M. Nakata, F. Araoka, Y. Takanishi, K. Ishikawa, J. Watanabe and H. Takezoe, J. Mater. Chem., 2004, 14, 157 RSC.
- Y. P. Panarin, S. P. Sreenilayam, V. Swaminathan, C. Tschierske and J. K. Vij, Phys. Rev. Res., 2020, 2, 013118 CrossRef CAS.
- (a) D. Malkar, B. K. Sadashiva and A. Roy, Soft Matter, 2016, 12, 4960 RSC; (b) D. Malkar and A. Roy, Liq. Cryst., 2022, 49, 1147 CrossRef CAS.
- J. Svoboda, V. Kozmık, K. Bajzıkova, M. Kohout, V. Novotna, N. Podoliak, D. Pociecha and E. Gorecka, J. Mater. Chem. C, 2024, 12, 10903 RSC.
- (a) C. Keith, M. Prehm and C. Tschierske, Chem. Commun., 2010, 46, 3702 RSC; (b) M. Nagaraj, Y. P. Panarin, J. K. Vij, C. Keith and C. Tschierske, Appl. Phys. Lett., 2010, 97, 213505 CrossRef; (c) Y. P. Panarin, M. Nagaraj, J. K. Vij, C. Keith and C. Tschierske, Europhys. Lett, 2010, 92, 26002 CrossRef; (d) Y. P. Panarin, S. Sreenilayam, J. K. Vij, A. Lehmann and C. Tschierske, J. Mater. Chem. C, 2017, 5, 12585 RSC.
- (a) A. S. Amrutha, A. S. Achalkumar and Q. Li, in Photoactive Functional Soft Materials: Preparation, Properties, and Applications, ed. Q. Li, Wiley-VCH, Weinheim, Germany, 2019, pp. 227–283 Search PubMed; (b) H. K. Bisoyi, T. J. Bunning and Q. Li, Adv. Mater., 2018, 30, 1706512 CrossRef PubMed.
- K. Yin, E.-L. Hsiang, J. Zou, Y. Li, Z. Yang, Q. Yang, P.-C. Lai, C.-L. Lin and S.-T. Wu, Light: Sci. Appl., 2022, 11, 161 CrossRef CAS.
Footnote |
| † Electronic supplementary information (ESI) available. See DOI: https://doi.org/10.1039/d5tc01109d |
| This journal is © The Royal Society of Chemistry 2025 |