
 Open Access Article
 This Open Access Article is licensed under a Creative Commons Attribution-Non Commercial 3.0 Unported Licence
Evaluating the potential of Pr2O3/C18H6Cu3O12 composites as positrodes with sustainable energy-power density for battery-supercapacitor hybrids
Muhammad Zahir
Iqbal
 *a,
Ayesha
Zakir
a,
Syed Johar Ali
Shah
b,
Ghulam
Dastageer
c,
Khalid Mujasam
Batoo
d and
Muhammad Farzik
Ijaz
e
*a,
Ayesha
Zakir
a,
Syed Johar Ali
Shah
b,
Ghulam
Dastageer
c,
Khalid Mujasam
Batoo
d and
Muhammad Farzik
Ijaz
e
aRenewable Energy Research Laboratory, Faculty of Engineering Sciences, Ghulam Ishaq Khan Institute of Engineering Sciences and Technology, Topi, 23640, Khyber Pakhtunkhwa, Pakistan. E-mail: zahir@giki.edu.pk
bDepartment of Physics Government Post Graduate College, Mansehra, 21300, Pakistan
cDepartment of Physics and Astronomy, Sejong University, Seoul 05006, South Korea
dKing Abdullah Institute for Nanotechnology, King Saud University, P. O. Box-2455, Riyadh-11451, Saudi Arabia
eDepartment of Mechanical Engineering, College of Engineering, King Saud University, P. O. Box-800, Riyadh-12372, Saudi Arabia
First published on 30th January 2025
Abstract
Hybrid supercapacitors (HSCs), incorporating the benefits of batteries and supercapacitors (SCs), have drawn significant research attention. In this regard, metal oxides and metal–organic frameworks (MOFs) have emerged as standout contenders for electrode materials because of their varying oxidation states, redox-active nature and immensely high porosity along with large active site ratios. Here, we fabricated praseodymium sesquioxide (Pr2O3) in combination with C18H6Cu3O12 MOF and compared their composites in different weight ratios. Through three-electrode characterizations, the composite with the same weight ratio revealed a remarkable specific capacity of 2046 C g−1, showing enhanced performance because of the proper utilization of C18H6Cu3O12 porosity and the chemical activity of Pr2O3. This composite (Pr2O3/C18H6Cu3O12) was subsequently combined with activated carbon in a hybrid device, and numerous electrochemical characterizations were further performed. Based on the outcomes, the device demonstrated a maximum specific capacity of 310 C g−1, along with energy and power densities of 67 W h kg−1 and 6114 W kg−1, respectively, and a capacity retention of 98%. After careful evaluation of the device, two different models were applied to estimate the approximate capacitive and diffusive contributions of the device. These findings highlight the potential of the study for future usage in battery-supercapacitor systems.
1. Introduction
Rapid progress in industries, such as vehicles and telecommunications, has enormously increased energy demands.1,2 The persistent reliance on natural resources has brought a drastic decline in their volume. Boundless consumption of fossil fuels has resulted in excessive CO2 emission, which severely affect the ecosystem.3 To overcome these energy crises caused by diminishing natural reserves, research efforts are focused on transitioning to sustainable and clean resources, such as solar and tidal energies.4,5 However, these sources have inconsistent supply, which needs to be extenuated by establishing storage systems to perpetually harness this energy. Energy storage devices (ESDs) are the best alternatives to serve this purpose because of their efficiency, cost effectiveness and environmentally friendly behavior.6,7 Based on storage mechanisms, ESDs are mainly classified into SCs and batteries. SCs store energy through physical adsorption by virtue of fast electrostatic charge transfer, whereas batteries work via reversible redox-driven chemical processes, which account for charge accumulation at the electrode–electrolyte interface.8,9 Although SCs possess greater power, their inferior energy density hampers their performance. Batteries, on the other hand, prevail over SCs in energy storing ability but fall short in power density and cyclic stability.10 To achieve better electrochemical performance, HSCs have been developed by assembling SCs and battery-grade electrodes into a single device.11,12 In this regard, the fabrication of suitable electrode materials plays a decisive role in determining the performance of these hybrid devices.13 In HSCs, carbonaceous materials with a large surface area are usually used as supercapacitive electrodes, while redox-active materials, such as conducting polymers and metal oxides, are utilized for battery-grade electrodes.14–16 Conductive polymers exhibit better conductivity, but their mechanical instability halts their commercial exploitation as electrode materials.17 Owing to their natural abundance, high specific capacitance, enhanced stability, and wide operating potential range, metal oxides are extensively employed as redox-active electrodes in HSCs.18,19Rare-earth metal-based materials are being explored for HSCs due to their unique 4f electronic configuration, varying oxidation states and stoichiometric deviations.20,21 Studies suggest that the composition of transition metal oxides with rare-earth metal oxides strikingly enhanced their specific capacitances.22–24 Some rare-earth metal oxides were used as electrodes and expressed fine electrochemical performance.25,26 For instance, N. Maheswari et al.27 prepared cerium oxide hexagonal nanostructures, which upon electrochemical characterizations yielded a remarkable specific capacitance of 523 F g−1 with 82% retention after 2000 cycles. Among metal oxides, praseodymium sesquioxide (Pr2O3) is thermally stable and shows Pr3+ and Pr4+ oxidation states.28,29 It is the redox activity and high oxygen mobility facilitated by ultrafast switching between the two oxidation states that make it favorable for supercapacitor applications.30 However, Pr2O3 suffers from exiguous conductivity and insufficient active site ratio, which circumscribe its electrochemical activity.31 Its electrical conductivity lies in the range of 10−4 to 10−2. To overcome this limitation, Pr2O3 can be assorted with MOFs.
MOFs are novel crystalline materials which constitute metal ions linked by organic ligands. Properties such as exceptional tunable porosity, high specific surface area and structural control boost their applications in HSCs.32 Copper benzene tricarboxylate (C18H6Cu3O12) is a Cu-based MOF with trimesic acid (1,3,5-benzene tricarboxylic acid) as the linker. Nur Hawa et al.33 hydrothermally synthesized C18H6Cu3O12 and assembled it in a device with nitrogen-doped graphene. The calculated energy and power densities were 2.61 W h kg−1 and 300 W kg−1, respectively. The electrical conductivity of C18H6Cu3O12 is 10−8 to 10−4 S cm−1. The excellent performance of C18H6Cu3O12 was attributed to its significantly high porosity and surface area. In the framework of C18H6Cu3O12, the Cu atom is attached to four oxygen atoms of the linker. The further existence of water molecules in its structure is responsible for providing a coordinative void on Cu species.
Herein, we report and compare pure Pr2O3, C18H6Cu3O12 and their composites in different weight ratios of 50/50, 75/25 and 25/75. These fabricated electrodes are then used as battery-type electrode materials for HSC applications. Before the electrochemical analysis, XRD, SEM and EDX were performed to probe the structural and crystalline properties of materials. After that, the electrochemical performance of these electrodes was investigated by CV, GCD and EIS in a three-electrode assembly. The best performing electrode was then used in a hybrid device with activated carbon as the counter electrode. The device delivered an enhanced electrochemical performance because of the synergistic effect produced by the high porosity of C18H6Cu3O12 and the redox activity of Pr2O3.
2. Experimental
2.1 Materials
Praseodymium sesquioxide (Pr2O3), C18H6Cu3O12, polyvinylidene fluoride (PVDF), carbon black and N-methyl-2-pyrrolidone (NMP) were bought from Sigma Aldrich. The materials were used as received without any further purification.2.2 Synthesis of MOFs and electrode fabrication
For the synthesis of MOFs, the hydrothermal process was adapted. In short, 30 mL of DI water was used to disperse 7 mM cupric nitrate hemipentahydrate (Cu2H10N4O17). Following that, a solution of two equal parts (30 mL) of DI water and ethanol was combined to mix a trimesic linker of 3.5 mM. Prepared solutions were further poured into a 100 mL autoclave after vigorous stirring to ensure complete dissolution. The autoclave was then kept at 130 °C for twenty-four hours in an oven. Tiny crystals appeared once the autoclave was allowed to cool down to room temperature. Afterwards, the bluish crystals were separated from the mixture using a centrifuge. After continuously cleaned with ethanol, acetone, and DI water, the resulting material was dried in an oven. Further, for the fabrication of electrodes, nickel foam substrates were washed with ethanol, methanol, acetone, hydrochloric acid and deionized water. These substrates were then kept in a furnace to dry for 4 h. The active materials were taken with five different Pr2O3/C18H6Cu3O12 ratios, i.e. 100/0 (pristine Pr2O3), 50/50, 75/25, 25/75, and 0/100 (pristine C18H6Cu3O12), which were named as Pr2O3 and C18H6Cu3O12, Pr2O3/C18H6Cu3O12 (50/50), Pr2O3/C18H6Cu3O12 (25/75) and Pr2O3/C18H6Cu3O12 (75/25), respectively. These materials were mixed with carbon black and a PVDF binder in the ratio of 8/1/1. The slurries were prepared by dissolving these mixtures into NMP and stirring the solution for 8 h. Five working electrodes were fabricated by depositing these slurries onto Ni foam substrates followed by drying in an oven for 4 h at 90 °C. The flowchart illustration of the synthesis of MOF and fabrication of electrode is depicted in Fig. 1.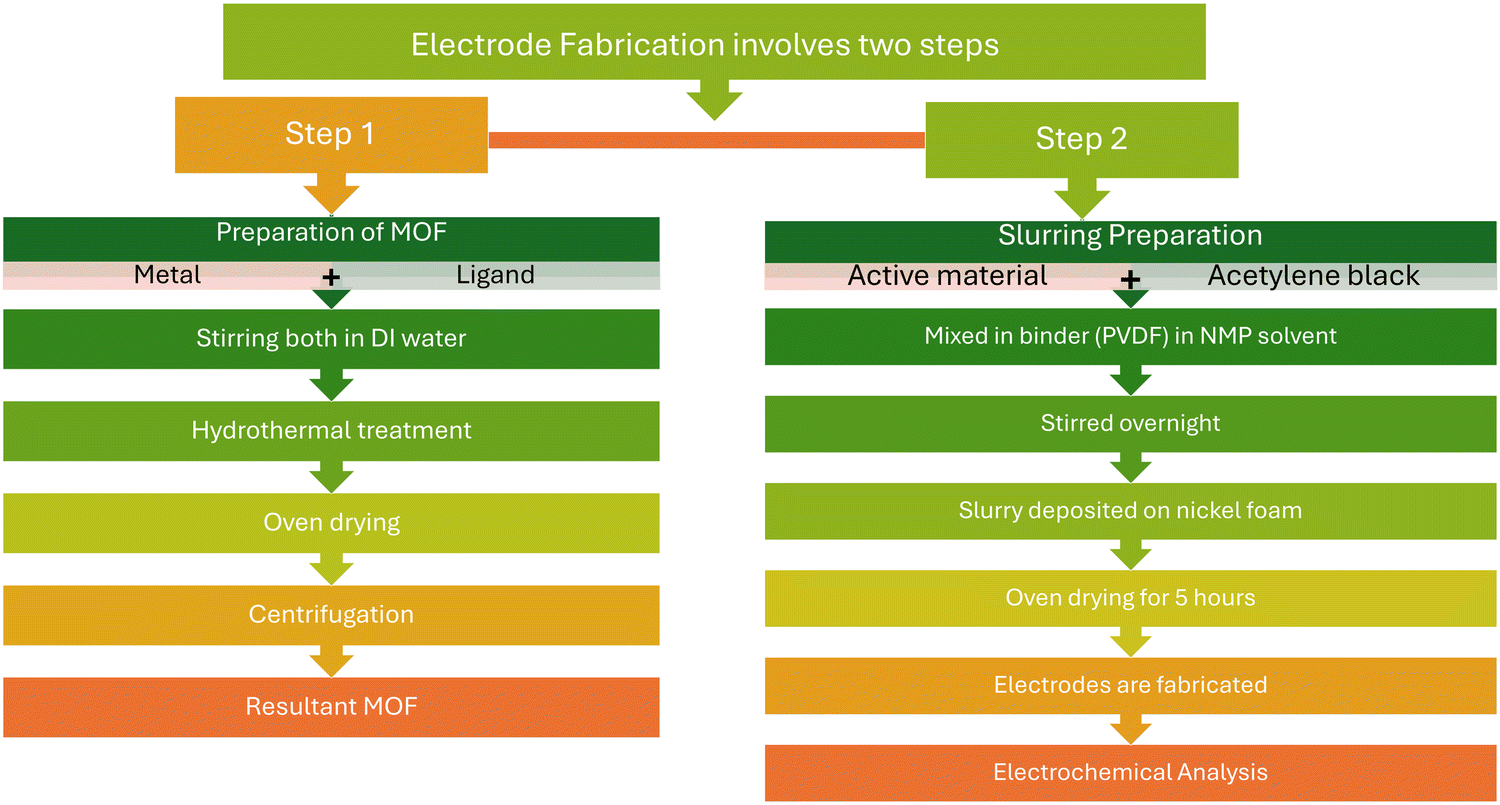 | ||
| Fig. 1 Synthesis of MOFs and the fabrication process of electrodes. | ||
2.3 Characterizations
X-ray diffraction was performed to investigate the crystallinity and phase purity of the samples. To study the morphology and structure, SEM images were acquired. Cyclic voltammetry (CV), galvanostatic charge–discharge (GCD), and electrochemical impedance spectroscopy (EIS) were carried out to examine the electrochemical performance of all the samples in the three-electrode assembly. The three-electrode setup was designed using the working electrodes with functioning Mercury/mercury-oxide (Hg/HgO) and platinum wire (Pt-wire) as the reference and counter electrodes in 1 M potassium hydroxide (KOH) electrolyte. The real device was then manufactured by integrating the best performing electrode with activated carbon as the counter electrode. CV, GCD and EIS measurements were performed for this device.3. Results and discussion
3.1 Structural characterizations
Employing a prototype X-ray diffraction framework, the structural characteristics of the material were identified. The arrangement used a radiation source of Cu-Kα at room temperature, at an accelerating voltage, tube current, and step size of 40 kV, 25 mA, and 0.05°, to obtain the structural data related to material deposition. The data were obtained via scanning ranges from 20° to 80°. The XRD data were collected three times to ensure uniformity. Fig. 2(a) illustrates the diffractograms of Pr2O3 and C18H6Cu3O12. The XRD analysis unveiled distinguishing peaks for Pr2O3 at 2θ values of 28°, 30°, 40°, and 49°, corresponding to the (002), (101), (110), and (210) planes respectively. These peaks perfectly reflect the reference (JCPDS: #42-1121).34 The XRD analysis of the C18H6Cu3O12 displays a significant peaks centered at an angle of 21.13°, 22.32°, 23.2°, 25.8°, 27.3°, 28.5°, 37.3°, and 46.82°, correlating the (440), (620), (640), (444), (551), (773), and (882) planes respectively. These peaks matched the reference (PDF#00-062-1183) database.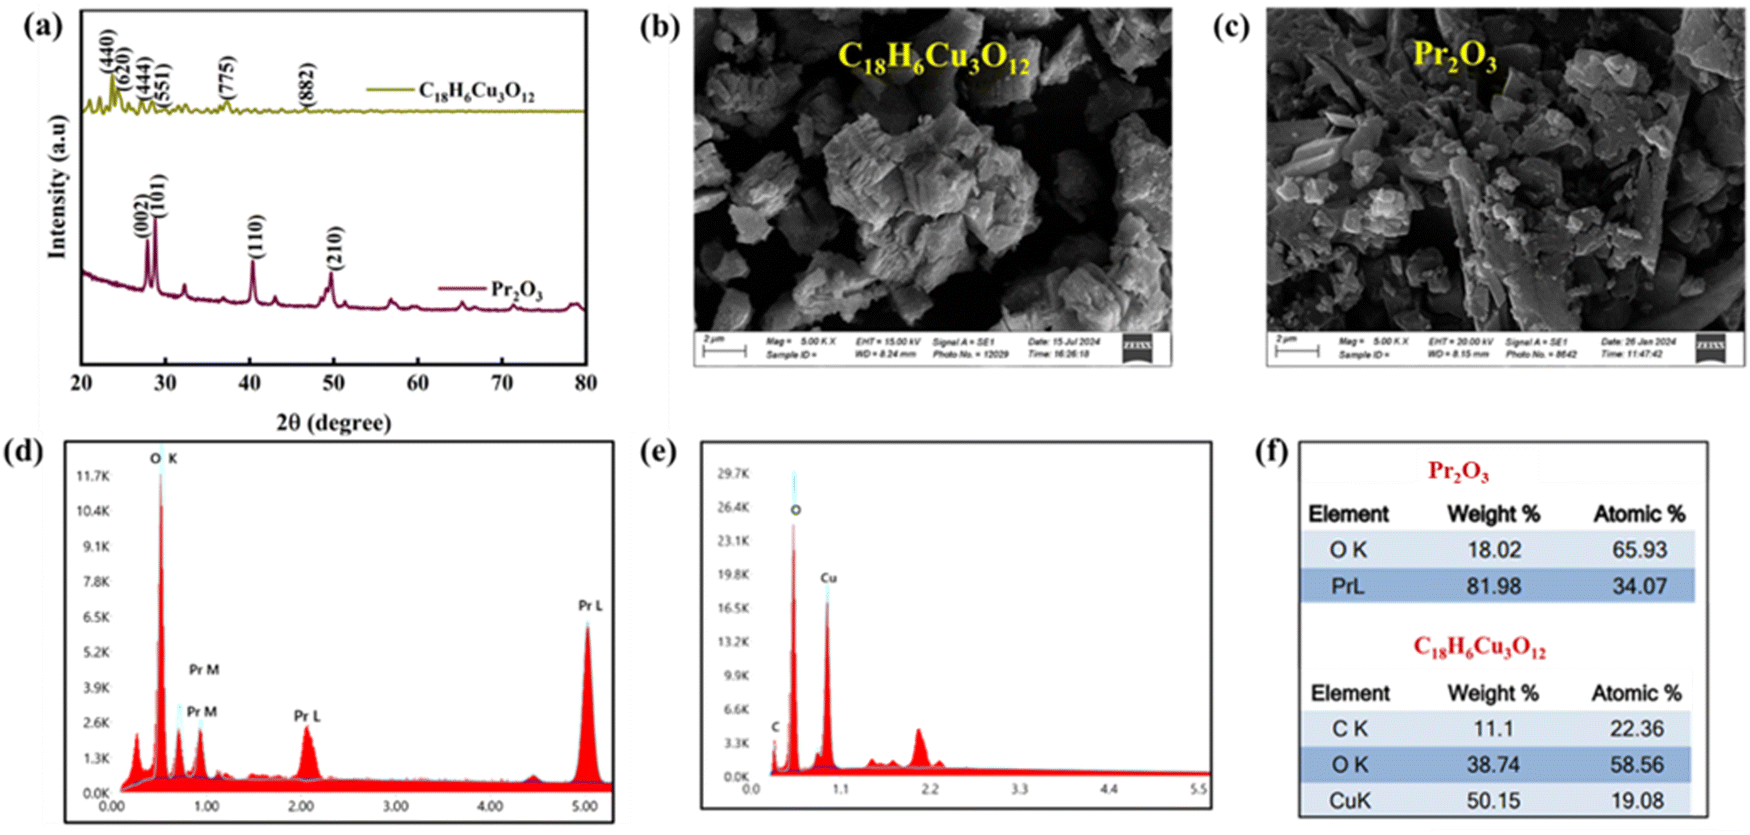 | ||
| Fig. 2 (a) X-ray diffractograms of Pr2O3 and C18H6Cu3O12. Scanning electron microscopic micrographs of (b) C18H6Cu3O12 and (c) Pr2O3. Energy-dispersive X-ray spectra of (d) Pr2O3, and (e) C18H6Cu3O12. (f) Atomic and weight percentage contributions of Pr2O3 and C18H6Cu3O12. | ||
3.2 Morphological analysis
SEM was used for examining the surface morphology of the fabricated electrodes. The micrograph of Pr2O3, and C18H6Cu3O12 can be seen in Fig. 2(b) and (c). For C18H6Cu3O12, the micrographs showed a flake-like morphology, a crucial characteristic for supercapacitor applications. By enhancing the required transportation of ions in the electrode's matrix, this flaky configuration promotes fast charge and discharge kinetics, boosting the material's capabilities of storing charge and ionic conductivity. Furthermore, the crystalline structure of Pr2O3 may aid in the efficient transfer of carriers and charge, minimizing the internal resistance and boosting the energy storage capacity. Moreover, it can minimize the morphological deterioration by supporting ion dissemination as well as adsorption. Both factors can improve the long-term durability of the supercapacitor. The composite then showed the presence of Pr2O3 and C18H6Cu3O12, integrating their crystalline and flaky features, which result in increased surface area and active sites. These results are verified by further electrochemical findings.3.3 Elemental analysis
After examining the physical characteristics of the fabricated electrodes, elemental analysis was performed using EDX. The EDX outcomes for Pr2O3 are shown in Fig. 2(d), confirming the presence of both oxygen and praseodymium. Following that, Fig. 2(e) depicts the chemical composition of C18H6Cu3O12, which is composed of carbon, copper, and oxygen.Afterwards, the atomic and weight percentages of elements in Pr2O3 and C18H6Cu3O12 are depicted in Fig. 2(f). The oxide was acquired from an accredited supplier (Sigma Aldrich), and its elemental composition was determined by EDX on the as-received granules. EDX gives semi-quantitative data rather than precise quantification owing to a variety of circumstances. The approach analyses by matching the observed X-ray intensities of the sample to those of reference standards; consequently, the findings are reliant on calibration, sample set up, and experimental parameters.
Because EDX predominantly studies a sample's surface or near-surface area, with an interaction that goes down to a few micrometres, it may not accurately represent the bulk arrangement. The detected variation in the stoichiometric percentage of Pr2O3 can be attributed to changes in the probability cross-section for the emission of X-rays among praseodymium (Pr) and oxygen (O). Additionally, matrix impacts, which occur when the composition of one element impacts the exhalation and recognition of X-rays from a different one, can have an impact on accuracy. To eliminate the undiscovered items, which can potentially lead to data skewing, EDX normally normalizes the findings to 100% for identified elements.
The findings of EDX in our study indicate that the composition approximately matches that of stoichiometric Pr2O3, which was earlier identified by the XRD.
4. Electrochemical analysis
4.1 Three-electrode assembly
| S. no | Name | Units |
|---|---|---|
| 1 | Scan rate | mV s−1 |
| 2 | Current density | A g−1 |
| 3 | Specific capacity | C g−1 |
| 4 | Energy density | W h kg−1 |
| 5 | Power density | W kg−1 |
The CV curves of Pr2O3 and C18H6Cu3O12, Pr2O3/C18H6Cu3O12 (50/50), Pr2O3/C18H6Cu3O12 (25/75) and Pr2O3/C18H6Cu3O12 (75/25) are represented in Fig. 3(a)–(e). The obtained voltammograms expressed clear redox peaks depicting the battery-grade nature of the electrode material. These peaks infer the occurrence of redox reactions between the electrode's active material and the OH− ions of electrolytes.35 The curve shapes at the lowest and highest scan rates were analyzed to predict the rate capability. For these samples, a notable shift in peaks was observed with an increment in scan rates. Furthermore, the shape of all the samples persists as unaffected at low scan rates, indicating the electrodes' phenomenal resilience, with the sole exception of a variance in select peak positions. However, there is a minimal change noted at high scan rates owing to the incompetence of ions to complete the reaction. These voltammogram patterns show that the mass transport rate was the governing factor in diffusion-regulated processes. This highlights the potential value of electrodes in electrochemical processes by proving their capacity to perform rapid and reversible faradaic reactions. However, from Fig. 3(f), it is clear that the material with an equal ratio appears to sustain its shape with least distortion at elevated scan rates, indicating relatively better rate capability. Pr2O3 and C18H6Cu3O12 have a minimum area under the curve, which demonstrates its meagre capacity, while areas enclosed by the composites are much greater, and thus, they have attained high capacities.
 | ||
| Fig. 3 Cyclic voltammograms of (a) Pr2O3, (b) C18H6Cu3O12, (c) Pr2O3/C18H6Cu3O12 (50/50), (d) Pr2O3/C18H6Cu3O12 (75/25), and (e) Pr2O3/C18H6Cu3O12 (25/75). (f) Comparison of all the samples’ voltammograms at 3 mV s−1. | ||
The further examination of the CV curves gives substantial insights into the electrochemical behaviour, specifically the polarization effects and shifts in the reduction peaks. The increased polarization at higher scan rates indicates a higher charge transfer resistance, which can occur when the kinetics of redox reactions cannot keep pace with the faster potential sweep rates. The polarization of the peak in the CV curve for the composites of Pr2O3 and C18H6Cu3O12 indicates that multiple electrochemical processes are occurring simultaneously, reflecting a more complex redox behavior than observed in the individual components.
The CV curve of the oxide shows an oxidation peak at 0.55 V and a pair of reduction peaks at 0.42 V and 0.49 V, suggesting limited redox activity due to the low surface area, as reflected in the relatively low current response of 18 mA. Conversely, the MOF demonstrates a higher oxidation peak of 0.60 V and reduction peaks at 0.48 V and 0.32 V, with a significant current of up to 61 mA, indicating enhanced electrochemical activity. However, the sharp rise in current after the peak may indicate increased polarization, especially at higher scan rates.
The presence of both materials introduces different redox couples within the composite; Pr2O3 can participate in oxidation and reduction reactions involving changes in the oxidation states of Pr (from +3 to +4), while C18H6Cu3O12 may engage in ligand-based electron transfer or redox processes involving its metal centers. This enhances the overall surface area and increases the density of active sites available for electrochemical reactions, leading to a more distributed reaction environment that contributes to polarization. Additionally, the blending may facilitate improved electron transfer and ion mobility, resulting in a more heterogeneous charge distribution throughout the composite. This can create variations in the local electrochemical activity, where different regions of the composite exhibit distinct kinetic properties, leading to a less sharp peak in the CV curves. Overall, the observed broadening signifies that the composite effectively combines the unique properties of both materials, enhancing the overall electrochemical performance. The CV curve of the oxide shows an oxidation peak at 0.55 V and a pair of reduction peaks at 0.42 V and 0.49 V, suggesting limited redox activity due to the low surface area, as reflected in the relatively low current response of 18 mA. Conversely, the MOF demonstrates a higher oxidation peak of 0.60 V and reduction peaks at 0.48 V and 0.32 V, with a significant current of up to 61 mA, indicating enhanced electrochemical activity.
The Pr2O3/C18H6Cu3O12 (50/50) blend shows an oxidation peak at 0.52 V and a reduction peak at 0.36 V, with a current of 69 mA, suggesting improved electron transfer due to the synergistic effects of blending. Further, in Pr2O3/C18H6Cu3O12 (75/25), the oxidation peak at 0.53 V and the reduction peak at 0.35 V indicate some improvement over the oxide alone, while the emergence of a new peak suggests the formation of a new redox couple due to the interaction between the two materials. Finally, the Pr2O3/C18H6Cu3O12 (25/75) configuration displays an oxidation peak of 0.56 V and a reduction peak of 0.36 V, along with a new redox peak at 0.27 V, indicating additional redox processes. The blended materials exhibit a similar behaviour to Pr2O3 in the positive scan and C18H6Cu3O12 in the negative scan, with a peak shifting at high scan rates due to their synergistic impact.
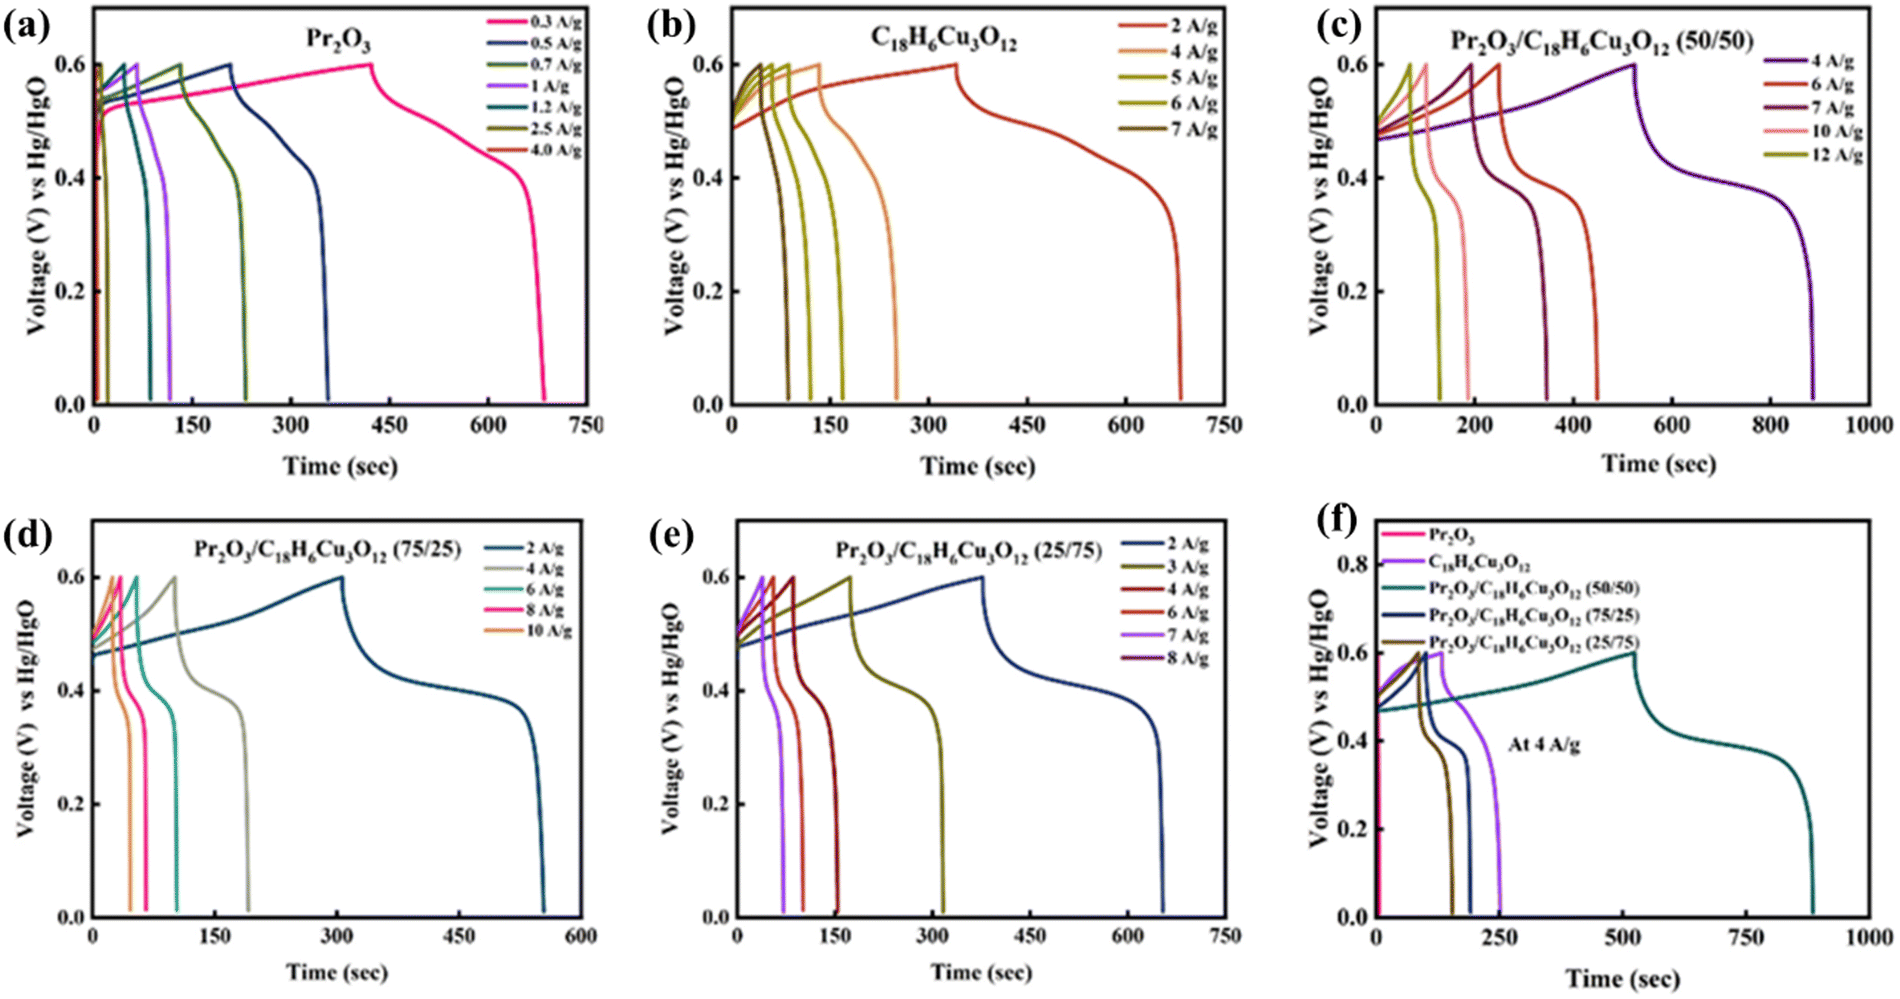 | ||
| Fig. 4 Galvanostatic charge–discharge curves of (a) Pr2O3, (b) C18H6Cu3O12, (c) Pr2O3/C18H6Cu3O12 (50/50), (d) Pr2O3/C18H6Cu3O12 (75/25), (e) Pr2O3/C18H6Cu3O12 (25/75). (f) Comparison of all the samples’ GCD curves at 4 A g−1. | ||
The IR drop of pristine MOFs and oxides is 0.049 V and 0.055 V, whereas for Pr2O3/C18H6Cu3O12 (50/50), Pr2O3/C18H6Cu3O12 (25/75) and Pr2O3/C18H6Cu3O12 (75/25), it is 0.16 V, 0.18 V and 0.15 V, respectively, which might be brought about by slower ion kinetics or modifications in the composite's conductivity. This would represent more battery-like behaviour, where ions are inserted and removed from active sites more slowly. The blend's possible interparticle interactions and capacitive and faradaic characteristics combine to further increase the electrochemical activity and produce clearer plateaus.
Further, the activation and ohmic polarization during discharge have a substantial impact on the electrochemical performance of battery-type electrodes. Activation polarization occurs as a result of the energy required to start electrochemical processes at the electrode–electrolyte interface, which reduces energy efficiency. Ohmic polarization occurs owing to internal resistance, resulting in a voltage decrease upon discharge. Larger droplets imply increased internal resistance and slower ion/electron movement. Understanding and limiting these polarizations are critical for optimizing energy storage device performance.
The ohmic drop varies greatly among samples, providing valuable insights into their internal resistances and electrochemical performance. The oxide electrode has the greatest ohmic drop from 0.55 V to 0.39 V (440 s to 650 s), showing significant internal resistance that reduces performance. The MOF electrode has a comparable range, with an ohmic drop of 0.54 V to 0.37 V (347 s to 658 s), but its longer discharge time indicates significantly better conductivity than the oxide.
Among the composite samples, the 50/50 MOF-oxide mix exhibits a more gradual and protracted ohmic drop from 0.44 V to 0.35 V (556 s to 827 s), indicating the lowest internal resistance and the highest electron/ion transport, greatly improving performance. The 75% oxide/25% MOF blend exhibits a quick ohmic decrease from 0.44 V to 0.35 V (350 s to 531 s), showing high resistance comparable to pure oxide, which reduces performance. Meanwhile, the 75% MOF/25% oxide mix experiences a reduction from 0.45 V to 0.34 V (429 s to 636 s), with a higher conductivity than the 75% oxide blend but less efficiency than the 50/50 blend. Overall, the synergistic effects between Pr2O3 and C18H6Cu3O12 drive the hidden chemistry behind these results, resulting in the formation of novel redox pathways, enhanced charge storage mechanisms, and a more complicated electrochemical performance than the separate materials.
With the elevated current density, the discharge period decreased due to the limited ion transfer between the electrode and the electrolyte interface, leading to a decline in efficiency.36 The GCD plots are backing the CV results by showing the highest discharge time for Pr2O3/C18H6Cu3O12 (50/50) as shown from the comparison in Fig. 4(f).
 | ||
| Fig. 5 (a) Electrochemical impedance spectroscopy of all samples. Trend of specific capacities through (b) CV and (c) GCD. | ||
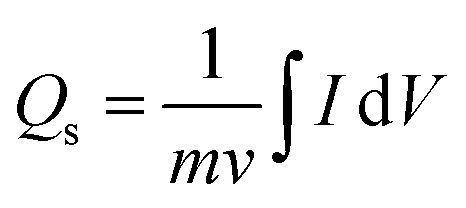 | (1) |
 | (2) |
| Material | Electrolyte | Specific capacitance/capacity | Ref. |
|---|---|---|---|
| HKUST-1@LaNiO3 | KOH | 786 F g−1 | 40 |
| CuO@Zn-Co-MOF | KOH | 684 F g−1 | 41 |
| CuO@Ni-MOF | N/A | 1455.75 F g−1 | 42 |
| Co3O4@Ni-MOF | KOH | 1980.7 F g−1 | 43 |
| NiCo2O4@MOF-5 | KOH | 557.5 F g−1 | 44 |
| NiCo2O4@Ni-MOF | KOH | 208.8 mA h g−1 | 45 |
| NiO@Ni-MOF | KOH | 1853 C cm−2 | 46 |
| NiO@Ni-MOF-25 | KOH | 1176.6 F g−1 | 47 |
| CeO2@ZIF-8 | KOH | 424.2 F g−1 | 48 |
| MnO2@MnHCF | Na2SO4 | 225.6 F g−1 | 49 |
| NiO2@CuHCF | Na2SO4 | 908 F g−1 | 50 |
| MnO2@CoHCF | Na2SO4 | 385 F g−1 | 51 |
| MnO2@NiHCF | Na2SO4 | 224 F g−1 | 52 |
| Pr 2 O 3 /C 18 H 6 Cu 3 O 12 (50/50) | KOH | 2046 C g −1 | This work |
From these characterizations, Pr2O3/C18H6Cu3O12 (50/50) has the highest capacity and rate capability with negligible resistance. Thus, it emerges to be a potential candidate for use as the battery-grade electrode in hybrid devices.
5. Electrochemical analysis of the hybrid device
After the evaluation of fabricated electrodes in half-cell configurations, the hybrid device was assembled by using Pr2O3/C18H6Cu3O12 (50/50) as the battery-grade (positive) electrode and activated carbon (AC) as the capacitive counter electrode in 1 M KOH solution. The visual graphic of the hybrid device is depicted in Fig. 6(a). The mass loading on both electrodes is done by using the following relation: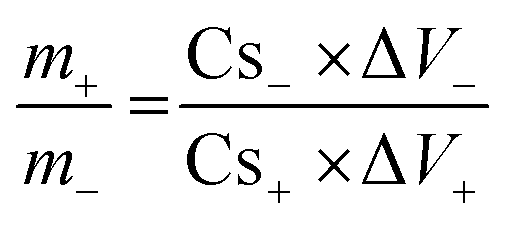 | (3) |
 | ||
| Fig. 6 (a) Schematic of the real device. (b) Comparison of CV curves of activated carbon and Pr2O3/C18H6Cu3O12 (50/50). (c) Cyclic voltammograms of Pr2O3/C18H6Cu3O12 (50/50)//AC. (d) Galvanostatic charge–discharge curves of Pr2O3/C18H6Cu3O12 (50/50)//AC. | ||
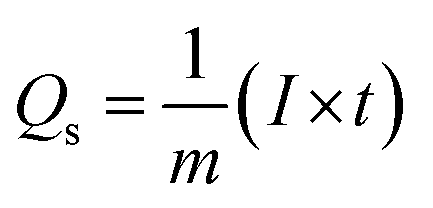
The CV curve of AC in −1.0 to 0 V potential window expressed a rectangular shape, indicating the super-capacitive behavior, while the CV curve of the active material in the 0–0.7 V potential window demonstrates anodic and cathodic peaks, asserting its battery-grade nature, as represented in Fig. 6(b). CV was further carried out for the hybrid device at a combined potential window of 0–1.7 V at different scan rates. Fig. 6(c) presents the CV profiles of device at various scan rates from 3 mV s−1 to 50 mV s−1. The CV curve revealed both rectangular shape and redox peaks, affirming the hybrid nature of device. The retention of shape at higher scan rates signifies the fine rate capability of the hybrid device. Afterwards, the GCD measurements were taken in 1–1.6 V potential window at multiple current densities. The GCD plots of device are demonstrated in Fig. 6(d). These profiles are compatible with earlier reported CV profiles as the presence of both linear and non-linear regions certifies the hybrid nature of this device. The fall in discharge time with up-rising current densities is an indicator of only the outer surface's contribution to charge storage because of inadequate time. The trend of specific capacity values of device at different current densities is depicted in Fig. 7(a). From the trend, it is clear that the highest specific capacity attained by the device is 310 C g−1 at a current density of 1.3 A g−1. Afterwards, the EIS was proceeded on the device for in-depth inquisition of reaction kinetics and impedance evaluation. The Nyquist plot of the device along with its fitted model is depicted in Fig. 7(b). No semi-circle was observed in the plot, which uncovers the refined chemical activity of material. Further the capacity retention of the device is analyzed which shows that the device maintained 98% of its original value after 3000 GCD cycles as depicted in Fig. 7(c). The energy and power densities were further figured out using the following relations:
 | (4) |
 | (5) |
 | ||
| Fig. 7 (a) Specific capacity trend of the real device through GCD. (b) Nyquist plot of the device along with the fitted model. (c) Capacity retention of the device after 3000 GCD cycles. (d) Energy and power density of the device. | ||
| Materials | Specific capacitance/capacity | Energy density | Power density | Ref. |
|---|---|---|---|---|
| CeO2@ZIF-8 | 89 F g−1 | 31.3 W h kg−1 | 800 W kg−1 | 48 |
| NiCo2O4@Ni-MOF | 41.5 mA h g−1 (149.6 C g−1) | 32.6 W h kg−1 | 348.9 W kg−1 | 45 |
| MnO2@CoHCF | 76.3 F g−1 | 47.3 W h kg−1 | 1100 W kg−1 | 51 |
| Ni-Co-ZIF/CuO | 210 C g−1 | 43 W h kg−1 | 10![[thin space (1/6-em)]](https://www.rsc.org/images/entities/char_2009.gif) 600 W kg−1 600 W kg−1 |
53 |
| Co/Cu-MOF&Cu3O | 82.14 F g−1 | 25.67 W h kg−1 | 3786.46 W kg−1 | 54 |
| TiO2/Co-MOF | 36 C g−1 | 7.5 W h kg−1 | 375 W kg−1 | 55 |
| NiO@Ni-MOF | 144 F g−1 | 39.2 W h kg−1 | 7000 W kg−1 | 46 |
| Pr 2 O 3 /C 18 H 6 Cu 3 O 12 (50/50) | 310 C g −1 | 67 W h kg −1 | 6114 W kg −1 | This work |
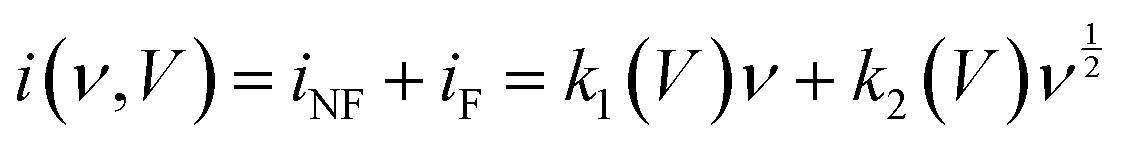
6. Quantifying capacitive and diffusive contributions of the device
After evaluating the device's electrochemical properties, we employed, examined, and then contrasted two distinct models, identified as the linear and quadratic models, to identify the best approximate values of the device's capacitive and diffusive contributions. The study clearly demonstrated the applicability of the quadratic model as it fitted on the experimental data.Because of the combination of faradaic and non-faradaic responses, the device delivers two distinct currents from its two combined properties of batteries and capacitors. Non-faradaic events were caused by the presence of capacitive electrodes, which do not entail charge transfer behavior and instead rely on the double-layer effect, while the battery-graded electrode was accountable for the faradaic reactions that occur due to the material's ability to endure oxidation and reduction processes. Consequently, in the HSC, capacitive and diffusive effects evolve. Hence:
 | (6) |
 . Further, the linear model is fitted on the actual experimental data of the device via adding the capacitive and diffusive contributions of the device, as depicted in Fig. 8(a)–(c), regardless of an effective attempt to imitate the experimental results. The model lacks to fit on many sections of the experimental values, particularly around peaks and other sections, which contradicts the fundamental assumption of linearity. Applying a linear model under these conditions appears to go against the norm of what is acceptable. Therefore, to overcome the restrictions, we have added a diffusive correction to the previous model, which resulted in the quadratic model. The equation is as follows:
| i(ν, V) = β1ν + β2ν1/2 + β2ν3/2 + ε | (7) |
 | ||
| Fig. 8 (a)–(c) Linear model fitting on experimental data. (d)–(f) Quadratic model fitting on experimental data. | ||
Afterwards, the bar plot presented in Fig. 9(a) and (b) highlights the relative contributions from both models, as well as the differential percentage fluctuations at different scan rates. At high scan rates, ions do not get enough time to complete the reaction, increasing the capacitive contribution. Afterwards, we calculated the capacitive and diffusive contributions of both models. Their comparison is presented in Fig. 9(c) and (d). The experimental results for both models show that Pr2O3/C18H6Cu3O12 (50/50) exhibits both capacitor and battery characteristics, with diffusive outcomes outweighing capacitive inputs. At low scan rates, the device is primarily diffusive, suggesting that the battery type's electrode is the one that allows ions to perform faradaic reactions.
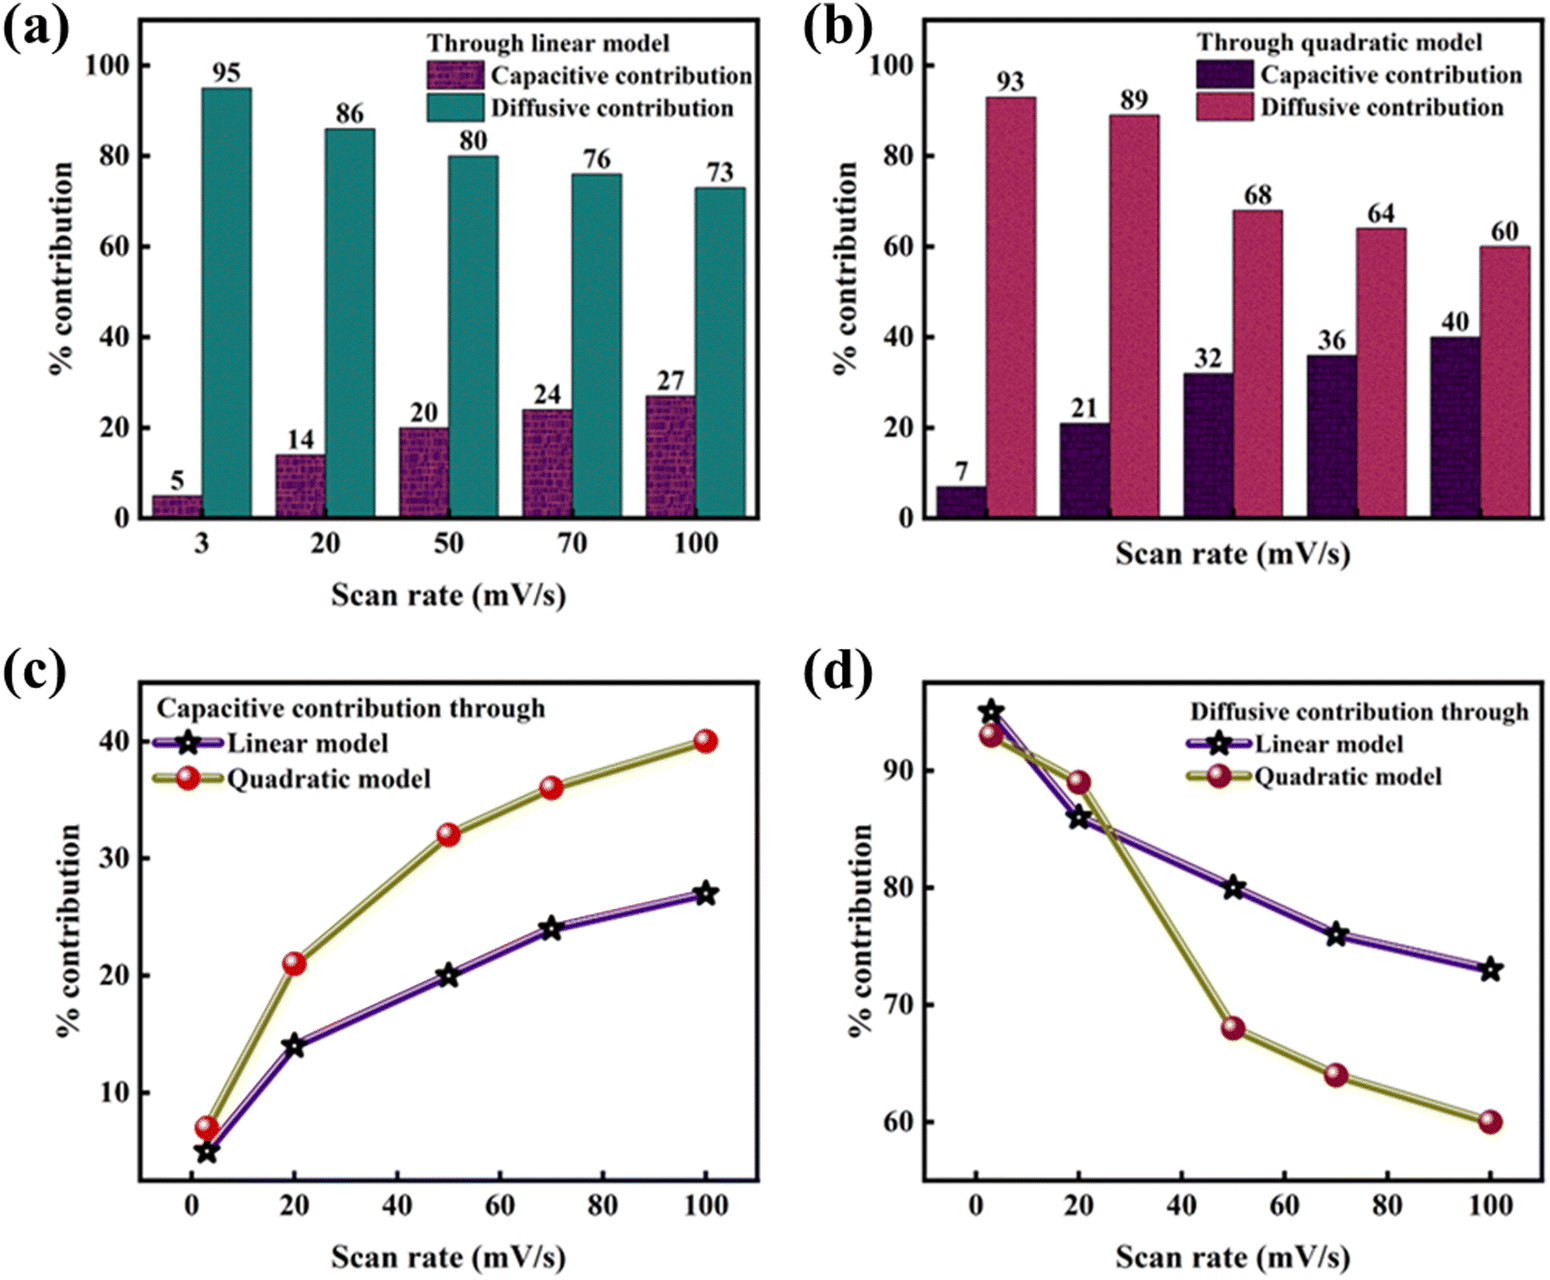 | ||
| Fig. 9 Bar plots of capacitive and diffusive contributions from (a) linear model and (b) quadratic model. (c) Capacitive contribution via linear and quadratic models. (d) Diffusive contribution via linear and quadratic models. | ||
7. Conclusion
In this work, Pr2O3, C18H6Cu3O12 and their composites with 3 different ratios were studied and compared for their application as positive electrode materials for HSCs. For the initial evaluation, SEM, XRD and EDX were performed for structural, crystalline and elemental studies. After that, all the samples were explicitly tested in a half cell configuration. Based on the outcomes, Pr2O3/C18H6Cu3O12 (50/50) resulted in a high specific capacity of 2046 C g−1 by CV and 1539 C g−1 by GCD, demonstrating better rate capability. Because of its distinguished performance, it was coupled with activated carbon in a hybrid device. The maximum energy density was evaluated to be 67 W h kg−1 with a corresponding power density of 6114 W kg−1, which is the highest value. The device sustained 98% of its original value after 3000 cycles, indicating considerable cycling stability. The refined performance of this material was attributed to the synergistic effect between Pr2O3 and C18H6Cu3O12, each compensating for the other one's limitation and resulting in enhanced electrochemical activity. These findings assert that the Pr2O3/C18H6Cu3O12 composite is a reliable material for futuristic use in energy storage devices.Data availability
The data related to this work can be found at the following link: https://osf.io/ktrb2/files/osfstorage/6720b43150300bb0286297c0.Conflicts of interest
There are no conflicts to declare.Acknowledgements
The authors extend their appreciation to the Researchers Supporting Project Number (RSPD2025R1072), King Saud University, Riyadh, Saudi Arabia.References
- M. Chen, Y. Zhang, G. Xing, S.-L. Chou and Y. Tang, Energy Environ. Sci., 2021, 14, 3323–3351 RSC.
- D.-G. Wang, Z. Liang, S. Gao, C. Qu and R. Zou, Coord. Chem. Rev., 2020, 404, 213093 CrossRef CAS.
- A. Rehman, A. Rauf, M. Ahmad, A. A. Chandio and Z. Deyuan, Environ. Sci. Pollut. Res., 2019, 26, 21760–21773 CrossRef CAS PubMed.
- A. Qazi, F. Hussain, N. A. Rahim, G. Hardaker, D. Alghazzawi, K. Shaban and K. Haruna, IEEE Access, 2019, 7, 63837–63851 Search PubMed.
- M. Minakshi and D. Meyrick, Electrochim. Acta, 2013, 101, 66–70 CrossRef CAS.
- L. Peng, Y. Zhu, D. Chen, R. S. Ruoff and G. Yu, Adv. Energy Mater., 2016, 6, 1600025 CrossRef.
- B. Dunn, H. Kamath and J.-M. Tarascon, Science, 2011, 334, 928–935 CrossRef CAS PubMed.
- D. P. Dubal, O. Ayyad, V. Ruiz and P. Gomez-Romero, Chem. Soc. Rev., 2015, 44, 1777–1790 RSC.
- B. K. Kim, S. Sy, A. Yu and J. Zhang, Handbook Clean Energy Systems, 2015, 1–25 Search PubMed.
- İ. A. Kariper, S. Korkmaz, C. Karaman and O. Karaman, Fuel, 2022, 324, 124497 CrossRef.
- M. Z. Iqbal, M. M. Faisal and S. R. Ali, Int. J. Energy Res., 2021, 45, 1449–1479 CrossRef CAS.
- D. P. Chatterjee and A. K. Nandi, J. Mater. Chem. A, 2021, 9, 15880–15918 RSC.
- A. Muzaffar, M. B. Ahamed, K. Deshmukh and J. Thirumalai, Renewable Sustainable Energy Rev., 2019, 101, 123–145 CrossRef CAS.
- A. Ghosh and Y. H. Lee, ChemSusChem, 2012, 5, 480–499 CrossRef CAS PubMed.
- A. Borenstein, O. Hanna, R. Attias, S. Luski, T. Brousse and D. Aurbach, J. Mater. Chem. A, 2017, 5, 12653–12672 RSC.
- M. Z. Iqbal, U. Aziz, M. W. Khan, S. Siddique, M. Alzaid and S. Aftab, J. Electroanal. Chem., 2022, 924, 116868 CrossRef CAS.
- Y. Shi, L. Peng, Y. Ding, Y. Zhao and G. Yu, Chem. Soc. Rev., 2015, 44, 6684–6696 RSC.
- A. Kanwade and P. M. Shirage, J. Energy Storage, 2022, 55, 105692 CrossRef.
- S. S. Shah, M. A. Aziz and Z. H. Yamani, Chem. Rec., 2022, 22, e202200018 CrossRef CAS PubMed.
- H. Huang and J.-J. Zhu, Analyst, 2019, 144, 6789–6811 RSC.
- Y. Xin, S. Lu, W. Xu and S. Wang, New J. Chem., 2023, 47, 211–219 RSC.
- Y. Li, B. Guan, A. Maclennan, Y. Hu, D. Li, J. Zhao, Y. Wang and H. Zhang, Electrochim. Acta, 2017, 241, 395–405 CrossRef CAS.
- D. B. Bailmare, P. Tripathi, A. D. Deshmukh and B. K. Gupta, Sci. Rep., 2022, 12, 3084 CrossRef CAS PubMed.
- S. J. Zhu, J. Q. Jia, T. Wang, D. Zhao, J. Yang, F. Dong, Z. G. Shang and Y. X. Zhang, Chem. Commun., 2015, 51, 14840–14843 RSC.
- A. A. Yadav, A. C. Lokhande, J. H. Kim and C. D. Lokhande, Int. J. Hydrogen Energy, 2016, 41, 18311–18319 CrossRef CAS.
- R. Rajagopal and K.-S. Ryu, J. Ind. Eng. Chem., 2018, 60, 441–450 CrossRef CAS.
- N. Maheswari and G. Muralidharan, Energy Fuels, 2015, 29, 8246–8253 CrossRef CAS.
- K. T. Kubra, A. Javaid, B. Patil, R. Sharif, A. Salman, S. Shahzadi, S. Siddique and S. Ghani, Ceram. Int., 2019, 45, 6819–6827 CrossRef CAS.
- M. N. ur Rehman, T. Munawar, M. S. Nadeem, F. Mukhtar, A. Maqbool, M. Riaz, S. Manzoor, M. N. Ashiq and F. Iqbal, Ceram. Int., 2021, 47, 18497–18509 CrossRef.
- X. Wang, C. Yang, T. Wang and P. Liu, Electrochim. Acta, 2011, 58, 193–202 CrossRef CAS.
- T. Munawar, F. Mukhtar, M. S. Nadeem, S. Manzoor, M. N. Ashiq, M. Riaz, S. Batool, M. Hasan and F. Iqbal, Ceram. Int., 2022, 48, 19150–19165 CrossRef CAS.
- S. Chuhadiya, D. Suthar, S. L. Patel and M. S. Dhaka, Coord. Chem. Rev., 2021, 446, 214115 CrossRef CAS.
- N. H. N. Azman, M. M. Alias and Y. Sulaiman, Energies, 2023, 16, 7072 CrossRef CAS.
- B. Matović, J. Pantić, M. Prekajski, N. Stanković, D. Bučevac, T. Minović and M. Čebela, Ceram. Int., 2013, 39, 3151–3155 CrossRef.
- H. Jia, Z. Wang, C. Li, X. Si, X. Zheng, Y. Cai, J. Lin, H. Liang, J. Qi, J. Cao, J. Feng and W. Fei, J. Mater. Chem. A, 2019, 7, 6686–6694 RSC.
- Z. Hu, L. Zu, Y. Jiang, H. Lian, Y. Liu, Z. Li, F. Chen, X. Wang and X. Cui, Polymers, 2015, 7, 1939–1953 CrossRef CAS.
- Q. Wang, Q. Cao, X. Wang, B. Jing, H. Kuang and L. Zhou, J. Power Sources, 2013, 225, 101–107 CrossRef CAS.
- X. Xiao, T. Li, P. Yang, Y. Gao, H. Jin, W. Ni, W. Zhan, X. Zhang, Y. Cao, J. Zhong, L. Gong, W.-C. Yen, W. Mai, J. Chen, K. Huo, Y.-L. Chueh, Z. L. Wang and J. Zhou, ACS Nano, 2012, 6, 9200–9206 CrossRef CAS PubMed.
- M. Z. Iqbal, M. M. Faisal, S. R. Ali, S. Farid and A. M. Afzal, Electrochim. Acta, 2020, 346, 136039 CrossRef CAS.
- P. Goel, A. Deep and S. Mishra, J. Alloys Compd., 2023, 934, 167991 CrossRef CAS.
- I. Hussain, S. Iqbal, T. Hussain, W. L. Cheung, S. A. Khan, J. Zhou, M. Ahmad, S. A. Khan, C. Lamiel and M. Imran, Mater. Today Phys., 2022, 23, 100655 CrossRef CAS.
- S. Kumar, P. H. Weng and Y. P. Fu, Mater. Today Chem., 2022, 26, 101159 CrossRef CAS.
- Q. Bi, Q. Ma, K. Tao and L. Han, Dalton Trans., 2021, 50, 8179–8188 RSC.
- M. Jayachandran, T. Maiyalagan, T. Vijayakumar and B. Gunasekaran, Mater. Lett., 2021, 302, 130338 CrossRef.
- G. Li, H. Cai, X. Li, J. Zhang, D. Zhang, Y. Yang and J. Xiong, ACS Appl. Mater. Interfaces, 2019, 11, 37675–37684 CrossRef CAS PubMed.
- S. Xiong, S. Jiang, J. Wang, H. Lin, M. Lin, S. Weng, S. Liu, Y. Jiao, Y. Xu and J. Chen, Electrochim. Acta, 2020, 340, 135956 CrossRef CAS.
- G. Wang, Z. Yan, N. Wang, M. Xiang and Z. Xu, ACS Appl. Nano Mater., 2021, 4, 9034–9043 CrossRef CAS.
- I. Rabani, K. Karuppasamy, D. Vikraman, H.-S. Kim and Y.-S. Seo, J. Alloys Compd., 2021, 875, 160074 CrossRef CAS.
- Y. Wang, H. Zhong, L. Hu, N. Yan, H. Hu and Q. Chen, J. Mater. Chem. A, 2013, 1, 2621–2630 RSC.
- U. Shuaib, T. Hussain, R. Ahmad, M. Imranullah, M. Amjad, A. Yasin, I. Shakir and D. J. Kang, J. Solid State Electrochem., 2023, 27, 715–725 CrossRef CAS.
- Z. Song, W. Liu, Q. Zhou, L. Zhang, Z. Zhang, H. Liu, J. Du, J. Chen, G. Liu and Z. Zhao, J. Power Sources, 2020, 465, 228266 CrossRef CAS.
- Y. Wang and Q. Chen, ACS Appl. Mater. Interfaces, 2014, 6, 6196–6201 CrossRef CAS PubMed.
- I. Hussain, S. Iqbal, T. Hussain, Y. Chen, M. Ahmad, M. S. Javed, A. AlFantazi and K. Zhang, J. Mater. Chem. A, 2021, 9, 17790–17800 RSC.
- X. Cao, L. Cui, B. Liu, Y. Liu, D. Jia, W. Yang, J. M. Razal and J. Liu, J. Mater. Chem. A, 2019, 7, 3815–3827 RSC.
- V. Ramasubbu, F. S. Omar, K. Ramesh, S. Ramesh and X. S. Shajan, J. Energy Storage, 2020, 32, 101750 Search PubMed.
| This journal is © The Royal Society of Chemistry 2025 |