
 Open Access Article
 This Open Access Article is licensed under a
 Creative Commons Attribution 3.0 Unported Licence
Voltage and temperature effects on low cobalt lithium-ion battery cathode degradation†
Hernando J.
Gonzalez Malabet
 a,
Megan
Gober
a,
Prehit
Patel
a,
Alex
L’Antigua
a,
Austin
Gabhart
a,
Joseah
Amai
a,
Xianghui
Xiao
b and
George J.
Nelson
*a
a,
Megan
Gober
a,
Prehit
Patel
a,
Alex
L’Antigua
a,
Austin
Gabhart
a,
Joseah
Amai
a,
Xianghui
Xiao
b and
George J.
Nelson
*a
aDepartment of Mechanical & Aerospace Engineering, The University of Alabama in Huntsville, Huntsville, AL 35899, USA. E-mail: george.nelson@uah.edu
bNational Synchrotron Lightsource II, Brookhaven National Laboratory, Upton, NY 11973, USA
First published on 10th December 2024
Abstract
Degradation of low cobalt lithium-ion cathodes was tested using a full factorial combination of upper cut-off voltage (4.0 V and 4.3 V vs. Li/Li+) and operating temperature (25 °C and 60 °C). Half-cell batteries were analyzed with electrochemical and microstructural characterization methods. Electrochemical performance was assessed with galvanostatic cycling, cyclic voltammetry (CV), and electrochemical impedance spectroscopy (EIS) supported by distribution of relaxation times (DRT) analysis. Electrode microstructure was characterized with scanning electron microscopy (SEM), X-ray diffraction (XRD), and X-ray absorption near edge structure (XANES) imaging. Higher cut-off voltage cycling shows presence of NiOx formation, a low diffusivity rock-salt phase, in both CV and XRD data. XRD patterns confirmed that the rock-salt phase was beginning to form at the low cut-off voltage at high temperature, but in much lower intensity than at the high cut-off voltage. Higher temperature accelerates degradation processes at both voltages. Degradation factors at high temperature include NiOx formation, cathode material dissolution, and electrolyte decomposition. SEM analysis suggests that supporting phases may isolate and disconnect active material particles reducing capacity retention and battery life cycle. DRT analysis and XANES imaging show that both high temperature samples revealed a NiOx phase based on an increased diffusive impedance and a visible shift in the XANES spectra. The low cut-off voltage, high temperature sample showed a split peak and shift to lower energies indicating early formation of the NiOx phase. The diffusive impedance, which hinders intercalation and deintercalation, is driven by the formation of the NiOx phase. While primarily driven by cut-off voltage, elevated temperature also contributes to this degradation mechanism.
1. Introduction
Further development of the next-generation lithium-ion battery (LIB) requires increased energy density paired with the capability for fast charging. This development needs to keep pace with the increasing market share projection for electric vehicles, demand for mobile devices, and need for grid-scale energy storage. Electrodes that are capable of increasing the cell energy density and capacity have been studied and developed throughout the past forty years by optimizing active materials and microstructural geometries.1–13 Although promising, these materials still present a range of challenges covering areas of performance, reliability, and sustainability. Among these challenges, battery degradation limits the performance and reliability of current LIBs. Advancements in battery materials and microstructures have helped reduce, but not eliminate, variations in key drivers of degradation such as cell voltage, temperature, local current density, and heat generation. These conditions have been shown to contribute to the degradation of both cathode and anode.14 A better understanding of the degradation mechanisms that affect next generation batteries is necessary for the design and development of the batteries needed to support a more sustainable global energy infrastructure.Graphite, the common commercial anode active material, yields a theoretical capacity of 372 mA h g−1, whereas most cathode active materials are limited to capacities under 200 mA h g−1. This capacity asymmetry is a primary motivation for pursuing higher capacity cathode materials to improve overall cell capacity. The most common active material used commercially for anodes is graphitic carbon, while commercial cathodes use lithium-transition metal oxides. Specifically, layered transition metal oxides of the form LiMO2 (M: Ni, Co, Mn, or a combination thereof) offer a route to increase overall capacity.7,15 Forms of the oxide Li(NixMnyCo1−x−y)O2, or NMC, offer theoretical capacities of up to 250 mA h g−1. For these materials, there is a drive to reduce or eliminate cobalt content due to supply chain sensitivity as well as environmental and humanitarian issues in the cobalt supply chain.
One of the most common solutions for reducing the amount of cobalt in NMC cathodes is the increase of Ni content, which is favorable due to the higher specific capacity achieved with higher Ni content.16,17 However, increasing Ni content results in faster electrochemical cell degradation and increases thermal instability.18,19 The electrode structure can significantly influence the thermal and electrochemical responses of Li-ion batteries, further affecting their performance under varying operational conditions.20,21 This degradation is associated with several phenomena including oxygen release from the active material, impedance rise, transition metal dissolution, and fracture of the active material microparticles.7,22 It can be mitigated by restricting operating voltage, as the key degradation mechanisms are driven largely by crystal structure changes at higher voltages. However, this approach inherently reduces the overall cell capacity.7
In addition to degradation due to increase Ni content, temperature is another major factor that influences cathode degradation.23–27 Temperature cycling above 60 °C accelerates capacity and power degradation through different mechanisms. At increased temperatures, most reactive cathode materials (using Fe3+, Mn2+, and Ni4+ metal ions for intercalation reactions) may also suffer from partial dissolution when reacting with hydrofluoric acid (HF), which is a remnant from trace water impurities during cell assembly that reacts with LiPF6 commonly used as the salt in the electrolyte. Damage to the solid electrolyte interphase (SEI) and electrolyte decomposition can occur due to this side reaction.26,28 Electrolyte decomposition can increase the SEI layer in the cathode and lead to loss of lithium inventory.15,29 To further understand the degradation within LIBs without the need for invasive techniques, EIS, a non-invasive technique, has been of recent interest to improve understanding of diffusion, mass transport, and other impedance effects.30 Electrochemical reactions at the electrode–electrolyte interface can be divided into a series of multistep processes, including mass transport and charge-transfer processes,31,32 that each occur at distinct rates and frequencies, and may impact battery behavior over different timescales.33,34 The use of EIS enables analysis of the time-dependent mechanisms based on the response of the system collected at a range of frequencies.
The predominant method of analyzing EIS is through the use of equivalent circuit models (ECMs). ECMs allow for the tracking of impedance changes occurring within the cell by correlating them to specific circuit parameters. Determination of a proper equivalent circuit often relies on individual experience and literature reports, but it is also possible to have multiple circuits that statistically fit the collected data or multiple processes occurring in a similar frequency range. The non-unique nature of ECMs brings challenges to accurately analyzing collected EIS results.35–37
In these cases, it is difficult to determine the best circuit to describe the observed physical behavior. Due to the ambiguity of some equivalent circuit models, multiple research groups have applied the method of distribution of relaxation times (DRT) to impedance data as an alternative analysis method.38,39 These models use measured impedance at specific frequencies to analyze frequency dependent polarization effects. DRT analysis has been successfully used to detect lithium plating during fast charging,40 to evaluate aging mechanisms during low temperature and high temperature cycling,41 and to determine predominant processes within the impedance spectra of lithium-ion batteries.34–37,42
EIS coupled with DRT can provide valuable insight into LIB degradation. Since the time constant distribution produced by DRT is a frequency dependent process, it is possible to identify electrochemical phenomena based on the location of individual peaks within the distribution.34 Peak attributions for lithium-ion batteries have been identified in literature using data collected from full cells, half cells, and symmetrical cells, as shown in Table 1. Tracking the evolution of these peaks provides an unambiguous means of assessing degradation mechanisms.
| Frequency range (Hz) | Peak attribution | Ref. |
|---|---|---|
| 10−1–101 | Constant phase and solid-state diffusion | 34 and 36 |
| 101–102 | CEI (cathode electrolyte interphase) | 35–37, 41 and 42 |
| 102–103 | SEI (solid electrolyte interphase), lithium counter electrode | 34, 35 and 42 |
| 102–103 | Contact resistance | 35, 36 and 42 |
Direct observation of battery microstructure with X-ray imaging provides a strong complement to electrochemical analysis for layered oxide cathode materials.43–50 X-Ray microtomography can be employed to quantify transport properties, geometrical features, and morphological parameters, which are critical for understanding battery performance and degradation.8,51,52 X-Ray tomography provides micro- and nano-scale 3D visualization of battery materials with the capability for discerning chemical composition. X-Ray absorption near-edge structure (XANES), an analytical technique, is typically used to track changes of oxidation state in electrochemically active elements by investigating the cross section of an absorption edge. Three primary sections of the XANES region are typically analyzed.53 First, the intensity of pre-edge features is affected by the coordination geometry of the central atom. Second, at the edge, a formal oxidation state may be assigned as the energy of the edge. Third, beyond the edge, the coordination shells can be investigated as scattering occurs from neighboring atoms. Recent research on cathodes has analyzed the XANES spectra at the white-line position, known as the principal absorption maximum.43,44 By tracking the white-line position, research on nickel-rich layered cathodes showed significant differences in the probability density distributions for the degradation response of two different electrolytes, which explicitly showed changes within the oxidation states of the samples.43
In this paper the combined effects of upper cut-off voltage and operating temperature are analyzed for low-cobalt LIB cathodes. A full factorial set of experiments for high and low values of each variable is tested. Cycling tests and electrochemical characterization, including EIS supported by DRT analysis, are paired with materials characterization including SEM, XRD, and nanoscale XANES imaging. Combined these methods provide a picture of degradation in both the crystal structure of the active material and cathode microstructure. While the upper cut-off voltage is found to drive degradation behavior, the results demonstrate that temperature also contributes to performance degradation, even under voltage conditions that are expected to have lower risk of performance degradation.
2. Methods
2.1. Materials and battery fabrication
Cathodes were produced using Li(Ni0.8Mn0.1Co0.1)O2 (NMC811) active material (MSE Supplies). The fabrication of slurries consisted of mixing the active material (AM), carbon black (MSE Supplies) as the conductive additive (CA), and PVDF (Sigma Aldrich) as the binder (B) in a ratio of 90![[thin space (1/6-em)]](https://www.rsc.org/images/entities/char_2009.gif) :5:5 (AM:CA:B) by weight. These components were mixed with N-methyl-2-pyrrolidone (NMP, Sigma-Aldrich) solvent by a 4:1 volume to mass ratio, to get a slurry consistency that facilitated casting. The mixture was then mixed in an automatic vortex mixer (VWR-120 V) intermittently for 20 minutes using glass or zirconium balls.
:5:5 (AM:CA:B) by weight. These components were mixed with N-methyl-2-pyrrolidone (NMP, Sigma-Aldrich) solvent by a 4:1 volume to mass ratio, to get a slurry consistency that facilitated casting. The mixture was then mixed in an automatic vortex mixer (VWR-120 V) intermittently for 20 minutes using glass or zirconium balls.
Prior to casting, the cathode foil substrate was cleaned and etched on both sides using deionized water and isopropanol as described by Minter et al.54 The substrate used was a 15 μm thick aluminum (Al) foil (Electrodes and More). After substrate cleaning, the electrode slurry was cast on the foil with a wet thickness of 150 μm using an automatic coater with a doctor blade (Elcometer 4340). Following casting the electrode was dried for 12 hours at ambient conditions before drying for 6 hours under vacuum at 85 °C using the vacuum oven (JeioTech-OV11).
Different types of battery assembly formats were used for testing, specifically test cells, single layer pouch cells, and coin cells. All batteries were assembled and cycled in a half-cell format. The main components of these batteries are Li foil (anode), Celgard separator (MTI Corporation), 1.0 M LiPF6 in ethylene carbonate and diethyl carbonate (EC/DEC) electrolyte (Sigma-Aldrich, battery grade) and NMC cathode on Al substrate. These cells were assembled under a glove box filled with argon. Test cells from EL-cell and MTI were assembled and cycled for half-cell formats. As with test cells, half-cell pouch cells were manufactured using the same ratios and preparation sequence. The main difference in the formats resides on the sealing of the pouch cell battery; whereas with the test cells it is done by applying manual pressure, with the pouch seal it needs to be done with a thermal sealer. Finally, half-cells were also prepared in coin cell format using the electric coin cell crimping machine (Micro&Nano Tools ECCCM-160E-A). The pressure used for crimping each battery was 1.30 T. All formats showed proper electrochemical data results and repeatability consistent with data in the literature.55–57
2.2. Cycling and electrochemical characterization
Several electrochemical techniques were applied to the fresh and cycled batteries to assess changes in performance that occur due to voltage and temperature conditions. These tests included galvanostatic cycling with potential limitation (GCPL), cyclic voltammetry (CV), and electrochemical impedance spectroscopy (EIS) supported by distribution of relaxation times (DRT) analysis. Primary electrochemical tests were run on a BioLogic VSP Modular 4 channel potentiostat/galvanostat. A separate BioLogic SP150 single channel potentiostat/galvanostat was also used to support this testing. Additionally, a 16-channel Neware BTS4000 was used for supplemental GCPL cycling of coin cell batteries.Prior to cycling and electrochemical characterization, all batteries were subject to an initial SEI formation, following the cycling protocol shown in Table 2. Note that all voltages reported for the half-cell batteries are taken relative to the Li/Li+ redox couple unless indicated otherwise. All formation cycling was performed under ambient conditions. Initially the batteries were held at open circuit voltage (OCV) prior to charging at C/20 until an upper cut-off voltage (UCV) of 4.0 V was reached. The voltage was held for 2 hours or until current was less than 0.05C. This step was followed by a discharge step down to 3.2 V, and finally a charge step to 4.0 V and hold for 2 hours. After the formation cycle, batteries were connected to the potentiostat to perform initial EIS studies. Following EIS the cells were either subjected to CV testing or cycled using the incremental charging protocol.
| Step | Action | Voltage range (V) | C-Rate | Time elapsed (hours) |
|---|---|---|---|---|
| 1 | Rest | OCV | 0 | 1 |
| 2 | Charge | [OCV–4.0] | 0.05C | 20 |
| 3 | Hold | 4.0 | Until <0.05C | ≤2 |
| 4 | Discharge | [4.0–3.2] | 0.05C | 20 |
| 5 | Charge | [3.2–4.0] | 0.05C | 20 |
| 6 | Hold | 4.0 | Until <0.05C | ≤2 |
| Step | Action | Voltage range (V) | C-Rate | Time elapsed (hours) |
|---|---|---|---|---|
| 1 | Rest | OCV | 0 | 1 |
| 2 | Charge | [OCV–UCV] | 0.1C | 10 |
| 3 | Hold | UCV | Until <0.05C | ≤2 |
| 4 | Discharge | [UCV–3.0] | 0.1C | 10 |
| 5 | Charge | [3.0–UCV] | 0.1C | 10 |
| 6 | Hold | UCV | Until <0.05C | ≤2 |
| 7 | Return to step 2 until count equals 5 cycles | |||
In the above protocol, even though the C-rates are incremental they do not exceed C/2 rates to prevent entering into the fast charging region, which can exacerbate degradation of the Li metal anode rather than the cathode.58,59 Presence of Li plating and dendrites are expected in the Li metal anode, mainly due to its reactive nature. Hence, the capacity fade is impacted by degradation of the anode in all of the experiments. Nevertheless, choosing a Li foil as anode maintains a continuous pool of available Li for cycling. With this consistent arrangement it is still possible to assess the main degradation mechanisms of the NMC electrode and establish the connection between capacity fade and cathode microstructural degradation.
The DRT model has been used to find the characteristic distribution of the EIS timescales. Derivation of the basic model has been extensively outlined within multiple publications and should be referenced for questions regarding the statistical treatment of the data.34,38,39 The analysis in this publication was conducted using research from Li et al., which presents the connection between the distribution of relaxation times and the impedance data as:
2.3. Materials characterization
An open-source software, TXM-Sandbox, was used to reconstruct the tomographic datasets and determine the Ni K-Edge white-line position.67 White-line position is referred to as the absorption edge maximum that can be used as a feature of the XANES spectrum to track valence state charge.68 A watershed threshold was then applied within ImageJ on the tomographic reconstructions to remove the background.69 The background value was set to zero, while particle values were set to one. This threshold was then multiplied by the 3D-XANES dataset using the image calculator plug-in to mask the background and retain the desired particle data. Ten slices that were equally spaced apart within the image stack were then chosen for further analysis. Equal spacing was chosen to ensure that there was adequate representation from the entire image stack. The chosen image slices were then imported into MATLAB for viewing and analysis. Histograms were generated using the histfit function with kernel distribution, a nonparametric representation, to avoid making assumptions regarding the distribution of the data.
The particle size distribution (PSD) for the NMC811 active material was also calculated based on the X-ray microscopy dataset. For the PSD analysis, X-ray nanotomography data collected at 8350 eV as part of the larger XANES imaging scan was used. An open source toolbox MATBOX70 and FIJI69 were used to process and segment the tomographic reconstructions to remove background and noise. The PSD was then calculated on these segmented images. FIJI was used to visually review and crop the dataset prior to further processing in MATBOX. The ROI, filtering, and segmentation module in MATBOX was used to filter and segment the dataset. This tool was used to apply a median filter, up/down scale the dataset, and apply contrast correction. MATBOX was also used to fully construct a 3D microstructure for visual analyses. The fully segmented dataset was then passed to PSD calculation with the MATBOX characterization module. MATBOX has a variety of numerical methods for calculating particle size and particle size distribution. For this analysis, the continuum particle size distribution (c-PSD) numerical method was used to calculate particle size distribution. The c-PSD method in MATBOX applies a spherical assumption for voxels, and as a result produces an underestimate of the actual phase size. The PSD analysis was performed on a region of interest from each electrode with an average ROI size of 17.5 μm × 11.9 μm × 11.6 μm. These ROIs had an average volume of 2426 μm3 with a standard deviation of ∼38 μm3.
3. Results and discussion
3.1. Cycling and electrochemical characterization
For the different cycling cases, there is a notable capacity fade throughout the combinations of operating parameters when cycled incrementally from 0.1C through 0.4C. A summary of representative cases for each cycling condition are shown in Fig. 1a, where the average capacity retention (%) is shown for the respective C-rate for each temperature and voltage combination. These averages were taken over each set of five cycles within the cycling protocol outlined in Table 3. The first and last bars at each condition indicate the capacity retention at the initial and final set of cycles at 0.1C. Higher retention values around 75% are found for the low temperature conditions. These are lower capacity retention values compared to commercial LIBs. These discrepancies arise by the use of the Li metal anode in presence of carbonate electrolytes. Electrodes cycled at high temperature show a considerable performance loss just after a few cycles, which is related to the Li metal anode. Visual inspection of the Li electrodes after cycling showed limited degradation for the low temperature, low cut-off voltage case. The Li metal electrodes cycled at high temperature (60 °C) contained dark regions suggesting increased transfer of material from the cathode, likely transition metal dissolution accelerated by elevated temperature operation.7,22,71 Representative images are provided in Fig. S1 (ESI†). | ||
| Fig. 1 (a) Overview of the average capacity retention (%) obtained from the different cycling condition applied: 4.0 V at 25 °C, 4.3 V at 25 °C, 4.0 V at 60 °C, and 4.3 V at 60 °C (b) cyclic voltammogram of a pristine cathode scanned from 3.0 to 4.3 V vs. Li/Li+ with key crystal structure transitions between hexagonal phases (H1, H2, and H3) and the monoclinic phase (M) for NMC811 highlighted near 3.8 V (H1 → M), 4.1 V (M → H2), and 4.25 V (H1 → H2) vs. Li/Li+. | ||
Analysis of the capacity retention results throughout the cycles show how operating at high temperature or higher UCV can drastically decrease the overall performance of the battery. The samples cycled to 4.0 V at 25 °C remained with the best capacity retention, while the 25 °C case at higher cut-off voltage showed some performance recovery when returning to a lower C-rate. The batteries cycled at 60 °C fail abruptly after a few cycles. While it is expected that cycling to 4.0 V at 60 °C should have better capacity retention than the 4.3 V at 60 °C case, the influence of anode degradation may have contributed to the lack of performance recovery when cycling to 4.0 V at 60 °C. The overall degradation mechanisms related to the anode failure are well-studied in the literature.72–76 However, further analysis has to be done to fully understand the underlying cathode degradation mechanisms for each case. A deeper assessment of the battery electrochemical behavior and review of microstructural characteristics reveals that cathode degradation mechanisms are also impacted by the higher cut-off and the elevated operating temperature.
Fig. 1b shows the characteristic CV curve for the pristine cathode scanned up to 4.3 V, which is used as comparison for all the initial peaks against the cycled ones. CV data for 4.0 V is not used for comparison since it lacks the peak associated with the hexagonal phase transition H2 → H3 found at operating potentials above 4.15 V. In the case shown, all the main peaks are observable but vary slightly on the position from literature.9 This variation can be attributed to variations in the cathode composition (AM:CA:B) or cell assembly differences. The main phase transition peaks are found around 3.8 V, 4.1 V, and 4.25 V vs. Li/Li+, which are correlated to the transition phases from hexagonal to monoclinic (H1 → M), monoclinic to hexagonal (M → H2), and between hexagonal phases (H2 → H3). This behavior also shows full reversibility in all of the phase transitions through the redox process. It is important to note, that some of the other transitions between phases might still be happening in the electrodes but will be only visible while scanning at slower scan rates. However, for a consistent comparison between cycling conditions, the same scan rate was applied to ascertain the degradation effects in the resulting voltammograms.
With the main peaks of phase transition from the pristine samples characterized, these peaks were compared against the response of the cycled cathodes. Comparisons of representative electrodes cycled under the varied voltage and temperature conditions showed that the 4.0 V combinations maintained their H1 ↔ M transition peaks. The 4.3 V at 25 °C voltammogram (Fig. S2, ESI†) showed elongation but maintained slight phase transitions of H1 ↔ M and H2 ↔ H3 that suggested higher degradation compared to the lower UCV (4.0 V). The elevated temperature data for CV contained a greater degree of noise when scanning up to 4.0 V. This condition can be explained due to different degradation mechanisms manifesting at higher temperatures, related to diffusive resistance, that may contribute to noise acquired in the current signal. For the 4.3 V at 60 °C condition, no appreciable signal was obtained for the scan rate applied, indicating cell failure after cycling. The reduced prominence of peaks seen in the CV data suggests the cathode cannot achieve the same initial first-order phases. These changes along with reduced capacity retention suggest alteration of the active material crystal structure and the electrode microstructure.
Further understanding of the internal impedances related to cathode degradation can be obtained using the EIS. Impedance evolution seen due to the variation in state of charge (SOC) is presented in Fig. 2a to identify the main impedances encountered for the pristine cathodes. The results from the EIS consist in different semicircles. The first semi-circle, commonly associated to the surface resistance (Rsf), is minimal because of the initial high availability of Li in the system from the Li metal anode. The second semi-circle related to the charge transfer resistance (Rct) will be the main analyzed parameter related to the Li+ intercalation into the cathode, while the tail at lower frequencies indicates diffusive (Warburg) impedance. The associated internal resistances increase while moving from 100% to 0% SOC. These values tend to be higher on fully lithiated states which can be related to the depletion of the lithium available for storage during the intercalation process. This general evolution of impedance at different SOC aligns with expectations from values in literature,77,78 indicating that the averaged Nyquist plot is an accurate comparison methodology to further understand the overall internal resistances of cycled batteries.
 | ||
| Fig. 2 (a) EIS of different SOC for pristine NMC811 sample. (b) Comparison of EIS average curves for the cycling conditions applied. DRT analysis of batteries prior to cycling and after cycling to (c) 4.0 V and (d) 4.3 V vs. Li/Li+. | ||
The general EIS comparison for all cases is shown in Fig. 2b. A gradual change in the charge transfer resistance is found in the second semi-circle evolution for all cases, which suggests an increase of the intercalation resistance of the electrodes related to changes in the microstructure and disappearance of transition phases while the batteries were cycled for each condition. Both batteries cycled at 25 °C present similar average patterns on the increase on the charge transfer resistance, Rct. As expected, the 4.3 V case has higher resistance values than the 4.0 V, indicating that the irreversibilities presented while charging at UCV increase the charge transfer resistance.
Most notable are batteries cycled at the elevated temperature (60 °C), which present the highest impedance values for low frequencies corresponding to the overall bulk diffusion resistance. Especially for the 4.3 V at 60 °C condition the resistance is purely diffusive. The charge transfer semi-circle is significantly reduced, giving insights that the transition of the main degradation mechanism is related to the lack of overall diffusion within the electrode, which explains why it was difficult to get a clear signal on the CV scan. This development can be explained either by blockage of the porous network, driven by electrolyte decomposition into LiFx and LiP5 layers that cover the secondary NMC particles, or by the presence of NiO rock-salt surface formation already observed from the CV analysis. The first effect could potentially be observed by SEM, while the latter effect can be confirmed by analyzing the crystal structure of the batteries cycled at high temperature using XRD. All of these phenomena hinder the ability for Li diffusion and the intercalation and charge storage capacity that it supports, while accelerating the Li depletion rate and capacity fade.
To further clarify the electrochemical changes due to the appearance of the rock-salt phase, DRT analysis was conducted on the electrochemical impedance spectra taken after formation of the solid electrolyte interphase (SEI) and after cycling. Prior to cycling, the primary contribution was initially found to be from the cathode electrolyte interphase (CEI) and SEI, shown in Fig. 2c and d as designated by the respective cut-off voltage. Fig. 2c shows that at low cut-off voltage cycling conditions under ambient temperature cycling the contribution shifted from the CEI to diffusion resistance, but changes within the SEI and CEI were still detected. High temperature cycling conditions within the low cut-off voltage samples showed that the diffusion resistance again increased and the contributions from the CEI and SEI decreased. Fig. 2d shows that at high cut-off voltage cycling conditions, ambient temperature cycling showed that diffusion was becoming the main contribution but changes due to the CEI were still evident. High temperature cycling conditions in the high cut-off voltage samples showed that the mechanism was completely taken over by diffusion, due to the lithium transport being limited by the rock-salt phase or electrolyte degradation.
3.2. Microstructural characterization
The insights obtained from the cycling and electrochemical characterization need to be further expanded to link the cycling and electrochemical performance degradation with microstructural changes. To this end, the different batteries were disassembled inside an argon-filled glove box and a suite of characterization methods were applied to assess changes in the materials relative to pristine electrode materials. Methods applied included visual inspection and checking electrodes with optical microscopy, SEM, XRD, and XANES nanotomography. Representative results from a pristine sample are shown in Fig. 3. These include SEM images showing particle and binder regions (Fig. 3a), a reconstructed cross-section from X-ray nanotomography data taken at an energy of 8350 eV showing the NMC811 active material (Fig. 3b), the XANES spectra of the pristine NMC811 over the range of scanned energies (Fig. 3c), and a representative distribution of whiteline peak energies within the active material (Fig. 3d). Fig. 3a and b show that some particle fracture exists in the AM for the pristine electrodes, due to the manufacturing process. Fig. 3c and d confirm the consistency of the NMC811 XANES data relative to other XANES data for NMC.43–45,49 | ||
| Fig. 3 Representative data for pristine cathodes (a) SEM image of active material and carbon-binder regions, (b) cross-section images from X-ray nanotomography reconstruction with inset particle detail, (c) XANES spectra from 3D active material regions, and (d) distribution of whiteline peak energy values (scale bar indicates 2 μm). | ||
As a first step, electrode samples were assessed with optical microscopy to visually characterize the NMC811 and Li electrodes. After disassembly the cathodes cycled to 4.0 V at 25 °C and those cycled to 4.3 V at 25 °C did not present severe changes in their surfaces. For the cathode cycled to 4.0 V at 25 °C, slight surface breakage is observed and the macrostructural particles for NMC were visible as bright metallic-looking spheres (Fig. S4, ESI†). In contrast, the cathode cycled to 4.3 V at 25 °C cathode showed slight surface cracks and visual presence of white spots that could be deposits of electrolyte salts. Likewise, the cathode cycled to 4.0 V at 60 °C presented heavier presence of the electrolyte-salt formation than seen in the cathode cycled to 4.3 V at 25 °C. Finally, the most extreme case was found in the cathode cycled to 4.3 V at 60 °C where heavy electrolyte-salt decomposed deposits are found near surface cracks, while discolored regions are also found that were also observed in the Li side (Fig. S5, ESI†). These multiple defects found in the cathode cycled to 4.3 V at 60 °C explain the failure acceleration by the internal short circuit reactions from the aggressive electrolyte-salt decomposition, particle cracking, and blockage of lithium passage.79
A representative image from a pristine cathode is shown in Fig. 3a. Additional versions of this image from BS and SED are shown in Fig. S6 (ESI†). Fibrous structures related to the binder partially cover some of the particles in Fig. 3 and Fig. S6 (ESI†). Also, the morphology for clusters and single particles are shown in Fig. S6b and d (ESI†) respectively, here the spherical morphology for the secondary particle is formed from the agglomeration of granular primary particles. These features are consistent with the literature.80,81 Aggregates of circularly elongated primary and secondary particles are usually observed before degradation, as well as some regions with particles broken half-way, which is from the manufacturing processes or electrode handling.
SEM images from the cycled electrodes at each voltage and temperature condition are shown in Fig. 4. The cathodes cycled to 4.0 V at 25 °C (Fig. 4a) and 4.3 V at 25 °C (Fig. 4c), compared to the pristine samples, show slightly more cracks in the boundary grain structure. Expansion and microcracks from the bigger secondary particles (>10 μm) are also observed. These particles are more susceptible to concentration gradients and resulting diffusion-induced stress compared to smaller size particles as shown in previous simulation results.51,52 This process is beneficial to some extent because it exposes new active material to electrochemical reactions and may increase the cell cycling capacity. However, it can also be detrimental due to the oxygen liberation from within the particle and consumption of electrolyte.
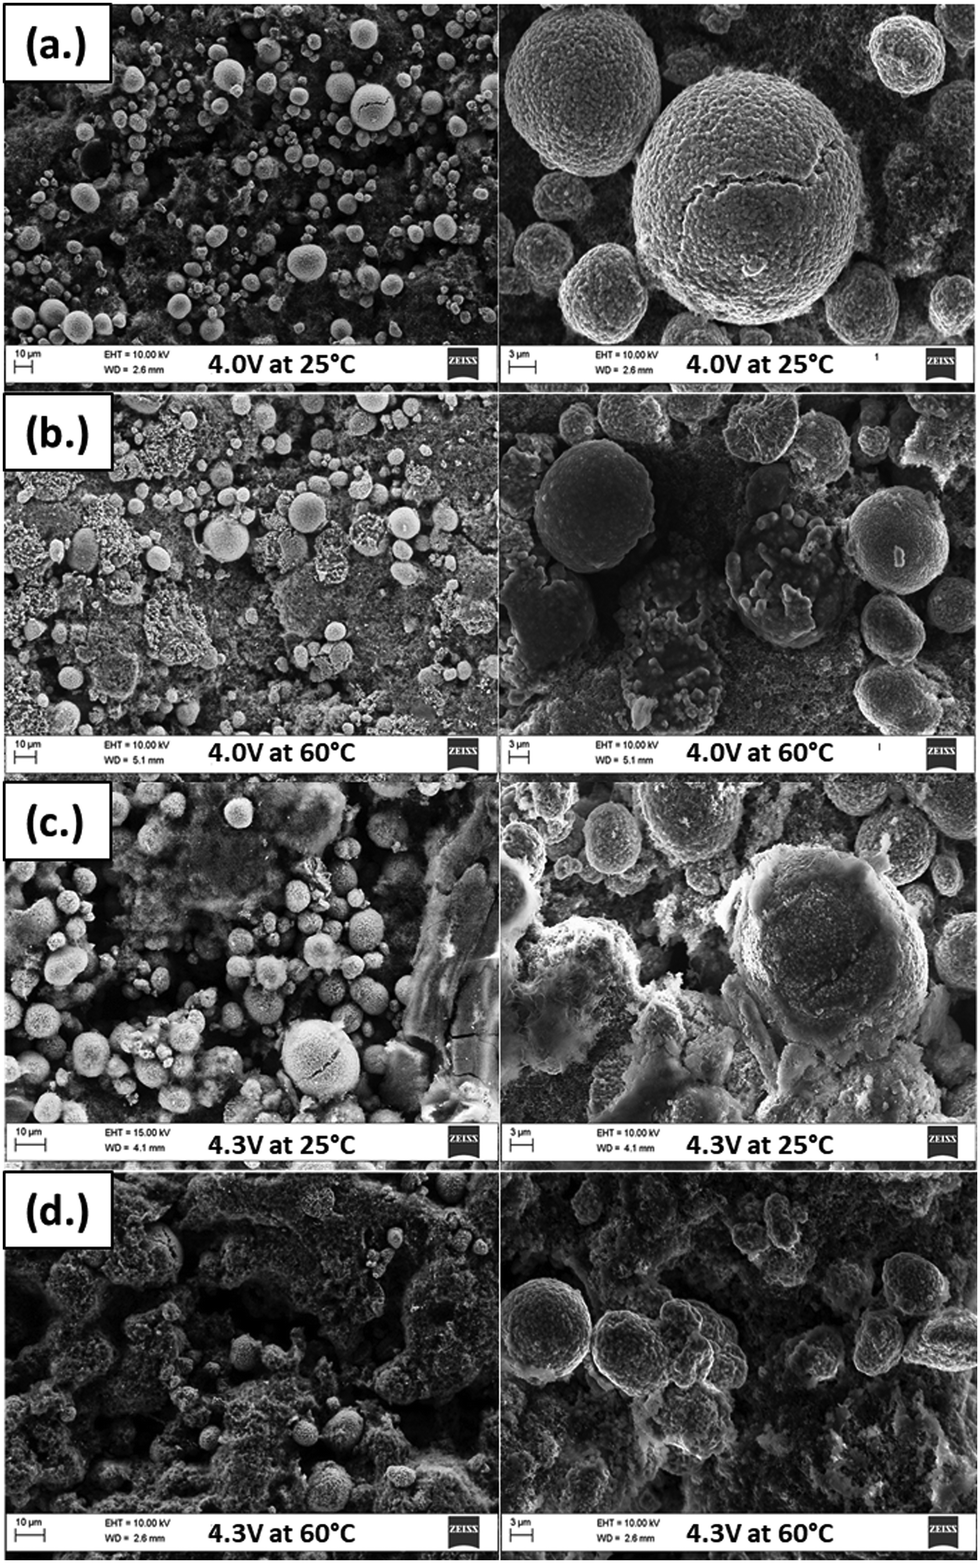 | ||
| Fig. 4 SEM images for all cycled combinations. (a) 4.0 V at 25 °C, (b) 4.0 V at 60 °C (c) 4.3 V at 25 °C, and (a) 4.3 V at 60 °C. Showing the microstructural degradation for each cycling condition. Lower magnification is on the left and higher magnification on the right. | ||
The SEM imaging for cathodes cycled to 4.0 V at 60 °C and 4.3 V at 60 °C SEM images are found in Fig. 4b and d, respectively. These show wider gaps than previous conditions accompanied with an increased degradation of the cathode's surface. From this visual analysis different observations can be determined. The complete breakage of the secondary particles is present for both cases. This feature can be observed from the primary particles being exposed and deintercalated from the sphere-shaped secondary particle. This process is accelerated by the kinetics of the higher temperature cycling. Finally, the secondary particles are shrouded with the non-conductive decomposed electrolyte layer. The darker fading in the images indicates the non-conductive nature of the layer and explains the failure mechanism and decay for continuous high temperature cycling conditions.
SEM image analysis implemented on the pristine and cycled NMC811 cathodes shows breakage of boundary grains, secondary particle breakage related to oxygen liberation and NiOx formation, and appearance of a non-conductive layer that covers the overall surface were observed. These observations connect with the capacity fade found in the cycling and electrochemical analysis. The observed breakage of the main particles is related to the anisotropic expansion and contraction of the AM crystal structure, and literature relates the oxygen liberation with the formation of a NiOx phase for higher cut-off voltages.14,82,83 To fully understand and link these changes XRD analysis is implemented to show the implication of these degradation mechanisms at the crystalline structure scale.
3.3. X-Ray diffraction analysis
X-Ray diffraction was performed on pristine samples from electrode sheets for reference. XRD data for all cycled combinations were obtained after the cathodes were cycled and extracted from the half-cell batteries. The resulting data was analyzed to further understand the evolution of the crystal structure in the cycled active material. These results will help to clarify how the impact on the basic ionic interaction at the NMC crystal structure level can affect the performance and evolution of the cathodes at different mesoscale levels.For the initial analysis approach XRD spectra were compared for all samples (Fig. 5) to correlate any variation in the cycled peaks with any additional side phases found in their crystal structure. Data from the pristine pattern shows similarity with the NMC811 XRD ICDD reference database, with a small difference in the peak location around the 65° 2θ value (Fig. 5a). This difference corresponds to the peak splitting of the (110)/(108) plane that indicates the presence of two hexagonal phases. This feature is common for freshly prepared Ni-rich electrodes, and usually disappears after the first formation cycle.84
 | ||
| Fig. 5 (a) Overall XRD patterns for references, pristine, and cycled electrodes samples. (b) XRD patterns for references, pristine, and cycled electrodes samples around the 19° 2θ angle. Results show a non-reacting rock-salt NiOx phase in the crystalline structure of samples cycled at the high cut-off voltage with greater presence at elevated temperature. | ||
The first relevant changes are observed in the 2θ region between 16° and 22° as highlighted in Fig. 5b. Appearance of a new smaller peak around 19° near 18.8° that corresponds to the (003) plane that pushes the (003) towards lower angles, which is only visible for both higher UCV (4.3 V) cases. This shift continues until the two peaks coexist at higher state of charge above the H2 → H3 transition. This feature is linked to the rock-salt phase formation.85 Seen near this peak in Fig. 5, denoted with blue colored asterisks for the 4.3 V at 25 °C and 4.3 V at 60 °C conditions at 19.07° and 19.13° respectively, are peaks that match with the NiO2 reference located at 19.29°. Oxygen vacancies and tetrahedral site hopping mechanisms that occur around the 3.95 V and 4.15 V vs. Li/Li+ levels promote the creation of this side phase reaction when Ni4+ reacts with O2− creating the NiOx phase. This phase is expected to occur with increased upper cut-off voltage. It is also seen that this feature is stronger in the high temperature data and shows signs of emergence in the cathodes cycled to 4.0 V under elevated temperature conditions. This behavior connects how the appearance of NiOx phases that occur when cycling up to 4.3 V can promote strains on the lattice parameters that is then observable at the microstructural scale. It also suggests that temperature can contribute to the emergence of this phase and the overall performance degradation of the cathode, even under conditions expected to present lower degradation risk. As noted above and indicated in the CV data (Fig. 1b), electrochemical activity associated with the H2 → H3 phase transition and formation of NiOx in the cathode active material initiates at around 4.15 V and becomes stronger with increased voltage. With increased temperature serving as an additional driver, the initiation of this phase formation could move to lower voltages closer to 4.0 V that are typically considered safe for reliable operation. The emergence of the NiOx feature in cathodes cycled to 4.0 V at 60 °C suggests this is the case.
The XRD patterns confirm that the rock-salt phase was beginning to form within the low cut-off voltage high temperature cycling condition, but in much lower intensity than that of the high cut-off voltage condition. This observation clearly shows that the diffusion mechanism, which hinders intercalation and deintercalation and is observed with increasing intensity in the DRT analysis, is driven by the formation of the non-conductive rock-salt phase. While primarily influenced by cut-off voltage, elevated temperature may also contribute to this degradation mechanism. The combination of different electrochemical and microstructural characterization techniques supports this observation and demonstrates that DRT analysis is an effective method to better understand the driving mechanisms behind battery degradation.
3.4. X-Ray microscopy analysis
The changes observed in the active material made with SEM imaging are further revealed in analyzing the X-ray tomography data. An initial assessment based on absorption contrast image data at 8350 eV was made for each of the cathode cases. A cross-section image for a pristine cathode sample is shown in Fig. 3b. Cross-section images for cycled electrodes are shown in Fig. 6a–d. Here the increased internal fracture of the active material particles can be seen, with a significant fracture of an active material particle seen for high voltage, high temperature sample (Fig. 6d). Some fracturing was observed in the pristine samples as a result of processing before cycling. For the particle shown the Fig. 6d the fracture displays a more irregular, opening morphology than the cleaner particle breaks observed in the pristine samples. | ||
| Fig. 6 X-Ray nanotomography cross-sections of NMC811 cathodes cycled at 25 °C to (a) 4.0 V and (b) 4.3 V, and cycled at 60 °C to (c) 4.0 V and (d) 4.3 V, (e) particle size change with temperature and voltage. Scale bar is 2 μm. | ||
The 3D data from the reconstructed X-ray images permits a more detailed and quantitative size assessment than the SEM image data. To this end, the particle size distribution (PSD) was calculated for all the five samples using MATBOX. Fig. 6e shows PSD data for all five samples. The change in voltage and temperature has significant effects on the particle size distribution within lithium-ion battery electrodes. This change in particle size distribution can influence battery performance. Based on Fig. 6e, the overall trend indicates that the NMC811 electrode exhibits a higher particle size distribution (PSD) at low voltage, at room and high temperature in comparison to the pristine and high voltage electrodes under the same temperature conditions. During cycling of lithium-ion batteries, the electrode particle expands and contracts slightly which can change the particle size distribution. This is due to the lithiation and delithiation of the electrodes during the charging and discharging process. The change in particle size distribution between different NMC811 electrodes depends on the cycling conditions. When comparing high and low voltage electrodes, higher voltage electrodes are more delithiated compared to low voltage electrodes. For Ni-rich NMC (Nix ≥ 0.5), when charging above 4.2 V leads to an abrupt c-axis lattice shrinking during the H2 to H3 transition. This phase transition involves a rearrangement of lithium and transition metal ions, which results in a more compact structure.86 This shrinkage can induce local stress accumulation and microcrack formation, which initiates several degradation mechanisms, such as surface reconstruction, electrolyte oxidation, and particle cracking.11,87
The low voltage electrodes show similar behavior, however the active material in low voltage electrodes does not expand as much as the active material in high voltage electrodes because they do not go through the H2 to H3 phase transition. This results in lower mechanical stress, fatigue, and cracking that can be related to the observed particle size distribution that is shifted toward larger sizes.
Similar to voltage, temperature also shows influence on particle size distribution. Temperature can have a profound effect on the kinetic processes taking place within the battery, including diffusion rates, reaction kinetics, and mechanical stress. Higher temperatures generally increase the rates of chemical reactions and diffusion of ions within the electrode materials. This leads to faster lithiation and delithiation in electrodes which affects the particle size distribution as seen in Fig. 6. When comparing high temperature electrodes with room temperature electrodes, at low temperatures lithium-ion mobility becomes limited, and affects the reaction kinetics. This results in incomplete lithiation and delithiation, also contributing to uneven particle size distribution within the electrode. When comparing the pristine electrode with other electrodes, it can be seen that it fits in between high and low voltage electrodes. This is because unlike high and low voltage electrodes, pristine electrode particles do not expand or contract, due to that the particle size does not increase from expansion or decrease by fracture and cracking.
Oxidation state changes in the active material can also provide insight into degradation. The distribution of whiteline peak positions are shown in Fig. 7. Fig. 7a–d show the two-dimensional white-line position mapping of samples from each cycling condition. A comparison of the resulting histogram distributions for each experimental condition is shown in Fig. 7e. Fig. 7a shows particles cycled at low cut-off voltage (4.0 V vs. Li/Li+) and room temperature (25 °C) conditions. On the larger particles, there is a clear distinction that the oxidation state increases from the interior of the particles to the exterior edges, which results in the wide distribution seen in Fig. 7e. At high cut-off voltage (4.3 V vs. Li/Li+), room temperature conditions, the particles show an overall increase in energies which is shown in Fig. 7b. There does not appear to be a distinguishable trend between the energies at the exterior and interior of the particle. Fig. 7c represents the low cut-off voltage, high temperature (60 °C) sample. The particles have a distinct decrease in energy at the particle edges, which is likely due to starting the formation of the rock-salt phase. The high cut-off voltage, high temperature sample in Fig. 7d shows a clear decrease in energies with respect to the other samples. The change is due to the intense degradation of the particles, which is also seen in the XRD analysis, SEM images, and EIS plots.
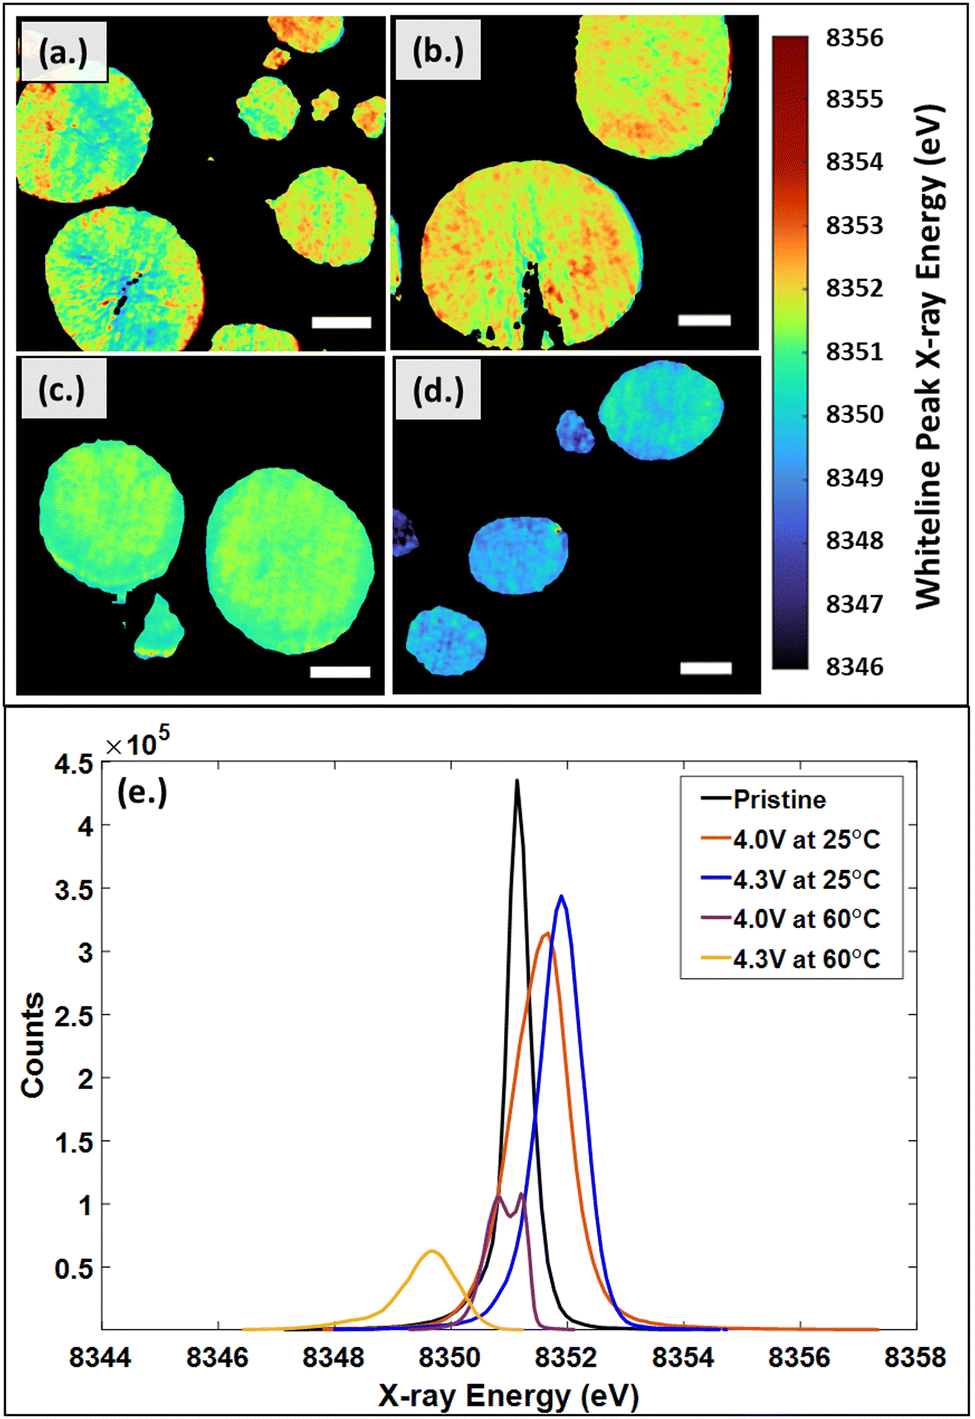 | ||
| Fig. 7 Whiteline peak distributions in NMC811 cathodes from 3D XANES imaging for discrete particles cycled to (a) 4.0 V at 25 °C, (b) 4.3 V at 25 °C, (c) 4.0 V at 60 °C, (d) 4.3 V at 60 °C, and (e) histograms showing the aggregate shifts in whiteline peak energy. Scale bar is 2 μm. | ||
The local observations from the 2D maps are shown in the aggregate histogram data for all of the samples in Fig. 7e. Pristine NMC811 has a thinly distributed peak at 8351.1 eV, while the charged (delithiated) samples from cathodes cycled to 4.0 V and 4.3 V at 25 °C, shift to higher energies for the whiteline peak, 8351.5 eV and 8351.8 eV respectively. This is consistent with literature, which states that as the state-of-charge is increased, lithium content is decreased, and the Ni K-edge oxidation state shifts to higher energies.44,88,89 Considering the high temperature samples, cycled to 4.0 V and 4.3 V at 60 °C, a NiOx rock-salt phase was expected based on preliminary XRD analysis. The NiOx was predominantly seen in the high cut-off voltage, high temperature sample. NiO XANES spectra is known to have a sharp edge around 8350 eV.90 A significant decrease in energy to 8349.5 eV is observed in the sample cycled to 4.3 V at 60 °C, which is likely due to the formation of the NiOx phase also observed in the XRD data. Within the low cut-off voltage, high temperature sample, a split peak develops at 8350.8 eV and 8351.2 eV. Based on XRD analysis, the NiOx rock-salt phase is beginning to form but is not seen as clearly as in the high cut-off voltage, high temperature sample. The split peak and shift to lower energies are likely due to the NiOx rock-salt phase beginning to form.
4. Conclusion
The degradation of low-cobalt NMC was assessed with a suite of electrochemical and microstructural characterization methodologies. This approach used complementary strengths of each method to understand the degradation mechanisms that manifest over multiple length scales within the cathode. A connection between morphological and chemical changes within the cathode microstructure, charge cut-off voltage, and operating temperature has been developed through a combination of cycling conditions, XRD, DRT, and XANES imaging. Based on the results shown above, it is clear that temperature and cycling conditions directly impact the degradation seen within NMC cathodes. High cut-off voltage samples showed significant development of a low diffusivity rock-salt phase that was confirmed through XRD and XANES imaging. To further understand the electrochemical changes due to the appearance of the rock-salt phase, DRT analysis was successfully implemented and evaluated. Results from DRT confirmed that at high cut-off voltage and high temperatures, the mechanism was completely taken over by diffusion due to the lithium transport being limited by the rock-salt phase or electrolyte degradation. High temperature samples showed an accelerated degradation process at all voltages and included the formation of a low diffusivity rock-salt phase, cathode material dissolution, and electrolyte decomposition.These observations clearly show that the diffusion mechanism, which hinders intercalation and deintercalation, is driven by the formation of the non-conductive rock-salt phase. While primarily influenced by cut-off voltage, results show that elevated temperature also contributes to this degradation mechanism. The combination of different electrochemical and microstructural characterization techniques supports this observation and demonstrates that DRT analysis coupled with X-ray imaging techniques is an effective method to better elucidate the driving mechanisms behind battery degradation.
Data availability
Relevant data are available on Zenodo through DOI https://doi.org/10.5281/zenodo.13732652. This data includes electrochemical data from CV and EIS/DRT measurements, reconstructed X-ray nanotomography data, and segmented XANES data showing the whiteline peak distributions in the active material. Full imaging datasets are not provided at this time as they significantly exceed Zenodo storage limits. These datasets can be provided by the authors upon request.Conflicts of interest
There are no conflicts to declare.Acknowledgements
Financial support from NSF Award CBET-1454437 is gratefully acknowledged. This research used resources from Beamline 18-ID-FXI of the National Synchrotron Light Source II, a U.S. Department of Energy (DOE) Office of Science User Facility operated for the DOE Office of Science by Brookhaven National Laboratory under Contract No. DE-SC0012704.References
- J. Pröll, R. Kohler, M. Torge, S. Ulrich, C. Ziebert, M. Bruns, H. J. Seifert and W. Pfleging, Laser Microstructuring and Annealing Processes for Lithium Manganese Oxide Cathodes, Appl. Surf. Sci., 2011, 257(23), 9968–9976, DOI:10.1016/j.apsusc.2011.06.117.
- H. Zheng, J. Li, X. Song, G. Liu and V. S. Battaglia, A Comprehensive Understanding of Electrode Thickness Effects on the Electrochemical Performances of Li-Ion Battery Cathodes, Electrochim. Acta, 2012, 71, 258–265, DOI:10.1016/j.electacta.2012.03.161.
- J. Pröll, H. Kim, A. Piqué, H. J. Seifert and W. Pfleging, Laser-Printing and Femtosecond-Laser Structuring of LiMn2O4 Composite Cathodes for Li-Ion Microbatteries, J. Power Sources, 2014, 255, 116–124, DOI:10.1016/j.jpowsour.2013.12.132.
- M. Singh, J. Kaiser and H. Hahn, Thick Electrodes for High Energy Lithium Ion Batteries, J. Electrochem. Soc., 2015, 162(7), A1196–A1201, DOI:10.1149/2.0401507jes.
- T. Danner, M. Singh, S. Hein, J. Kaiser, H. Hahn and A. Latz, Thick Electrodes for Li-Ion Batteries: A Model Based Analysis, J. Power Sources, 2016, 334, 191–201, DOI:10.1016/j.jpowsour.2016.09.143.
- M. Mangang, H. J. Seifert and W. Pfleging, Influence of Laser Pulse Duration on the Electrochemical Performance of Laser Structured LiFePO4 Composite Electrodes, J. Power Sources, 2016, 304, 24–32, DOI:10.1016/j.jpowsour.2015.10.086.
- Y. Ruan, X. Song, Y. Fu, C. Song and V. Battaglia, Structural Evolution and Capacity Degradation Mechanism of LiNi0.6Mn0.2Co0.2O2 Cathode Materials, J. Power Sources, 2018, 400, 539–548, DOI:10.1016/j.jpowsour.2018.08.056.
- T. Rajendra, A. N. Mistry, P. Patel, L. J. Ausderau, X. Xiao, P. P. Mukherjee and G. J. Nelson, Quantifying Transport, Geometrical, and Morphological Parameters in Li-Ion Cathode Phases Using X-Ray Microtomography, ACS Appl. Mater. Interfaces, 2019, 11(22), 19933–19942, DOI:10.1021/acsami.8b22758.
- S. Zheng, C. Hong, X. Guan, Y. Xiang, X. Liu, G.-L. Xu, R. Liu, G. Zhong, F. Zheng, Y. Li, X. Zhang, Y. Ren, Z. Chen, K. Amine and Y. Yang, Correlation between Long Range and Local Structural Changes in Ni-Rich Layered Materials during Charge and Discharge Process, J. Power Sources, 2019, 412, 336–343, DOI:10.1016/j.jpowsour.2018.11.053.
- K.-H. Chen, M. J. Namkoong, V. Goel, C. Yang, S. Kazemiabnavi, S. M. Mortuza, E. Kazyak, J. Mazumder, K. Thornton, J. Sakamoto and N. P. Dasgupta, Efficient Fast-Charging of Lithium-Ion Batteries Enabled by Laser-Patterned Three-Dimensional Graphite Anode Architectures, J. Power Sources, 2020, 471, 228475, DOI:10.1016/j.jpowsour.2020.228475.
- X. Lu, X. Zhang, C. Tan, T. M. M. Heenan, M. Lagnoni, K. O’Regan, S. Daemi, A. Bertei, H. G. Jones, G. Hinds, J. Park, E. Kendrick, D. J. L. Brett and P. R. Shearing, Multi-Length Scale Microstructural Design of Lithium-Ion Battery Electrodes for Improved Discharge Rate Performance, Energy Environ. Sci., 2021, 14(11), 5929–5946, 10.1039/D1EE01388B.
- N. Dunlap, D. B. Sulas-Kern, P. J. Weddle, F. Usseglio-Viretta, P. Walker, P. Todd, D. Boone, A. M. Colclasure, K. Smith, B. J. Tremolet de Villers and D. P. Finegan, Laser Ablation for Structuring Li-Ion Electrodes for Fast Charging and Its Impact on Material Properties, Rate Capability, Li Plating, and Wetting, J. Power Sources, 2022, 537, 231464, DOI:10.1016/j.jpowsour.2022.231464.
- P. Patel, G. Zhang and G. J. Nelson, Assessing the Impact of Electrode Structure on the Fast Charge Performance of Lithium-Ion Batteries, J. Electrochem. Soc., 2023, 170(1), 010501, DOI:10.1149/1945-7111/acadb0.
- R. Jung, M. Metzger, F. Maglia, C. Stinner and H. A. Gasteiger, Oxygen Release and Its Effect on the Cycling Stability of LiNixMnyCozO2 (NMC) Cathode Materials for Li-Ion Batteries, J. Electrochem. Soc., 2017, 164(7), A1361–A1377, DOI:10.1149/2.0021707jes.
- N. Nitta, F. Wu, J. T. Lee and G. Yushin, Li-Ion Battery Materials: Present and Future, Mater. Today, 2015, 18(5), 252–264, DOI:10.1016/j.mattod.2014.10.040.
- A. Manthiram, A Reflection on Lithium-Ion Battery Cathode Chemistry, Nat. Commun., 2020, 11(1), 1550, DOI:10.1038/s41467-020-15355-0.
- A. Manthiram, An Outlook on Lithium Ion Battery Technology, ACS Cent. Sci., 2017, 3(10), 1063–1069, DOI:10.1021/acscentsci.7b00288.
- H. J. Noh, S. Youn, C. S. Yoon and Y. K. Sun, Comparison of the Structural and Electrochemical Properties of Layered Li[NixCoyMnz]O2 (x = 1/3, 0.5, 0.6, 0.7, 0.8 and 0.85) Cathode Material for Lithium-Ion Batteries, J. Power Sources, 2013, 233, 121–130, DOI:10.1016/j.jpowsour.2013.01.063.
- B. Huang, M. Wang, Z. Zhao, L. Chen and Y. Gu, Effects of the Strong Oxidant Treatment of Precursor on the Electrochemical Properties of LiNi0.8Mn0.1Co0.1O2 for Lithium-Ion Batteries, J. Alloys Compd., 2019, 810, 151800, DOI:10.1016/j.jallcom.2019.151800.
- R. Zhao, J. Liu and J. Gu, The Effects of Electrode Thickness on the Electrochemical and Thermal Characteristics of Lithium Ion Battery, Appl. Energy, 2015, 139, 220–229, DOI:10.1016/j.apenergy.2014.11.051.
- P. Patel and G. J. Nelson, The Influence of Structure on the Electrochemical and Thermal Response of Li-Ion Battery Electrodes, J. Energy Resour. Technol., 2020, 142, 050906, DOI:10.1115/1.4045820.
- R. Xiong, L. Li, Z. Li, Q. Yu and H. Mu, An Electrochemical Model Based Degradation State Identification Method of Lithium-Ion Battery for All-Climate Electric Vehicles Application, Appl. Energy, 2018, 219, 264–275, DOI:10.1016/j.apenergy.2018.03.053.
- T. M. Bandhauer, S. Garimella and T. F. Fuller, A Critical Review of Thermal Issues in Lithium-Ion Batteries, J. Electrochem. Soc., 2011, 158(3), R1, DOI:10.1149/1.3515880.
- T. Waldmann, M. Wilka, M. Kasper, M. Fleischhammer and M. Wohlfahrt-Mehrens, Temperature Dependent Ageing Mechanisms in Lithium-Ion Batteries – A Post-Mortem Study, J. Power Sources, 2014, 262, 129–135, DOI:10.1016/j.jpowsour.2014.03.112.
- G. M. Cavalheiro, T. Iriyama, G. J. Nelson, S. Huang and G. Zhang, Effects of Nonuniform Temperature Distribution on Degradation of Lithium-Ion Batteries, J. Electrochem. Energy Convers. Storage, 2020, 17(2), 021101, DOI:10.1115/1.4045205.
- M. R. Palacín and A. de Guibert, Why Do Batteries Fail?, Science, 2016, 351(6273), 1253292, DOI:10.1126/science.1253292.
- T. Matsuda, K. Ando, M. Myojin, M. Matsumoto, T. Sanada, N. Takao, H. Imai and D. Imamura, Investigation of the Influence of Temperature on the Degradation Mechanism of Commercial Nickel Manganese Cobalt Oxide-Type Lithium-Ion Cells during Long-Term Cycle Tests, J. Energy Storage, 2019, 21, 665–671, DOI:10.1016/j.est.2019.01.009.
- A. Blyr, C. Sigala, G. Amatucci, D. Guyomard, Y. Chabre and J.-M. Tarascon, Self-Discharge of LiMn2O4/C Li-Ion Cells in Their Discharged State: Understanding by Means of Three-Electrode Measurements, J. Electrochem. Soc., 1998, 145(1), 194, DOI:10.1149/1.1838235.
- A. M. Colclasure, A. R. Dunlop, S. E. Trask, B. J. Polzin, A. N. Jansen and K. Smith, Requirements for Enabling Extreme Fast Charging of High Energy Density Li-Ion Cells While Avoiding Lithium Plating, J. Electrochem. Soc., 2019, 166(8), A1412, DOI:10.1149/2.0451908jes.
- P. Iurilli, C. Brivio and V. Wood, On the Use of Electrochemical Impedance Spectroscopy to Characterize and Model the Aging Phenomena of Lithium-Ion Batteries: A Critical Review, J. Power Sources, 2021, 505, 229860, DOI:10.1016/j.jpowsour.2021.229860.
- A. Lasia, Electrochemical Impedance Spectroscopy and Its Applications, Mod. Aspects Electrochem., 1999, 32, 143–248, DOI:10.1007/0-306-46916-2_2.
- Y. F. Pulido, C. Blanco, D. Anseán, V. M. García, F. Ferrero and M. Valledor, Determination of Suitable Parameters for Battery Analysis by Electrochemical Impedance Spectroscopy, Meas. J. Int. Meas. Confed., 2017, 106, 1–11, DOI:10.1016/j.measurement.2017.04.022.
- S. Wang, J. Zhang, O. Gharbi, V. Vivier, M. Gao and M. E. Orazem, Electrochemical Impedance Spectroscopy, Nat. Rev. Methods Primers, 2021, 1, 41, DOI:10.1038/s43586-021-00039-w.
- M. A. Danzer, Generalized Distribution of Relaxation Times Analysis for the Characterization of Impedance Spectra, Batteries, 2019, 5(3), 53, DOI:10.3390/batteries5030053.
- X. Chen, L. Li, M. Liu, T. Huang and A. Yu, Detection of Lithium Plating in Lithium-Ion Batteries by Distribution of Relaxation Times, J. Power Sources, 2021, 496, 229867, DOI:10.1016/j.jpowsour.2021.229867.
- B. Manikandan, V. Ramar, C. Yap and P. Balaya, Investigation of Physico-Chemical Processes in Lithium-Ion Batteries by Deconvolution of Electrochemical Impedance Spectra, J. Power Sources, 2017, 361, 300–309, DOI:10.1016/j.jpowsour.2017.07.006.
- P. S. Sabet and D. U. Sauer, Separation of Predominant Processes in Electrochemical Impedance Spectra of Lithium-Ion Batteries with Nickel–Manganese–Cobalt Cathodes, J. Power Sources, 2019, 425, 121–129, DOI:10.1016/j.jpowsour.2019.03.068.
- T. H. Wan, M. Saccoccio, C. Chen and F. Ciucci, Influence of the Discretization Methods on the Distribution of Relaxation Times Deconvolution: Implementing Radial Basis Functions with DRTtools, Electrochim. Acta, 2015, 184, 483–499, DOI:10.1016/j.electacta.2015.09.097.
- X. Li, M. Ahmadi, L. Collins and S. V. Kalinin, Deconvolving Distribution of Relaxation Times, Resistances and Inductance from Electrochemical Impedance Spectroscopy via Statistical Model Selection: Exploiting Structural-Sparsity Regularization and Data-Driven Parameter Tuning, Electrochim. Acta, 2019, 313, 570–583, DOI:10.1016/j.electacta.2019.05.010.
- F. Katzer and M. A. Danzer, Analysis and Detection of Lithium Deposition after Fast Charging of Lithium-Ion Batteries by Investigating the Impedance Relaxation, J. Power Sources, 2021, 503, 230009, DOI:10.1016/j.jpowsour.2021.230009.
- X. Zhou, J. Huang, Z. Pan and M. Ouyang, Impedance Characterization of Lithium-Ion Batteries Aging under High-Temperature Cycling: Importance of Electrolyte-Phase Diffusion, J. Power Sources, 2019, 426, 216–222, DOI:10.1016/j.jpowsour.2019.04.040.
- K. Pan, F. Zou, M. Canova, Y. Zhu and J. H. Kim, Comprehensive Electrochemical Impedance Spectroscopy Study of Si-Based Anodes Using Distribution of Relaxation Times Analysis, J. Power Sources, 2020, 479, 229083, DOI:10.1016/j.jpowsour.2020.229083.
- W. Xue, M. Huang, Y. Li, Y. G. Zhu, R. Gao, X. Xiao, W. Zhang, S. Li, G. Xu, Y. Yu, P. Li, J. Lopez, D. Yu, Y. Dong, W. Fan, Z. Shi, R. Xiong, C.-J. Sun, I. Hwang, W.-K. Lee, Y. Shao-Horn, J. A. Johnson and J. Li, Ultra-High-Voltage Ni-Rich Layered Cathodes in Practical Li Metal Batteries Enabled by a Sulfonamide-Based Electrolyte, Nat. Energy, 2021, 6(5), 495–505, DOI:10.1038/s41560-021-00792-y.
- D. Hou, Z. Xu, Z. Yang, C. Kuai, Z. Du, C. J. Sun, Y. Ren, J. Liu, X. Xiao and F. Lin, Effect of the Grain Arrangements on the Thermal Stability of Polycrystalline Nickel-Rich Lithium-Based Battery Cathodes, Nat. Commun., 2022, 13(1), 3437, DOI:10.1038/s41467-022-30935-y.
- F. Yang, Y. Liu, S. K. Martha, Z. Wu, J. C. Andrews, G. E. Ice, P. Pianetta and J. Nanda, Nanoscale Morphological and Chemical Changes of High Voltage Lithium–Manganese Rich NMC Composite Cathodes with Cycling, Nano Lett., 2014, 14(8), 4334–4341, DOI:10.1021/nl502090z.
- R. Xu, Y. Yang, F. Yin, P. Liu, P. Cloetens, Y. Liu, F. Lin and K. Zhao, Heterogeneous Damage in Li-Ion Batteries: Experimental Analysis and Theoretical Modeling, J. Mech. Phys. Solids, 2019, 129, 160–183, DOI:10.1016/j.jmps.2019.05.003.
- S. Xia, L. Mu, Z. Xu, J. Wang, C. Wei, L. Liu, P. Pianetta, K. Zhao, X. Yu, F. Lin and Y. Liu, Chemomechanical Interplay of Layered Cathode Materials Undergoing Fast Charging in Lithium Batteries, Nano Energy, 2018, 53, 753–762, DOI:10.1016/j.nanoen.2018.09.051.
- J. Li, N. Sharma, Z. Jiang, Y. Yang, F. Monaco, Z. Xu, D. Hou, D. Ratner, P. Pianetta, P. Cloetens, F. Lin, K. Zhao and Y. Liu, Dynamics of Particle Network in Composite Battery Cathodes, Science, 2022, 376(6592), 517–521, DOI:10.1126/science.abm8962.
- J. Li, S. Li, Y. Zhang, Y. Yang, S. Russi, G. Qian, L. Mu, S. Lee, Z. Yang, J. Lee, P. Pianetta, J. Qiu, D. Ratner, P. Cloetens, K. Zhao, F. Lin and Y. Liu, Multiphase, Multiscale Chemomechanics at Extreme Low Temperatures: Battery Electrodes for Operation in a Wide Temperature Range, Adv. Energy Mater., 2021, 11(37), 2102122, DOI:10.1002/aenm.202102122.
- S. Li, Z. Jiang, J. Han, Z. Xu, C. Wang, H. Huang, C. Yu, S.-J. Lee, P. Pianetta, H. Ohldag, J. Qiu, J.-S. Lee, F. Lin, K. Zhao and Y. Liu, Mutual Modulation between Surface Chemistry and Bulk Microstructure within Secondary Particles of Nickel-Rich Layered Oxides, Nat. Commun., 2020, 11(1), 4433, DOI:10.1038/s41467-020-18278-y.
- G. J. Nelson, L. J. Ausderau, S. Shin, J. R. Buckley, A. Mistry, P. P. Mukherjee and V. De Andrade, Transport-Geometry Interactions in Li-Ion Cathode Materials Imaged Using X-Ray Nanotomography, J. Electrochem. Soc., 2017, 164(7), A1412–A1424, DOI:10.1149/2.0261707jes.
- S. Shin, T. Rajendra and G. J. Nelson, Mesoscale Transport-Geometry Interactions in Lithium Ion Cathode Active Materials: Particle Scale Galvanostatic Simulations Based on X-Ray Nanotomography Data, J. Power Sources, 2020, 454, 227891, DOI:10.1016/j.jpowsour.2020.227891.
- A. Gaur and B. D. Shrivastava, Speciation Using X-Ray Absorption Fine Structure (XAFS), Rev. J. Chem., 2015, 5(4), 361–398, DOI:10.1134/s2079978015040032.
- R. D. Minter, D. Juarez-Robles, C. Fear, Y. Barsukov and P. P. Mukherjee, Three-Electrode Coin Cell Preparation and Electrodeposition Analytics for Lithium-Ion Batteries, J. Vis. Exp., 2018, 2018(135), e57735, DOI:10.3791/57735.
- T. Li, X.-Z. Yuan, L. Zhang, D. Song, K. Shi and C. Bock, Degradation Mechanisms and Mitigation Strategies of Nickel-Rich NMC-Based Lithium-Ion Batteries, Electrochem. Energy Rev., 2020, 3(1), 43–80, DOI:10.1007/s41918-019-00053-3.
- K. Jalkanen, J. Karppinen, L. Skogström, T. Laurila, M. Nisula and K. Vuorilehto, Cycle Aging of Commercial NMC/Graphite Pouch Cells at Different Temperatures, Appl. Energy, 2015, 154, 160–172, DOI:10.1016/j.apenergy.2015.04.110.
- J. Deng, W.-B. Luo, S.-L. Chou, H.-K. Liu and S.-X. Dou, Sodium-Ion Batteries: From Academic Research to Practical Commercialization, Adv. Energy Mater., 2018, 8(4), 1701428, DOI:10.1002/aenm.201701428.
- C. Fear, T. Adhikary, R. Carter, A. N. Mistry, C. T. Love and P. P. Mukherjee, In Operando Detection of the Onset and Mapping of Lithium Plating Regimes during Fast Charging of Lithium-Ion Batteries, ACS Appl. Mater. Interfaces, 2020, 12(27), 30438–30448, DOI:10.1021/acsami.0c07803.
- W. Yourey, Y. Fu, N. Li, V. Battaglia and W. Tong, Determining Accelerated Charging Procedure from Half Cell Characterization, J. Electrochem. Soc., 2019, 166(8), A1432, DOI:10.1149/2.0591908jes.
- W. Wu, Y. Zhuang, D. Yan, J. Huang, S. Peng, J. Wang, R. Zhuo, Z. Wu, P. Yan and G. Cao, Supercapacitive Properties of MnO2 and Underlying Kinetics by Distribution of Relaxation Time Method, J. Power Sources, 2020, 474, 228667, DOI:10.1016/j.jpowsour.2020.228667.
- J. Zhu, M. Knapp, X. Liu, P. Yan, H. Dai, X. Wei and H. Ehrenberg, Low-Temperature Separating Lithium-Ion Battery Interfacial Polarization Based on Distribution of Relaxation Times (DRT) of Impedance, IEEE Trans. Transp. Electrif., 2021, 7(2), 410–421, DOI:10.1109/TTE.2020.3028475.
- C. B. Muñoz, D. Pumiglia, S. J. McPhail, D. Montinaro, G. Comodi, G. Santori, M. Carlini and F. Polonara, More Accurate Macro-Models of Solid Oxide Fuel Cells through Electrochemical and Microstructural Parameter Estimation – Part I: Experimentation, J. Power Sources, 2015, 294, 658–668, DOI:10.1016/j.jpowsour.2015.06.118.
- S. Gantenbein, M. Weiss and E. Ivers-Tiffée, Impedance Based Time-Domain Modeling of Lithium-Ion Batteries: Part I, J. Power Sources, 2018, 379, 317–327, DOI:10.1016/j.jpowsour.2018.01.043.
- M. Schönleber and E. Ivers-Tiffée, Approximability of Impedance Spectra by RC Elements and Implications for Impedance Analysis, Electrochem. Commun., 2015, 58, 15–19, DOI:10.1016/j.elecom.2015.05.018.
- M. Schönleber, D. Klotz and E. Ivers-Tiffée, A Method for Improving the Robustness of Linear Kramers-Kronig Validity Tests, Electrochim. Acta, 2014, 131, 20–27, DOI:10.1016/j.electacta.2014.01.034.
- B. A. Boukamp, A Linear Kronig-Kramers Transform Test for Immittance Data Validation, J. Electrochem. Soc., 1995, 142, 1885–1894 CrossRef CAS.
- X. Xiao, Z. Xu, F. Lin and W. K. Lee, TXM-Sandbox: An Open-Source Software for Transmission X-Ray Microscopy Data Analysis, J. Synchrotron Radiat., 2022, 29, 266–275, DOI:10.1107/S1600577521011978.
- S. Spence, W.-K. Lee, F. Lin and X. Xiao, Transmission X-Ray Microscopy and Its Applications in Battery Material Research—a Short Review, Nanotechnology, 2021, 32(44), 442003, DOI:10.1088/1361-6528/ac17ff.
- J. Schindelin, I. Arganda-Carreras and E. Frise, Fiji: An Open-Source Platform for Biological-Image Analysis, Nat. Methods, 2012, 9(7), 676–682, DOI:10.1038/nmeth.2019.
- F. L. E. Usseglio-Viretta, P. Patel, E. Bernhardt, A. Mistry, P. P. Mukherjee, J. Allen, S. J. Cooper, J. Laurencin and K. Smith, MATBOX: An Open-Source Microstructure Analysis Toolbox for Microstructure Generation, Segmentation, Characterization, Visualization, Correlation, and Meshing, SoftwareX, 2022, 17, 100915, DOI:10.1016/j.softx.2021.100915.
- J. Vetter, P. Novák, M. R. Wagner, C. Veit, K.-C. Möller, J. O. Besenhard, M. Winter, M. Wohlfahrt-Mehrens, C. Vogler and A. Hammouche, Ageing Mechanisms in Lithium-Ion Batteries, J. Power Sources, 2005, 147(1–2), 269–281, DOI:10.1016/j.jpowsour.2005.01.006.
- S. Müller, J. Eller, M. Ebner, C. Burns, J. Dahn and V. Wood, Quantifying Inhomogeneity of Lithium Ion Battery Electrodes and Its Influence on Electrochemical Performance, J. Electrochem. Soc., 2018, 165(2), A339, DOI:10.1149/2.0311802jes.
- R. Wang, W. Cui, F. Chu and F. Wu, Lithium Metal Anodes: Present and Future, J. Energy Chem., 2020, 48, 145–159, DOI:10.1016/j.jechem.2019.12.024.
- E. Deichmann, L. Torres-Castro, J. Lamb, M. Karulkar, S. Ivanov, C. Grosso, L. Gray, J. Langendorf and F. Garzon, Investigating the Effects of Lithium Deposition on the Abuse Response of Lithium-Ion Batteries, J. Electrochem. Soc., 2020, 167(9), 090552, DOI:10.1149/1945-7111/ab9941.
- C. Michelbacher, S. Ahmed, I. Bloom, A. Burnham, B. Carlson, F. Dias, E. J. Dufek, A. N. Jansen, M. Keyser, A. Markel, A. Meintz, M. Mohanpurkar, A. Pesaran, D. Scoffield, M. Shirk, T. Stephens, T. Tanim, R. Vijayagopal and J. Zhang, Enabling Fast Charging – Introduction and Overview, J. Power Sources, 2017, 367, 214–215, DOI:10.1016/j.jpowsour.2017.08.008.
- M. Keyser, A. Pesaran, Q. Li, S. Santhanagopalan, K. Smith, E. Wood, S. Ahmed, I. Bloom, E. Dufek, M. Shirk, A. Meintz, C. Kreuzer, C. Michelbacher, A. Burnham, T. Stephens, J. Francfort, B. Carlson, J. Zhang, R. Vijayagopal, K. Hardy, F. Dias, M. Mohanpurkar, D. Scoffield, A. N. Jansen, T. Tanim and A. Markel, Enabling Fast Charging – Battery Thermal Considerations, J. Power Sources, 2017, 367, 228–236, DOI:10.1016/j.jpowsour.2017.07.009.
- M. Frankenberger, M. Trunk, S. Seidlmayer, A. Dinter, J. Dittloff, L. Werner, R. Gernhäuser, Z. Revay, B. Märkisch, R. Gilles and K.-H. Pettinger, SEI Growth Impacts of Lamination, Formation and Cycling in Lithium Ion Batteries, Batteries, 2020, 6(2), 21, DOI:10.3390/batteries6020021.
- S. Liu, L. Xiong and C. He, Long Cycle Life Lithium Ion Battery with Lithium Nickel Cobalt Manganese Oxide (NCM) Cathode, J. Power Sources, 2014, 261, 285–291, DOI:10.1016/j.jpowsour.2014.03.083.
- H. J. Gonzalez Malabet, G. M. Cavalheiro, T. Iriyama, A. Gabhart, G. J. Nelson and G. Zhang, Electrochemical and Post-Mortem Degradation Analysis of Parallel-Connected Lithium-Ion Cells with Non-Uniform Temperature Distribution, J. Electrochem. Soc., 2021, 168(10), 100507, DOI:10.1149/1945-7111/ac2a7c.
- K. Meng, Z. Wang, H. Guo, X. Li and D. Wang, Improving the Cycling Performance of LiNi0.8Co0.1Mn0.1O2 by Surface Coating with Li2TiO3, Electrochim. Acta, 2016, 211, 822–831, DOI:10.1016/j.electacta.2016.06.110.
- X. Li, A. M. Colclasure, D. P. Finegan, D. Ren, Y. Shi, X. Feng, L. Cao, Y. Yang and K. Smith, Degradation Mechanisms of High Capacity 18650 Cells Containing Si-Graphite Anode and Nickel-Rich NMC Cathode, Electrochim. Acta, 2019, 297, 1109–1120, DOI:10.1016/j.electacta.2018.11.194.
- S.-K. Jung, H. Gwon, J. Hong, K.-Y. Park, D.-H. Seo, H. Kim, J. Hyun, W. Yang and K. Kang, Understanding the Degradation Mechanisms of LiNi0.5Co0.2Mn0.3O2 Cathode Material in Lithium Ion Batteries, Adv. Energy Mater., 2014, 4(1), 1300787, DOI:10.1002/aenm.201300787.
- R. Xu, H. Sun, L. S. de Vasconcelos and K. Zhao, Mechanical and Structural Degradation of LiNixMnyCozO2 Cathode in Li-Ion Batteries: An Experimental Study, J. Electrochem. Soc., 2017, 164(13), A3333, DOI:10.1149/2.1751713jes.
- W. Li, J. N. Reimers and J. R. Dahn, In Situ X-Ray Diffraction and Electrochemical Studies of Li1−xNiO2, Solid State Ionics, 1993, 67(1), 123–130, DOI:10.1016/0167-2738(93)90317-V.
- H. Li, N. Zhang, J. Li and J. R. Dahn, Updating the Structure and Electrochemistry of LixNiO2 for 0 ≤ x ≤ 1, J. Electrochem. Soc., 2018, 165(13), A2985, DOI:10.1149/2.0381813jes.
- T. Li, X.-Z. Yuan, L. Zhang, D. Song, K. Shi and C. Bock, Degradation Mechanisms and Mitigation Strategies of Nickel-Rich NMC-Based Lithium-Ion Batteries, Electrochem. Energy Rev., 2020, 3(1), 43–80, DOI:10.1007/s41918-019-00053-3.
- G. J. Páez Fajardo, E. Fiamegkou, J. A. Gott, H. Wang, I. Temprano, I. D. Seymour, M. J. W. Ogley, A. S. Menon, I. E. L. Stephens, M. Ans, T.-L. Lee, P. K. Thakur, W. M. Dose, M. F. L. De Volder, C. P. Grey and L. F. J. Piper, Synergistic Degradation Mechanism in Single Crystal Ni-Rich NMC//Graphite Cells, ACS Energy Lett., 2023, 8(12), 5025–5031, DOI:10.1021/acsenergylett.3c01596.
- C. Tian, Y. Xu, W. H. Kan, D. Sokaras, D. Nordlund, H. Shen, K. Chen, Y. Liu and M. Doeff, Distinct Surface and Bulk Thermal Behaviors of LiNi0.6Mn0.2Co0.2O2 Cathode Materials as a Function of State of Charge, ACS Appl. Mater. Interfaces, 2020, 12(10), 11643–11656, DOI:10.1021/acsami.9b21288.
- C. Tan, A. S. Leach, T. M. M. Heenan, H. Parks, R. Jervis, J. N. Weker, D. J. L. Brett and P. R. Shearing, Nanoscale State-of-Charge Heterogeneities within Polycrystalline Nickel-Rich Layered Oxide Cathode Materials, Cell Rep. Phys. Sci., 2021, 2(12), 100647, DOI:10.1016/j.xcrp.2021.100647.
- G. J. Nelson, W. M. Harris, J. R. Izzo, K. N. Grew, W. K. S. Chiu, Y. S. Chu, J. Yi, J. C. Andrews, Y. Liu and P. Pianetta, Three-Dimensional Mapping of Nickel Oxidation States Using Full Field X-Ray Absorption near Edge Structure Nanotomography, Appl. Phys. Lett., 2011, 98(17), 173109 CrossRef.
Footnote |
| † Electronic supplementary information (ESI) available. See DOI: https://doi.org/10.1039/d4ya00530a |
| This journal is © The Royal Society of Chemistry 2025 |