Near field capillary repulsion†
Lu
Yao
,
Lorenzo
Botto‡§
,
Marcello
Cavallaro, Jr‡
,
Blake J.
Bleier
,
Valeria
Garbin§
and
Kathleen J.
Stebe
*
University of Pennsylvania, Department of Chemical and Biomolecular Engineering, 220 South 33rd Street, Towne Bldg. Rm. 364, Philadelphia, PA 19104, USA. E-mail: kstebe@seas.upenn.edu
First published on 8th November 2012
Abstract
Anisotropic microparticles adsorbed at fluid–fluid interfaces create interface deformations and interact because of capillarity. Thus far, much of the work related to this phenomenon has focused on capillary attraction, which is ubiquitous in the far field for microparticles at interfaces. In this paper, we explore capillary repulsion. We study particles at interfaces with contact line undulations having wavelength significantly smaller than the characteristic particle size. By a combination of simulation and experiment, we show that identical microparticles with features in phase attract each other, and microparticles with different wavelengths, under certain conditions, repel each other in the near field, leading to a measurable equilibrium separation. We study these assemblies at air–water and oil–water interfaces. The capillary bond between particles at air–water interfaces is rigid, whereas at oil–water interfaces, the bond between particles with near field repulsion is elastic under perturbation. These results have implications for the capillary assembly of rough microparticles at interfaces, and for the tailoring of mechanics of particle monolayers.
Introduction
Microparticles located at fluid interfaces are of broad importance to a wide range of soft materials, from particle-stabilized emulsions1,2 and foams3 to colloidosomes for drug delivery and functional foods.4,5 Such applications have spurred an intense interest in the study of particle laden interfaces. Microparticles become trapped at fluid interfaces owing to the large change in free energy upon adsorption. If the particles have anisotropic shape or patchy wetting, they typically attract owing to capillarity to assemble in apparent contact,6–16 with separation distances too small to be resolved by optical microscopy. The mechanics of the assemblies thus formed is determined by near field capillary interactions, which are in turn defined by the energy landscape of the liquid bridge that forms between particles near contact, termed a capillary bond.17 The energy landscape of this bond is given by the sum of the surface energies of this liquid bridge and the solid it wets.15 As a result, the strength and properties of the capillary bond are strongly coupled with the shape of the particles and the distribution of liquid between them.Simulation and experiment show capillary bonds to be remarkably strong and attractive at all separations between similar microparticles, scaling as γL2, where γ is the interfacial tension and L is the length scale of the particles. For microscale particles at air–water interfaces, typical bond strengths are ∼105 to 107 kT.10,11,16 Imparting repulsion between microparticles at interfaces is therefore a challenge, since the usual means for introducing repulsion, e.g. using charge to impart electrostatic repulsion,1,18 or by appending ligands to particles to impart steric repulsion,19 are too weak to overcome attractive interactions of this magnitude. In principle, the distance of approach between microparticles could be limited by repulsive capillary interactions associated with small scale contact line undulations. To our knowledge, Lucassen20 first suggested this concept, modelling near field capillary interactions between colloidal microparticles on interfaces in a highly simplified geometry. He treated the particles as a pair of vertical parallel walls with pinned sinusoidal contact lines, connected by a fluid interface. The sinusoidal contact lines excite interfacial deformations and associated energies that decay over distances comparable to the wavelength. As the walls approach each other, the deformation fields superpose. The interfacial area increases unless the sinusoidal contact lines are of identical amplitude and wavelength, and in phase. The implications of this work are that undulated contact lines with wavelengths small compared to the particle alter pair interactions only in the near field. If these features are identical, they strengthen the capillary bond and draw the particles into contact. If, however, they differ, they create repulsions owing to capillarity and allow particles to find equilibrium separation distances. These ideas were further developed by Stamou et al.21 in simulation to discuss how uncontrolled roughness or contact line pinning could limit spherical microparticle approach to finite separations. This behavior could be important in practice; particles of applied interest for catalysis,22 interfacial jamming (‘bijels’23) or for emulsion stabilization24 can have highly irregular surfaces with chemical heterogeneities that can create undulated interfaces in the near field. Uncontrolled roughness or chemical heterogeneities are also a potentially important element of particle design as they could limit the minimum separations of these particles at interfaces, and change the mechanical response of particle laden surfaces. Furthermore, the development of means to control the strength and mechanics of capillary bonds paves the way for the design of particles to control the interfacial rheology in particle stabilized emulsions, and for the design of colloidosomes with given microstructures and contact between internal and external fluids for release or encapsulation. As far as we know, the role of small wavelength contact line undulations in modulating near field capillary interactions has not been explored previously in experiment. In this article, we study such interactions, using particles designed to attract in the far field, and interact either attractively or repulsively in the near field. Key concepts related to far field capillary interactions, which are now well understood, are reviewed briefly below.
Particles at interfaces induce a deformation field, determined by the particle shape and its wetting conditions. A rough or chemically heterogeneous microparticle can create an undulated contact line where fluid, vapor and particle meet.8,21 A non-spherically shaped particle also creates an undulated contact line, even in the absence of chemical heterogeneities or contact line pinning.11,13,15,16 The deformation induced by an isolated microparticle can be described in various ways depending on the distance from the contact line. Far from the particle, the interface deformation is typically a quadrupole in polar coordinates.21 Closer to the particle, the deformation field is eccentric if the particle shape is elongated.10 Very close to the particle surface, the interface deformation is dominated by fine details of the particle shape and the boundary conditions at the three phase contact line.11,12,15,16,20,21 These particle-induced distortions create excess area, which corresponds to an increase in interfacial energy. When deformation fields from neighboring particles overlap, far field capillary interactions occur, causing particles to orient and interact to minimize the overall free energy of the system. These interactions can also be understood as a function of the distance between interacting particles.
Far from contact, the energy between pairs of microparticles can be described as pairs of interacting quadrupoles in polar coordinates.21 This energy enforces mirror symmetric orientations as the particles attract. At moderate separation distances, the eccentricity in the deformation field induces a torque that enforces a particular alignment as particles approach.10 Finally, in the very near field, where separation distances are comparable to the characteristic lengths of the particles, the finer details of the geometry and wetting conditions of the particle surface dominate the interaction.15,16
Here, we use particles with corrugated contact lines to explore the role of near field interactions in modulating particle assembly near contact. We begin with simulations to guide experimental design and discuss the implications of these near field interactions on the micromechanics of the capillary bonds that form. We simulate interactions on unbounded interfaces between model particles designed to excite a far field capillary attraction with a particular alignment, and a near field capillary repulsion or enhanced attraction, depending on the particular geometry. Thereafter, we present experiments in which microparticles assemble to well-defined separation distances owing to near field capillary repulsion, or accelerate to apparent contact owing to enhanced near field attraction.
Simulations of model particles
The model particles are bent, corrugated sheets of width w and length l; they are designed to excite a quadrupolar deformation in the far field, to force particles to orient along the corrugated ends, and to excite a sinusoidal undulation of given wavelength λ and amplitude A in the near field. A schematic of the model particle is shown in Fig. 1(a). The cross-section of the particles follows | (1) |
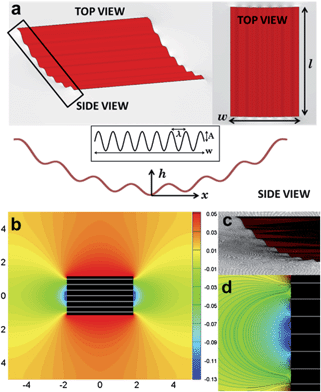 | ||
| Fig. 1 (a) Schematic of a particle for Surface Evolver simulation. (b) Iso-height contour of the equilibrium interface around a corrugated particle. (c) Perspective view of the interface shape near the undulated contact line. (d) Iso-height contour of the equilibrium interface in near field close to the corrugated side of the particle. The color code in (d) corresponds to the legend in (b). | ||
The role of these corrugations in determining near field interactions is the focus of this study. We simulate the pair interaction between end-to-end aligned particles as a function of separation distance d between the particle end faces. Since the contact line is assumed to be pinned, the pair interaction energy E is given by:
| E = γSlv | (2) |
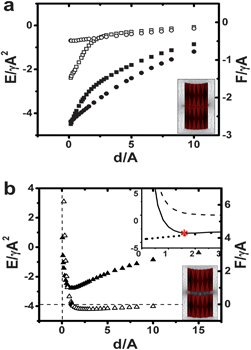 | ||
| Fig. 2 Capillary interaction energy (solid symbols) and capillary forces (open symbols) on unbounded interfaces between particles with length l = 36A, w = 27A. (a) Interactions between a pair of matching corrugated microparticles with λ = 3.6A (squares; see bottom inset for the equilibrium configuration) and a pair of uncorrugated microparticles (circles). (b) Interactions between microparticles with differing wavelengths λ = 3.6A and λ = 6.0A (triangles; see bottom inset for equilibrium configuration). The top inset in (b) shows the capillary interaction energy between uncorrugated particles (circles) and the repulsive interaction between two flat particles with corrugations of differing wavelengths (λ = 3.6A and 6.0A) predicted by Lucassen's analytical solution (dashed line). The sum of the attractive and repulsive interactions is given by the solid line and dEQM is marked with an asterisk. | ||
To anticipate the interactions between a pair of microparticles with corrugations of different wavelengths, we illustrate the dominant physics of interaction between them in the inset to Fig. 2(b). The attractive part of the interaction energy (solid circles) is modelled using the computed capillary energy between un-corrugated particles, previously shown in Fig. 2(a). The repulsion is modelled in terms of an analytical expression for the capillary repulsion between particles with unequal wavelengths for small d based on Lucassen's approach20 (dashed line; see ESI† for details). The particles attract over distances large compared to the undulation wavelength, and repel when the undulations superpose. The sum of these two energies is shown as the solid line in the inset. These two competing effects give a minimum in the capillary energy landscape at a finite separation distance dEQM between the particles (asterisk). In Fig. 2(b), the interaction energy between particles with differing wavelengths, as given by surface evolver (solid symbols), is also reported; this potential agrees qualitatively with the potential shown in the inset. The equilibrium distance is 1.1A, on the same scale as the amplitude of the roughness itself. The force corresponding to the energy profile (open symbols) shows that the bond is elastic and asymmetric for finite displacements from equilibrium; a greater force is needed to compress the bond than to strain it for displacements comparable to λ.
The simulations suggest that near field interactions can enhance or decrease the magnitude of capillary interactions. Near field attraction strengthens capillary bonds, whereas near field repulsion can allow particles to assemble at finite equilibrium separations determined by the capillary energy landscape. The capillary bonds thus formed have associated mechanics that differ significantly from the case of particles near contact. The results may be further generalized, in that the sinusoidal deformation studied here can be thought of as a Fourier mode in the contact line undulation. Particle pairs with differing contact lines – i.e. with mismatching Fourier modes – will experience local repulsion.
The strong assumptions underlying our simulations preclude a quantitative comparison with experiments. For example, real particles have finite thickness whereas the simulated particles are infinitesimally thin. Moreover, the simulation does not account for the possibility of the contact line depinning from the edge. The simulations do, however, illustrate the underlying physics and motivate the experimental study of pairs of particles with far field quadrupolar attraction and with sinusoidal contact lines of wavelength smaller than the particle length and width, to probe for near field capillary attraction or repulsion.
Methods and materials
Microparticle fabrication
Microparticles were fabricated using standard photolithographic methods.10 Briefly, a negative tone photoresist (SU-8 2150, MicroChem Corp.) was deposited onto a silicon wafer (Montco Silicon) by spin-coating. The photoresist was then exposed to UV light (365 nm) on a tabletop mask aligner (OAI Model 100) through a photomask (Microtronics Inc., Fine Line Imaging). The exposed sample was heated to cross-link the UV-exposed regions, rendering well-defined microparticles upon development in SU-8 developer solution, which were subsequently released from the wafer by sonication of the entire wafer in ethanol. We used an optical tensiometer (Attension Theta, KSV Instruments) to determine the contact angle of SU-8 at both air–water and oil–water interfaces via the sessile drop method to be θc = 80 ± 2° and θc = 130 ± 5°, respectively. Fig. 3(a) shows microparticles with λ = 36 μm, w = 270 μm, l = 180–400 μm, thickness = 30 μm and A = 10 μm.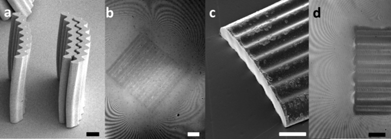 | ||
| Fig. 3 (a) SEM image (JEOL 7500F HRSEM) of the microparticles. (b) Interference fringes around such a microparticle in isolation at the air–water interface clearly show the four-lobed quadrupolar deformation of the interface. (c) SEM and (d) microinterferometry of the interface undulations near the ends of a microparticle. The scale bars correspond to 50 μm. | ||
Interface preparation and characterization
Particle interactions were studied at both air–water and oil–water interfaces. The air–water interface was prepared with deionized water (Milli-Q Integral 5, EMD Millipore Corp., water conductivity = 18.0 MΩ) in a 60 mm Petri dish (Corning). The interface is sufficiently large compared to the interacting microparticle pair that it is flat in the far field and considered an unbounded interface. The surface tension of the air–water interface was previously determined to be 72.0 mN m−1 at 25 °C by the pendant bubble method. A sparse monolayer was formed at the air–water interface by spreading microparticles from a dilute suspension with particle content of 0.25–0.29% by weight in equal volume of deionized water and ethanol (Analytic Grade Reagent Alcohol, Fisher Scientific, used as received). The shape of the air–water interface was characterized by both SEM and a home-built Michelson interferometer.Microparticles were immobilized at the fluid interface for scanning electron microscopy (SEM) imaging by a gel-trapping technique10,26 (Fig. 3(c)). An aqueous solution containing 2 wt% of a gellan gum (Kelcogel, supplied by CPKelco) was prepared in deionized water preheated to 95 °C. The aqueous solution was centrifuged to release the air bubbles, cooled to 60 °C and gently poured into a Petri dish. Microparticles from a similar water–ethanol suspension were spread onto the air–gellan solution interface, after which the entire sample was cooled to room temperature for 30 min to fix the gel. An elastomer mixture comprised of polydimethylsiloxane (PDMS) precursor (Sylgard 184 Elastomer, Dow Corning) and curing agent (Dow Corning) in a 10![[thin space (1/6-em)]](https://www.rsc.org/images/entities/char_2009.gif) :
:![[thin space (1/6-em)]](https://www.rsc.org/images/entities/char_2009.gif) 1 w/w ratio was prepared. It was centrifuged to release air bubbles and poured over the gellan solution. The polymer mixture was then left to cure at room temperature for 48 h, which produced a negative replica of the air–gellan solution interface. The replica was immersed in a 75 °C water bath for 5 min to rinse off any excess gellan gum. Lastly, a 2–3 nm layer of gold was sputtered on the PDMS replica for SEM imaging.
1 w/w ratio was prepared. It was centrifuged to release air bubbles and poured over the gellan solution. The polymer mixture was then left to cure at room temperature for 48 h, which produced a negative replica of the air–gellan solution interface. The replica was immersed in a 75 °C water bath for 5 min to rinse off any excess gellan gum. Lastly, a 2–3 nm layer of gold was sputtered on the PDMS replica for SEM imaging.
The interfacial deformation at the air–water interface around corrugated microparticles was also observed by microinterferometry (Fig. 3(b) and (d); see ESI† for the schematic of the interferometer). For the recorded interferograms, the change from maximum to minimum intensity corresponds to a vertical displacement corresponding to half of the wavelength of the illumination source, λLED = 532 nm. The resulting interferograms were recorded on the camera sensor through an upright objective.
Both unbounded and confined oil–water interfaces were prepared for experiments. Unbounded oil–water interfaces were prepared by carefully pouring an overlaying oil phase atop the water subphase. The oil–water interface tension was determined to be 44.5 mN m−1 by the pendant drop method. Microparticles were deposited from an oil suspension onto the oil–water interface by sedimentation.27 A similar procedure was used to trap microparticles at the oil–water interface for SEM. An oil superphase preheated to 60 °C was poured over the gellan solution prior to depositing microparticles by sedimentation. The solution was then cooled to room temperature for 30 min to fix the gel. The oil phase was subsequently removed and replaced with the elastomer PDMS mixture and prepared for SEM imaging.
Bounded oil–water interfaces were confined in channels with rectangular cross-section that were separated by ridges fabricated from SU-8 on a silicon wafer by similar lithographic techniques. The channel dimensions (depth × width) is 100 μm × 300 μm, separated by ridges of width 200 μm. The entire substrate was cleaned by multiple rinses with isopropanol and deionized water, followed by oxygen plasma treatment (Plasma Etch, Inc.), which rendered the surfaces hydrophilic. Immediately thereafter, the channels were backfilled with deionized water. The profile of the interface inside the channel was viewed from the side using the optical tensiometer to ensure that the water intersected the ridges with an angle of depression of 15 degrees. Thereafter, the oil phase (hexadecane, ≥99%, Sigma-Aldrich, used as a received) was gently placed over the water-filled channel. Finally, microparticles were dispersed by sedimentation through the oil phase.
Microparticle tracking
Microparticle trajectories were recorded at 500 frames per second using a high-speed camera (Phantom v 9.1, Vision Research Inc.). Vibrations were minimized using a floating optical table and a Minus K vibration isolation platform. Trajectories were processed and tracked using ImageJ.Experimental results and discussions
First, we study pair interactions of microparticles at the air–water interface. The wavy, curved microparticles shown in Fig. 3(a) adsorb on the interface in either a concave-up or a concave-down orientation. We report experiments only for particles that attach concave-up; results for concave-down particles are qualitatively similar. An interferogram of the deformation field around an isolated microparticle is shown in Fig. 3(b). The four-lobed structure of a quadrupole is obvious, as predicted by the simulation. Near field details of the deformation field are shown, obtained by SEM of a negative replica of the air–water interface (Fig. 3(c)), and by interferometry (Fig. 3(d)), respectively. The SEM image suggests that the water is pinned to the top edge of the microparticle. The interferogram shows that the interface presents near field undulations with periodicity comparable to that of the contact line. These particles are small enough that interface distortions and associated interactions owing to the particle weight can be neglected, as the Bond number, Bo = ρgL2/γ, which measures the relative importance of gravity to surface tension, is of the order of 10−3.Images of typical assemblies obtained by optical microscopy are shown as insets to Fig. 4(a). Matching particles assemble in apparent contact with their undulations in registry, while particles with differing wavelengths assemble with a gap greater than ten microns between them. In Fig. 4(a), trajectories of particle pairs are reported. In this figure, r12 is the instantaneous center-to-center distance, t is time, r12,f is the final center-to-center distance, μ is the viscosity of water subphase (μwater = 1 mPa s), γair–water is the surface tension of air–water interface and (tf–t) is time to contact, where tf is the time at which particles assemble. The corresponding velocities are shown in Fig. 4(b). As expected, in the far field, interactions are independent of the small-scale details of the particle shape; the trajectories for both matching and differing pairs of particles are consistent with the r12 ∝ (tf − t)1/6 power-law for quadrupolar capillary interactions (dash-dot line in Fig. 4(a)).11 In the near field, however, important differences emerge owing to details of particle shape. These differences are apparent in the time-dependence of their velocities shown in Fig. 4(b). Matching particles rapidly accelerate until apparent contact, while the differing particles slow to a stop before contact to assemble at an equilibrium separation distance of 14.0 ± 3.9 μm (as averaged over 10 measurements). The equilibrium separation distance varied weakly over the range of wavelengths explored, as shown in Fig. 5.
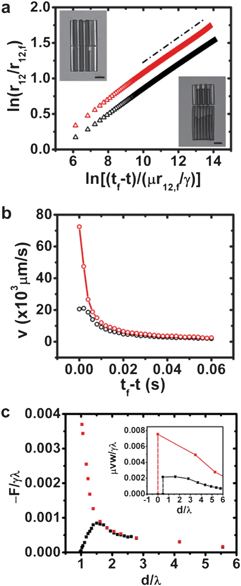 | ||
| Fig. 4 (a) Normalized separation distance against normalized time to contact for a pair of matching microparticles with λ = 36 μm (red triangles; see top inset) and a pair of microparticles with differing wavelengths λ = 36 μm and 60 μm (black triangles; see bottom inset). The scale bars in the insets correspond to 100 μm. (b) Relative velocity corresponding to the pairs of matching particles (red circles) and differing particles (black circles) in (a). (c) The capillary force F computed between matching microparticles (red squares) and differing particles (black squares), with Hp comparable to that of the microparticles in experiment. Inset: the drag force between the microparticles in experiment, with the unknown coefficient taken to be one. | ||
 | ||
| Fig. 5 Top-view of the microparticles with corrugations of different wavelengths, showing that the equilibrium distances depend weakly on the wavelengths. The average equilibrium separation distances over ten measurements are (a) dEQM = 14.0 ± 3.9 μm between microparticles of λ = 36 μm and 60 μm; (b) dEQM = 22.3 ± 4.4 μm between microparticles of λ = 36 μm and 108 μm and (c) dEQM = 13.9 ± 2.8 μm between microparticles of λ = 60 μm and 108 μm. The scale bars correspond to 100 μm. | ||
Owing to the limitations such as finite thickness effects and potential contact line rearrangement, a quantitative agreement between the simulations and the experiment over all ranges of interactions is not expected. However, simulations and experiment can be compared to comment on points of agreement and where significant discrepancies occur. We extract the amplitude of the far-field quadrupolar distortion (Hp) by equating the quadrupolar pair interaction force to the viscous drag in the far field (see ESI†). We find Hp = 6.4 μm for the matching particles and Hp = 8.0 μm for the differing particles. We simulate the pair interaction force between particles with amplitude and wavelengths corresponding to these experiments for Hp = 5.0 μm. To implement this value in simulation, the relationship between Hp and k, which parameterizes the parabolic bending of the simulated particles, is determined numerically. The interaction force from simulation (Fig. 4(c)) is compared to the to the normalized drag force from experiment (inset). Simulation and experiment agree until particles are within a few wavelengths of contact. At closer proximity, comparable force magnitude and separation distances are found for the differing particles, which assemble to equilibrium separations comparable to the smallest particle wavelength. Simulation significantly over-estimates the magnitude of the attractive force between matching particles, possibly owing to the neglect of contact line rearrangements in the near field or to the uncertainty in the drag coefficient.
In the second set of experiments, we studied similar microparticles at unbounded oil–water interfaces. Microparticles at the oil–water interface induce deformation fields that differ from those at the air–water interface owing to the differences in wetting conditions. The particles are well wet by oil with a nominal contact angle of 130° as determined by the sessile drop method. A negative replica of the deformation near a particle at the oil–water interface is shown in Fig. 6(a). The particle is mostly immersed in the oil phase, and creates weak sinusoidal deflections near the particle edge. As in the case of an air–water interface, end-to-end aligned matching particles assemble in apparent contact at oil–water interfaces, while end-to-end aligned particles with differing wavelengths assemble to an equilibrium separation distance. An image of the interface between the differing particles is also shown in Fig. 6(b). The distortion is qualitatively similar to the simulated interface shape between particles with differing wavelengths (see inset) and clearly reveals the source of the repulsive interactions: the high surface area created as the mismatched sinusoidal oscillations superpose (see also ref. 21).
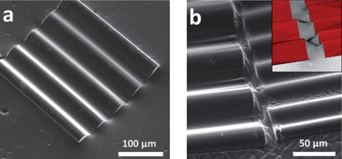 | ||
| Fig. 6 Shape of the oil–water interface around (a) an isolated microparticle and (b) between two microparticles of differing wavelengths (λ = 36 μm and 60 μm respectively). The inset in (b) shows the corresponding shape of the interface in surface evolver simulation. | ||
Pair interactions of end-to-end aligned particles at unbounded oil–water interfaces are reported in Fig. 7(a). The center-to-center separations at oil–water interfaces are normalized with the viscosity of the oil superphase (μoil = 2.892 mPa s) and γoil–water. Matching particles interact with the expected quadrupolar interaction only if they are separated by distances less than 3–4 particle lengths of each other and accelerate to contact for smaller separations. Particles separated by distances of 5–10 particle lengths did not interact over the time of the experiment, indicating a small value of the quadrupole–quadrupole interaction energy. In the near field, the particle acceleration at the oil–water interface is attenuated with respect to the particles at the air–water interface; particles move with peak velocities roughly 20 times smaller than when at the air–water interface. End-to-end aligned particles with differing wavelengths attract and subsequently decelerate to an equilibrium separation, with rates of approach that are also smaller compared to rates at the air–water interface. This effect may be attributable to a combination of a weaker deformation field and to the increased viscous dissipation owing to the oil super phase.
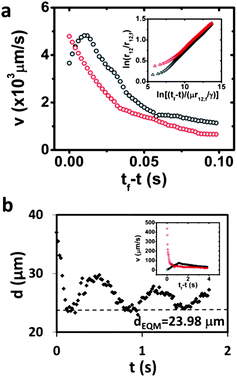 | ||
| Fig. 7 (a) Relative velocity for microparticles of the same wavelength (λ = 36 μm; red-colored symbols in both the main figure and inset) and differing wavelengths (λ = 36 μm and 60 μm; black-colored symbols) on unbounded oil–water interface. Inset reports the corresponding center-to-center separation between the microparticles and time to contact in logarithmic scale. (b) Separation distance between the corrugated ends of two microparticles with differing wavelengths (λ = 36 μm and 60 μm) on oil–water interface confined in channels against time, when the pair was subject to forced perturbations along the channel. The inset reports the relative velocity of the differing microparticles against time to contact on bounded oil–water interface. | ||
At oil–water interfaces, particles often violate end-to-end alignment, frequently assembling at angles, perhaps because of a relatively weak quadrupolar deformation (see ESI† for video).
To qualitatively probe the nature of the capillary bond, pairs of assembled particles were disturbed in the interface by shaking the sample laterally. On air–water interfaces, all particle pairs move as a rigid compound object, regardless of whether they were formed from matching particles or differing particles. On oil–water interfaces, pairs of matching particles also moved as a rigid body while remaining in apparent contact. However, the response of the particles with differing wavelengths was more interesting. The particles moved relative to each other as the assembly was shaken, with weak angular rocking and bouncing of the capillary bond (see ESI† for video).
In our final set of experiments, we studied pair interactions of particles at an oil–water interface confined to a channel slightly larger than the particle, so as to enforce end-to-end alignment (see ESI† for the trajectory analyses). Particles in the confining channel were allowed to assemble and subsequently shaken in the direction parallel to the channel axis. Particles with differing wavelength corrugations bounced elastically under these disturbances. In the case reported in Fig. 7(b), one of the particles was fixed at the end of the channel, precluding translation. As the entire assembly is shaken, the particle pair exhibits asymmetric displacements relative to the equilibrium separation distance, in qualitative agreement with prediction. The relative velocities of the microparticles against time to contact are reported in the inset of Fig. 7(b).
Other assemblies
In this work, we have focused on particles designed to assemble to equilibrium separation distances. Other assemblies are possible, depending on the sinusoidal corrugation and the relative sizes of the particles. For example, at the air–water interfaces, particles with corrugations of equal wavelengths but out of phase by π radians typically shift by half a wavelength to allow the corrugations to align in registry (see ESI† for video). The observation indicates that the energy decrease from aligning the corrugations can be greater than the energy cost for violating end-to-end alignment. Particles with weakly differing widths, or with wavelengths comparable to the particle width can form angled assemblies, similar to the angled assemblies (termed capillary arrows) formed by ellipsoids of different aspect ratios11 (see ESI† for video).Conclusions
In this paper, we investigate the effect of small-scale geometric details on near and far field capillary interactions between anisotropic microparticles adsorbed at fluid–fluid interfaces. Of particular interest is the possibility of achieving capillary repulsion.To gain insight into the problem, we first simulated the shape of the interface and computed the corresponding capillary interaction for model particles; the model particles are thin bent sheets featuring small-amplitude sinusoidal corrugations having wavelength much smaller than the particle itself. In the far field, the model particles induce a quadrupolar distortion. This distortion leads to a far field attractive interaction regardless of the details of the particle corrugations. In the near field, the sinusoidal corrugations induce periodic interface distortions that can give rise to an enhanced capillary attraction, in the case of identical particles. In the case of particles having differing wavelengths, particles assemble to equilibrium separation distances comparable to the wavelength of the disturbances.
Near field capillary interactions were studied in experiments with lithographically defined microparticles designed to have the key geometric features of the model particles. We considered both unbounded interfaces, and interfaces bounded between two vertical walls. In this latter configuration, the walls were placed at a separation slightly larger than the particle lateral size, so as to constrain the particle orientation. Particles with matching features assembled in contact, while particles with differing wavelengths arrested at an equilibrium separation. To probe the nature of the capillary interaction, we perturbed mechanically the assembled particle pairs. While pairs of particles with matching features move as a compound body, the relative position between particles with non-matching features oscillates about the equilibrium separation. This behavior is observed on both bounded and unbounded interfaces. The oscillations are asymmetric with respect to equilibrium, which suggests that the repulsive component of the interaction is stronger than the attractive one for finite displacements. These observations are in qualitative agreement with the numerical predictions.
This study may provide insights into the role of roughness and particle surface microstructure in modulating near field capillary interactions. It also suggests ways to avoid kinetically trapped states in monolayers of interfacial colloids assembled by capillarity. To our knowledge, this study is the first experimental demonstration of capillary repulsion being used to create non-contacting assemblies of microparticles.
Acknowledgements
We gratefully acknowledge the financial support for this work through grants from National Science Foundation CBET-1133267 and DMR11-20901. We also acknowledge the shared facilities at the Penn Regional Nanotechnology Facility in University of Pennsylvania.Notes and references
- S. Pickering, J. Chem. Soc., 1907, 91, 2001 RSC
.
- T. S. Horozov and B. P. Binks, Angew. Chem., Int. Ed., 2006, 45, 773–776 CrossRef CAS
.
- R. Alargova, D. Warhadpande and V. Paunov, Langmuir, 2004, 20, 10371–10374 CrossRef CAS
.
- A. D. Dinsmore, M. F. Hsu, M. G. Nikolaides, M. Marquez, A. R. Bausch and D. A. Weitz, Science, 2002, 298, 1006–1009 CrossRef CAS
.
- P. F. Noble, O. J. Cayre, R. G. Alargova, O. D. Velev and V. N. Paunov, J. Am. Chem. Soc., 2004, 126, 8092–8093 CrossRef CAS
.
- L. Botto, E. Lewandowski, M. Cavallaro, Jr and K. J. Stebe, Soft Matter, 2012, 8, 9957–9971 RSC
.
- A. B. D. Brown, C. G. Smith and A. R. Rennie, Phys. Rev., 2000, 62, 951–960 CAS
.
- T. Brugarolas, B. J. Park, M. H. Lee and D. Lee, Adv. Funct. Mater., 2011, 21, 3924–3931 CrossRef CAS
.
- E. P. Lewandowski, J. A. Bernate, A. Tseng, P. C. Searson and K. J. Stebe, Soft Matter, 2009, 5, 886–890 RSC
.
- E. P. Lewandowski, M. Cavallaro, L. Botto, J. C. Bernate, V. Garbin and K. J. Stebe, Langmuir, 2010, 26, 15142–15154 CrossRef CAS
.
- J. C. Loudet, A. M. Alsayed, J. Zhang and A. G. Yodh, Phys. Rev. Lett., 2005, 94, 018301 CrossRef CAS
.
- B. J. Park, T. Brugarolas and D. Lee, Soft Matter, 2011, 7, 6413–6417 RSC
.
- B. J. Park and E. M. Furst, Soft Matter, 2011, 7, 7676–7682 RSC
.
- E. A. Van Nierop, M. A. Stijnman and S. Hilgenfeldt, Europhys. Lett., 2005, 72, 671–677 CrossRef CAS
.
- L. Botto, L. Yao, R. L. Leheny and K. J. Stebe, Soft Matter, 2012, 8, 4971–4979 RSC
.
- H. Lehle, E. Noruzifar and M. Oettel, Eur. Phys. J. E: Soft Matter Biol. Phys., 2008, 26, 151–160 CrossRef CAS
.
- N. B. Bowden, M. Weck, I. S. Choi and G. M. Whitesides, Acc. Chem. Res., 2001, 34, 231–238 CrossRef CAS
.
- M. Oettel and S. Dietrich, Langmuir, 2008, 24, 1425–1441 CrossRef CAS
.
- C. A. Helm, W. Knoll and J. N. Israelachvili, Proc. Natl. Acad. Sci. U. S. A., 1991, 88, 8169–8173 CrossRef CAS
.
- J. Lucassen, Colloids Surf., 1992, 65, 131–137 CrossRef CAS
.
- D. Stamou, C. Duschl and D. Johannsmann, Phys. Rev. E: Stat. Phys., Plasmas, Fluids, Relat. Interdiscip. Top., 2000, 62, 5263–5272 CrossRef CAS
.
- F. Bresme and M. Oettel, J. Phys.: Condens. Matter, 2007, 19, 413101 CrossRef
.
- M. E. Cates and P. S. Clegg, Soft Matter, 2008, 4, 2132–2138 RSC
.
- P. Pieranski, Phys. Rev. Lett., 1980, 45, 569–572 CrossRef CAS
.
- K. Brakke, Exp. Math., 1992, 1, 141–165 CrossRef
.
- V. N. Paunov, Langmuir, 2003, 19, 7970–7976 CrossRef CAS
.
- M. Cavallaro, Jr, L. Botto, E. P. Lewandowski, M. Wang and K. J. Stebe, Proc. Natl. Acad.
Sci. U. S. A., 2011, 108, 20923–20928 CrossRef
.
Footnotes |
| † Electronic supplementary information (ESI) available. See DOI: 10.1039/c2sm27020j |
| ‡ Authors contributed equally to this work. |
| § Current address: Imperial College London, Department of Chemical Engineering, South Kensington Campus, London SW7 2AZ, UK. |
| This journal is © The Royal Society of Chemistry 2013 |
