 Open Access Article
Rational design of Au nanorods assemblies for highly sensitive and selective SERS detection of prostate specific antigen†
An-qi
Yang
a,
Dong
Wang
 ab,
Xiang
Wang
b,
Yu
Han
a,
Xue-bin
Ke
a,
Hong-jun
Wang
c,
Xi
Zhou
*a and
Lei
Ren
*ab
aDepartment of Biomaterials, College of Materials, Xiamen University, Xiamen, 361005, People's Republic of China. E-mail: xizhou@xmu.edu.cn; renlei@xmu.edu.cn; Fax: +86-5922183937; Tel: +86-5922188530
bState Key Laboratory for Physical Chemistry of Solid Surfaces, Department of Chemistry, College of Chemistry and Chemical Engineering, Xiamen University, Xiamen, 361005, People's Republic of China
cDepartment of Chemistry, Chemical Biology and Biomedical Engineering, Stevens Institute of Technology, 1 Castle Point on Hudson, Hoboken, New Jersey 07030, USA
First published on 20th April 2015
Abstract
A versatile approach for highly sensitive surface-enhanced Raman scattering (SERS) detection of prostate specific antigen (PSA) has been developed based on immune recognition assisted fabrication of gold nanorods (AuNRs) assemblies. Compared with the typical enzyme-linked immunosorbent assay, this SERS immunoassay strategy showed an obviously enhanced sensitivity. The SERS immunoassay for PSA detection has also been successfully applied in diluted human serum samples, showing the promising potential for early diagnosis of diseases in clinical application.
Introduction
Surface-enhanced Raman scattering (SERS) spectroscopy is a surface-sensitive vibrational spectroscopic technique that enhances Raman scattering by molecules adsorbed on the surface of plasmonic metallic nanostructures.1,2 The enhancement factor can be as much as 106 to 1014, particularly in the “hot spots” of an assembled nanoparticles, which means the technique can be used in the single molecule detection.3–6 Due to its excellent chemical specificity, SERS has become an important analytical tool in a lot of research disciplines, especially in biomedical applications.7 There are several advantages of SERS technique: sensitivity with ultra-low detection limit, lack of photobleaching, narrow spectral bandwidths, and easy distinction from the signal of the background autofluorescence.6 These advantages make SERS become a good choice for quantitative analysis of chemicals, medical diagnostic, and biological molecules.8,9Au nanorods (AuNRs) have attracted special interest because of their unique chemical, geometrical and optical properties.10,11 AuNRs can be used in many biomedical applications such as cell imaging,12 photothermal therapy,11 bioassay and biosensor.10 In addition, assemblies of individual AuNR may provide new or enhanced properties such as the excellent surface plasmon resonance (SPR) and tunable optoelectronic properties, thus can be used to enhance surface Raman scattering signal.10 So far, several strategies including electrical interaction,13 biotin–streptavidin connectors,14 antibody–antigen recognition,15 and DNA hybridization16 have been developed to control the end-to-end and side-by-side assembly of AuNRs. In the previous research, we have successfully achieved orientation-controllable assemblies of AuNRs into side-by-side (SS), end-to-end (EE) and end-to-side (ES) orientations based on the electrostatic interaction. We found that the EE assembly showed the extremely high surface enhancement factor of about 6 × 105.13 Taking advantage of this unique property, a SERS immunoassay sensor was designed for highly sensitive biological detection based on the bio-recognized EE assembly of AuNRs.13
Prostate cancer has become one of the most widespread diagnosed cancers in males. Currently, there is no effective treatment for metastatic or advanced prostate cancer, thus an early detection for prostate cancer is urgently needed.17,18 Prostate specific antigen (PSA) as an important cancer biomarker has been most accepted for clinical diagnosis of early stage prostate cancer.19 Some conventional immunoassay methods for PSA detection have been reported, including enzyme-linked immunosorbent assay (ELISA),20 mass spectrometric immunoassays,21 electrochemical,22 fluorescence,23 chemiluminescence assay,24 and radio immunoassay (RIA).25 However, most of the current assays have their limitations, such as expensive equipments, time consuming analysis and complicated procedure at dedicated testing site.26 In the case of ELISA, several complicated steps led to labor-intensive, lengthy analysis time, and low sensitivity.26,27 Therefore, there is a need to develop simple and rapid PSA-sensing systems for early clinical diagnostics.
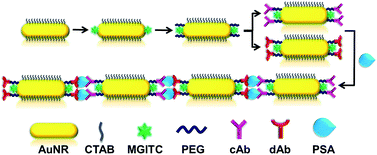
To the best of our knowledge, there is no exploration yet in using functionalized AuNRs as an immunosensor via the SERS technique for the detection of PSA. Herein, based on EE assembly of AuNRs through the antigen and antibody bio-recognition, an immunosensor has been developed for PSA detection. Following the assembly process, SERS signal of malachite green isothiocyanate (MGITC) attached on the end of AuNRs could be greatly enhanced due to the existence of “hot spots” in the gap between AuNRs. A diagrammatic illustration of PSA detection was shown in Scheme 1. The satisfactory result of PSA quantitative analysis by this strategy was obtained in diluted human serum samples. This approach features easy preparation, high specificity to PSA and enhanced sensitivity with SERS technique, showing promising application for early detection of prostate cancer in clinical diagnosis.
Experimentation
Chemicals
Chloroauric acid (HAuCl4·3H2O, 99%), cetyltrimethylammonium bromide (CTAB, 99%), silver nitrate (AgNO3, >99%), sodium borohydride (NaBH4, 99%), L-ascorbic acid (AA, 99%), (3-dimethylaminopropyl)ethyl-carbodiimidmonohydrochloride (EDC), phosphate buffered saline (PBS), N-hydroxysuccinimide (NHS) and 2-(N-morpholino)ethanesulfonic acid (MES) were purchased from Sinopharm Chemical Reagent Co. Ltd, China. Thiol carboxylic polyethyleneglycol (HS-PEG-COOH, MW ∼ 459) was obtained from Rapp Polymere GmbH, Germany. Malachite green isothiocyanate (MGITC) was purchased from Invitrogen Corporation, USA. Prostate specific antigen (PSA), monoclonal antibody to human PSA (detector antibody-FITC, dAb-FITC), monoclonal antibody to human PSA (detector antibody, dAb), monoclonal antibody to human PSA (capture antibody, cAb), human alpha fetoprotein (AFP) antigen, monoclonal antibody to human alpha fetoprotein (anti-AFP (label)), monoclonal antibody to human alpha fetoprotein (anti-AFP (coating)), human serum, hemoglobin (Hb), immunoglobulin G (IgG), heparin (Hep) and albumin (Alb) were purchased from Sangon Biotech Co. Ltd, China. Ultrapure water (18 MΩ cm−1) was used throughout the experiment.Synthesis of AuNRs
AuNRs were prepared by the well-established seed-mediated growth process with a slight modification.13 Firstly, Au seed solution was prepared by adding a freshly ice-cold NaBH4 solution (0.60 mL, 0.01 M) into a mixed aqueous solution composed of HAuCl4 (0.25 mL, 0.01 M) and CTAB (7.50 mL, 0.1 M). This seed solution was rapidly stirred for 2 min then kept at room temperature (25 °C) for 2 h. To prepare the AuNRs growth solution, HAuCl4 (5 mL, 0.01 M) and AgNO3 (0.35 mL, 10 mM) were mixed with CTAB (95 mL, 0.1 M), followed by adding a freshly prepared AA solution (0.55 mL, 0.1 M). Finally, 120 μL of Au seed solution was added into the AuNRs growth solution with rapid stirring for 2 min then kept at room temperature for 3 h. The resulting AuNRs were separated and purified by centrifuging at 10![[thin space (1/6-em)]](https://www.rsc.org/images/entities/char_2009.gif) 000 rpm for 30 min.
000 rpm for 30 min.
End-to-end (EE) assembly of AuNRs by antibody–antigen interactions
2 mL of the prepared AuNRs solution were centrifuged at 9500 rpm for 15 min twice in order to remove excess CTAB, and redispersed in 1 mL of ultrapure water. MGITC solution (10 μL, 10 μM) was added dropwise to mix well with AuNRs solution, and then HS-PEG-COOH (20 μL, 10 μM) was added in the same way. In order to activate the carboxyl groups, MES (50 μL, 0.2 M) and EDC (10 μL, 0.1 M) were added into the mixture and reacted for 20 min at room temperature with gentle inversion, followed by the addition of NHS (5 μL, 0.5 M). After mixing for 20 min, the mixture was purified by centrifugation for 15 min at 7000 rpm and redispersed in 1 mL of 10X PBS. The detector antibody (15 μL, 50 μg mL−1) and the capture antibody (15 μL, 50 μg mL−1) were added to the mixture (500 μL), respectively. Both of them were stirred for 3 min at room temperature, followed by incubation at 37 °C for 1 h. The two separated reaction parts were mixed together to get an immunosensor solution for PSA detection.Finally, 10 μL of PSA with different concentrations (0, 0.1, 0.5, 1, 5 and 10 μg mL−1) were added into 1 mL immunosensor solution and shaken at 37 °C for 10 min, respectively. Then the solution was analyzed by UV-vis spectrophotometer.
SERS detection of PSA
In a typical PSA detection procedure, 10 μL of PSA with different concentrations (0, 0.005, 0.01, 0.05, 0.1, 0.5, 1, 5 and 10 μg mL−1) were added into 1 mL of immunosensor solution and incubated for 10 min at 37 °C. Then the mixtures were tested by Raman measurements. To examine the specificity of the immunosensor towards PSA, Hb, IgG, Hep, Alb and PSA (10 μL, 10 μg mL−1) were added into 1 mL of immunosensor solution and incubated for 10 min at 37 °C, respectively. Then the mixtures were measured by Raman measurements. To evaluate the response of the immunosensor in complex biological environment, the PSA detection was also performed in diluted human serum. 10 μL of PSA with different concentrations (0.01, 0.1, 1 and 10 μg mL−1) were added into 1 mL of immunosensor solution with 10% diluted human serum, then samples were analyzed by Raman measurements. All the measurements were taken under the same conditions and performed with three repeats. To verify whether the AuNRs assembly based immunoassay could be used for other antigen detection, SERS detection of AFP was conducted in a similar process as the above PSA detection procedure.Characterization
Transmission electron microscopy (TEM) images were obtained using a JEM-1400 (100 kV) microscope. In order to rule out any evaporation-related arrangement of AuNRs, TEM samples were prepared according to Murphy's report.28 Briefly, the TEM grids were immersed inside the sample solution for 2 min, filter was used to remove any small drops left on the TEM grid. The UV-vis absorption spectra were obtained using a TU-1810 UV-vis spectrophotometer. Raman spectra were obtained by a compact Raman system using 785 nm excitation with 1 s exposure time (40 mW, Advantage Raman Series, DeltaNu). The zeta potential was measured using a Malvern Zetasizer ZEN3600 instrument. The Fourier transform infrared (FT-IR) spectrum was obtained using a NicoletMagana 550 FT-IR spectrophotometer. The fluorescence emission spectra was obtained using a FLS 920 spectrofluorimeter (FLS 920 spectrofluorimeter, Edinburgh, UK).The electromagnetic response of nanorods were solved with finite difference time domain (FDTD) method. The dielectric constant of gold was from Johnson & Christy.29 The excitation laser was 785 nm and polarized with the longitudinal axis of the nanorod. The mesh unit for monomer and dimer of nanorods were 0.2 nm along the longitudinal axis and 0.5 nm along other two axes. The mesh unit for quadra nanorods was 0.3 nm along the longitudinal axis and 0.5 nm along other two axes.
Calculation of SERS enhancement factor
The surface enhancement factor (EF) was calculated based on eqn (1):13 | (1) |
Determination of the limit of detection
The limit of detection (LOD) was calculated based on eqn (2):27 | (2) |
Results and discussion
Characterization of AuNRs functionalized with antibody
As determined from TEM analysis (Fig. S1A†), the aspect ratio of AuNRs was about 2.9 (length 43.7 ± 1.3 nm and diameter 15.5 ± 0.4 nm). Two Surface Plasmon Resonance (SPR) peaks of AuNRs which contained a transverse absorption at 512 nm and a longitudinal absorption at 645 nm were shown in Fig. S1B.† After conjugation with antibody, a red-shift of 4 nm in the longitudinal peak of AuNRs-antibody (AuNR-Ab) was observed and the intensity of this absorption was decreased. This result indicated that antibody functionalized AuNRs assemblies became longer in length.27In order to monitor the surface modification of AuNRs, zeta potential in three modification stages were measured (Fig. S2A†). The AuNRs synthesized through the CTAB-capped seed were enclosed by a {110} side face and a {100} end face.28,30 The zeta potential of the original AuNRs (stage a) was 49.7 ± 3.4 mV. Taking advantages of anisotropic property of AuNRs,31,32 HS-PEG-COOH was first adsorbed on {100} end face of AuNRs via Au–S bonding.13 The zeta potential sharply decreased to 26.8 ± 3.9 mV (stage b), such decrease in zeta potential suggested that the negatively-charged HS-PEG-COOH was bound to the face of AuNRs. The capture antibody (cAb) or detector antibody (dAb) was then anchored to the end face by covalently coupling to HS-PEG-COOH. The zeta potential further decreased to 22.4 ± 2.5 mV (stage c), which might confirm the successful conjugation of antibody to AuNRs due to the partial neutralization of the positive charge of CTAB on the AuNRs surface with the negative charge of antibody in PBS. FT-IR spectra of AuNRs-CTAB, AuNRs-HS-PEG-COOH and AuNRs-antibody samples also indicated the attachment of antibody on the surface of AuNRs (Fig. S2B†).
Fluorescence spectroscopy (Fig. S3†) and UV-vis spectroscopy (Fig. S1B†) were used to determine the number of antibodies conjugated to per AuNR. The un-conjugated antibody-FITC present in the supernatant was calculated to be 19.13 nM by calibration curve and the concentration of AuNRs was calculated to be 0.544 nM by Lambert–Beer law.33 Thus, there were about 46 antibodies anchored to the end face of per AuNR. The detailed calculation and discussion were given in ESI.†
Characterization of AuNRs assembly
EE assembly of AuNRs was observed with the addition of PSA at different concentrations (Fig. 1). With increasing the concentrations of PSA from 0.5 to 100 ng mL−1, the length of AuNRs chain gradually extended from 93 (Fig. 1A) to 1046 (Fig. 1F) nm. This result demonstrated that EE assembly of AuNRs was successfully achieved via antibody and antigen specific bio-recognition. Moreover, due to the steric effect of antigens and antibodies bio-conjugation,27 a distance with 5.65 ± 0.20 nm average length was found between consecutive AuNRs, which fell into the “hot spot” region.34,35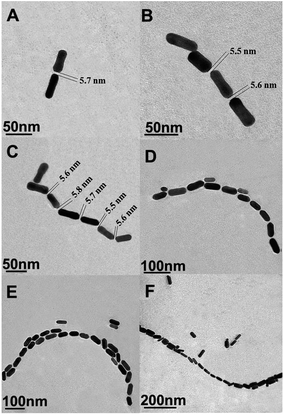 | ||
| Fig. 1 (A)–(F) Representative TEM images of AuNRs EE assembly formed with the addition of different concentrations of PSA: 0.5, 1, 5, 10, 50, 100 ng mL−1. | ||
The theoretical calculation of the electric-field enhancement of EE assembly of AuNRs in different degree was estimated by using the FDTD method based on numerically solving Maxwell's curl equations by iteration over time.35 The 785 nm excitation laser was polarized with the longitudinal axis of AuNRs. As shown in Fig. 2, individual AuNR offered weak electric field enhancement (about 300) originated from the longitudinal mode of AuNRs. With the number of AuNR increasing, the electric field enhancement for the typical EE assembly increased dramatically due to the effective coupling of localized surface plasmon between AuNRs. The maximum enhancement of electric field intensity in the “hot spots” was found to be 3200 and 6400 for two and four AuNRs assemblies respectively as shown in Fig. 2B and C. Therefore, the theoretical simulation was consistent with the study of Lin34 and Lee,35 which suggested that the EE assembly of AuNRs could induce strong SERS enhancement.
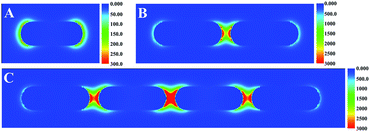 | ||
| Fig. 2 FDTD simulated electric-field distribution for (A) individual AuNR before assembly, (B) two AuNRs, and (C) four AuNRs EE assemblies. | ||
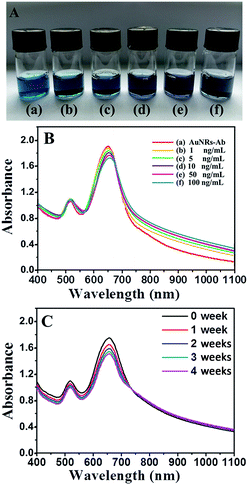
The variation in the optical properties of AuNRs-Ab solutions was demonstrated in Fig. 3A which showed the picture of glass vials containing different concentrations of PSA. Clearly, the solution of AuNRs-Ab in Fig. 3A(a) exhibited a blue color. As the concentration of PSA increasing, the color of AuNRs-Ab solutions in Fig. 3A(b)–(f) gradually deepen to grey. The change in color of AuNRs solutions from blue to grey as a consequence of aggregation has been a well-understood phenomenon.7
Further evidence of the AuNRs EE assembly was obtained from UV-vis spectroscopy (Fig. 3B). As the concentration of PSA gradually increasing, the longitudinal plasmon peaks of AuNRs red shifted to longer wavelength (from 649 to 657 nm), and the intensity of those absorbance decreased (Fig. 3B). This red shift may be caused by the plasmon coupling which was quite common in the EE assembly of AuNRs, suggesting the transformation of AuNRs arrangement.36–38 On the other hand, the transverse SPR peaks just changed slightly indicating that the variation of AuNRs was little in the lateral face. These spectroscopy characterization indicated the formation of chain-like arrangement of AuNRs, which was consistent with the previous reports by Wang39 and the numerical simulations of model systems.37
UV-vis spectroscopy (Fig. 3C) was utilized to study the stability of AuNRs EE assembly structure. During four weeks, the intensity of longitudinal plasmon peak at 657 nm of AuNRs changed slightly. Moreover, the wavelength and the width of SPR peak were almost unchanged, indicating the well stability of AuNRs EE assembly structures in aqueous dispersions. The stability property was better than some other self-assembly systems,13,14 due to the strong bio-interaction between antibody and antigen.
SERS-based PSA immunoassay
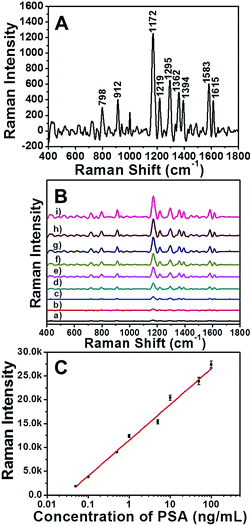
To demonstrate whether the EE assembly of AuNRs could be used as SERS immunosensor, the detection of PSA was firstly conducted in an aqueous solution. The characteristic bands of Raman reporter molecule MGITC at 798, 912, 1172, 1295, 1362 and 1583 cm−1 were shown in SERS spectrum (Fig. 4A). As displayed in Fig. 4B, the availability of the assembly of AuNRs as SERS immunosensor was illustrated by monitoring the Raman intensities changing along with the addition of different concentrations of PSA. After reacting with different amount of PSA, the immunosensor displayed several strong Raman peaks, which were consistent with the Raman shift of MGITC. As the concentration of PSA increased, the MGITC-labeled immunosensor exhibited obvious enhancement of Raman intensity. The surface enhancement factors (EF) with 100 and 0.05 ng mL−1 of PSA were 5.62 × 10⁵ and 2.16 × 10³, respectively. The calculation of EF was based on the eqn (1). That was to say, the Raman signal of reporter molecule located at the gap between the AuNRs could be obviously enhanced in the sequence of EE assembly. The effective response range of the PSA concentration was broad from 0.05 to 100 ng mL−1, which would serve the SERS immunosensor suitable for the clinical detection of prostate cancer precursor.40The standard curve of the detection was presented in Fig. 4C, which revealed the relationship between Raman intensity of the 1172 cm−1 peak and the concentration of PSA ranging from 0 to 100 ng mL−1. The data were analyzed by linear regression. The regression equation was Y = 7500.80X + 11464.00 with a good correlation coefficient (R2 = 0.993), where X was the logarithms of the concentration of PSA and Y was the Raman intensity of the sample detected. The linear range of this method was from 0.05 to 100 ng mL−1 and the limit of detection (LOD) of PSA was 0.01 ng mL−1.
The self-assembly sensing system exhibited several advantages for PSA diagnostic applications. The sensitivity of the developed SERS based immunoassay was better than typically commercial ELISA assay, in which the LOD was 0.1 ng mL−1.41 Moreover, the detection linear range of this immunoassay meet well the demand of clinical applications, as the danger zone of PSA concentration in human serum was 4–10 ng mL−1.40 Furthermore, time consuming was required in the ELISA tests due to several complicated steps.41 On the contrast, the whole analysis time in the current assay was less than 10 min with the rapid response and simple operation. Thus, it would be much more suitable for rapid detection of PSA in precise clinical diagnostics.
Moreover, in order to verify whether the AuNRs assembly based immunoassay could be used for other antibody–antigen bio-recognition systems, this strategy was extended to detect human alpha fetoprotein (AFP antigen), which was an important cancer biomarker for clinical diagnosis. As displayed in Fig. S4A,† the availability of AuNRs assembly as SERS immunosensor was illustrated by monitoring the change of Raman intensity along with the addition of different concentration of AFP. As the concentrations of AFP increased from 0.1 to 100 ng mL−1, the MGITC-labeled AuNRs assembly immunosensor exhibited obvious enhancement of Raman intensity. The surface enhancement factors (EF) with 100 and 0.1 ng mL−1 of AFP were 4.34 × 10⁵ and 2.78 × 10³, respectively. The standard curve of the detection was presented in Fig. S4B,† the regression equation was Y = 6884.87X + 7790.19 with a good correlation coefficient (R2 = 0.990), where X was the logarithms of the concentration of AFP and Y was the Raman intensity of the sample detected. The linear range of the AFP concentration was from 0.1 to 100 ng mL−1, which could serve the SERS immunosensor suitable for the clinical detection of AFP.42 The characterization and discussion of AuNRs assembly directed by antibody–AFP biorecognition was given in ESI (Section 4†). The satisfied result demonstrated that this design could be extended to a variety of antigen detection.
Selectivity and analysis application
To further evaluate the specificity of the AuNRs assembly immunosensor for PSA, control experiments using Hb, IgG, Hep and Alb as interference reagents were performed. It can be clearly seen in Fig. 5 that the intensity of SERS signal of PSA was strikingly higher than that of the other four proteins at the same concentration (100 ng mL−1). The satisfactory result indicated that the SERS based immunoassay possessed high selectivity for PSA.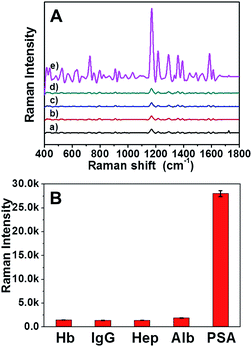 | ||
| Fig. 5 SERS spectra of MGITC-AuNRs assembly in the presence of different interference reagents: (a) Hb, (b) IgG, (c) Hep, (d) Alb and (e) PSA at the same concentration (100 ng mL−1). | ||
The feasibility of this designed immunosensor in clinical application was further investigated by a recovery experiment of PSA detection in human serum. Briefly, different amount of PSA was incubated in 10% diluted human serum solution, respectively. The obtained samples were detected by the AuNRs assembly via SERS and the results were shown in Fig. 6. By applying the regression equation, the recoveries of the known spiked amounts of PSA were between 96.6% and 103% with a satisfactory precision (Table 1), indicating that there was no significant differences between the values of PSA measured in diluted human serum solution and in the aqueous solution. The developed immunosensor performed a satisfactory result for quantitative assay of PSA in human serum samples, thus could be potentially applied to clinical diagnosis.
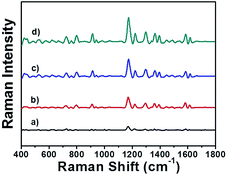 | ||
| Fig. 6 SERS spectra of MGITC-AuNRs assembly incubated in 10% diluted human serum with different concentrations of PSA: (a)–(d) 0.1, 1, 10, 100 ng mL−1, respectively. | ||
| Sample no. | 1 | 2 | 3 | 4 |
|---|---|---|---|---|
| PSA addition (ng mL−1) | 0.1 | 1 | 10 | 100 |
| PSA detection (ng mL−1) | 0.103 ± 0.0030 | 0.983 ± 0.089 | 9.66 ± 0.71 | 98.9 ± 6.1 |
| Recovery (%) | 103 ± 3.0 | 98.3 ± 8.9 | 96.6 ± 7.1 | 98.9 ± 6.1 |
Conclusions
In summary, a highly sensitive and selective SERS immunosensor based on the fabrication of AuNRs assembly has been developed for the rapid detection of PSA. The detection system was rationally designed based on the EE assembly of AuNRs through the bio-recognition between antigen and antibody. In these AuNRs assemblies, numerous “hot spots” formed in the gap between AuNRs. Obvious Raman signal enhancement for highly sensitive detection of PSA could be obtained from these “hot spots”. The SERS based immunoassay possessed convenience, time-saving and high selectivity for PSA detection. Moreover, the immunosensor was stable in the complicated detection environment and satisfactory result of PSA quantitative analysis was obtained in diluted human serum samples. It was believed that this strategy would show a great potential for early diagnosis of prostate cancer.Acknowledgements
This work was financially supported by the National Basic Research Program of China (973 Program) (2013CB933703) and the National Nature Science Foundation of China (NSFC grants 31371012, 81171448 and 31428007).Notes and references
- S. Schlücker, ChemPhysChem, 2009, 10, 1344 CrossRef PubMed
.
- J. F. Li, Z. L. Yang, B. Ren, G. K. Liu, P. P. Fang, Y. X. Jiang, D. Y. Wu and Z. Q. Tian, Langmuir, 2006, 22, 10372 CrossRef CAS PubMed
.
- P. D. Howes, R. Chandrawati and M. M. Stevens, Science, 2014, 346, 1247390 CrossRef PubMed
.
- P. Quaresma, I. Osório, G. Dória, P. A. Carvalho, A. Pereira, J. Langer, J. P. Araújo, I. Pastoriza-Santos, L. M. Liz-Marzán, R. Franco, P. V. Baptista and E. Pereira, RSC Adv., 2014, 4, 3659 RSC
.
- J. A. Dougan, D. MacRae, D. Graham and K. Faulds, Chem. Commun., 2011, 47, 4649 RSC
.
- R. A. Alvarez-Puebla and L. M. Liz-Marzan, Chem. Soc. Rev., 2012, 41, 43 RSC
.
- P. D. Howes, S. Rana and M. M. Stevens, Chem. Soc. Rev., 2014, 43, 3835 RSC
.
- K. Gracie, E. Correa, S. Mabbott, J. A. Dougan, D. Graham, R. Goodacre and K. Faulds, Chem. Sci., 2014, 5, 1030 RSC
.
- Y. Zhang, H. Hong, D. V. Myklejord and W. Cai, Small, 2011, 7, 3261 CrossRef CAS PubMed
.
- C. J. Murphy, T. K. Sau, A. M. Gole, C. J. Orendorff, J. Gao, L. Gou, S. E. Hunyadi and T. Li, J. Phys. Chem. B, 2005, 109, 13857 CrossRef CAS PubMed
.
- E. C. Dreaden, M. A. Mackey, X. Huang, B. Kang and M. A. El-Sayed, Chem. Soc. Rev., 2011, 40, 3391 RSC
.
- E. C. Dreaden, A. M. Alkilany, X. H. Huang, C. J. Murphy and M. A. El-Sayed, Chem. Soc. Rev., 2012, 41, 2740 RSC
.
- L. B. Zhong, X. Zhou, S. X. Bao, Y. F. Shi, Y. Wang, S. M. Hong, Y. C. Huang, X. Wang, Z. X. Xie and Q. Q. Zhang, J. Mater. Chem., 2011, 21, 14448 RSC
.
- X. Zhou, Y. Wang, L. Zhong, S. Bao, Y. Han, L. Ren and Q. Zhang, Nanoscale, 2012, 4, 6256 RSC
.
- S. T. S. Joseph, B. I. Ipe, P. Pramod and K. G. Thomas, J. Phys. Chem. B, 2006, 110, 150 CrossRef CAS PubMed
.
- H. J. Paraba, C. Junga, J. H. Leeb and H. G. Park, Biosens. Bioelectron., 2010, 26, 667 CrossRef PubMed
.
- K. Lee, S. Mandal, J. Morry, O. Srivannavit, E. Gulari and J. Kim, Chem. Commun., 2013, 49, 4528 RSC
.
- A. Dey, A. Kaushik, S. K. Arya and S. Bhansali, J. Mater. Chem., 2012, 22, 14763 RSC
.
- L. Rodríguez-Lorenzo, R. de la Rica, R. A. Álvarez-Puebla, L. M. Liz-Marzán and M. M. Stevens, Nat. Mater., 2012, 11, 604 CrossRef PubMed
.
- D. M. Rissin, D. R. Fournier, T. Piech, C. W. Kan, T. G. Campbell, L. A. Song, L. Chang, A. J. Rivnak, P. P. Patel, G. K. Provuncher, E. P. Ferrell, S. C. Howes, B. A. Pink, K. A. Minnehan, D. H. Wilson and D. C. Duffy, Anal. Chem., 2011, 83, 2279 CrossRef CAS PubMed
.
- R. Akter, M. Rhman and C. Rhee, Anal. Chem., 2012, 84, 6407 CrossRef CAS PubMed
.
- M. He and A. E. Herr, Anal. Chem., 2009, 81, 8177 CrossRef CAS PubMed
.
- E. Han, L. Ding and H. X. Ju, Anal. Chem., 2011, 83, 7006 CrossRef CAS PubMed
.
- B. P. Corgier, F. Li, L. J. Blum and C. A. Marquette, Langmuir, 2007, 23, 8619 CrossRef CAS PubMed
.
- H. Graves, N. Wehner and T. A. Stamey, Clin. Chem., 1992, 38, 735 CAS
.
- J. H. Choi, H. S. Kim, J. W. Choi, J. W. Hong, Y. K. Kim and B. K. Oh, Biosens. Bioelectron., 2013, 49, 415 CrossRef CAS PubMed
.
- Y. Zhu, H. Kuang, L. Xu, W. Ma, C. Peng, Y. Hua, L. Wang and C. Xu, J. Mater. Chem., 2012, 22, 2387 RSC
.
- A. Gole and C. J. Murphy, Langmuir, 2005, 21, 10756 CrossRef CAS PubMed
.
- P. B. Johnson and R. W. Christy, Phys. Rev. B: Solid State, 1972, 6, 4370 CrossRef CAS
.
- K. Kim, S. Kwon, J. H. Park, H. Chung, S. Y. Jeong, I. C. Kwon and I. S. Kim, Biomacromolecules, 2005, 6, 1154 CrossRef CAS PubMed
.
- J. Lee, A. O. Govorov, J. Dulka and N. A. Kotov, Nano Lett., 2004, 4, 2323 CrossRef CAS
.
- K. G. Thomas, S. Barazzouk, B. I. Ipe, S. T. S. Joseph and P. V. Kamat, J. Phys. Chem. B, 2004, 108, 13066 CrossRef CAS
.
- S. Liang, M. Yi, Z. Shen, L. Liu, X. Zhang and S. Ma, RSC Adv., 2014, 4, 16127 RSC
.
- L. Q. Lin, E. Crew, H. Yan, S. Shan, Z. Skeete, D. Mott, T. Krentsel, J. Yin, N. A. Chernova, J. Luo, M. H. Engelhard, C. Wang, Q. B. Li and C. J. Zhong, J. Mater. Chem. B, 2013, 1, 4320 RSC
.
- A. Lee, G. F. S. Andrade, A. Ahmed, M. L. Souza, N. Coombs, E. Tumarkin, K. Liu, R. Gordon, A. G. Brolo and E. Kumacheva, J. Am. Chem. Soc., 2011, 133, 7563 CrossRef CAS PubMed
.
- T. S. Sreeprasad and T. Pradeep, Langmuir, 2011, 27, 3381 CrossRef CAS PubMed
.
- P. K. Jain, S. Eustis and M. A. El-Sayed, J. Phys. Chem. B, 2006, 110, 18243 CrossRef CAS PubMed
.
- A. M. Funston, C. Novo, T. J. Davis and P. Mulvaney, Nano Lett., 2009, 9, 1651 CrossRef CAS PubMed
.
- Y. Wang, Y. F. Li, J. Wang, Y. Sang and C. Z. Huang, Chem. Commun., 2010, 46, 1332 RSC
.
- E. A. Stura, B. H. Muller, M. Bossus, S. Michel, C. Jolivet-Reynaud and F. Ducancel, J. Mol. Biol., 2011, 414, 530 CrossRef CAS PubMed
.
- Y. Y. Zhu, C. L. Qu, H. Kuang, L. G. Xu, L. Q. Liu, Y. F. Hua, L. B. Wang and C. L. Xu, Biosens. Bioelectron., 2011, 26, 4387 CrossRef CAS PubMed
.
- L. Chuang, J. Y. Hwang, H. C. Chang, F. M. Chang and S. B. Jong, Clin. Chim. Acta, 2004, 348, 87 CrossRef CAS PubMed
.
Footnote |
| † Electronic supplementary information (ESI) available. See DOI: 10.1039/c5ra01322d |
| This journal is © The Royal Society of Chemistry 2015 |

