 Open Access Article
Creative Commons Attribution 3.0 Unported Licence
Carbon dots supported upon N-doped TiO2 nanorods applied into sodium and lithium ion batteries†
Yingchang
Yang
a,
Xiaobo
Ji
*a,
Mingjun
Jing
a,
Hongshuai
Hou
a,
Yirong
Zhu
a,
Laibing
Fang
a,
Xuming
Yang
a,
Qiyuan
Chen
a and
Craig E.
Banks
*b
aCollege of Chemistry and Chemical Engineering, Central South University, Changsha 410083, China. E-mail: xji@csu.edu.cn; Fax: +86-731-88879616; Tel: +86-731-88879616
bFaculty of Science and Engineering, School of Science and the Environment, Division of Chemistry and Environmental Science, Manchester Metropolitan University, Chester Street, Manchester M1 5GD, UK. E-mail: c.banks@mmu.ac.uk; Fax: +44(0) 1612476831; Tel: +44(0) 1612471196
First published on 13th February 2015
Abstract
N-doped TiO2 nanorods decorated with carbon dots with enhanced electrical-conductivity and faster charge-transfer have been fabricated utilizing a simple hydrothermal reaction process involving TiO2 powders (P25) and NaOH in the presence of carbon dots followed by ion exchange and calcination treatments. Due to the merits of the carbon dots, doping and nanostructures, the as-designed N–TiO2/C-dots composite utilized as anode materials for lithium-ion batteries can sustain a capacity of 185 mA h g−1 with 91.6% retention even at a high rate of 10 C over 1000 cycles. It is interesting to note that the ratios of capacitive charge capacity during such high rates for the N–TiO2/C-dots composite electrodes are higher than those at low rates, which likely explains the observed excellent rate capabilities. In contrast to lithium-ion batteries, sodium-ion batteries have gained more interest in energy storage grids because of the greater abundance and lower cost of sodium-containing precursors. The as-obtained N–TiO2/C-dots composites reported here and utilized as anode materials for sodium-ion batteries exhibit excellent electrochemical performances, including substantial cycling stabilities (the capacity retention ratios after 300 cycles at 5 C is 93.6%) and remarkable rate capabilities (176 mA h g−1 at 5 C, 131 mA h g−1 at 20 C); such performances are the greatest ever reported to date over other structured TiO2 or TiO2 composite materials.
1. Introduction
Titanium dioxide (TiO2, titania) has been utilized as an electrochemical energy storage material such as in lithium-ion battery (LIB) and sodium-ion battery (SIB) anodes, with multiple polymorphs (amorphous, anatase, bronze and rutile) recently attracting widespread attention in the areas of grid energy storage, electric and hybrid vehicles owning to their high power density, intrinsic safety, low cost, long cycle life and environmental friendliness compared to graphite and other carbon nanomaterials.1–5 Nevertheless, the electrochemical performances of pristine TiO2 are relatively poor due to its poor electrical conductivity (∼10−12 S cm−1) and low ion diffusion coefficients, making it difficult to meet the requirement of high power/energy density devices.6To tailor the properties of TiO2, many strategies have been attempted and reported such as doping with foreign atoms (N, Nb, etc.) and designing nanocomposites of low-dimension TiO2 and carbon materials (amorphous carbon, graphene and carbon nanotubes (CNTs)) have been developed, as the introduction of these foreign atoms and carbon additives have been reported to enhance electron transport while the low-dimension structures shorten ion insertion/extraction pathways.5–10 Among these carbon nanomaterials, amorphous carbon is widely utilized as a coating agent as it can greatly improve the electrical conductivity of the Ti-based composites. For instance, Chen et al. introduced carbon-coated lithium titanium oxides nanocomposite synthesized through a simple solid–state reaction.11 This nanocomposite with the optimized content of the coated carbon showed superior electrode performance due to the balance between the electric conduction and the ionic transport.11 Two-dimensional graphene appears an ideal conductive additive owning to its superior electrical conductivity, high surface area and mechanical robustness,12 but graphene used as conductive additives in composites has been mostly prepared by chemical or thermal reduction of graphite oxide (GO) fabricated from natural graphite powder by modified Hummers' methodologies.13 Such reduced graphene oxides (RGO) inevitably suffer from poor electrical conductivity because of the presence of oxygen functional groups, which slow the heterogeneous electron transfer and restrict the high rate performance of these composite electrodes.14,15 One-dimensional CNTs are also a potentially good conducting substrate.9,16 Yet, pristine CNTs fabricated via chemical vapor deposition are mostly hydrophobic;16 thus it is difficult for TiO2 to directly nucleate and grow on the top surface of pristine CNTs.
Zero-dimensional carbon dots, a new carbon nanomaterial with sizes below 10 nm were first obtained during the purification of single-walled carbon nanotubes through preparative electrophoresis in 2004, have gradually become a rising star in the nanocarbon family because of their benign, abundant and inexpensive nature.17,18 Until recently, much attention has also been paid to their potential applications in bioimaging, sensor, optoelectronics, photocatalysis, supercapacitors, and so on.17,19 Nevertheless, to the best of our knowledge, the application of carbon dots as conductive additives for sodium rechargeable batteries has been never reported before.
In the present work, combining the merits of carbon dots, doping and nanostructures, we design a novel composite comprising N-doped TiO2 nanorod decorated carbon dots (termed: N–TiO2/C-dots). The as-obtained N–TiO2/C-dots composite utilized as an anode material for lithium-ion batteries (LIBs) are found to sustain a capacity of 185 mA h g−1 with 91.6% retention even at a high rate of 10 C over 1000 cycles. In contrast to LIBs, sodium-ion batteries (SIBs) have gained more interest in large-scale systems (such as grid energy storage) due to the greater abundance and lower cost of sodium-containing precursors. The as-designed N–TiO2/C-dots composite utilized as an anode material for SIBs is found to exhibit excellent electrochemical performances, including substantial cycling stabilities with the capacity retention ratios found after 300 cycles at 5 C to be 93.6%) with remarkable rate capabilities of 176 mA h g−1 at 5 C and 131 mA h g−1 at 20 C, which is the highest result ever reported and significantly greater than that reported in structured TiO2 or TiO2 composite materials.
2. Experimental section
2.1 Preparation of C-dots
C-dots were conveniently prepared by electrochemically anodic oxidation of alcohol by a modified method reported by Deng et al.20 1.0 g of NaOH dissolved in mixture solution of 140 mL alcohol and 10 mL water was used as the electrolyte solution. Two Pt sheets (12 mm in length, 10 mm in width) were employed as the anode and the counter electrode, respectively. Static potentials of 20 V were applied to the two electrodes using a DC power supply (LW10J2, Shanghai LiYou Electric Co., Ltd). The current density was ca. 150 mA cm−2. After electrolysis for 24 h, dark brown C-dots contained solution was obtained. Ethanol (150 mL) was added the as-obtained mixture to salt out the NaOH. Subsequently, the supernatant was heated at 80 °C to evaporate the alcohol and water to obtain the reddish-brown solid, which was further dissolved in 100 mL of distilled water. The final product solution was further dialyzed for 24 h to remove residual NaOH, and then it was concentrated to obtain the dry C-dots powders.2.2 Synthesis of N–TiO2/C-dots
In a typical synthesis, 0.8 g TiO2 powders (P25) and 60 mg C-dots were dispersed in 50 mL of a NaOH aqueous solution (10 M) by the application of ultrasound. The suspension was then transferred into a Teflon-lined stainless steel autoclave and kept at 180 °C for 24 h to obtain Na2Ti3O7 nanorods/C-dots composite. After cooling down naturally, the precipitate was collected by filtration, washed thoroughly with deionized water several times and dried at 50 °C for 12 h. The light brown dried powder was ion exchange by 1 M (NH4)2SO4 solution to yield (NH4)2Ti3O7 nanorods/C-dots composite. The reaction product was then rinsed with deionized water to remove the redundant NH4+ and was dried at 50 °C for 12 h. Finally, the product was calcined at 450 °C under Ar for 1.5 h to obtain N–TiO2 nanorods/C-dots composite. For comparison, N–TiO2 was synthesized without using C-dots under the same condition. The phase of the raw materials and the intermediates were shown in Fig. S1 (ESI†).2.3 Materials characterization
Transmission electron microscopy (TEM) and high-resolution transmission electron microscopy (HRTEM) were conducted using a JEM-2100F instrument with an accelerating voltage of 200 kV. Scanning electron microscopy (SEM) and energy dispersive spectrometer (EDS) were carried out using an FEI Quanta 200 scanning electron microscope (20 kV). The Brunauer–Emmett–Teller (BET, BELSORP-MINI II) specific surface area was obtained from the N2 adsorption/desorption isotherm recorded at 77 K and the pore size distribution was evaluated by using the Barrett–Joyner–Halenda (BJH) model. Surface compositions were analyzed with an ESCALab250 X-ray photoelectron spectroscopy (XPS). X-ray diffraction (XRD) patterns were obtained with a Rigaku D/max 2550 VB + 18 kW X-ray diffractometer with Cu Kα radiation (0.1542 nm). Thermogravimetric analysis (TGA) data were collected on a thermal analysis instrument (NETZSCH STA449F3) with a heating rate of 10 °C min−1 from room temperature to 800 °C in air.2.4 Electrochemical measurements vs. Li and Na
Active materials dried at 50 °C for 24 h in a vacuum oven were mixed with the binder carboxymethyl cellulose (CMC) and Super P at weight ratios of 70![[thin space (1/6-em)]](https://www.rsc.org/images/entities/char_2009.gif) :
:![[thin space (1/6-em)]](https://www.rsc.org/images/entities/char_2009.gif) 15
15![[thin space (1/6-em)]](https://www.rsc.org/images/entities/char_2009.gif) :
:![[thin space (1/6-em)]](https://www.rsc.org/images/entities/char_2009.gif) 15 in water solvent to form slurry. Then, the resultant slurry was uniformly pasted on Cu foil with a blade. The average mass of the active material in the prepared electrode sheets is 1.1 mg cm−2. The calculation of specific capacity is based on the total mass of N–TiO2 and C-dots. These prepared electrode sheets were dried at 100 °C in a vacuum oven for 12 h and pressed under a pressure of approximately 20 MPa. CR2016-type coin cells were assembled inside an mBraun glovebox (H2O < 0.5 ppm, O2 < 0.5 ppm) using the metallic lithium or sodium counter/reference electrode and a polypropylene separator (Celgard 2400). The electrolyte solutions for LIBs and SIBs are 1 M LiPF6 in ethylene carbonate and dimethyl carbonate (EC/DMC, 1
15 in water solvent to form slurry. Then, the resultant slurry was uniformly pasted on Cu foil with a blade. The average mass of the active material in the prepared electrode sheets is 1.1 mg cm−2. The calculation of specific capacity is based on the total mass of N–TiO2 and C-dots. These prepared electrode sheets were dried at 100 °C in a vacuum oven for 12 h and pressed under a pressure of approximately 20 MPa. CR2016-type coin cells were assembled inside an mBraun glovebox (H2O < 0.5 ppm, O2 < 0.5 ppm) using the metallic lithium or sodium counter/reference electrode and a polypropylene separator (Celgard 2400). The electrolyte solutions for LIBs and SIBs are 1 M LiPF6 in ethylene carbonate and dimethyl carbonate (EC/DMC, 1![[thin space (1/6-em)]](https://www.rsc.org/images/entities/char_2009.gif) :
:![[thin space (1/6-em)]](https://www.rsc.org/images/entities/char_2009.gif) 1 vol) and 1 M NaClO4 in propylene carbonate (PC), respectively. Galvanostatic charge/discharge cycles were carried out with an Arbin battery cycler (BT2000) between 3.0–1.0 V vs. Li+/Li and 3.0–0.01 V vs. Na+/Na. The electrochemical impedance measurements were performed on Solartron Analytical at an AC voltage of 5 mV amplitude in the frequency range of 105 to 10−2 Hz. Cyclic voltammetry (CV) tests were also conducted on Solartron Analytical.
1 vol) and 1 M NaClO4 in propylene carbonate (PC), respectively. Galvanostatic charge/discharge cycles were carried out with an Arbin battery cycler (BT2000) between 3.0–1.0 V vs. Li+/Li and 3.0–0.01 V vs. Na+/Na. The electrochemical impedance measurements were performed on Solartron Analytical at an AC voltage of 5 mV amplitude in the frequency range of 105 to 10−2 Hz. Cyclic voltammetry (CV) tests were also conducted on Solartron Analytical.
3. Results and discussion
3.1 Material synthesis and characterization
Fig. 1a shows typical transmission electron microscopy (TEM) images of the dark red C-dots prepared by the electrochemical anodic oxidation of alcohol. The average size of the C-dots is ∼3 nm. X-ray diffraction (XRD) shows the C-dots are amorphous (Fig. 1b) in nature. The atomic ratio of elements O in C-dots calculated from X-ray photoelectron spectroscopy (XPS, Fig. 1c and d) correspond to 15.6 at%, which make it feasible to be incorporated into other compounds during deoxygenation in strong alkaline solutions.21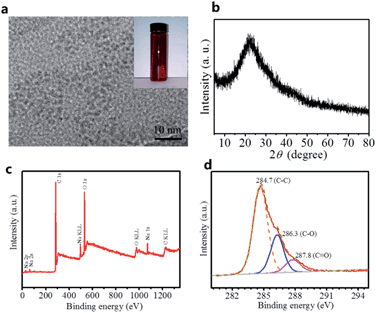 | ||
| Fig. 1 (a) TEM image, (b) XRD pattern, (c) survey scan of XPS and (d) C 1s core level XPS spectra of the C-dots. The inset in (a) is photograph of C-dots. | ||
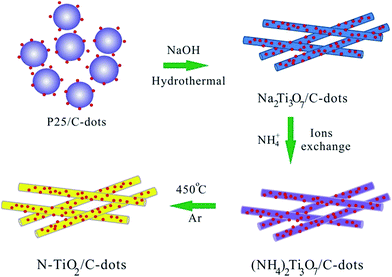
The strategy for the preparation of the N–TiO2/C-dots composite is depicted in Scheme 1. First, Na2Ti3O7 nanorods/C-dots composite were formed during the hydrothermal process in strong alkaline solution, during which the conversion of commercial TiO2 (P25) powder to Na2Ti3O7 nanorods with multi-layered walls and partially reduction of C-dots oxide takes place simultaneously. Subsequently, N-doped TiO2 nanorods/C-dots composite was obtained through an ion exchange process followed by calcination at 450 °C under Ar atmosphere.
The morphology and microstructure of the as-formed products are characterized by TEM and high-resolution TEM (HRTEM). As shown in Fig. 2a, the pure N–TiO2 shows agglomerated rods morphology. It is clear that the rods are tens of nanometers in length. The HRTEM image (Fig. 2b) shows clear crystal planes in the rods corresponding to the (101) plane of anatase or the (110) plane of TiO2(B).21 The nanorods in the N–TiO2/C-dots composite shown in Fig. 2c are much more distinct than those of pure N–TiO2. In addition, amorphous C-dots with a diameter of around 3 nm (marked with dark line) can be clearly observed in the HRTEM image (Fig. 2d), which is sporadically decorated on the surface of N–TiO2. EDS spectra of the products and their chemical compositions are given in Fig. 3a and b. Nitrogen content for N–TiO2/C-dots composite and N–TiO2 bulk materials are about 1.66 and 1.35 at%, respectively. Elemental mapping images of N–TiO2/C-dots shown in Fig. S2† indicate that homogenously doping of N and C-dots in TiO2 was realized.
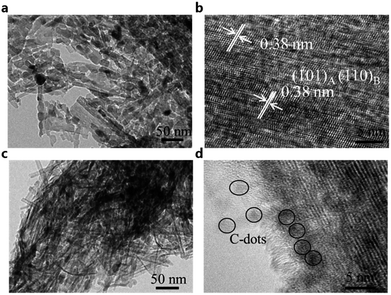 | ||
| Fig. 2 (a and c) TEM images and (b and d) high-resolution TEM images of the (a and b) N–TiO2 and (c and d) N–TiO2/C-dots composite. | ||
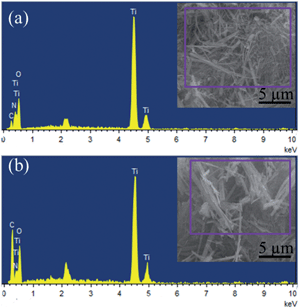 | ||
| Fig. 3 EDS spectra for the (a) N–TiO2 and (b) N–TiO2/C-dots composite. The insets are the corresponding SEM images. | ||
Fig. 4a shows XRD patterns of the black N–TiO2/C-dots composite and pure yellow N–TiO2, which indicates the coexistence of two phases of anatase and TiO2(B). As can be seen, the major diffraction peaks can be indexed to anatase TiO2 (JCPDS 65-5714), while the residual peaks could be indexed to metastable monoclinic TiO2(B) (JCPDS 74-1940).6 However, the diffraction peak associated with the (002) plane at 2θ of 26.4° for graphite in the N–TiO2/C-dots composite is absence, indicating that the content of C-dots in the composite is low and the C-dots itself is amorphous. Thermogravimetric analysis (TGA) curves shown in Fig. 4b demonstrates that the C-dots content in the N–TiO2/C-dots composite is about 4.5 wt%.
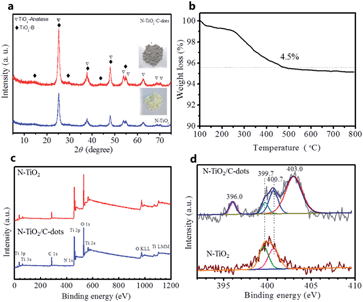 | ||
| Fig. 4 (a) XRD patterns of N–TiO2 and N–TiO2/C-dots composite. (b) TG analysis of N–TiO2/C-dots composite. (c) The survey scan of XPS and (d) N 1s core level XPS spectra of N–TiO2 and N–TiO2/C-dots. | ||
To further gain the N species and contents, XPS was performed to investigate the as-fabricated N–TiO2/C-dots composite and pure N–TiO2. The survey XPS (Fig. 4c) confirms the existence of Ti, O, C and N in these two samples.22,23 The atomic ratios of the element N on the surface of N–TiO2/C-dots composite and pure N–TiO2 were calculated to be 1.70 and 1.26 at%, respectively. In order to obtain detailed information on the chemical state of nitrogen in these samples, deconvolution of the N 1s XPS is displayed in Fig. 4d. The N 1s peaks for pure N–TiO2 can be assigned to interstitial NH2 at interstitial site in TiO2 (399.7 eV) and NH4+ species at layered walls in TiO2 (400.7 eV).23 For N–TiO2/C-dots composite, besides the binding energies at 399.7 eV and 400.7 eV, the binding energies at 396.0 eV and 403.0 eV can be clearly observed. The binding energy at 396.0 eV is corresponding to the substituted atomic N species in the TiO2 lattice (Ti–N).8,23 According to previous work, the role of N species on the electrical conductivity of TiO2 is mainly related to the reducing of the band gap and the substitutional N plays a key role in narrowing the band gap by elevating the valence band maximum, while the interstitial N can only introduce some localized N 2p states in the gap.24 The binding energies at 403.0 eV can be assigned to pyridine-N-oxide in the C-dots, which exist in most of the N-doped carbon materials.25–27 It is reported that this N species observed at the carbon surface can enhance the electric conductivity.25,28 Therefore, through the combination of N-doping and the C-dots decorating, the electric conductivity can be greatly improved.
Fig. 5a and b show the N2 adsorption/desorption isotherms and the pore size distribution of the pure N–TiO2 and N–TiO2/C-dots composite. As can be seen, the two isotherms with distinct hysteresis loops at high pressures can be identified as type-IV.29 The specific surface area of N–TiO2/C-dots composite sample is calculated to be 142.1 m2 g−1, much higher than that of pure N–TiO2 sample (96.8 m2 g−1), this can be ascribed to the existence of C-dots in composite, which can prevent the agglomeration of N–TiO2 nanorods. The pore size distribution (Fig. 5c and d) was obtained from the isotherm adsorption branches based on Barrett–Joyner–Halenda (BJH) model. Both samples exhibit mesopore structure, but the average pore size of N–TiO2 sample (3.8 nm) is much smaller than that of N–TiO2/C-dots composite (11.3 nm), which indicates that the C-dots can tune the microstructure of the N–TiO2 nanorods.
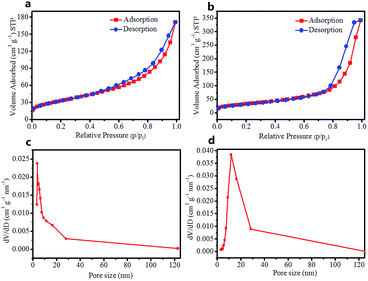 | ||
| Fig. 5 (a and b) The nitrogen adsorption/desorption isotherm and (c and d) the pore size distribution of (a and c) pure N–TiO2 and (b and d) N–TiO2/C-dots composite samples. | ||
3.2 Electrochemical lithium-storage performance
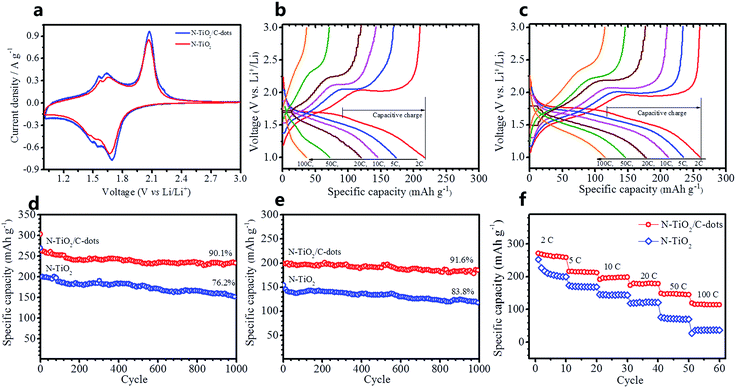
The lithium-storage performance of the as-prepared pure N–TiO2 and N–TiO2/C-dots composite were evaluated using lithium half-cells. Cyclic voltammetry (CV) plots at a scan rate of 0.5 mV s−1 of pure N–TiO2 and N–TiO2/C-dots composite electrodes are shown as Fig. 6a, revealing that the polarization is decreased with C-dots decorating. In both cases, three pairs of peaks were observed that the main pair of peaks at near 1.69/2.06 V can be assigned to Li insertion/extraction into anatase TiO2, and two pairs of peaks at approximately 1.48/1.56 V and 1.54/1.65 V are characteristic for Li insertion/extraction into TiO2–B.6 Moreover, CV curves show a broad feature, which are characteristic of surface/interfacial Li+ storage contributed from the low-dimension N–TiO2 with high surface area.9,30Fig. 6b and c show the galvanostatic charge/discharge curves of the pure N–TiO2 and N–TiO2/C-dots composite electrodes at different rates. The discharge curves for the pure N–TiO2 and N–TiO2/C-dots composite electrodes can be divided into three different voltage regions, including the homogeneous Li+ insertion into the bulk TiO2 (>1.75 V), the diffusion-controlled intercalation of Li+ occurring within the anatase phase (≈1.75 V) and the slope region associated with the surface-confined charge-transfer process in the TiO2(B) phase and the surface/interfacial Li+ intercalation at the surface/interfacial of these nanomaterials (fast double-layer capacitance and pseudo-capacitance, <1.75 V).9,21,30 The rate capabilities of pure N–TiO2 and N–TiO2/C-dots composite electrodes are also shown in Table S1 (ESI†) for comparison. The N–TiO2/C-dots composite electrode can deliver a discharge specific capacity of 260, 235, 208 and 176 mA h g−1 using a charge and discharge rate of 2, 5, 10 and 20 C (1 C = 168 mA g−1), respectively. Even charge/discharge at high rates of 50 and 100 C, the composite can still carry a discharge specific capacity of 145 and 116 mA h g−1. For pure N–TiO2, it can only deliver a discharge specific capacity of 217 mA h g−1 at 2 C, and the capacities drop rapidly to 173, 145, 115, 72 and 36 mA h g−1 at 5, 10, 20, 50 and 100 C, respectively. Additionally, it is found that the ratios of capacitive charge capacity (Table S1, ESI†) during high rates for these samples are higher than those at low rates. These results agree well with the previous works reported by Samuelis and Wang,9,30 which explain the excellent rate capability of the N–TiO2/C-dots composite electrode.
The cycling behavior of N–TiO2/C-dots composite and N–TiO2 at high rates of 2 C and 10 C as shown in Fig. 6d and e, respectively. It is seen that the initial reversible discharge specific capacities of N–TiO2/C-dots at 2 and 10 C (charge and discharge at the same rate) are 262 and 202 mA h g−1, respectively. The retained capacities for 2 and 10 C after 1000 cycles are 236 and 185 mA h g−1, and the retention ratios are 90.1 and 91.6%, respectively. Additionally note that the Coulombic efficiency is 89.3% during the first cycle and maintains a high Coulombic efficiency of more than 99.0% in further cycles (Fig. S3, ESI†). Referring to pure N–TiO2, the initial reversible discharge specific capacity at 2 and 10 C are only 203 and 147 mA h g−1, and retention ratios after 1000 cycles are only 76.2 and 83.8%. Fig. 6f compared the rate performance between the N–TiO2/C-dots composite and N–TiO2. It is clear that the N–TiO2/C-dots exhibit much better rate performances than the pure N–TiO2. At a high rate of 100 C (charge/discharge in 36 s, 16.8 A g−1), a specific capacity of 116 mA h g−1 can be retained for N–TiO2/C-dots composite. In contrast, for pure N–TiO2, the specific capacity decline quickly to 36 mA h g−1 at the same rate. Taking the TiO2 materials reported so far for comparison (Table S2, ESI†), the as-prepared N–TiO2/C-dots composite reported here exhibits high capacity, excellent cycling stability and outstanding rate capability for LIB anodes.
3.3 Electrochemical sodium-storage performance
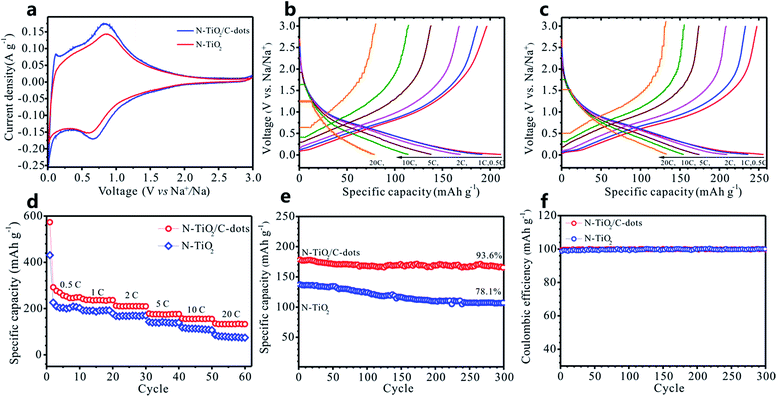
In contrast to LIBs, SIBs have gained more interest in large-scale systems (such as grids energy storage) due to the greater abundance and lower cost of sodium-containing precursors.31,32 Recently, TiO2-based anodes for SIB have attracted significant attention due to its low cost, stable property and high capacity.4,5,33,34 In 2011, amorphous TiO2 nanowire with a maximum capacity of 120 mA h g−1 in Na cell was firstly investigated by Xiong et al.4 A carbon coated anatase TiO2, designed by Kim et al., could deliver charge capacities of 104 mA h g−1 at 3.3 A g−1 (discharge at 10 mA g−1).5 Stimulated by these works, the as-designed N–TiO2/C-dots composite here were also examined as anode for SIBs. The Na-ion insertion–extraction behaviours of N–TiO2/C-dots composite and pure N–TiO2 were investigated by cyclic voltammetry (CV) and galvanostatic charge–discharge cycling. Fig. 7a shows the CV plots at a scan rate of 0.2 mV s−1 for the N–TiO2/C-dots composite and pure N–TiO2 electrodes. Both of those two electrodes show broad peaks in a wide potential range of 0.1–1.5 V, similar to that of anatase TiO2.33 Note that the behaviour of Na+ insertion/extraction in TiO2 is quite different from the behaviour of Li-ion insertion/extraction in the Li cell. Fig. S4 (ESI†) represents the galvanostatic charge–discharge profiles of the first, second and fifth cycles of the N–TiO2/C-dots composite and pure N–TiO2 electrodes at 0.5 C. The Coulombic efficiencies of the first cycle for the N–TiO2/C-dots composite and pure N–TiO2 electrodes are 41.6 and 40.6%, which are two times higher than that of the reported TiO2.5 The shape of the profiles did not change significantly during cycling, indicating good stability of the electrodes used as an anode for SIBs. Fig. 7b and c display the galvanostatic charge/discharge curves of the pure N–TiO2 and N–TiO2/C-dots composite electrodes against Na at different rates. Both of the electrodes show a slope profile of the voltage–capacity relationship during both the charge and discharge state, which are in accordance with the CV curves (Fig. 6a).The rate performance of the N–TiO2/C-dots composite as anode of SIB is given in Fig. 7d, and the result for pure N–TiO2 is also included for comparison. As expected, the N–TiO2/C-dots composite exhibit excellent rate capability compared to that of pure N–TiO2, with the discharge capacities of 258, 176 and 131 mA h g−1 at 0.5, 5 and 20 C, respectively. To evaluate the cyclability of the SIBs, we cycled the N–TiO2/C-dots composite and the pure N–TiO2 against Na at a high rate of 5 C over 300 cycles. As can be seen in Fig. 7e, the capacity of pure N–TiO2 decline quickly to 107 mA h g−1 at 5 C and the retention ratio is only 78.1% after 300 cycles. Thankfully, the obtained capacity for N–TiO2/C-dots composite over 300 cycle can reach to 166 mA h g−1 with 93.6% retention at 5 C. It should be noted that the Coulombic efficiency of this composite during cycling is over 99.3% (Fig. 7f). It is seen from Table S3 (ESI†) that the as-prepared N–TiO2/C-dots composite here exhibits superior cycling stability and excellent rate capability in comparison to other TiO2 materials reported recently for SIB anodes.
3.4 Studying the role of the carbon dots
The electrochemical results above indicate that the electrochemical performances of N–TiO2/C-dots composite for both of the LIB and SIB are far higher than that of pure N–TiO2, which can be ascribed to the decorating of C-dots on the N-doped TiO2 nanorods. Direct measurement of conductivity using pellet samples demonstrates that the electrical conductivity of the N–TiO2/C-dots composite (5.1 × 10⁻⁷ S cm−1) is about ten times higher than that of pure N–TiO2 sample (5.31 × 10⁻⁸ S cm−1). Also, the EIS results (Fig. 8) indicate that the charge transfer resistance of N–TiO2/C-dots composite in LIB is 17 Ω, which is about two times lower than that of N–TiO2 (ca. 30 Ω). In SIBs, the charge transfer resistance of N–TiO2/C-dots composite (ca. 152 Ω) is about three times lower than that of N–TiO2 (ca. 480 Ω). These results clearly indicate that the C-dots improve the electrical conductivity and charge transfer reactions.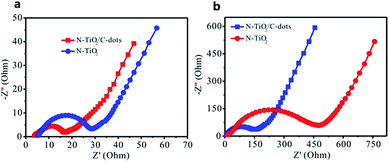 | ||
| Fig. 8 Electrochemical impedance spectroscopy of (a) lithium-ion and (b) sodium-ion batteries employing the N–TiO2/C-dots composite and pure N–TiO2 anodes. | ||
4. Conclusions
In summary, N-doped TiO2 nanorods/carbon dots composite have been fabricated utilizing the hydrothermal reaction of P25 and NaOH in the presence of carbon dots followed by ion exchange and calcinations treatments. The bespoke composite displays enhanced electrical conductivity and charge transfer properties because of the decorating C-dots, N-doping, and nanostructure design. When utilized as an anode material for lithium-ion and sodium-ion batteries, the composite shows excellent cycling stability and exceptional rate capabilities; Tables S2 and S3† benchmark the performance of our composites demonstrating their superior performances in comparison to the literature. When the composites are used as an anode in LIBs can deliver a specific capacity of 185 mA h g−1 with a 91.6% retention even at 10 C (1.68 A g−1) after 1000 cycles (see Tables S2 and S3†); note that current literature examples never go over 100 cycles. The specific capacity is found to be as high as 166 mA h g−1 with 93.6% retention even at 5 C after 300 cycles when cycled against Na.Acknowledgements
We thank the financial support from the National Natural Science Foundation of China (21473258 and 51134007), the Program for the New Century Excellent Talents in University (NCET-11-0513), the Distinguished Young Scientists of Hunan Province (13JJ1004) and the Fundamental Research Funds for the Central Universities of Central South University (2014zzts013).Notes and references
- M. V. Reddy, G. V. Subba Rao and B. V. R. Chowdari, Chem. Rev., 2013, 113, 5364–5457 CrossRef CAS PubMed
.
- Z. Chen, I. Belharouak, Y. K. Sun and K. Amine, Adv. Funct. Mater., 2013, 23, 959–969 CrossRef CAS
.
- G.-N. Zhu, Y.-G. Wang and Y.-Y. Xia, Energy Environ. Sci., 2012, 5, 6652–6667 CAS
.
- H. Xiong, M. D. Slater, M. Balasubramanian, C. S. Johnson and T. Rajh, J. Phys. Chem. Lett., 2011, 2, 2560–2565 CrossRef CAS
.
- K.-T. Kim, G. Ali, K. Y. Chung, C. S. Yoon, H. Yashiro, Y.-K. Sun, J. Lu, K. Amine and S.-T. Myung, Nano Lett., 2014, 14, 416–422 CrossRef CAS PubMed
.
- C. Chen, X. Hu, Y. Jiang, Z. Yang, P. Hu and Y. Huang, Chem.–Eur. J., 2014, 20, 1383–1388 CrossRef CAS PubMed
.
- Y. Wang, B. M. Smarsly and I. Djerdj, Chem. Mater., 2010, 22, 6624–6631 CrossRef CAS
.
- Y. Zhang, F. Du, X. Yan, Y. Jin, K. Zhu, X. Wang, H. Li, G. Chen, C. Wang and Y. Wei, ACS Appl. Mater. Interfaces, 2014, 6, 4458–4465 CAS
.
- Z. Chen, Y. Yuan, H. Zhou, X. Wang, Z. Gan, F. Wang and Y. Lu, Adv. Mater., 2014, 26, 339–345 CrossRef CAS PubMed
.
- X. Xin, X. Zhou, J. Wu, X. Yao and Z. Liu, ACS Nano, 2012, 6, 11035–11043 CrossRef CAS PubMed
.
- Z. Zhu, F. Cheng and J. Chen, J. Mater. Chem. A, 2013, 1, 9484–9490 CAS
.
- D. A. C. Brownson, D. K. Kampouris and C. E. Banks, Chem. Soc. Rev., 2012, 41, 6944–6976 RSC
.
- M. J. Allen, V. C. Tung and R. B. Kaner, Chem. Rev., 2009, 110, 132–145 CrossRef PubMed
.
- W. Deng, X. Ji, M. Gomez-Mingot, F. Lu, Q. Chen and C. E. Banks, Chem. Commun., 2012, 48, 2770–2772 RSC
.
- W. Song, X. Ji, W. Deng, Q. Chen, C. Shen and C. E. Banks, Phys. Chem. Chem. Phys., 2013, 15, 4799–4803 RSC
.
- B. Wang, H. Xin, X. Li, J. Cheng, G. Yang and F. Nie, Sci. Rep., 2014, 4, 3729 Search PubMed
.
- H. Li, Z. Kang, Y. Liu and S.-T. Lee, J. Mater. Chem., 2012, 22, 24230–24253 RSC
.
- X. Xu, R. Ray, Y. Gu, H. J. Ploehn, L. Gearheart, K. Raker and W. A. Scrivens, J. Am. Chem. Soc., 2004, 126, 12736–12737 CrossRef CAS PubMed
.
- W.-W. Liu, Y.-Q. Feng, X.-B. Yan, J.-T. Chen and Q.-J. Xue, Adv. Funct. Mater., 2013, 23, 4111–4122 CrossRef CAS
.
- J. Deng, Q. Lu, N. Mi, H. Li, M. Liu, M. Xu, L. Tan, Q. Xie, Y. Zhang and S. Yao, Chem.–Eur. J., 2014, 20, 4993–4999 CrossRef CAS PubMed
.
- J. Wang, Y. Zhou and Z. Shao, Electrochim. Acta, 2013, 97, 386–392 CrossRef CAS PubMed
.
- X. Jiang, X. Yang, Y. Zhu, H. Jiang, Y. Yao, P. Zhao and C. Li, J. Mater. Chem. A, 2014, 2, 11124–11133 CAS
.
- J.-C. Chang, W.-J. Tsai, T.-C. Chiu, C.-W. Liu, J.-H. Chao and C.-H. Lin, J. Mater. Chem., 2011, 21, 4605–4614 RSC
.
- W. Jiao, N. Li, L. Wang, L. Wen, F. Li, G. Liu and H.-M. Cheng, Chem. Commun., 2013, 49, 3461–3463 RSC
.
- A. Laheäär, S. Delpeux-Ouldriane, E. Lust and F. Béguin, J. Electrochem. Soc., 2014, 161, A568–A575 CrossRef PubMed
.
- T. Susi, J. Kotakoski, R. Arenal, S. Kurasch, H. Jiang, V. Skakalova, O. Stephan, A. V. Krasheninnikov, E. I. Kauppinen, U. Kaiser and J. C. Meyer, ACS Nano, 2012, 6, 8837–8846 CrossRef CAS PubMed
.
- W. He, C. Jiang, J. Wang and L. Lu, Angew. Chem., Int. Ed., 2014, 53, 9503–9507 CrossRef CAS PubMed
.
- L. Qie, W.-M. Chen, Z.-H. Wang, Q.-G. Shao, X. Li, L.-X. Yuan, X.-L. Hu, W.-X. Zhang and Y.-H. Huang, Adv. Mater., 2012, 24, 2047–2050 CrossRef PubMed
.
- Y. Wang, H. Rong, B. Li, L. Xing, X. Li and W. Li, J. Power Sources, 2014, 246, 213–218 CrossRef CAS PubMed
.
- J.-Y. Shin, D. Samuelis and J. Maier, Adv. Funct. Mater., 2011, 21, 3464–3472 CrossRef CAS
.
- S. Y. Hong, Y. Kim, Y. Park, A. Choi, N.-S. Choi and K. T. Lee, Energy Environ. Sci., 2013, 6, 2067–2081 CAS
.
- M. D. Slater, D. Kim, E. Lee and C. S. Johnson, Adv. Funct. Mater., 2013, 23, 947–958 CrossRef CAS
.
- Y. Xu, E. Memarzadeh Lotfabad, H. Wang, B. Farbod, Z. Xu, A. Kohandehghan and D. Mitlin, Chem. Commun., 2013, 49, 8973–8975 RSC
.
- Z. Yan, L. Liu, J. Tan, Q. Zhou, Z. Huang, D. Xia, H. Shu, X. Yang and X. Wang, J. Power Sources, 2014, 269, 37–45 CrossRef CAS PubMed
.
Footnote |
| † Electronic supplementary information (ESI) available: Coulombic efficiency of lithium-ion batteries, elemental distribution, galvanostatic charge–discharge profiles of sodium-ion batteries, XRD patterns of the raw materials and the intermediate compounds, and capacitive capacity of lithium-ion batteries. See DOI: 10.1039/c4ta05611f |
| This journal is © The Royal Society of Chemistry 2015 |

