 Open Access Article
Creative Commons Attribution 3.0 Unported Licence
Incident fluence dependent morphologies, photoluminescence and optical oxygen sensing properties of ZnO nanorods grown by pulsed laser deposition†
Xiao
Liu
a,
Ye
Sun
*a,
Miao
Yu
*b,
Yongqi
Yin
a,
Bin
Yang
a,
Wenwu
Cao
ac and
Michael N. R.
Ashfold
*d
aCondensed Matter Science and Technology Institute, School of Science, Harbin Institute of Technology, Harbin 150080, China. E-mail: sunye@hit.edu.cn
bState Key Laboratory of Urban Water Resource and Environment, School of Chemical Engineering and Technology, Harbin Institute of Technology, Harbin 150001, China. E-mail: miaoyu_che@hit.edu.cn
cMaterials Research Institute, The Pennsylvania State University, University Park, Pennsylvania 16802, USA
dSchool of Chemistry, University of Bristol, Bristol BS8 1TS, UK. E-mail: mike.ashfold@bristol.ac.uk
First published on 27th January 2015
Abstract
ZnO nanorod (NR) samples have been prepared by 248 nm pulsed laser deposition using three different fluences, F, at the target surface. F is shown to influence the sample morphology and its photoluminescence (PL) properties. Use of large F (∼4.0 J cm−2) results in ZnO NRs with relatively low surface area to volume (S/V) ratio, the PL spectra of which are characterized by a weak near-UV component (IUV) and a relatively intense visible (Ivis) emission feature attributable to the presence of zinc rich and oxygen deficient defects. Use of small F (∼1.2 J cm−2) yields ZnO NRs with larger S/V ratio, and a much increased IUV/Ivis emission ratio. The O2 sensing properties of these NR samples have been investigated by monitoring IUV as a function of O2 partial pressure, over a range of working temperatures (room temperature to 240 °C). All of the NR samples are shown to function as optical O2 sensors, the responses of which are enhanced by operating at elevated temperatures, but the detailed sensitivity (and its temperature dependence) are shown to be strongly dependent on their (F-determined) S/V ratio and defect density.
1 Introduction
Zinc oxide (ZnO) nanorods (NRs) have been widely proposed for gas sensing applications (e.g. for oxygen, formaldehyde, nitrogen dioxide, ethanol, etc.1–5) on account of their excellent sensing performance, their large surface area to volume (S/V) ratios and the realisation that it is feasible to modify the NR morphology and surface properties. Thus far, ZnO NRs have mostly been explored as electrical sensors,6–10 though a few groups have reported their application as optical sensors utilizing the photoluminescence (PL) properties of ZnO.11–15 PL-based optical sensors can offer a number of notable attributes, including high sensitivity to the adsorption/desorption of a range of gases, simple device fabrication, applicability in the presence of electromagnetic radiation, capability of remote operation and, in particular, the fact that no electrical contact to the ZnO sample is required. Thus, even unsupported ZnO NRs grown on insulating substrates can be directly applied in gas sensing.The PL of ZnO is sensitively dependent upon temperature. At room temperature (RT), the PL spectrum displays a narrow, near-band-gap (exciton-related) emission centred in the near-ultraviolet (UV) region and a broad visible band emission attributable to a range of defects and impurities.16–19 Both emissions are sensitive to the surface condition of ZnO, and can provide explicit indications of variations in the surrounding gaseous environment. Operation at elevated temperatures (i.e. above RT) is a recognised route to achieving a larger sensing response in electrical ZnO sensors.7–10,20–23 Similar improvements in gas sensing performance can be anticipated for optical ZnO sensors, but this has not been demonstrated hitherto. The large exciton binding energy of ZnO (60 meV at RT) ensures UV emission even at 400 °C, though the near-UV and, particularly, the visible emission intensities are reduced at elevated temperatures,24,25 which could limit opportunities for optimising optical-based gas sensing by adjusting the working temperature. To date, most work on PL-based gas sensing using ZnO nanomaterials has focused on the intensity of the visible emission (Ivis) or the near-UV emission (IUV) at RT,11–15 though a study from Barranco's group is a notable exception.26 These authors used porous polycrystalline ZnO thin films and sensed the oxygen partial pressure in the environment by monitoring IUV at 25 °C and 80 °C, seemingly finding a larger sensing response at the higher working temperature. However, we are unaware of any systematic examination of the temperature-dependent, IUV PL-based gas sensing properties of high quality ZnO nanostructures.
Many groups have succeeded in producing high-quality ZnO NRs by pulsed laser deposition (PLD).27–30 Such studies have shown that the NR morphologies and optical properties can be controlled by tuning growth parameters like substrate temperature (Tsub), oxygen partial pressure and growth duration.31–33 Our previous PLD studies using a 193 nm excimer laser also showed that the laser fluence (F) incident on the target surface can be an important parameter when growing ZnO NRs, due to the bombardment effect of high-energy species in the ablation plume.34 The F-dependence of the plume may also influence the number and nature of defects in (and thus the PL properties of) the as-grown NRs but, again, we are not aware of any previous reports addressing this topic.
In the present work, three types of ZnO NR – each with distinct morphologies and PL properties – have been formed by PLD using 248 nm laser radiation and three different incident fluences. The IUV PL-based oxygen sensing properties of each family of NR have been investigated systematically over the temperature range RT ≤ TNR ≤ 240 °C, and the effects of F and the underlying mechanisms are discussed accordingly.
2 Experimental
ZnO NRs were produced on Si(100) substrates by PLD. The output of a KrF excimer laser (Lambda-Physik COMPex 205, λ = 248 nm, pulse duration 25 ns, repetition rate 8 Hz, energy 16 mJ per pulse) was focused onto a rotating ZnO ceramic target (99.99%) mounted in an evacuable PLD chamber. The target–substrate separation was fixed at 37 mm. The sample deposition involved two steps: (1) a thin seed layer was deposited at Tsub = 450 °C in a low background pressure of oxygen (5 Pa) for 10 min; (2) NRs were then grown at Tsub = 700 °C in a background pressure of argon (70 Pa) for 90 min. The illuminated area on the target surface was varied by adjusting the position of the focusing lens: spot sizes of ∼0.4 mm2, ∼0.9 mm2 and ∼1.3 mm2 (which translate into incident fluences, F ∼ 4.0 J cm−2, ∼1.8 J cm−2 and ∼1.2 J cm−2) were used for growing the three ZnO NR types, which we henceforth denote as type A (TA), B (TB) and C (TC) samples. Depositions at still lower F (∼1 J cm−2) yielded only a low density of nanoparticles. The morphology and crystallinity of the as-grown TA, TB and TC NRs were characterized by field emission scanning electron microscopy (FESEM, FEI Quanta 200F), high-resolution transmission electron microscopy (HRTEM, FEI, Tecnai-G2-F30) and X-ray diffraction (XRD, PANalytical, X'Pert Pro, with Cu Kα radiation). The samples were mounted in a specially designed vacuum mini-chamber (volume: 1.6 L) mounted within a spectro-fluorometer (HORIBA, Fluoromax-4, 325 nm excitation) for PL and optical gas sensing measurements. The mini-chamber was equipped with a temperature-controlled heating system and two quartz windows, and connected to a gas flow control system i.e. a gas mixing chamber with two mass flow controllers (maximum flow 10 standard litres per minute (SLM) N2 equivalent) and a rotary pump (providing an (air) pumping speed of 4 L s−1). This system allowed strict control of the sample temperature, TNR, and gas composition within the chamber – separately or simultaneously. The PL properties of the respective NR samples were measured over the temperature range RT ≤ TNR ≤ 240 °C, at a pressure of 1 bar. Using the spectro-fluorometer in ‘kinetics’ mode allowed the emission intensity at any particular wavelength to be monitored with 1 s time resolution – thereby enabling dynamic investigation of the PL-based gas sensing properties of the various ZnO samples. In the optical gas sensing measurements that follow, we focus on the maximum absolute count rates in the UV and visible regions of the PL spectrum (which we identify as IUV(max) and Ivis(max)).3 Results and discussion
Use of F ∼ 4.0 J cm−2, ∼1.8 J cm−2 and ∼1.2 J cm−2 results in three distinct types of ZnO NR sample, as revealed by the top and cross-sectional view SEM images shown in Fig. 1a–f. The TA sample grown with F ∼ 4.0 J cm−2 comprises a densely-packed array of NRs with average length![[small script l]](https://www.rsc.org/images/entities/i_char_e146.gif) ∼ 500 nm and diameter d ∼ 170 nm (Fig. 1a and b). Use of F ∼ 1.8 J cm−2 yields a lower density array of poorly aligned NRs with
∼ 500 nm and diameter d ∼ 170 nm (Fig. 1a and b). Use of F ∼ 1.8 J cm−2 yields a lower density array of poorly aligned NRs with ![[small script l]](https://www.rsc.org/images/entities/i_char_e146.gif) ∼ 900 nm and d ∼ 160 nm (TB sample, Fig. 1c and d). The vertical alignment of the NRs improves upon decreasing F further, to ∼1.2 J cm−2; as Fig. 1e and f shows, the TC NR sample is characterised by
∼ 900 nm and d ∼ 160 nm (TB sample, Fig. 1c and d). The vertical alignment of the NRs improves upon decreasing F further, to ∼1.2 J cm−2; as Fig. 1e and f shows, the TC NR sample is characterised by ![[small script l]](https://www.rsc.org/images/entities/i_char_e146.gif) ∼ 600 nm and d ∼ 85 nm. Histograms showing the distributions of TA, TB and TC NR diameters are included as (ESI, Fig. S1†). The XRD data shown in Fig. S2† serves to confirm the relative alignments of the NRs; only the ZnO (002) peak is evident in the spectra of the TA and TC samples, whereas the (100) and (101) peaks are also clearly evident in the XRD spectrum of the TB sample. TEM and HRTEM images of a TC NR with d = 80 nm are presented in Fig. 1g and h. The measured lattice spacing of 0.52 nm (characteristic of wurtzite ZnO(001)) confirms that the NRs grow along the c-axis direction.
∼ 600 nm and d ∼ 85 nm. Histograms showing the distributions of TA, TB and TC NR diameters are included as (ESI, Fig. S1†). The XRD data shown in Fig. S2† serves to confirm the relative alignments of the NRs; only the ZnO (002) peak is evident in the spectra of the TA and TC samples, whereas the (100) and (101) peaks are also clearly evident in the XRD spectrum of the TB sample. TEM and HRTEM images of a TC NR with d = 80 nm are presented in Fig. 1g and h. The measured lattice spacing of 0.52 nm (characteristic of wurtzite ZnO(001)) confirms that the NRs grow along the c-axis direction.
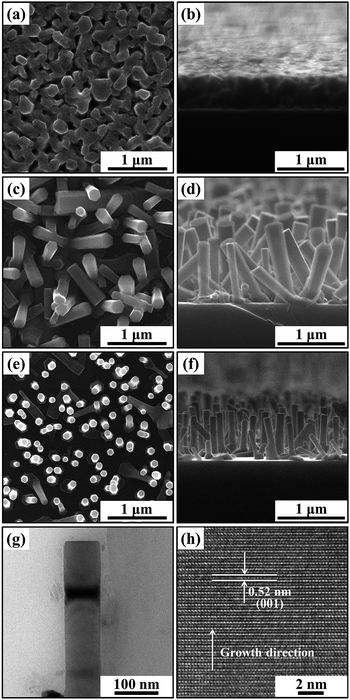 | ||
| Fig. 1 Top view and cross-sectional view SEM images of TA (a and b), TB (c and d) and TC (e and f) NR samples. Panels (g and h) show TEM and HRTEM images of a TC nanorod. | ||
All of these data point to the important influence of F in the growth and morphology of ZnO NRs grown by PLD at 248 nm, consistent with prior illustrations of F-dependent effects when using a laser wavelength of 193 nm.34 The earlier study suggested that F determines not only the quantity but also the composition and the energy distribution of material in the plume formed in the ablation event. Plumes formed at higher F contain a larger flux of high energy species (e.g. Zn2+ and Zn+ ions) which bombard the pre-formed ZnO sample, modifying its morphology and influencing growth: as a result, thicker (thinner) NRs are obtained when using higher (lower) F.34
The PL properties of ZnO NRs are intimately related to their crystal quality, defects, and morphology.17,35–38Fig. 2 presents PL spectra obtained following 325 nm illumination of equal areas of TA, TB and TC samples measured at RT in air. All three spectra show a narrow near-band-gap UV emission centred at ∼380 nm and a broad visible band emission attributable to the presence of defects and interstitials,16,17 but the IUV to Ivis emission ratios are very different. The TA sample grown at highest F presents the weakest IUV but the strongest Ivis. Green and blue emissions centred at ∼530 nm and ∼450 nm can be identified in the latter; these are normally attributed to defects associated with oxygen vacancies and zinc interstitials, respectively.16,17,39,40 The TB sample (grown at lower F) shows much enhanced IUV and reduced Ivis, while the TC sample (grown at the lowest F) shows a further large increase in IUV, a modest increase in Ivis and much the largest IUV/Ivis ratio. These trends all imply that lower F favours growth of ZnO NRs with higher crystal quality, which is logical in light of the foregoing discussion. In the case of the TA sample, the large F-induced bombardment effect and the significant difference in the mass of Zn and O atoms results in many oxygen-deficient-related defects – consistent with the comparatively weak IUV and strong Ivis emissions. As many as four different factors may contribute to the differences in the PL spectra of the TB and TC samples: (a) the lower F used to grow the TC sample should favour better crystal quality; (b) the smaller average diameter of the TC sample (d ∼ 85 nm vs. ∼160 nm) may introduce a relatively greater proportion of surface defects; (c) the penetration depth (i.e. the distance over which the incident 325 nm light intensity drops by a factor of 1/e) in ZnO is ∼60 nm;41 and (d) the NR diameter dependent re-absorption of the UV emission at 380 nm.42 Factors (a), (c) and (d) account for the much enhanced IUV and the improved IUV/Ivis ratio exhibited by the TC sample, while factor (b) may well account for the slight increase in Ivis from the TC sample (cf. the TB sample). We also note that the ‘blue’ emission apparent from the TA sample is absent in the PL spectra of the TB and TC samples, reinforcing the view that F has a major influence on the number and nature of defects (and the PL properties) of ZnO samples grown by PLD.
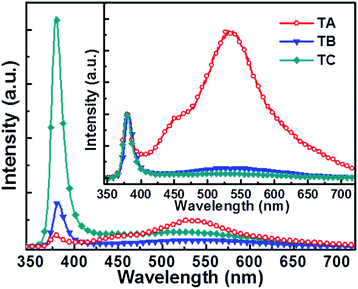 | ||
| Fig. 2 PL spectra of ZnO nanorods grown with F ∼ 4.0 J cm−2 (TA sample), ∼1.8 J cm−2 (TB sample) and ∼1.2 J cm−2 (TC sample). The inset shows the same PL spectra normalized to the same peak IUV. | ||
To explore the temperature dependent gas sensing properties of ZnO NRs we first studied the PL of the TA, TB and TC NRs in pure nitrogen (N2) across the range RT ≤ TNR ≤ 240 °C. As Fig. 3 shows, the near-UV emission from all three samples broadens, declines in intensity and shows an obvious red shift with increasing TNR – consistent with previous findings.24,25,43 These trends in IUV from ZnO NRs within this range have been successfully explained in terms of free exciton emission and an increased role for electron–phonon coupling with increasing temperature.44,45 As Fig. 3a shows, raising TNR to 150 °C reduces Ivis(max) from the TA sample to just 4.7% of its RT value, whereas IUV(max) only shows a ∼2-fold reduction. TB and TC samples show qualitatively similar TNR-dependent trends in emission behaviour, and similar behaviour has been reported previously.25 Thus we conclude that the near-UV emission is a better choice (cf. the visible emission) for studies of the optical gas sensing properties of ZnO NRs at elevated temperatures.
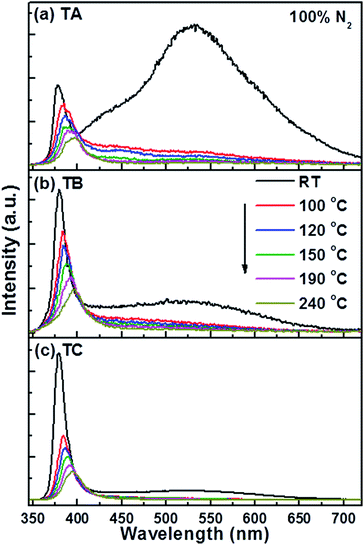 | ||
| Fig. 3 PL spectra of (a) TA, (b) TB and (c) TC NR samples in 100% N2 at various different temperatures in the range RT ≤ TNR ≤ 240 °C. | ||
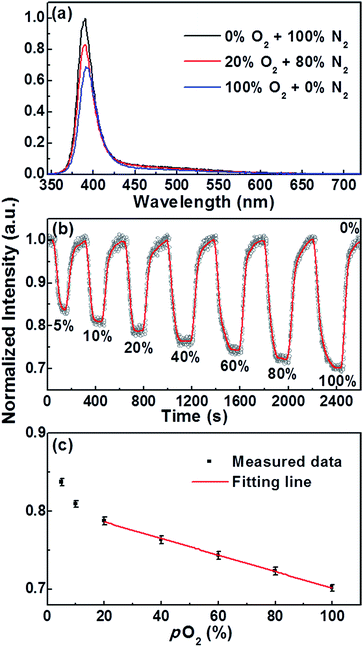
The oxygen sensing properties of all three types of NR sample were examined by monitoring IUV at temperatures across the range RT < TNR < 240 °C. Fig. 3, S3 and S4† confirm that the PL profile measured from a given NR sample at any particular TNR is rather insensitive to replacing N2 with O2. The PL intensities are much more sensitive to this substitution, however. Fig. 4a presents PL spectra from the TC NR sample measured at TNR = 150 °C and 1 bar pressure in 100% N2, in a 20% O2/80% N2 mixture and in 100% O2. IUV clearly declines with increasing O2 partial pressure (pO2), in a repeatable manner (see Fig. S5†). Fig. 4b illustrates the dynamic IUV(max) response of a TC NR sample to various pO2, revealing a linear IUV(max)–pO2 relationship across the range 20 ≤ pO2 ≤ 100%, as shown in Fig. 4c. The measured response and recovery times are of the order of 1 min. and, within the TNR range of current interest, decrease with increasing TNR (see Fig. S6†). These results clearly demonstrate that the IUV component within the PL of such ZnO NRs can be used for oxygen gas sensing at elevated temperatures.
T NR-dependent responses, R, (defined as R = (I0 − I100)/I0, where I0 and I100 are the IUV(max) values measured at pO2 = 0% and 100%, respectively) of TA, TB and TC NR samples are shown in Fig. 5. For all three sample types, R increases linearly up to TNR ∼ 150 °C, then starts to plateau (in the case of the TA sample) or to turnover (TB and TC samples). Within the linear range, the TC NR sample consistently gives the largest response, increasing from R ∼ 7.4% at RT to R ∼ 30.7% at TNR = 150 °C.
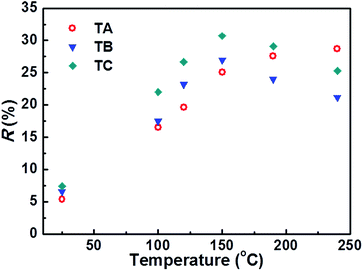 | ||
| Fig. 5 Working temperature (TNR) dependent IUV(max) responses of the TA, TB and TC NR samples in a 100% O2 atmosphere. | ||
To account for the different TNR-dependent responses shown in Fig. 5 we need to understand the mechanisms for gas sensing via the IUV component within the PL spectrum of ZnO. Whereas the Ivis component is associated with both bulk- and surface-related defects, the near-UV emission (at the temperatures of current interest) is considered to derive from free excitons44,45 in the inner part of the NR, beneath the electron-depletion layer.46,47 The adsorption/desorption of different gas species on the ZnO surface can trap or release electrons, thereby expanding or reducing the depletion layer and influencing IUV. Three factors that are likely to influence the TNR-response of the various NR types are proposed:
(i) The S/V ratio. Given the measured average diameters and lengths of the three types of NR, and the high packing density of the TA NRs, we conclude that the TC NR samples present the largest (and the TA NR samples the lowest) S/V ratio;
(ii) The native surface defects. Material deposited at higher F (i.e. the TA NR sample) contains a higher defect density (e.g. oxygen vacancies, recall Fig. 2a), which may be beneficial for the dissociative adsorption of oxygen;5
(iii) The competition between environmental O2 and pre-adsorbed species. The O2 adsorption probability can be sensitive to pre-adsorbed species, e.g. water molecules,48 the desorption of which could provide free sites for O2 adsorption. Previous studies report loss of physisorbed and chemisorbed water molecules from ZnO surfaces at temperatures ∼100 °C and ∼220–270 °C, respectively.49TNR can thus be expected to play an important role in the competition between O2 and pre-adsorbed species.
Overall, therefore, it is tempting to attribute the maximum in the O2 sensing response shown by TC NRs at TNR ∼ 150 °C to a combination of high S/V ratio and the desorption of physisorbed water molecules. As Fig. 5 shows, the TA NRs show a subtly different O2 sensing response, peaking at higher TNR (≥250 °C). These NRs have a much higher (oxygen-deficient) defect density and it is plausible that this response reflects a combination of desorption of pre-adsorbed surface species (e.g. water molecules), as before, and progressive O2-induced compensation of these defects with increasing TNR.
4 Conclusions
Three distinct types of ZnO NR sample have been produced by 248 nm PLD at different incident fluences, F. The TC NR samples grown at lowest F (∼1.2 J cm−2) are well aligned and have high S/V ratio. These thin NRs (d ∼ 85 nm) are of high crystal quality (as evidenced by HRTEM) and give a PL spectrum with high IUV/Ivis ratio. Conversely, TA NR samples grown at the highest F (∼4.0 J cm−2) have relatively small S/V ratio. The associated PL spectra show a relative weak IUV band but strong Ivis – indicating a much higher (oxygen-deficient) defect density. The O2 sensing properties of the three types of NR sample have been explored by monitoring IUV at several different temperatures in the range RT ≤ TNR ≤ 240 °C. All three samples offer an O2 sensing capability, the sensitivity of which is increased by working at elevated temperature. The TC sample is found to exhibit the maximum O2 sensing response, at TNR ∼ 150 °C – a result attributed to (i) the high S/V ratio, and the progressive desorption of competing pre-adsorbed species (e.g. physisorbed water molecules) with increasing TNR. The present study provides deeper insights into both the growth (by PLD) and gas sensing properties of ZnO NRs, and could be extended to encompass PLD growth of other types of material, and to further investigation of the ability of ZnO NRs to sense other gases.Acknowledgements
Financial support for this work was provided by the National Natural Science Foundation of China (Grant no. 11104046), by the National Basic Research Program of China (973 Program) (Grant no. 2013CB632900), and by the Fundamental Research Funds for the Central University (Grant nos HIT.BRETIII.201216, HIT.BRETIII.201225 and HIT.BRETIV.201313). M.Y. thanks the Young Thousand Plan for financial support.Notes and references
- S. M. Niu, Y. F. Hu, X. N. Wen, Y. S. Zhou, F. Zhang, L. Lin, S. H. Wang and Z. L. Wang, Adv. Mater., 2013, 25, 3701–3706 CrossRef CAS PubMed
.
- S. M. Wang, Z. F. Li, P. Wang, C. H. Xiao, R. Zhao, B. X. Xiao, T. Y. Yang and M. Z. Zhang, CrystEngComm, 2013, 16, 5716–5723 RSC
.
- C. W. Na, H. S. Woo, I. D. Kim and J. H. Lee, Chem. Commun., 2011, 47, 5148–5150 RSC
.
- C. P. Gu, S. S. Li, J. R. Huang, C. C. Shi and J. H. Liu, Sens. Actuators, B, 2013, 177, 453–459 CrossRef CAS PubMed
.
- M. J. S. Spencer, Prog. Mater. Sci., 2012, 57, 437–486 CrossRef CAS PubMed
.
- O. Lupan, V. V. Ursaki, G. Chai, L. Chow, G. A. Emelchenko, I. M. Tiginyanu, A. N. Gruzintsev and A. N. Redkin, Sens. Actuators, B, 2010, 144, 56–66 CrossRef CAS PubMed
.
- N. Qin, Q. Xiang, H. B. Zhao, J. C. Zhang and J. Q. Xu, CrystEngComm, 2014, 16, 7062–7073 RSC
.
- S. Q. Tian, F. Yang, D. W. Zeng and C. S. Xie, J. Phys. Chem. C, 2012, 116, 10586–10591 CAS
.
- H. N. Hieu, N. M. Vuong, H. Jung, D. M. Jang, D. Kim, H. Kim and S.-K. Hong, J. Mater. Chem., 2012, 22, 1127–1134 RSC
.
- D. Zappa, E. Comini and G. Sberveglieri, Nanotechnology, 2013, 24, 444008 CrossRef CAS PubMed
.
- C. Baratto, S. Todros, G. Faglia, E. Comini, G. Sberveglieri, S. Lettieri, L. Santamaria and P. Maddalena, Sens. Actuators, B, 2009, 140, 461–466 CrossRef CAS PubMed
.
- D. Valerini, A. Cretì, A. P. Caricato, M. Lomascolo, R. Rella and M. Martino, Sens. Actuators, B, 2010, 145, 167–173 CrossRef CAS PubMed
.
- A. Cretì, D. Valerini, A. Taurino, F. Quaranta, M. Lomascolo and R. Rella, J. Appl. Phys., 2012, 111, 073520 CrossRef PubMed
.
- R. Aad, V. Simic, L. L. Cunff, L. Rocha, V. Sallet, C. Sartel, A. Lusson, C. Couteau and G. Lerondel, Nanoscale, 2013, 5, 9176–9180 RSC
.
- D. Padilla-Rueda, J. M. Vadillo and J. J. Laserna, Appl. Surf. Sci., 2012, 259, 806–810 CrossRef CAS PubMed
.
- B. X. Lin, Z. X. Fu and Y. B. Jia, Appl. Phys. Lett., 2001, 79, 943–945 CrossRef CAS PubMed
.
- A. B. Djurišić and Y. H. Leung, Small, 2006, 2, 944–961 CrossRef PubMed
.
- T. M. Børseth, B. G. Svensson, A. Y. Kuznetsov, P. Klason, Q. X. Zhao and M. Willander, Appl. Phys. Lett., 2006, 89, 262112 CrossRef PubMed
.
- Y. Yin, Y. Sun, M. Yu, X. Liu, B. Yang, D. Liu, S. Liu, W. Cao and M. N. R. Ashfold, RSC Adv., 2014, 4, 44452–44456 RSC
.
- M. Amin, N.
M. Shah, A. S. Bhatti and M. A. Malik, CrystEngComm, 2014, 16, 6080–6088 RSC
.
- H. S. Woo, C. H. Kwak, I. D. Kim and J. H. Lee, J. Mater. Chem. A, 2014, 2, 6412–6418 CAS
.
- M. R. Alenezi, S. J. Henley, N. G. Emerson and S. R. P. Silva, Nanoscale, 2014, 6, 235–247 RSC
.
- W. Wen, J. M. Wu and Y. D. Wang, Appl. Phys. Lett., 2012, 100, 262111 CrossRef PubMed
.
- M. Omari, A. Gupta and N. Kouklin, J. Appl. Phys., 2010, 108, 024315 CrossRef PubMed
.
- A. Gupta, M. Omari and N. Kouklin, Phys. Status Solidi C, 2009, 6, 607–609 CrossRef CAS
.
- J. R. Sanchez-Valencia, M. Alcaire, P. Romero-Gómez, M. Macias-Montero, F. J. Aparicio, A. Borras, A. R. Gonzalez-Elipe and A. Barranco, J. Phys. Chem. C, 2014, 118, 9852–9859 CAS
.
- G. M. Fuge, T. M. S. Holmes and M. N. R. Ashfold, Chem. Phys. Lett., 2009, 479, 125–127 CrossRef CAS PubMed
.
- P. Zhang, G. D. Zhou, H. B. Gong, H. Y. Xu, D. Nakamura, T. Okada, H. B. Zeng and B. Q. Cao, Sci. Adv. Mater., 2012, 4, 455–462 CrossRef CAS PubMed
.
- R. P. Doherty, Y. Sun, Y. Sun, J. L. Warren, N. A. Fox, D. Cherns and M. N. R. Ashfold, Appl. Phys. A: Mater. Sci. Process., 2007, 89, 49–55 CrossRef CAS
.
- C. V. Varanasi, K. D. Leedy, D. H. Tomich, G. Subramanyam and D. C. Look, Nanotechnology, 2009, 20, 385706 CrossRef CAS PubMed
.
- L. C. Tien, S. J. Pearton, D. P. Norton and F. Ren, J. Mater. Sci., 2008, 43, 6925–6932 CrossRef CAS PubMed
.
- Z. W. Liu, C. K. Ong, T. Yu and Z. X. Shen, Appl. Phys. Lett., 2006, 88, 053110 CrossRef PubMed
.
- Y. Sun, G. M. Fuge and M. N. R. Ashfold, Chem. Phys. Lett., 2004, 396, 21–26 CrossRef CAS PubMed
.
- Y. Sun, R. P. Doherty, J. L. Warren and M. N. R. Ashfold, Chem. Phys. Lett., 2007, 447, 257–262 CrossRef CAS PubMed
.
- D. Zhao, X. X. Zhang, H. B. Dong, L. J. Yang, Q. S. Zeng, J. Z. Li, L. Cai, X. Zhang, P. S. Luan and Q. Zhang, Nanoscale, 2013, 5, 4443–4448 RSC
.
- H. P. He, Q. A. Yang, C. Liu, L. W. Sun and Z. Z. Ye, J. Phys. Chem. C, 2011, 115, 58–64 CAS
.
- Y. Sun, G. M. Fuge, N. A. Fox, D. J. Riley and M. N. R. Ashfold, Adv. Mater., 2005, 17, 2477–2481 CrossRef CAS
.
- Y. Sun and M. N. R. Ashfold, Nanotechnology, 2007, 18, 245701 CrossRef
.
- H. Zeng, G. Duan, Y. Li, S. Yang, X. Xu and W. Cai, Adv. Funct. Mater., 2010, 20, 561–572 CrossRef CAS
.
- D. H. Zhang, Z. Y. Xue and Q. P. Wang, J. Phys. D: Appl. Phys., 2002, 35, 2837–2840 CrossRef CAS
.
- J. F. Muth, R. M. Kolbas, A. K. Sharma, S. Oktyabrsky and J. Narayan, J. Appl. Phys., 1999, 85, 7884 CrossRef CAS PubMed
.
- I. Hussain, N. Bano, S. Hussain, Y. Soomro, O. Nur and M. Willander, Materials, 2011, 4, 1260–1270 CrossRef CAS PubMed
.
- D. Zhao, C. Zhang, X. X. Zhang, L. Cai, X. Zhang, P. S. Luan, Q. Zhang, M. Tu, Y. C. Wang, W. Y. Zhou, Z. Y. Li and S. S. Xie, Nanoscale, 2014, 6, 483–491 RSC
.
- A. Gupta, M. Omari and N. Kouklin, J. Appl. Phys., 2008, 103, 124312 CrossRef PubMed
.
- X.-B. Chen, J. Huso, J. L. Morrison and L. Bergman, J. Appl. Phys., 2007, 102, 116105 CrossRef PubMed
.
- X. Liu, X. H. Wu, H. Cao and R. P. H. Chang, J. Appl. Phys., 2005, 95, 3141 CrossRef PubMed
.
- Y. Sun, N. G. Ndifor-Angwafor, D. J. Riley and M. N. R. Ashfold, Chem. Phys. Lett., 2006, 431, 352–357 CrossRef CAS PubMed
.
- H. Noei, H. Qiu, Y. Wang, E. Löffler, C. Wöll and M. Muhler, Phys. Chem. Chem. Phys., 2008, 10, 7092–7097 RSC
.
- K. Morishige, S. Kittaka, T. Moriyasu and T. Morimoto, J. Chem. Soc., Faraday Trans. 1, 1980, 76, 738–745 RSC
.
Footnote |
| † Electronic supplementary information (ESI) available: XRD patterns, diameter distribution, the dynamic IUV response of the TC nanorods to 20% O2 + 80% N2 at 240 °C, 150 °C and 100 °C, and PL spectra of TA, TB and TC samples in 20% O2 + 80% N2 and 100% O2 over a temperature range of from RT to 240 °C. See DOI: 10.1039/c4tc02924k |
| This journal is © The Royal Society of Chemistry 2015 |

